
Abstract
Injuries and hidden dangers in training have a greater impact on athletes ’careers. In particular, the brain function that controls the motor function area has a greater impact on the athlete ’s competitive ability. Based on this, it is necessary to adopt scientific methods to recognize brain functions. In this paper, we study the structure of motor brain-computer and improve it based on traditional methods. Moreover, supported by machine learning and SVM technology, this study uses a DSP filter to convert the preprocessed EEG signal X into a time series, and adjusts the distance between the time series to classify the data. In order to solve the inconsistency of DSP algorithms, a multi-layer joint learning framework based on logistic regression model is proposed, and a brain-machine interface system of sports based on machine learning and SVM is constructed. In addition, this study designed a control experiment to improve the performance of the method proposed by this study. The research results show that the method in this paper has a certain practical effect and can be applied to sports.
Introduction
Brain-Computer Interfaces (BCI) refers to establishing a direct communication and control channel between the brain and the outside world. It does not depend on peripheral nerves and muscles, and directly communicates between the human brain and other devices [1]. The basic principle is that when a person performs thinking activities, receives external stimuli, and performs limb movements or motor imagination, they all cause specific changes in EEG signals. Through appropriate detection methods, these changes can always be detected, and then through pattern recognition of the signal, the state of thinking can be resolved or converted into control instructions. At this stage, there are many diseases including cerebral palsy, amyotrophic lateral sclerosis, etc., which will damage the nerve and muscle pathways between the human brain and the external environment to varying degrees and cause patients to partially or completely lose their autonomous muscle control ability [2]. Through the measurement and pattern recognition of EEG signals, the BCI system attempts to establish a new communication and control channel to transfer information and commands between the brain and the outside world, which will become the gospel of this type of patient. Secondly, BCI provides people with a completely new way of human-computer interaction without manual operation. Therefore, it can also be used to control external devices in various special environments, such as military, industrial, and even entertainment. BCI related research will greatly deepen human understanding of the cognitive model of the brain, expand the ability of the human brain to communicate with the outside world, and trigger a new revolution in interaction methods.
The signal acquisition link is to directly collect the potential changes at the scalp, and after the amplification, filtering, and analog-to-digital conversion, save the digital signal to the computer. The quality of the signal collected in this link is directly related to the performance of the entire system, so noise and interference should be reduced as much as possible during signal collection. Moreover, the signal processing link analyzes and processes the collected signals and transforms them into thinking state marks. This process usually includes: Signal preprocessing: It includes processing some of the interference noise in the signal, removing the baseline drift, selecting the frequency band of interest, etc.; Feature extraction: It refers to extracting the features that best reflect the thinking state from the signal and reducing the data dimension, which greatly reduces the amount of calculation; Pattern classification. Generally, classifiers are trained from sample features of known categories. After that, the classifier is used to estimate the category of the new test sample [4]. The signal processing link is the core part of the system. The device control link is to generate control instructions according to the label of the current thinking state given by the classifier.
The brain-computer signals of sports athletes can effectively control the intensity of sports training. BCI technology directly establishes a communication channel between the brain and the surrounding environment, and extracts the neural activity information of the brain and converts it into commands to drive external devices without relying on the peripheral nervous system and muscle tissue. Therefore, it can also help athletes improve recovery after injury.
Related work
The brain-computer interface technology started in the 1870s, and the concept was first proposed by the University of California, Los Angeles in an attempt to evaluate the availability of brain signals [5]. Before the first International BCI Conference in 1999, there were no more than 6 teams studying BCI worldwide. However, with the holding of the four BCI international conferences and the holding of four BCI international competitions between 2001 and 2008, BCI has attracted widespread attention [6], At present, there are more than 100 organizations studying BCI worldwide. Its research content mainly includes: (1) According to the EEG signal acquisition method, it is divided into invasive and non-invasive types [7]. The invasive method needs to place the electrode inside the brain of the subject, and the signal obtained is more accurate. However, surgery has certain risks, so there is not much research on this. At this stage, most of the research uses the non-invasive method. (2) According to the different signal generation mechanisms, it is divided into spontaneous and induced [8]. The lowest frequency component of EEG is a kind of slow cortical potential, which is a kind of spontaneous EEG, which can reflect the excitement of the cortex. The subjects can learn to control the slow cortical potential through training to control the slow movement of objects [9]. Another kind of spontaneous EEG is the change of μ and β rhythm detected in the sensorimotor cortex area during limb motor imagination, which can usually be used to identify the subject’s motor imagination intention [10]. Since spontaneous EEG does not require external stimulation devices, it is most consistent with the original intention of the brain-computer interface. Among the evoked EEGs, the most studied are visual evoked potentials and event-related potentials [11], P300 [12]. The visual evoked potential is the brain’s response to visual stimuli. For example, when a subject looks at a color block that flashes at a certain frequency on the screen, the visual cortex will be able to detect that the EEG signal is modulated by this frequency, and the tracking point of the subject can be tracked accordingly. P300 appears about 300 ms after the event stimulus, and can be used to analyze the time-domain characteristics such as the latency and waveform amplitude of endogenous evoked potential. The evoked EEG reflects the response of the cerebral cortex to stimuli, and generally does not require a complicated training process, but this method usually requires the subject to be mentally focused, without external interference, and the impact of the subject’s fatigue needs to be considered more. Various types of EEG signals are not absolutely good or bad, and should be determined according to specific research problems. The main tasks of some more influential research institutions in the world are as follows: (1) The literature [13] proposed the concept of Event-Related Desynchronization (ERD), and the literature [14] proposed the concept of Event-Related Synchronization (ERS). These two concepts have now become the physiological basis for generally accepted and used research on motor imaging EEG, and the agency has also provided motor imaging EEG data for international brain-computer interface competitions. In addition, the agency also incorporated virtual reality technology in BCI research to enable subjects to walk in a virtual environment. (2) The literature [15] studied EEG signals prepared before motion to assist car braking and improve safety. In addition, they also developed a typing system Hex-o-spell using motor imaging encephalograms, and used two imagination states to control the rotation and extension of arrows respectively, and selected target letters in two levels.
(3) The literature [16] studied visual evoked potentials, developed a telephone dialing system, and realized the use of motor imaging brain signals to control robot dogs to play football. At this stage, the research on BCI is still in the laboratory stage. The main reasons are as follows: the recognition rate of the system and the information transmission rate are both low, the signal processing algorithm needs to be continuously improved, and the experimental paradigm needs to be innovative to meet the requirements of normal communication. Secondly, there are relatively few EEG signal modes available. The four commonly used signal modes require either evoked devices (P300 and visual evoked potentials), or low recognition rates and low transmission efficiency (slow cortical potentials and rhythm signals). In the future, exploring new brain signal patterns or achieving the fusion of multiple signal patterns is a very promising direction. The realization of BCI is still a difficult problem, which requires the system to process continuous EEG signals and always judge whether the brain is now in “working state” or “idle state” [17]. In addition, the application field of BCI is relatively narrow, and now it is mostly used in games or toys, etc. On the one hand, it is because the BCI technology is not enough for medical, military and other important occasions. On the other hand, the relevant departments need to formulate unified standards in terms of safety and system evaluation.
Inconsistent proof of DSP algorithm
In terms of MRP spatial filtering, DSP is very effective, but DSP spatial filtering has not been well integrated with subsequent feature extraction and classification. First, the DSP spatial filtering is to adjust the distance between each pair of time series. After filtering, the DSP uses the mean value of the time series as the classification feature instead of selecting the distance between the sequences as the classification feature. However, in fact, the two are not numerically equivalent. Furthermore, in the DSP algorithm, DSP chooses support vector machine (SVM) as the classifier [18]. The principle of SVM optimization is to find a hyperplane, so that the data can be classified after being mapped to this hyperplane. However, the principle of DSP spatial filtering is to classify data by adjusting the distance between sequences. Therefore, the optimization of DSP spatial filtering and DSP classification is not based on the same goal, which means that the filtering and classification in the DSP algorithm are inconsistent.The following will give a detailed proof of these two inconsistencies [19]:
After the pre-processed EEG signal X is converted into a time series using a DSP filter, the distance A
ij
(the square of the Euclidean distance) between a pair of time series X
i
and X
j
can be obtained.
Then, the distance B
ij
between the mean of time series X
i
and the mean of time series X
j
is recalculated.
When
Since the original DSP algorithm uses SVM as a classifier to classify the M1 core, the principle of SVM is briefly described first.
The vector s is the feature to be classified, and vector y is the label vector. The problem of convex quadratic optimization of SVM classification can be expressed as [20]:
Among them, H is the regularization parameter, m is the sample, ζ is the slack variable, a is the weight vector, and b is the deviation term. The discriminant function of SVM is:
In order to provide a simple visual explanation, Figure a only shows the MRP features of electrodes c2 and C3 120 ms before the finger hits the keyboard, and feature 1 and feature 2 in Figure b refer to the mean of the corresponding time series obtained after filtering by two DSP spatial filters. It can be seen by comparing Fig. 1 (a) and Fig. 1 (b) that linear SVM and DSP filtering are optimized according to different goals. The goal of SVM is to map the input space to a high-dimensional space through nonlinear transformation, and then find an optimal linear interface in this space, so that the minimum distance between the two point sets to the interface is the largest, and the distance between the edge points of the two point sets to the plane is the largest. However, DSP filtering is to separate different types of data points by adjusting the distance between time series. Therefore, the spatial filtering of DSP and the classification of DSP are inconsistent.

Scatter plot of DSP filtering (a) and SVM (b).
In order to solve the inconsistency of DSP algorithms, inspired by a multi-layer perceptron (MLP), a multi-layer joint learning framework based on logistic regression model is proposed. Similar to the feed-forward structure of MLP, the joint framework is a three-layer framework that integrates spatial filtering, feature extraction, and classification, and they are combined under a regularized empirical risk minimization problem. In the first layer, the input multi-channel EEG signal matrix is spatially filtered and converted into a time series. In the second layer, unlike the average value of DSP to time series as a feature, the framework directly calculates the distance between time series as a classification feature. In the third layer, the framework uses a logistic regression model as a classifier to classify the features of the second layer. In the joint framework, the spatial filter and the classifier are jointly optimized using the gradient descent under the same objective function. Since the gradient descent method is more sensitive to the initial value, in order to provide a better initial value for the frame, the spatial filter of the DSP is adopted as the initial spatial filter in the frame. In addition, for different data sets, the regularization parameters of the time window and frame are selected through cross-validation.
The innovation of this joint framework lies in two points: In terms of feature extraction, unlike DSP, this framework directly calculates the distance between spatially filtered time series as classification features, which ensures the consistency of feature extraction and spatial filtering. In terms of classification, in the framework, spatial filtering, feature extraction and classification are combined under an optimization problem that minimizes empirical risk, and the three are jointly optimized instead of independently optimized like DSP. This joint optimization method ensures the consistency of classification and spatial filtering, and ensures that a set of optimal parameters that are most suitable for the framework can be automatically found during gradient descent optimization.
The mathematical description of the joint framework is as follows:
First, a DSP spatial filter w is used as the initial spatial filter of the joint framework, the pre-processed EEG signal X is spatially filtered and converted into a time series x, and the distance between the time series is calculated:
Among them, X i ∈ RC×T, and f ij is the distance between the time series X i and X j . Then, the eigenvector f i : f i = [fi1, fi2, ⋯ , f in , fi(n+1)] ∈ Rn+1 of the i-th sample can be calculated, where fi(n+1) is the deviation term.
Then, the logistic regression model is selected as the classifier. Moreover, we set the regression parameter to v ∈ Rn+1. By entering the Sigmoid function U (z) = 1/(1 + exp | - z|) into the classifier, the predicted value of the sample can be obtained:
Among them, P is the probability that the feature f belongs to category 1 after classification. The label of the category to which the signal x belongs can be predicted by the classified probability value:
Next, the logical loss function of the logistic regression model is calculated:
Among them, P (y|f, v) = p
y
(1 - p) 1-y, p ∈ [0, 1] , y ∈ [0, 1] , is the label of signal x. Then, according to the maximum likelihood estimation, the objective function of the joint classification framework is estimated by calculating the average value of the smallest logical loss function:
Among them, y = [y1, y2, ⋯ , y
n
]
T
∈ R
n
is the label vector of the data set, and p = [p1, p2, ⋯ , p
n
]
T
∈ R
n
. Due to the high dimension of classification features and the limited number of samples in the data set, the classification framework may face the risk of overfitting. Therefore, this chapter introduces regularization constraints of two norms to control the complexity of the framework and improve the generalization ability of the framework. Therefore, the objective function of the joint framework can be rewritten as:
Among them, β is the regularization parameter of the joint framework, which has a great influence on the classification effect of MRP. Then, according to the chain rule, the partial derivative of J with respect to v is calculated:
The partial derivative of p
i
with respect to V is calculated:
Therefore, formula (10) can be rewritten as:
Similar to the partial derivative of J with respect to v, the partial derivative of J with respect to w can be calculated:
The partial derivative of p
i
with respect to f
i
is calculated:
Therefore, formula (13) can be rewritten as:
Among them,
The above gradient descent method is implemented by the quasi-Newton BFGS algorithm in MATLAB’s optimization toolbox.
The computational complexity of the entire framework is:
Among them, L is the number of iterations, N r is the number of candidate regularization parameters, N f is the multiple of cross-validation, and N T is the candidate time window counter. 0 [N r × N f × N T × (n2 + n + C)] g comes from the computational complexity of feature extraction for all candidate time windows, candidate regularization parameters and all samples, and the computational complexity of J for partial derivatives of v and w.0 (n2 + n + C)g comes from the computational complexity of calculating v and w with the optimal time window and regularization parameters.
In view of the above-mentioned shortcomings of CSP, a joint prediction framework for ERD / ERS feature extraction and classification is proposed. The framework extracts the non-linear correlation between the EEG signals of each electrode of the sample as a classification feature, and uses the linear ridge regression (LRR) model as the classifier. In this framework, we use the Gaussian kernel function to convert the nonlinear correlation of the EEG signal between each electrode into an exponential form of Euclidean distance to measure. In addition, we decompose the EEG signal into corresponding components according to different frequency bands and different time windows. Moreover, each component has a different Gaussian kernel radius, and the weight of each component in constructing Euclidean distance and classification features is controlled by the Gaussian kernel radius. Finally, the obtained classification features are added to the LRR model. Similar to the feed-forward structure of MLP, the joint framework is a three-layer framework that integrates signal pre-processing, feature extraction, and classification, and the three-layer structure is linked to optimize under the same objective function. After obtaining the error of the Leave-One-Out Cross Validation by gradient descent, we can automatically select the optimal time window, frequency band, and constraint parameters of the LRR model.
The innovation of this joint framework lies in two points: In terms of feature extraction, when the CSP extracts the linear correlation between the electrodes as a feature, only the second-order statistics are included, which may miss information in the higher-order statistics that is helpful to distinguish different types of motion. Therefore, in order to overcome this shortcoming, we use Gaussian kernel function to introduce statistics of each order, and use the nonlinear spatial correlation between each electrode as the classification feature of ERD. In terms of classification, we combine signal preprocessing, feature extraction and classification under an optimization problem that minimizes empirical risk, and jointly optimize the three instead of optimizing the three separately like the CSP algorithm. This joint optimization method can automatically select the optimal time window, frequency band and constraint parameters of the LRR model.
The mathematical description of the framework is as follows:
We assume that the EEG signal of each electrode is mapped to Hilbert space by a nonlinear mapping function φ. In Hilbertt space, the inner product of the EEG signal vector of electrode i and electrode j can be calculated by a kernel function without knowing φ : 〈 φ (x i ) , φ (x j ) 〉 = k (x i , x j ) explicitly. Since the classification effect of the EEG signal depends largely on the parameter selection in the preprocessing process, this situation cannot achieve adaptive search for the optimal parameter.
gmoidal, Gaussian, Polynomial and Splinekemels are common kernel functions used in different scenarios. In this paper, we rewrite the Gaussian (Gaussian) kernel function to measure the nonlinear correlation k (x
i
, x
j
) between electrode i and electrode j.
Among them, the vector
It can be seen from the formula that the polynomial contains all orders of
After adding the feature matrix F to the LRR model, the LRR-based joint classification framework proposed in this study can be expressed as:
Among them, α ∈ R
d
is the linear mapping of the LRR model, y ∈ R
d
is the label vector, λ ⩾ 0 is the regularization parameter, and
After θ and λ are given, the solution of formula (20) can be obtained:
Among them, I is d × d identity matrix.
In this framework, the parameters g and m are determined by leave-one-out (LOO) cross-validation (CV). The LOO error is an approximate unbiased estimate of the generalization error. Usually, LOO error is used for model selection. The proposed closed-loop leave-one-out cross-validation method significantly reduces the computational complexity of corresponding classification algorithms such as LRR and KFDA. Therefore, LOO error is often used as an optimization criterion in some current studies. In our framework, we directly calculate the derivative of LOO error corresponding to θ and λ, and then update θ and λ by gradient descent.
The LOO error of the closed-loop form can be expressed as:
Among them, r ∈ R
n
is the residual vector, H is the hat matrix,
Then, according to the chain rule, the partial derivative of J to θk,m can be expressed as:
Among them, the partial derivative of r to θk,m can be expressed as:
Among them, ⊗ is the dot product symbol. After setting
Among them, the partial derivative of C-1 to θk,m is:
For feature extraction, the partial derivative of
After setting
The derivative of LOO error with θ can be obtained. Calculate the partial derivative of H to:
Through the chain rule, we can find the partial derivative of J to θk,m, and we can use the same method to get the partial derivative of J to λ.
Generally speaking, a typical BCI system should include signal acquisition, signal processing, and equipment control, as shown in Fig. 1.
The signal acquisition link is to directly collect the potential changes at the scalp, and after the amplification, filtering, and analog-to-digital conversion, save the digital signal to the computer. The quality of the signal collected in this link is directly related to the performance of the entire system, and noise and interference should be reduced as much as possible during signal collection. The signal processing link analyzes and processes the collected signals and converts them into thinking state marks. This process usually includes: Signal preprocessing: It includes processing some of the interference noise in the signal, removing the baseline drift, selecting the frequency band of interest; Feature extraction: That is, the features that best reflect the state of mind are extracted from the signal, and the data dimension is reduced, which greatly reduces the amount of calculation.
The EEG signal processing system should include the following basic functional modules: (1) Raw EEG signals acquisition module: Through this module, the user can obtain the EEG data to be analyzed and processed, and can obtain some basic information of the data, such as the number of leads and sampling frequency. (2) Signal pre-processing module: In this module, the signal should undergo certain anti-aliasing processing to remove the signal components that are not related to the classification to a certain extent, and the signal is filtered to the frequency band most relevant to the classification. (3) Signal feature extraction and classification module: In this module, the input signal is a continuous multi-lead EEG signal time series. After feature extraction and classification, the label sequence of the motor imagination state is finally generated. (4) Result display and storage module: This module can display real-time motor imaging EEG signal classification results, and can save the results for future analysis. In summary, the overall implementation of the system is shown in Fig. 3.
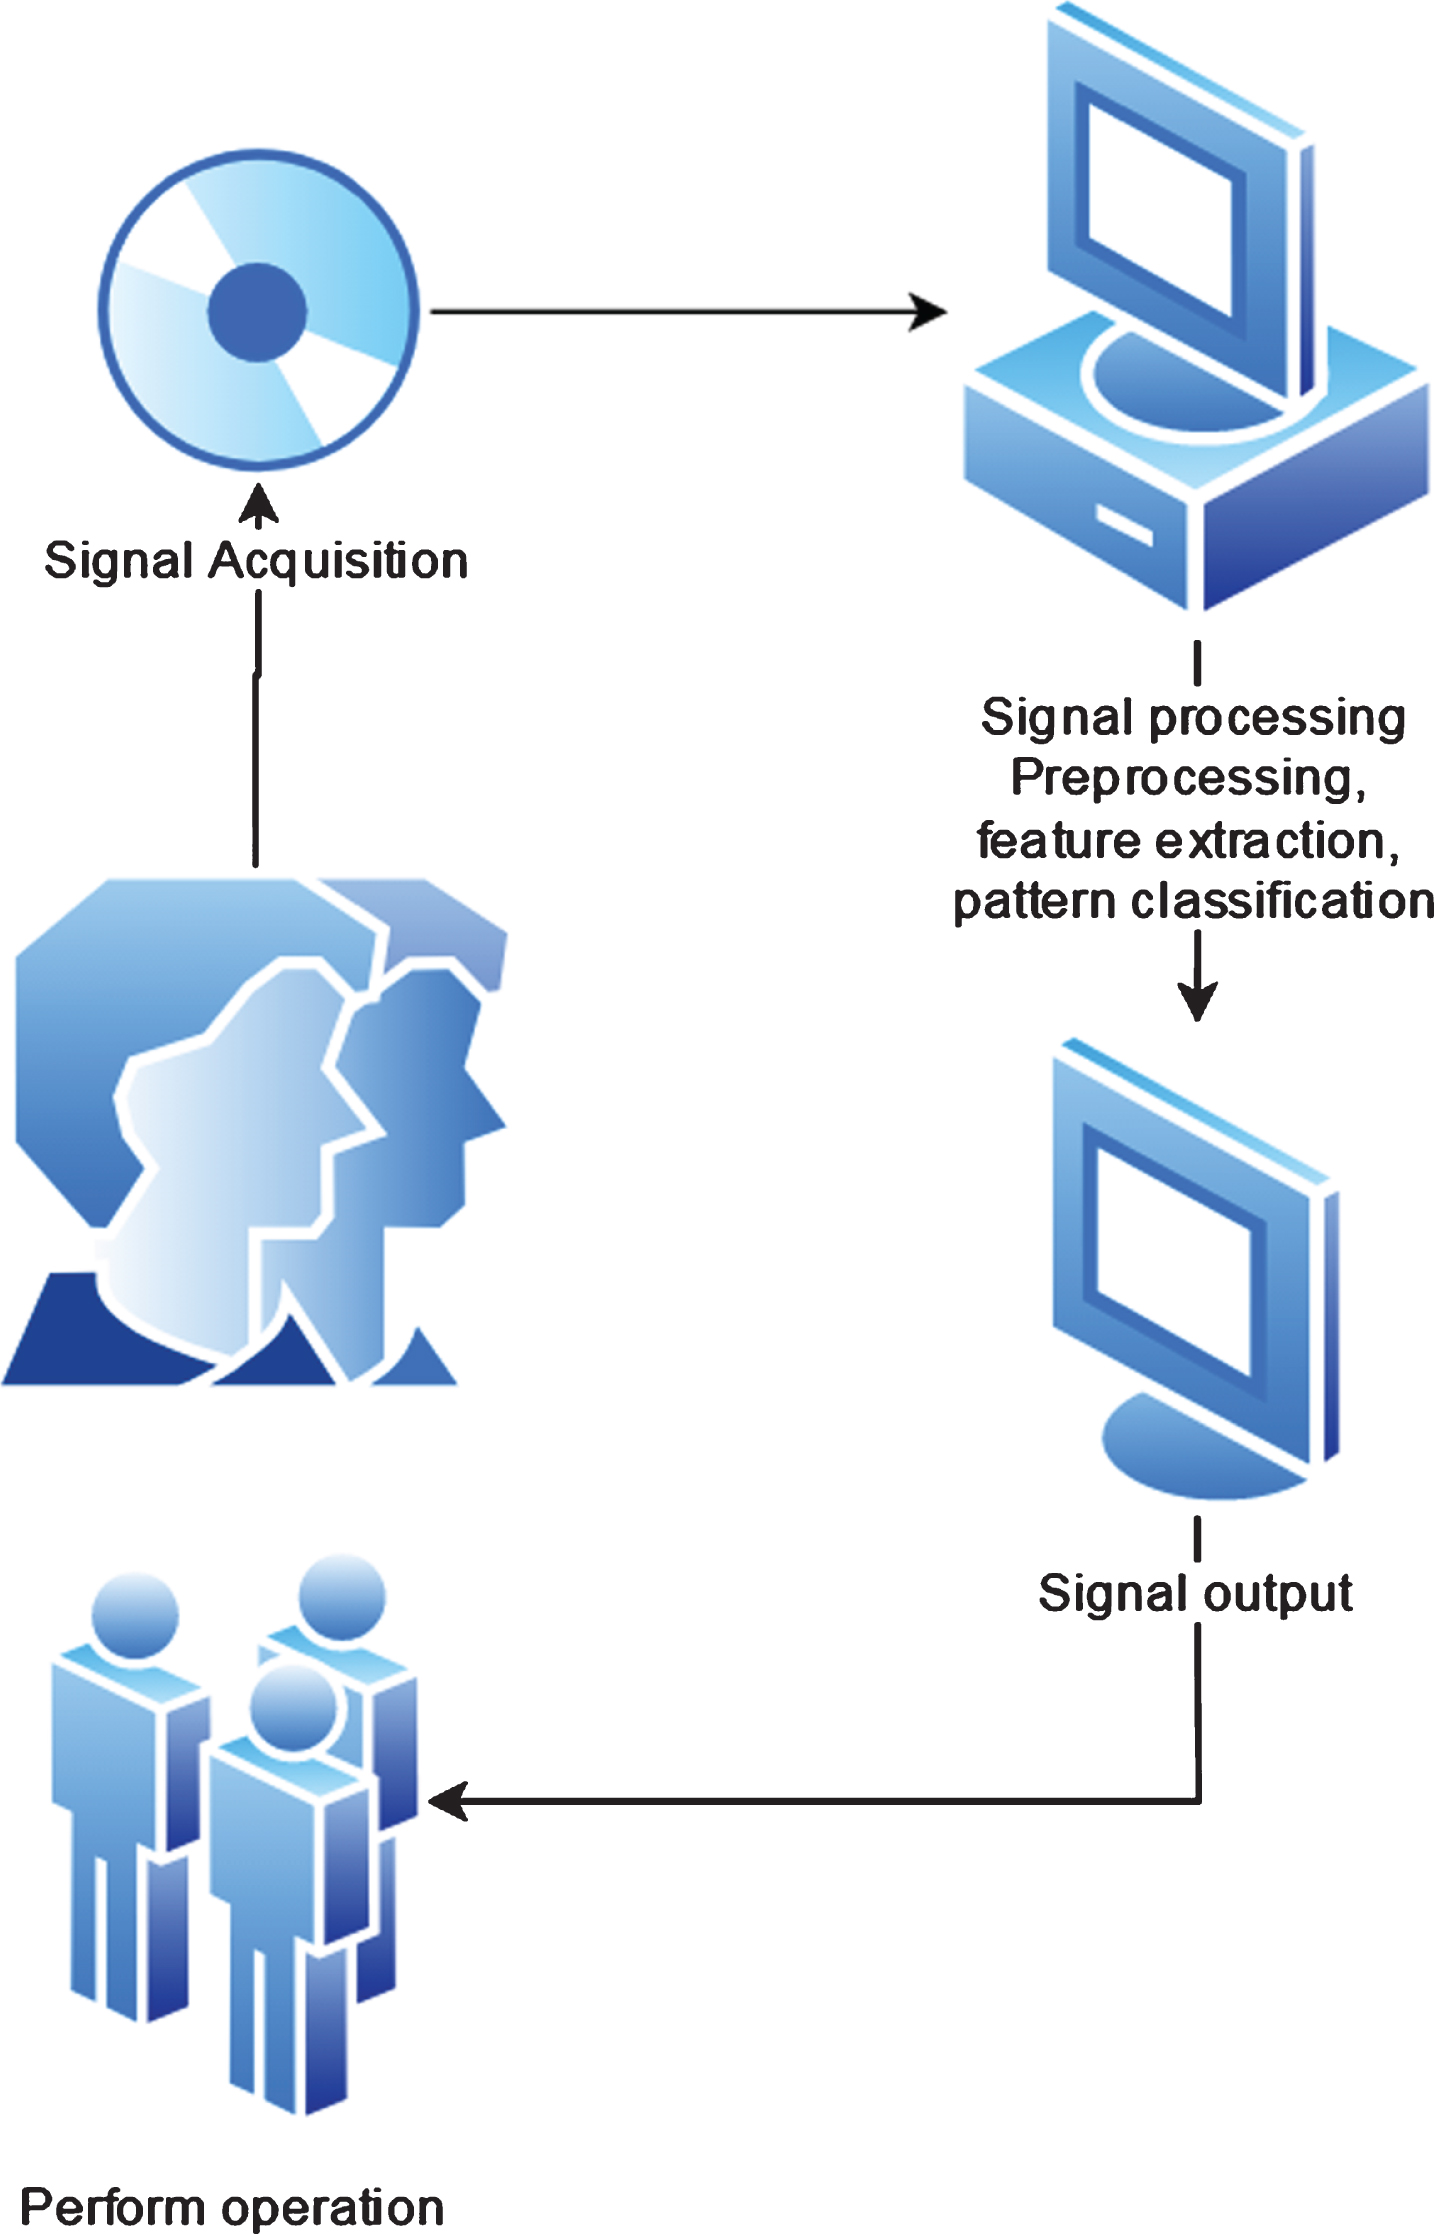
Brain-computer interface system framework.
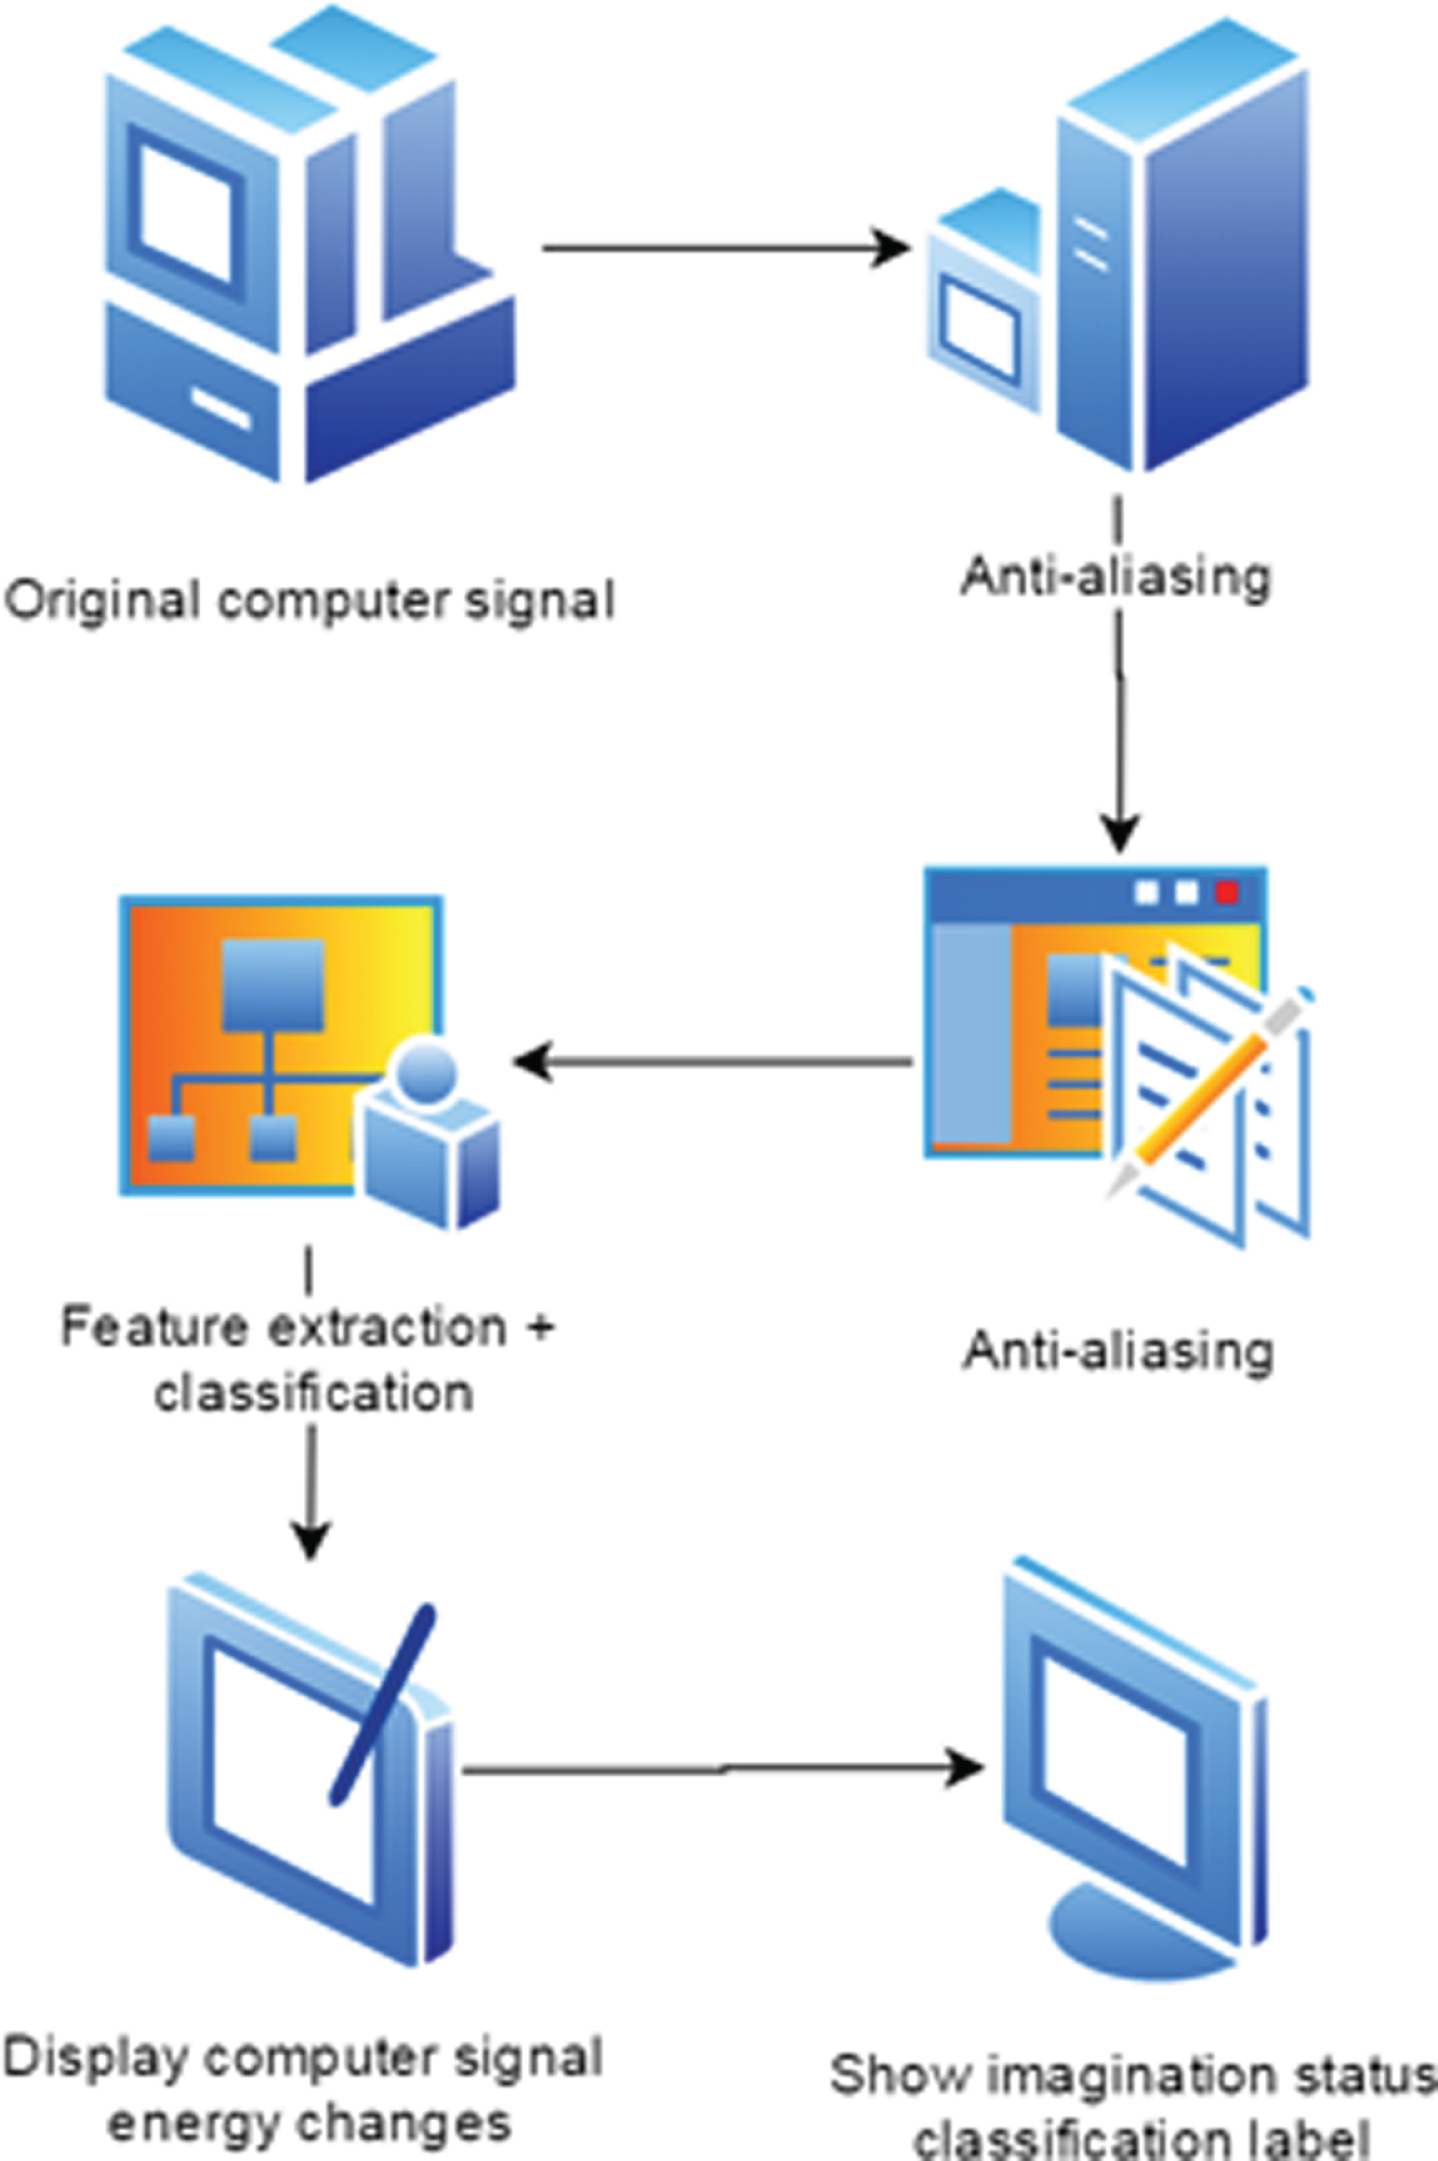
Overall implementation scheme of EEG signal processing system.
The signal feature extraction and classification process converts multi-lead EEG signals into motor imagination state labels, which realizes the analysis from EEG signals to thinking states and is the most critical part of the system. In this link, the CSP method is used for feature extraction, and the parameters of the classifier are updated online. At the beginning of the processing, the sliding time window of length L and step size is taken to intercept continuous signal samples, and the projection matrix and classifier trained by the known training sample set are used to extract and classify the sample sequence. At regular intervals (300 * step), the signal sample sequence in the past 300 * step time from the known training sample set is used to update the classifier using the semi-supervised learning method in Chapter 4 to classify the next period, as shown in Fig. 4.
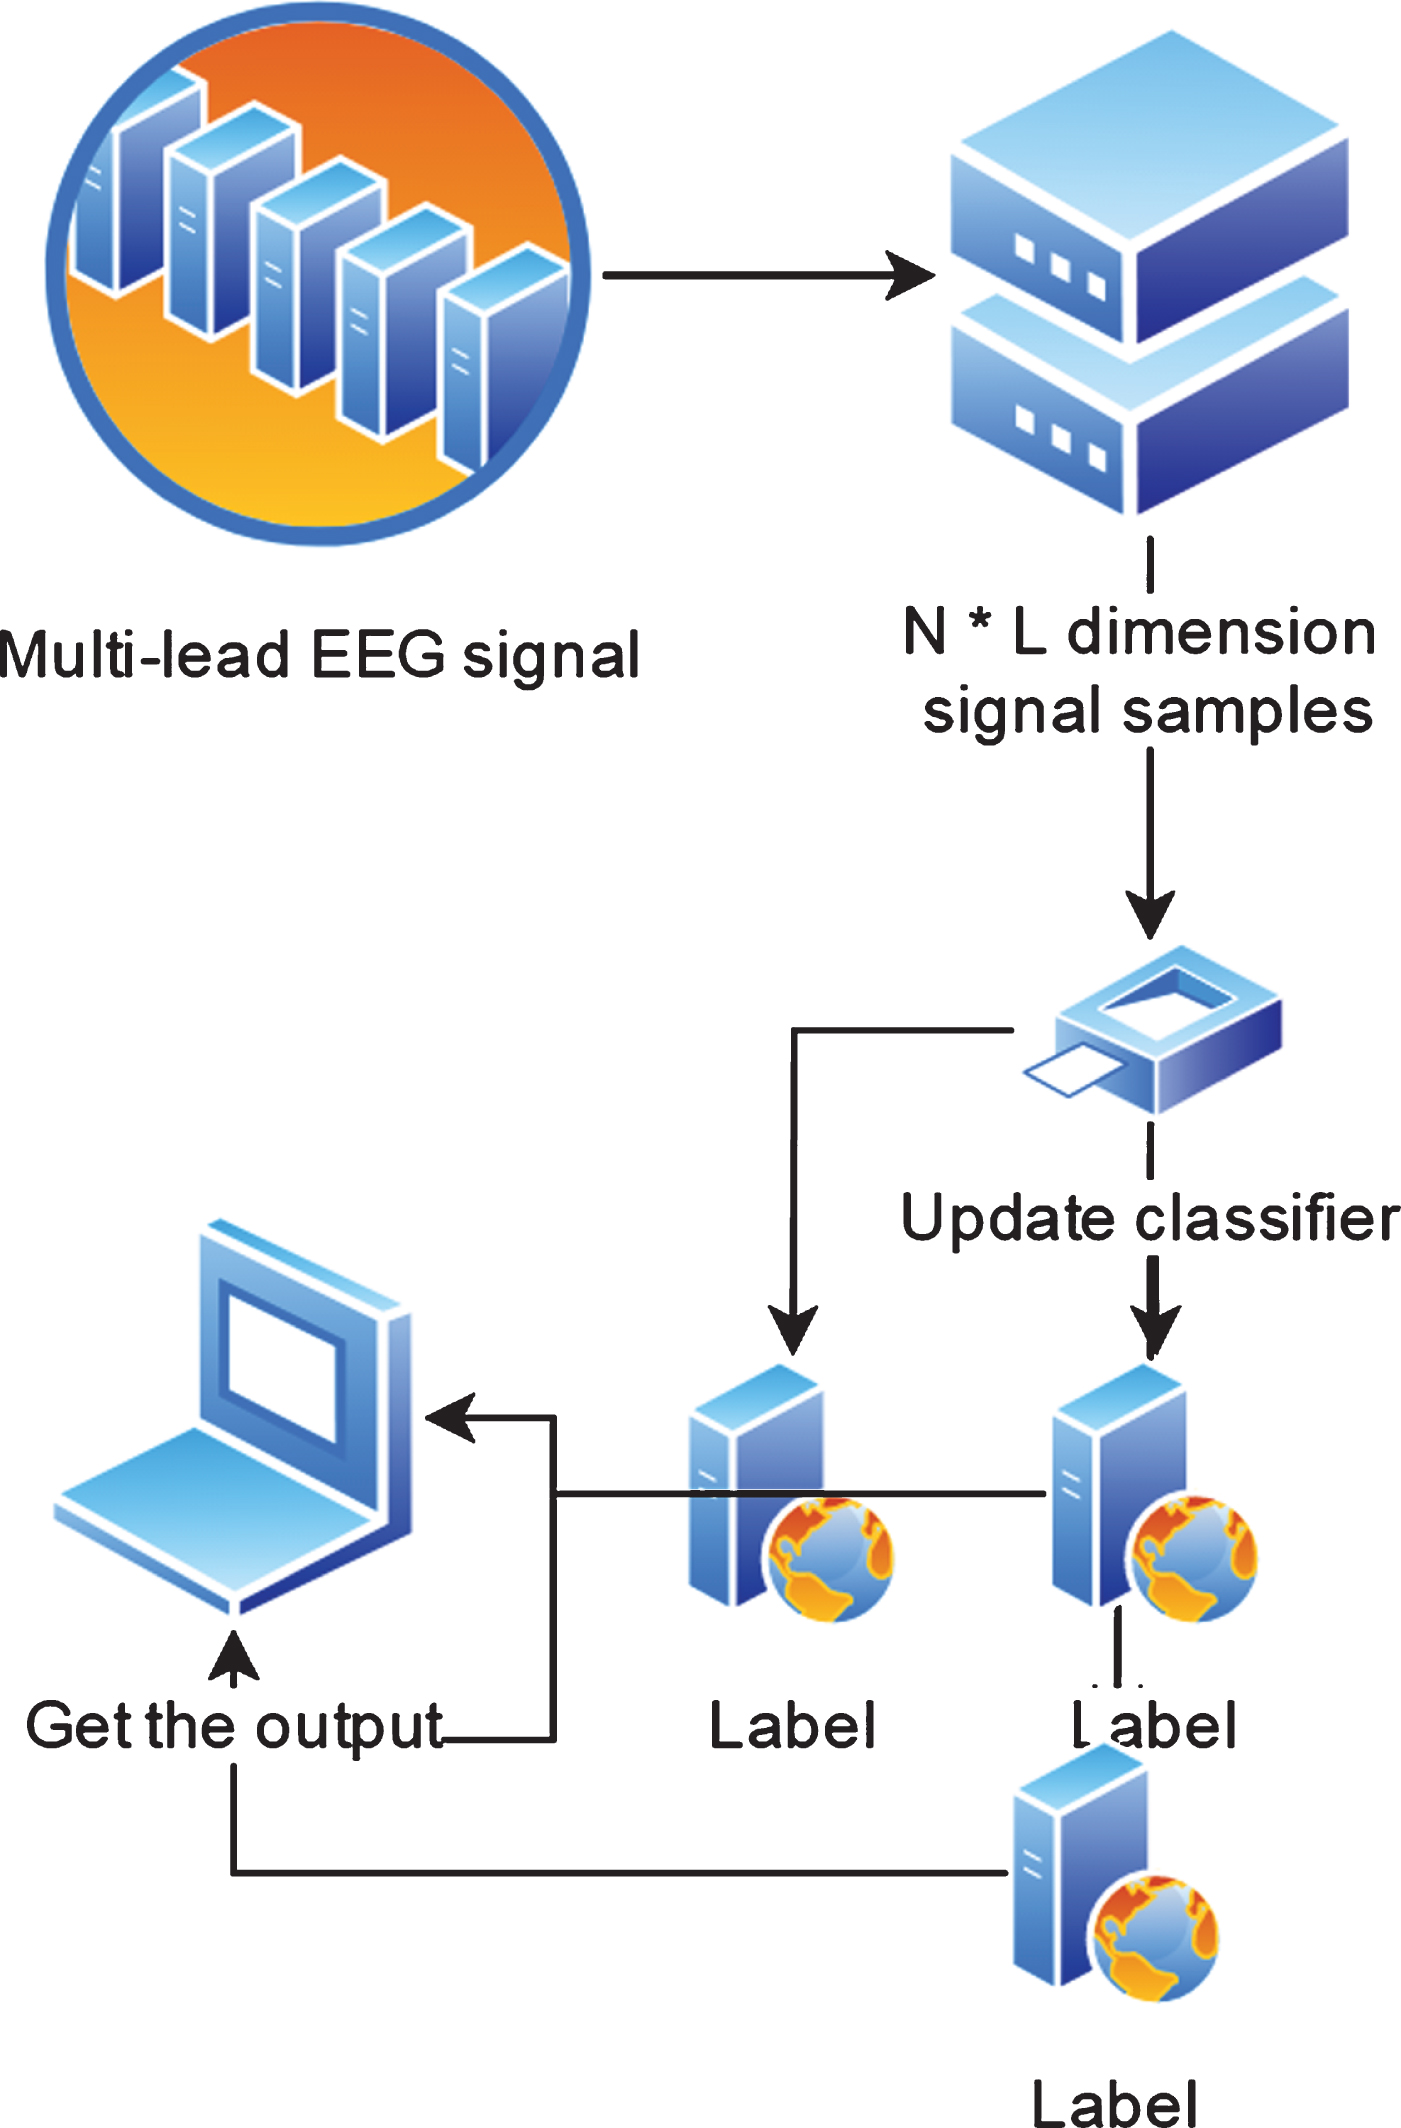
Schematic diagram of the signal processing process of feature extraction and classification.
The system is used to test the data of the participants a and b in the BCI Competition IV-Data sets 1 data set. This data does not contain electrooculogram artifacts, so no anti-aliasing process is performed. In the band-pass filtering process, an 8-order, 8 30 Hz band-pass filter is used. In an asynchronous situation, different L and step values are selected, and the detection rate, false alarm rate and classification correct rate of left- and right-hand movement imagination are counted. The results are shown in Table 1 and Figures and Fig. 6.
Test results of EEG-Processing system

Statistical graph of tester A’s test results.
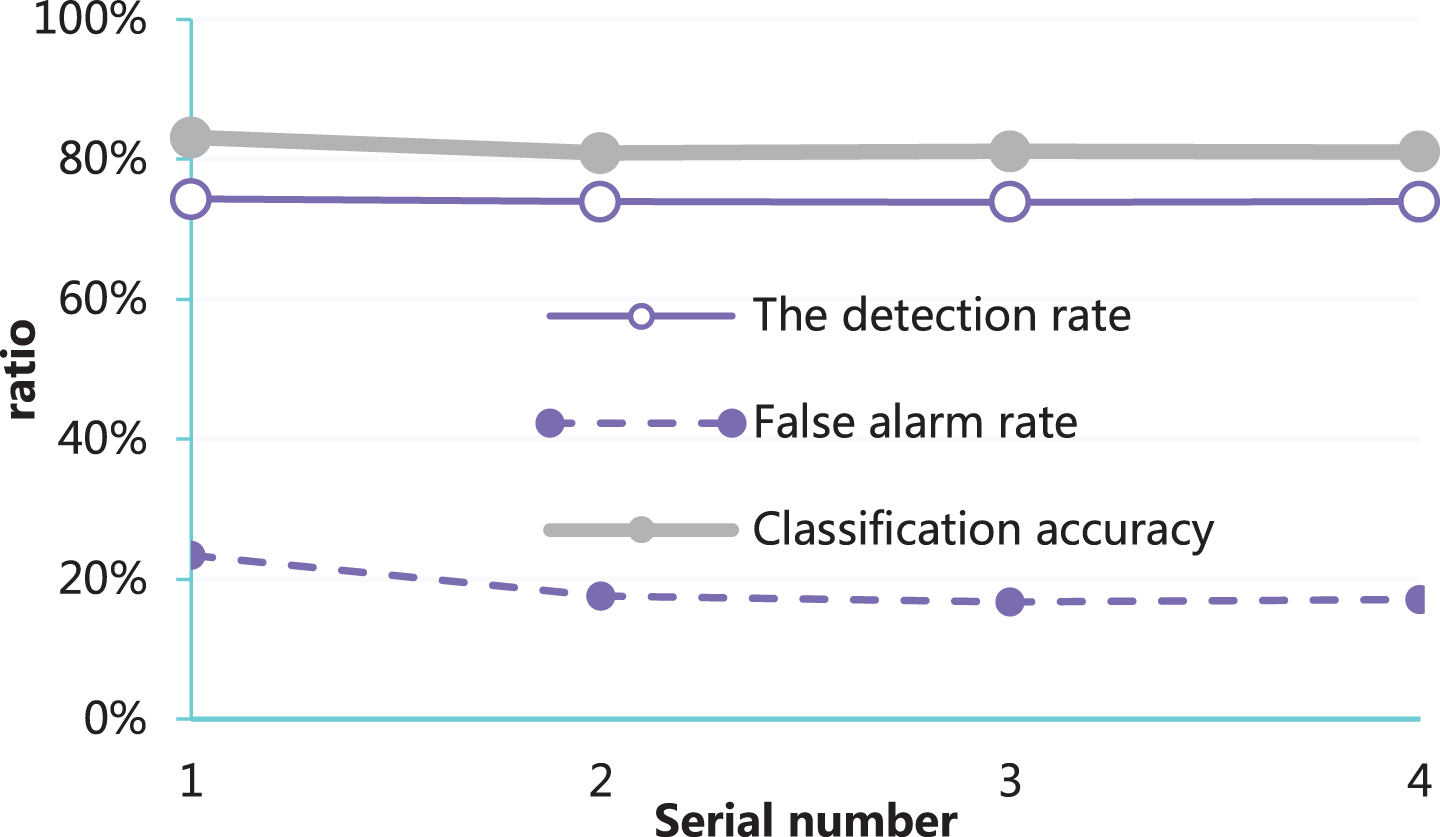
Statistical diagram of tester B’s test results.
From the results in the above chart, it can be seen that the system’s performance on the data of the same subject is relatively stable, while the data of different subjects has a certain difference in processing results, which is caused by the differences between different subjects. On the basis of the above analysis, the performance of this research method is studied through comparative analysis. The traditional motor brain-computer interface is compared with the improved method in this study. The traditional motor brain-computer interface is named TSCI, and the method of this study is named Pro-TSCI. The test is taken 75 times and 100 sets of data are identified each time. The results obtained are shown in Table 2 and Fig. 7.

Statistical diagram of test results of improved algorithm recognition accuracy.
It can be seen from Fig. 7 and Table 2 that the traditional motor brain-computer interface performs generally in the recognition of athletes’ EEG characteristics, and the test accuracy rate is between 60% and 80%. However, the accuracy rate of the improved motor brain-computer interface proposed by this paper is above 90%, which has a certain practical effect and can be applied to sports.
Statistical table of test results of improved algorithm recognition accuracy
Aiming at the current sports athletes’ training and rehabilitation needs, based on the requirements of the practical brain-computer interface system and motor imaging EEG signals, this paper has completed the following work from the perspective of the algorithm: The main artifact component in the EEG signal, that is, the electro-oculogram artifact is automatically identified and removed; feature extraction and classification of motor imaging EEG signals, including classification in synchronous and asynchronous situations; online update of the brain-computer interface system classifier. Finally, the work is summarized to design the EEG signal processing system EEG-Processing, which realizes the automatic analysis from the original EEG signal to the state of motor imagination. Because the EEG signals are complex and changeable, and the non-stationarity is prominent, if the classification model is determined to no longer update the parameters, the classification performance may become very poor. Inspired by the idea of semi-supervised learning for signal classification in the case of a small number of training samples, this study cleverly uses a small number of training samples and real-time generated EEG signals to update the classifier parameters for the next period of EEG signal classification. By comparing two sets of data, it is found that this method can improve the performance of the classifier to a certain extent.