
Abstract
At present, the traditional sports teaching model has been unable to meet the needs of modern diversified talents. Based on the actual needs of physical education, this article reforms traditional physical education methods, proposes a university physical education model based on virtual crowd simulation and digital media, and builds a corresponding system. Moreover, this paper uses feature identification to monitor classroom teaching and counts multiple parameters to assist the effective teaching activities. In model tracking, the DMS motion trajectory is obtained, and then the center points of all grid sequences are calculated to generate a center point matrix. Considering the difference in motion between adjacent frames of DMS, the difference is quantified by the significance value, so that the sequence of adjacent frames with small differences is organized into clusters. In addition, this paper builds a computer system model based on actual needs and evaluates model performance through actual teaching. The research results show that the proposed model has good performance.
Introduction
With the continuous development of artificial intelligence technology, the university sports teaching model also needs to undergo certain changes. The application of artificial intelligence to physical education is also the future development trend of physical education in universities. Therefore, it is necessary to improve the traditional sports teaching to improve it [1].
Sports is not only a powerful tool for physical fitness, but also has important significance that cannot be ignored in terms of enhancing physical fitness, improving mental health and shaping will quality. Under the background of the “Healthy China” era, the improvement of health has been gradually placed on the priority of development. The concept of lifelong sports has gradually penetrated into the hearts of the people, which has increased people’s attention and demand for sports. However, from the lack of sports to the formation of the concept of lifelong sports is not necessarily achieved overnight, it is a long and tortuous development process. From the perspective of social needs, the development of society has long been separated from simple repetitive labor and relies on the cultivation of talents and the improvement of technological innovation capabilities [2]. In fact, the competition in society is ultimately due to the competition of talents. Talents are not only the backbone of society, but also an important subject of technological innovation. Therefore, focusing on the cultivation of talents is the key to promoting social progress and transformation and enhancing its overall competitiveness. The so-called talents should not only focus on their knowledge reserves and scientific and technological innovation capabilities but should also regard their personal development in all aspects and at multiple levels as a measure of survival of the fittest. The so-called all-round, in simple terms, is the comprehensive development of moral, intellectual, physical, and aesthetic. Under the previous test-oriented education system, the cultivation of knowledge and ability has been highly valued, and it has been developed relatively well in the continuous educational reform process [3].
Related work
The literature [4] proposed local deformation of joint-related OLD). This method creates a local joint operator for the human skeleton, drives the local joint motion to cause local deformation of the mesh skin, and generates a deformation by linear mixing of skin vertices and multiple associated bones. This method is also often referred to as skeleton subspace deformation or Linear Blending Skinning (LBS) deformation. However, this algorithm usually shows the phenomenon of skin collapse and knotting caused by the radial rotation of large-angle joints (referred to as the “coated sugar” effect). The literature [5] addressed the shortcomings of the LBS algorithm by adding more accessory facets near the joints to make the skin deformation much smoother. The literature [6] introduced a Gaussian radial basis function and combined shape interpolation to make the skin deformation area near the bone joints smoother. The literature [7] made the original large-angle joint rotation process relatively smooth by embedding auxiliary joints, which effectively improves the skin collapse and knotting phenomenon caused by large-angle joint rotation. However, it increases the computational complexity, and the manual adjustment of the skeleton joints is too complicated and unrealistic. The literature [8] extracted the model skeleton based on the principle of Reeb graph segmentation and used the height function as a continuous function to divide the model evenly into sub-connected sets of multiple intervals. Moreover, it used skeleton points to fit Bezier curves to constrain the model vertices in the sub-connected set and realized the local skin deformation animation of the model controlled by multiple skeleton points. This partial skin deformation animation of the model realized by interactively dragging the skeleton control points has strong flexibility. The literature [9] converted the rotation interpolation parameters of bone mixing from ordinary Euler angles or rotation matrices to quaternions or spherical interpolation of even quaternions, which improves the phenomenon of skin collapse caused by large-angle joint rotation. However, the deformation effect of this method at the junction of limbs (such as the shoulder) is still not ideal. Aiming at the common distortion problem of skeleton-driven mesh skin deformation at the joint junction, the literature [10] first extracted the linear skeleton of the model by distance transformation, and then constructed a rigid constrained frame of the differential domain in the local area near the skeleton joint, which realized the effective deformation of the mesh skin at the joint junction, and corrected the skin deformation distortion phenomenon under large joint motion.
Since people’s understanding of the human body’s own motion system and physiological functions is still immature, it is not realistic to achieve a very realistic isomorphic simulation based on the internal structure of the human motion system. So far, animation researchers have simplified modeling of human models. They viewed the internal structure of the human body as a tree-like skeleton structure connected by joints and replaced the external structure of the human body with the mesh skin to the real human skin to obtain a simple and easy-to-control virtual human model. For models containing complex internal structures such as muscles, brains, hearts, and lungs, they are generally used in the field of medical research [11]. These relatively complex human structures are first individually modeled finely in the field of medical research, and then subjected to animation simulation. In the field of computer animation, virtual humans are presented in digital form, and based on the movement of skeleton joints, the animation is synthesized by controlling the movement of the skeleton. Motion control is a key factor that affects the animation fidelity of virtual humans. Different control methods will have a greater impact on the animation effect. There are four main methods of virtual human motion control [12]: forward kinematics, inverse kinematics, motion capture technology, and biomechanics-based methods. The forward kinematics method is to know the joint motion information of the animation in advance or artificially set the joint motion information, and then calculate the position of the final joint to obtain the motion posture. The inverse kinematics method is a method of inversely determining the rotational freedom of the joint through the final joint position and obtaining the animation pose [13]. The solution process of inverse kinematics is generally more complicated than that of forward kinematics. The solutions of inverse kinematics mainly include analytical mechanics and numerical methods. Among them, the analytical mechanics method is only applicable to joint chains with less degrees of freedom. However, the numerical method can solve the motion of a multi-layer tree joint chain with many degrees of freedom and difficulty. Introducing motion capture data into virtual human animation is the most promising animation implementation method in recent years. It uses optical or electromagnetic animation and other animation capture systems to capture realistic human motion, and through motion redirection, it can achieve the same model joint animation as the real human body [14]. The literature [15] redirects the captured data to virtual human actions and can adapt to the virtual human motion in different terrains. However, the captured motion data has certain requirements on the model’s topology and body ratio and is also related to the model’s initial pose. Motion redirection technology [16] is a new technology that emerges with the production of motion capture technology. Through motion redirection, we can make full use of the motion database captured in advance, so that the driven model characters can generate actions consistent with the collected real motion data. However, in order to reuse these motion data and adapt them to different character models, it is generally necessary to edit the motion data [17], which can realize more colorful animations. The method based on biomechanics is currently the most difficult method of motion control. It is used to control multi-level models constructed based on anatomical principles. Moreover, it adopts a mechanical way to realize the animation of the coordinated movement of multiple layers of physiological tissues such as muscles, bones, and skin of the virtual human. In addition, the animation driven by this method must strictly follow the laws of physical motion, and the generation of motion is based on the principle of real human biological response. Therefore, it can produce very realistic virtual human animation [19]. The literature [25] addresses the various problems in the field of vehicle communication with the suggestion of a mutual unified and dispersed spectrum sensing model. The application of the mutual cognitive paradigm minimizes conflict and multiple unknown problems. The literature [26] discusses the problem of vast volumes of big data and introduces the SmartBuddy idea of an adaptive and smart world incorporating human activity and human dynamics. The literature [27] talks about the development in parallel reconfigurable computing systems of a directed acyclic graph for video coding algorithms for motion estimation. Partitioning algorithm also plays a major role in speeding up the production of images. The article [28] deals with leveraging IoT and BigData Analytics in real-time applications using the Hadoop platform. The above-mentioned processes enable the deployment of an IoT-based Smart City. The article [29] centers on IoT and its major part in sophisticating the human practices and endeavors [30]. This paper moreover managed with the collection of different information from different assets that are associated to the web [31].
Improved K-means-like frame clustering algorithm
The K-means algorithm is widely used in clustering algorithms. At first, the traditional K-means clustering algorithm is improved in this article. First, this paper obtains the trajectory of the DMS, and then this paper calculates the center points of all grid sequences to generate a center point matrix. The specific algorithm is described as follows. In this paper, the corresponding coordinate trajectory matrix (V1, V2, ⋯ , V
F
) , i ∈ [1, F] is generated from the input grid sequence M = (M1, M2, ⋯ , M
F
), among them, F is the number of frames of the grid sequence, and V
i
is defined as [20]:
This article sets
This article converts it to a 3 × F trajectory matrix
Then, in this paper, the curvature value of the space curve can be calculated through the change of the curvature equation.
It can be seen from Equation (4) that this paper needs to calculate the first and second derivatives of the center point in the x, y, and x directions. In this paper, finite differences are used to find the first and second derivatives of the displacement vector [20].
Then, the algorithm is used to calculate the derivative of each three-dimensional discrete point. The central difference method is applied to each vertex in the x, y, and z directions. This paper uses the vertices of frame i - 1 and frame i + 1.
A mediator in the X, Y, and Z directions can be obtained by the following formula [21]:
The two mediators in the X, Y, and Z directions can be obtained by the following formula:
Among them, C (i, j) represents the j-th element in the i-th row of the matrix c.
Through the above algorithm, the first and second derivatives of each center point in the x, y, and z directions are obtained. The derivative information is combined with the above curvature formula to obtain the curvature of the trajectory curve at each point. Finally, the frames are sorted according to their curvature values, and a set of frames corresponding to the maximum curvature value is selected as the key frame sequence, which is classified as the boundary of the critical cluster. Therefore, the frames contained in each cluster are continuous. This method can quickly and accurately obtain frame clustering results, and also ensure that grid frames of the same cluster show similar motion trends.
When constructing a virtual crowd in the previous article, the human body model uses a skeleton model, and its structure is shown in Fig. 1.
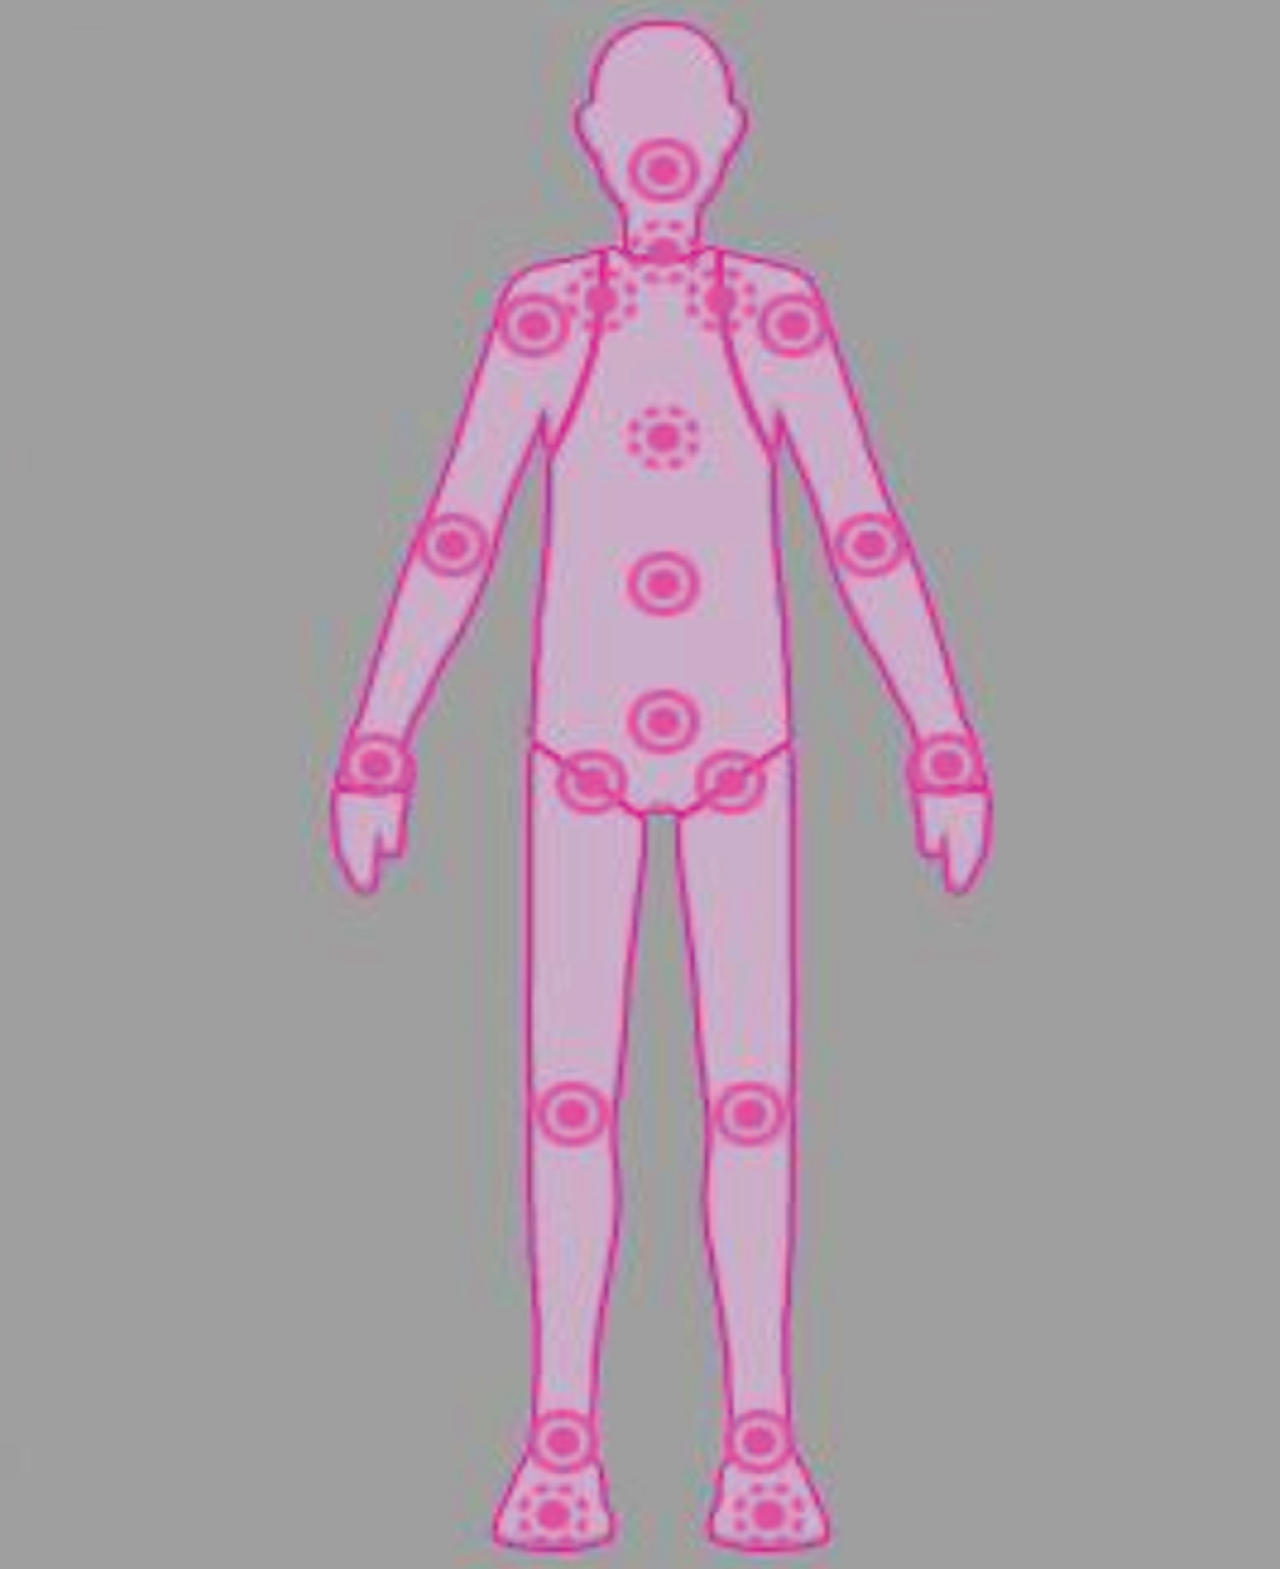
Skeletal structure.
The division of the classification boundary of the three-dimensional dynamic grid is mainly to obtain the vertex of the classification boundary. Here, this paper proposes a local motion similarity measurement method to complete the motion feature extraction of DMS classification boundaries, and set these feature points as boundary vertices. The specific calculation method is shown in formula (10), that is, the modulus dv (v) of the velocity difference between each vertex and the area where the adjacent vertex is located is calculated [22]:
Among them,
This paper defines a measure of the similarity between vertex V and clustering area C [23]:
Among them,
DMS is a grid with a topological structure. In this paper, the similarity measurement method is used to optimize the vertex categories of the topological relationship of clustering regions. Starting from any initial clustering region, a non-boundary vertex B i in the region is randomly selected, the cluster head C h of the region where the vertex is located is found, and the adjacent cluster head set {Ch1, ⋯ , C hn } of C h is determined according to the cluster head topology connection graph. After that, the similarity values of B i and C h , Ch1, ⋯ , C hn are calculated respectively, and B i is assigned to the clustering area corresponding to the maximum similarity value. The above process is repeated until all vertices in the area where B i is located are processed. Finally, according to the depth-first traversal of the topological connection graph, the categories of the vertices in each clustering area are optimized and adjusted.
Most of the existing visual saliency detection methods only consider the geometric features contained in the DMS model. However, for the DMS model, the main factor that affects the saliency is the movement state change in the time domain. Therefore, this paper establishes a DMS saliency model based on the change of motion state.
Based on the method of visual stimulation mechanism, the relationship between the degree of influence of the object’s motion state on human visual attention level is obtained. This relationship is quantified to establish a corresponding linear expression function for the significance value and time of each state, as shown in Table 1. Based on this function, this paper can finally construct a DMS saliency model based on motion state. k is a quantified metric used to scale significance values [24].
Significance value linear expression function
It can be seen that in order to obtain the DMS saliency value, it is necessary to first obtain its motion state, and obtain its final saliency value according to the above-mentioned saliency decay model. However, in order to obtain the saliency value of each vertex in real time, this paper takes the cluster head as the representative of the clustering area, and simplifies the problem to only need to calculate the saliency value of the cluster head in this area, thereby reducing the amount of calculation.
Regarding the problem of how to obtain the motion state of the cluster head, it is inaccurate to obtain the saliency value based only on the absolute motion change of the clustering area where the cluster head is located. To this end, in order to remove the impact of the overall movement of the DMS model on the saliency calculation, this paper first defines the relative movement speed
Among them, V is the set of all vertices, f is a frame of the animation sequence.
In order to accurately identify small changes in the object’s motion state, the algorithm uses different motion change thresholds T
change
and T
onset
to reflect the critical point of the object’s motion state change. Here, the drift rate of the eyes and the distance from the user to the dynamic model are used to calculate the corresponding T
onset
T change is set to 2 * T onset . It can be seen that 0 . 15° is the drift speed of the eyes, d user is the distance from the user to the model, and k wtoc is a constant used to convert the results of real and virtual scenes. T onset is the 3D velocity in model space, which corresponds to the retina velocity of 0 . 15°/s.
At this time, this article defines the motion state of the cluster head as a piecewise linear function of the relative velocity
When the DMS model undergoes a strong movement change, its significance will be more prominent. Therefore, when the movement start state or movement stop state changes suddenly, this paper corrects the significance value Saliency (v) according to the relative velocity of the cluster head, as shown in the formula:
Among them, rvmax is the highest relative speed of all cluster heads at the current moment, and S base is the reference significance value of all cluster heads.
In this paper, a similarity calculation method is used to measure the difference between DMS grid sequence frames. The algorithm can well reflect the linear correlation of two variables in mathematics, and the corresponding value range is between [- 1, 1]. The algorithm is the Pearson correlation algorithm. When the two variables are mathematically correlated, the value range tends to both ends of the value range. If the value range of the coefficient tends to a positive direction, it is a good indication that the two variables are mathematically positively related. If the value range of the coefficient tends to be negative, it is a good indication that these two variables exhibit a negative correlation in mathematics. Meanwhile, when the value is 0, it means that the two variables are not mathematically related. The calculation formula is as follows:
In this paper, the significance values of adjacent frames are assigned to X and Y, and the corresponding similarity value ρx,y can be obtained through calculation. By selecting the corresponding limit value
This paper proposes a collision avoidance model based on group effects. The partial avoidance method proposed in this paper is based on the assumption that the individual adjusts his route as early as possible and minimizes the amount of interaction with others. In the simulation of sports groups, the factors that influence individual decision-making can be expressed as shown in Fig. 2.

Diagram of factors affecting individual decision-making.
It can be seen from the above that the original grid sequence can be defined as M = (M1, M2, ⋯ , M
F
). Among them, M
i
, i ∈ [1, F] represents the matrix of 3 × N, which can be used to represent the coordinate matrix of each frame of DMS, which is expressed as follows:
After the above grid frame clustering algorithm, the original grid frame clustering result can be expressed as M = (C1, C2, ⋯ , C
K
) , K < F. Among them, C
K
(Mk1, Mk2, ⋯ , M
km
) , k ∈ [1, K] is all frame sequences of a certain type in the frame clustering result, and m is the number of frame sequences. Then, the initial grid frame sequence can be expressed as:
For the selection of key frames, the method used in this paper is to calculate the sum of the Euclidean distances of the geometric information of all the frames in each category in the three-dimensional space of the DMS, and sort these values from small to large. Among the sorting results, the frame with the smallest value in this paper is regarded as the key frame. That is, the expression of the key frame is (Vc1, Vc2, ⋯ , V
cK
). Among them, V
i
, i ∈ [1, F] is defined as the vertex coordinates of the 3 × N matrix. By calculating the difference between the key frames of a certain class and other frames in the class, the difference between all the frames in the class can be obtained as:
It can be seen from the above clustering results that the geometric information of all frames in the same class in the time domain is very similar, so it can be seen that most of the calculated differences of all frames in this class are close to zero. Therefore, in order to facilitate reconstruction, this paper defines the final difference matrix Diff _ mesh = (D1, D2, ⋯ , D
F
), among them:
Finally, the Diff _ mesh we get is a cell array with F matrices of dimension 3 × N, that is, cell (1, F). Among them, F is the number of frames. Therefore, it lays the foundation for the next space cutting algorithm, so that the compression rate of DMS can be effectively improved.
In this paper, we perform a space cutting algorithm on the key frame of a certain class (which is assumed to be K class) in the above clustering results, and finally obtain the corresponding number of blocks (which is assumed to be S blocks). The geometric information (vertex information) contained in each block must be very similar to ensure the accuracy of the number of divided blocks. The function can be expressed as:
Which represents the three-dimensional space coordinates of the J-th vertex of the F-th frame in the three-dimensional space of the DMS,
In this paper, all the three-dimensional coordinate vertices in the key frame obtained by DMS clustering are randomly divided into S blocks. Then the most suitable clustering center of each block in the key frame after DMS clustering needs to be obtained. This article assumes that the clustering center is
Because the core idea of partitioning is that the key frames obtained by clustering DMS in space are similar and topological.
The three-dimensional vertices of continuous space are divided into one piece, so the definition of the metric here only considers the Euclidean distance. In this paper, the S block in the key frame obtained by DMS clustering needs to be measured dc,j of the clustering center. According to the metric value dc,j, The metric dc,j of specific vertices
Then the central vertex in each class is recalculated to be obtained. This method takes the vertex closest to the center in each class as the new center vertex of the class.
In this paper, the metric value dc,j is regarded as a signal defined on the DMS grid, and its signal processing further improves the compression ratio of the DMS.
Based on the results of the algorithm proposed above, the trajectory matrix is constructed with new coordinates, and PCA dimensionality reduction is performed for each cluster.
After performing the above steps, the resulting grid sequence can be expressed as follows:
Among them, C k = {Mk1, Mk2, ⋯ , M Km k } , k ∈ [1, K] is a set of frame sequence, all frames contain this sequence, and the number is m k . In the following algorithm, C k is a corresponding example to describe the PCA trajectory dimensionality reduction method.
The first step: the correlation of the three-dimensional coordinates is removed.
The trajectories of all vertices of the DMS are separated in the xyz direction in three-dimensional space, and three new m × N vertex trajectory matrices are constructed. In its cluster seven, this article can express its coordinate trajectory through each column of data, that is:
At the same time, the center vertex matrix is as follows:
The above center point matrix is PCA decomposed to obtain a matrix U
k
of 3 × 3, which is used as a transformation matrix (V
k
f
) ′ = U
k
· V
k
f
. After performing coordinate transformation on all item points, the new vertex coordinate
The second step: the three-dimensional trajectory matrix is constructed and dimensionality reduction is performed by using PCA.
In this paper, PCA decomposition is performed on the x, y, and z trajectory matrix, and the obtained PCA coefficients are combined. This article uses
x
T
k
as an example to demonstrate the algorithm. According to formula t
a
= t1 + t2 + ⋯ + t
N
/N, the corresponding mean value t
a
is obtained for the movement trajectory of a vertex of DMS. In order to get a new DMS matrix
The relationship between the degree of crowding and the speed of movement and crowd density in physical education is relatively large. Therefore, we conduct comparative experiments to illustrate the effectiveness of the model. The first is to compare the effects before and after using the collision model. After using the collision model, the students’ movements are more regular and will not be crowded together. The settings are shown in Fig. 3.

Virtual simulation of sports student crowd movement.
Further, the running effects of Helbing and the model proposed in this paper are compared. Figure 4 shows the movement of the Helbing model. Its idea is to change the movement, not to avoid potential collisions. Therefore, the curvature of the planned path is relatively high, and the amount of unnecessary movement performed by the individual is large. The collision avoidance model can plan collisions in advance and avoid unnecessary detours.
Helbing model.
From the results, it can be seen that the model in this paper is effective. In the next step, we apply the collision model to the individual model. As shown in Fig. 5, it is the evacuation effect after adding the model. During the evacuation of the group, there is no crowding together, and a certain distance is maintained. When the density of the surrounding groups is relatively large during the evacuation process, the next route can be adjusted at any time, effectively avoiding the collision between individuals.
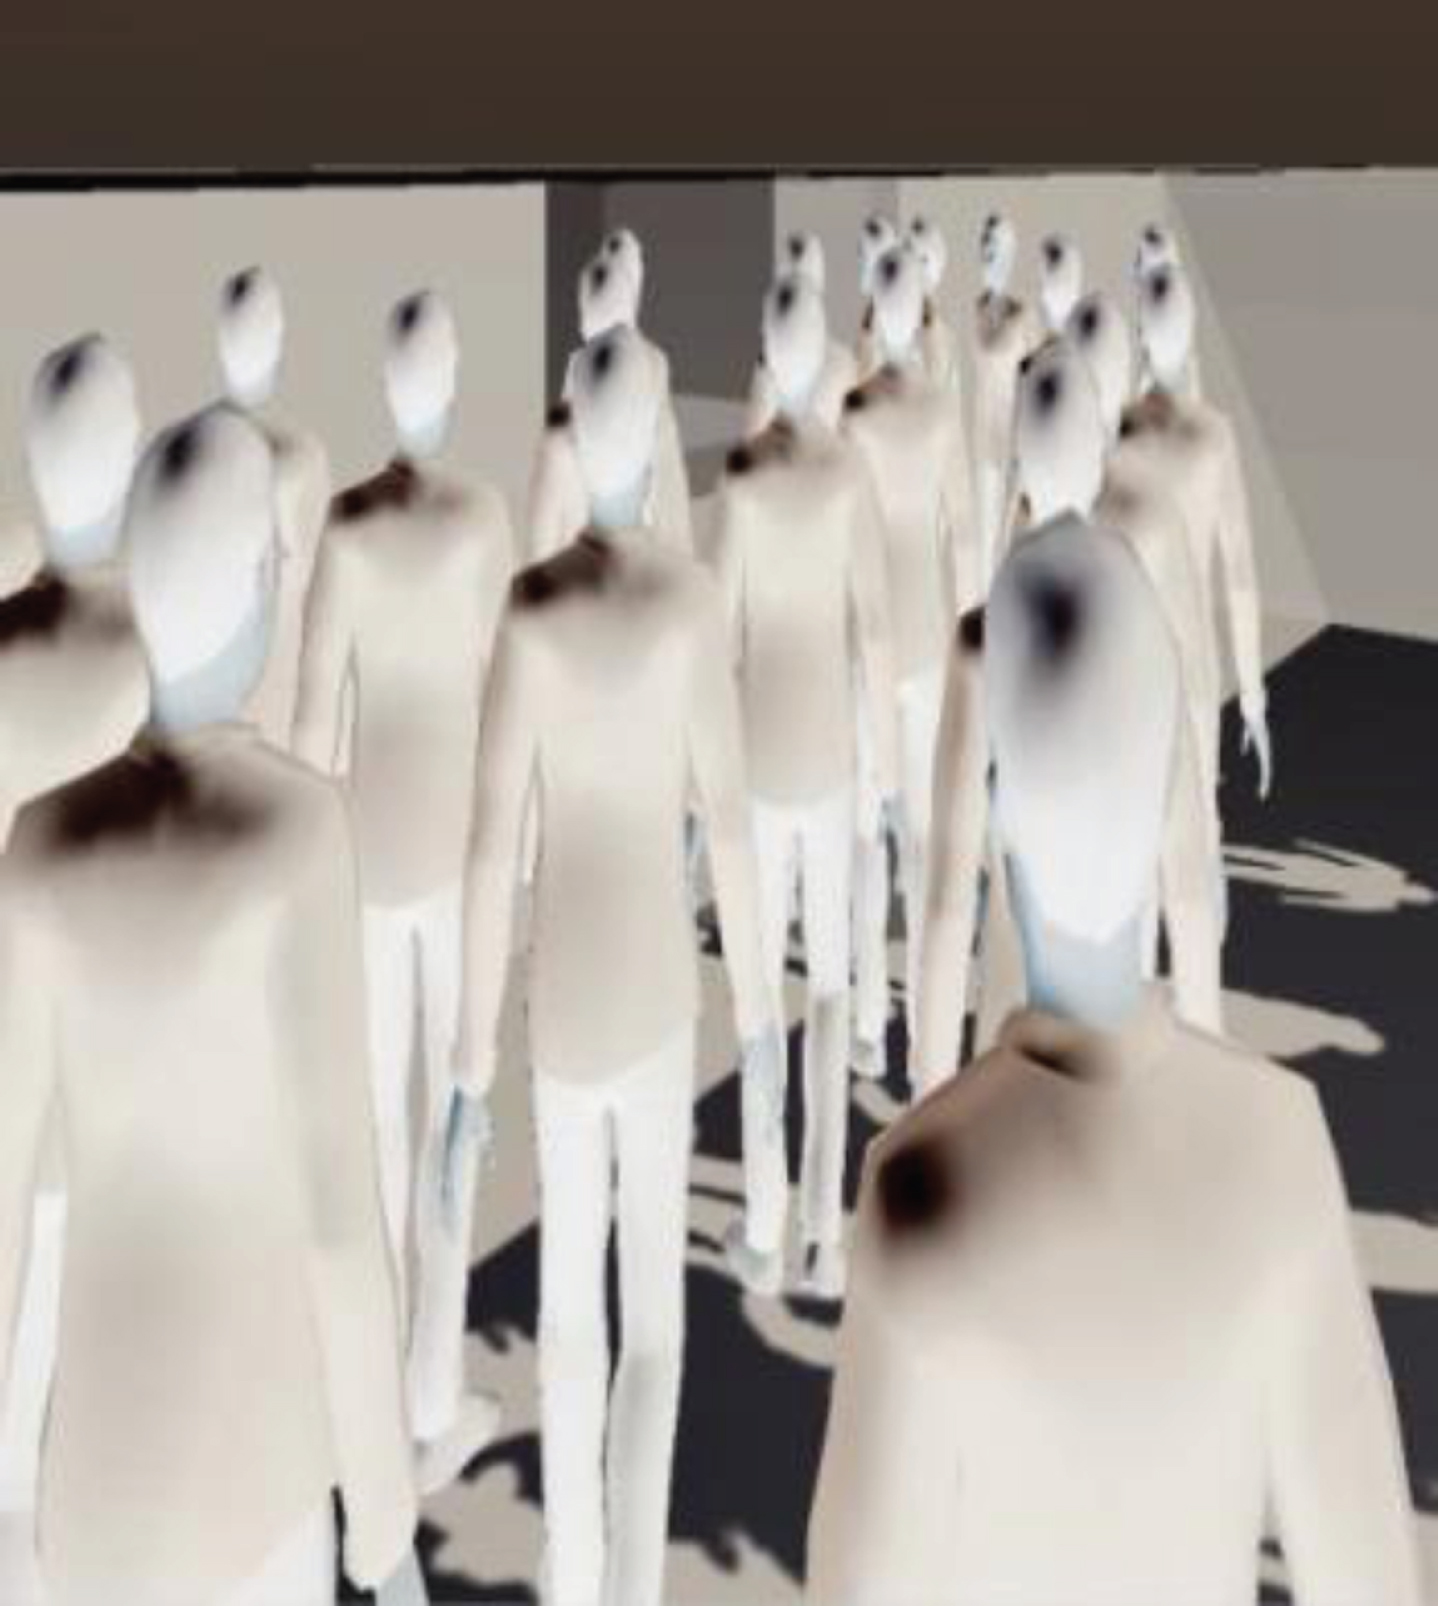
Sports student population after adding individual skeleton models.
On the basis of the above analysis, sports scenes are added. This article takes tennis courts as an example, analyzes the distribution of students in the venue, and presents them in the form of virtual simulation to provide reference for actual teaching. The results obtained are shown in Fig. 6.
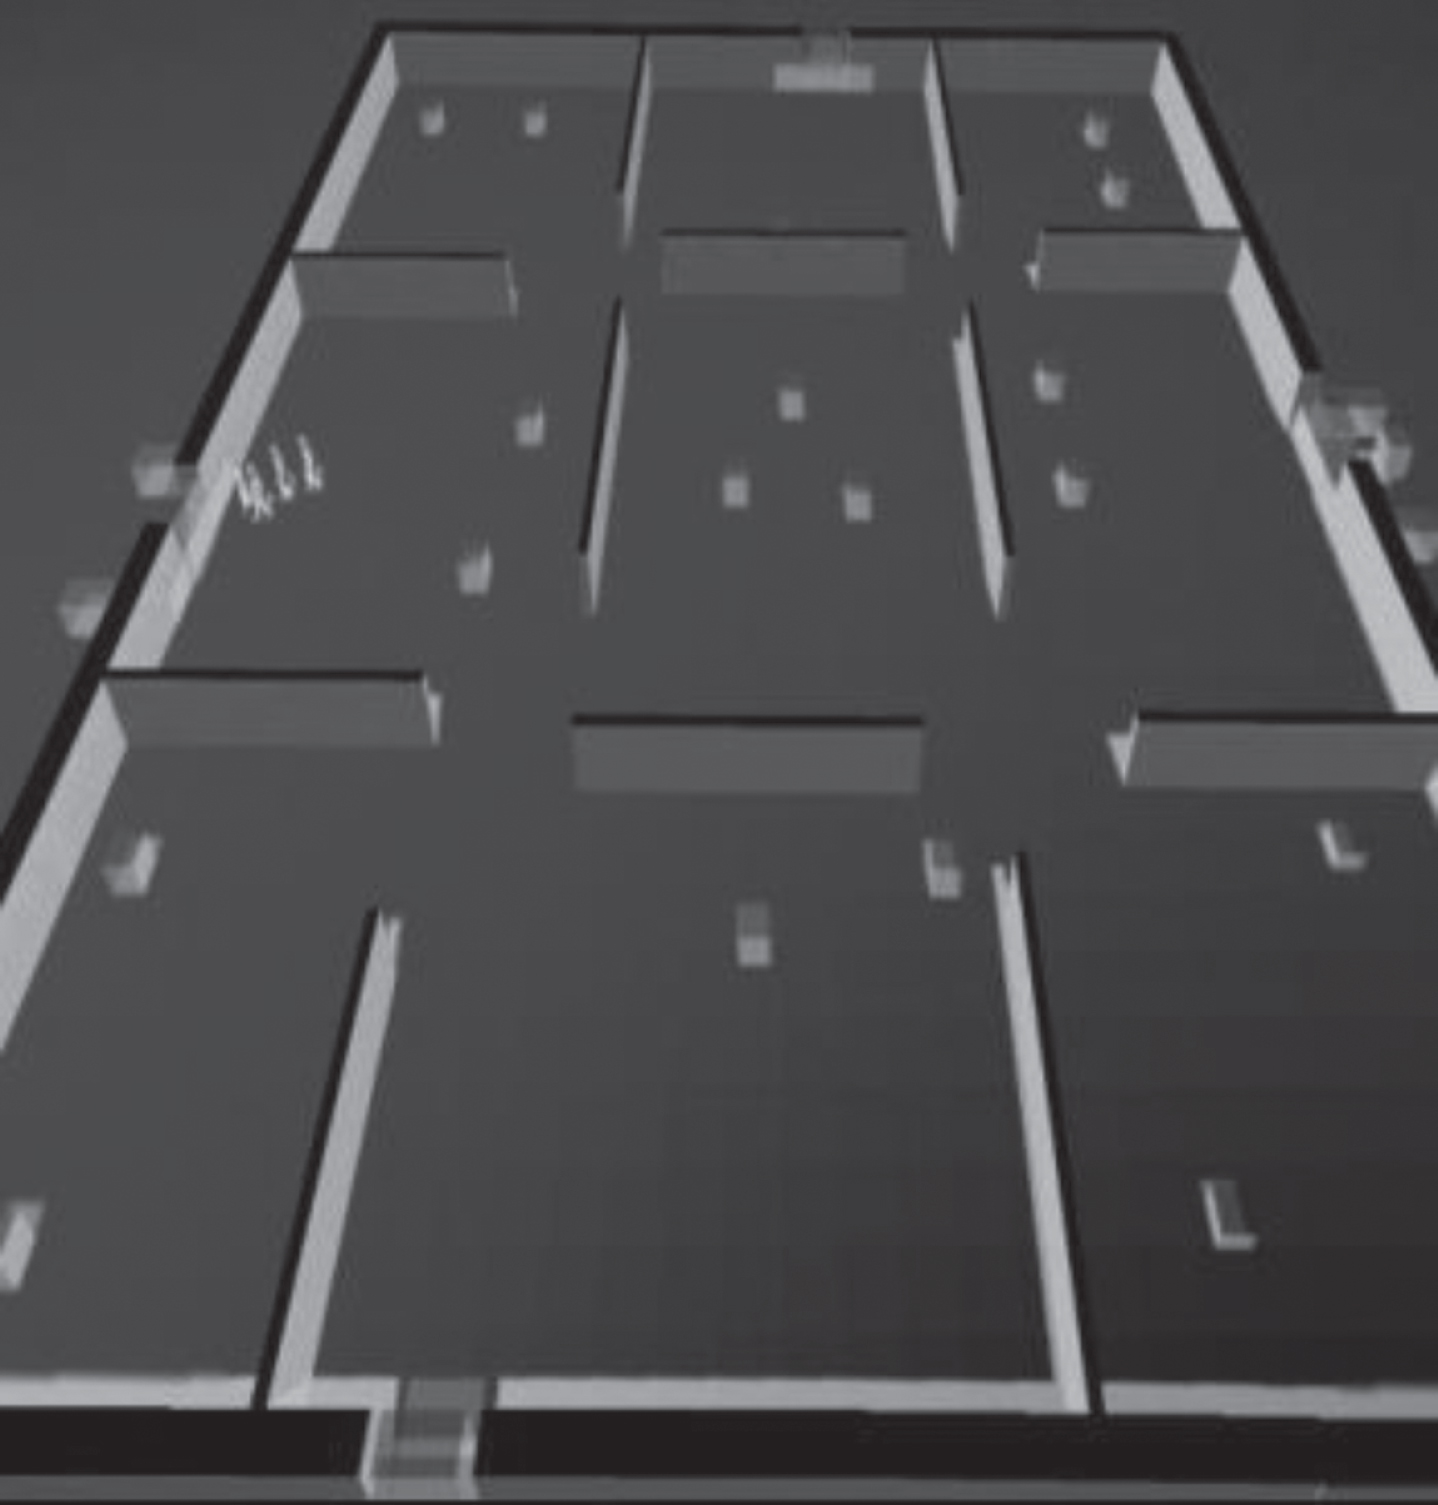
The actual distribution of students in the simulated tennis court.
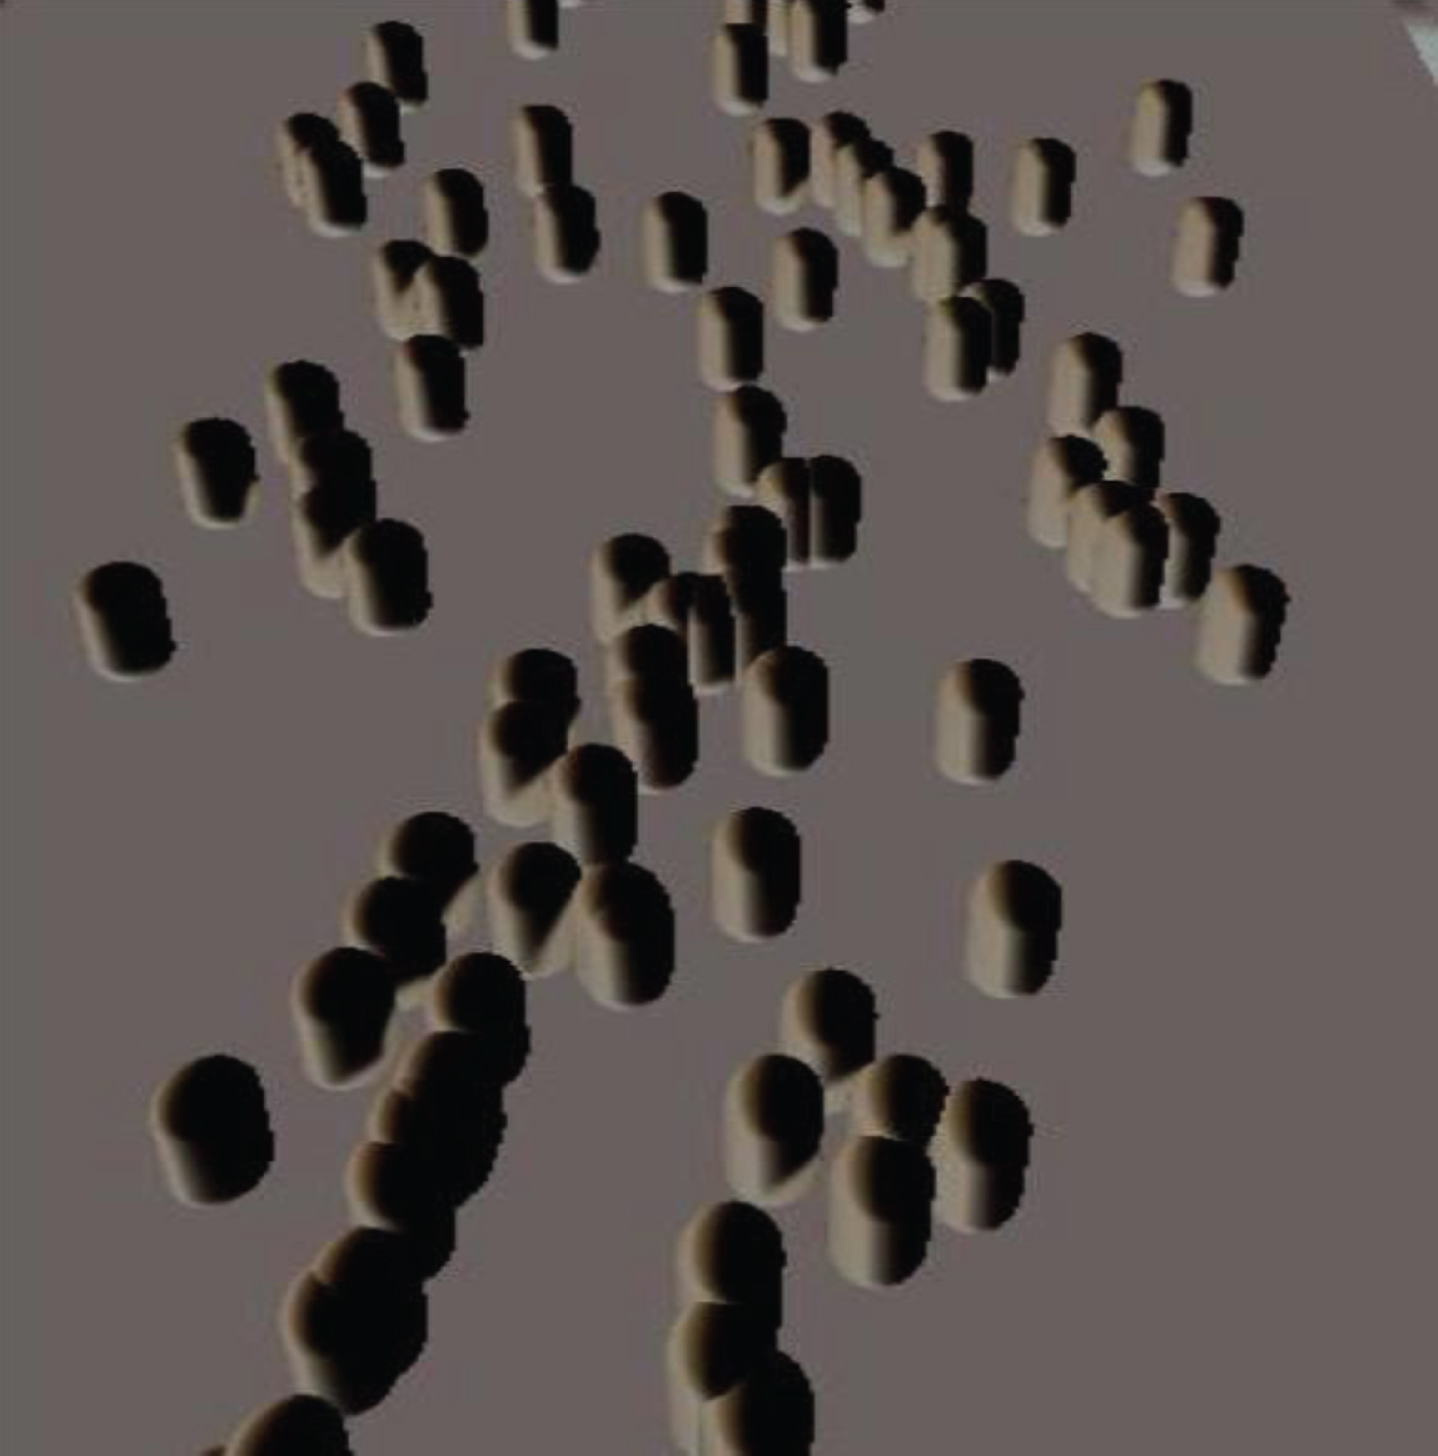
On the basis of Fig. 6 above, feature identification is performed, and the students are marked by bright spots. The results are shown in Fig. 7.
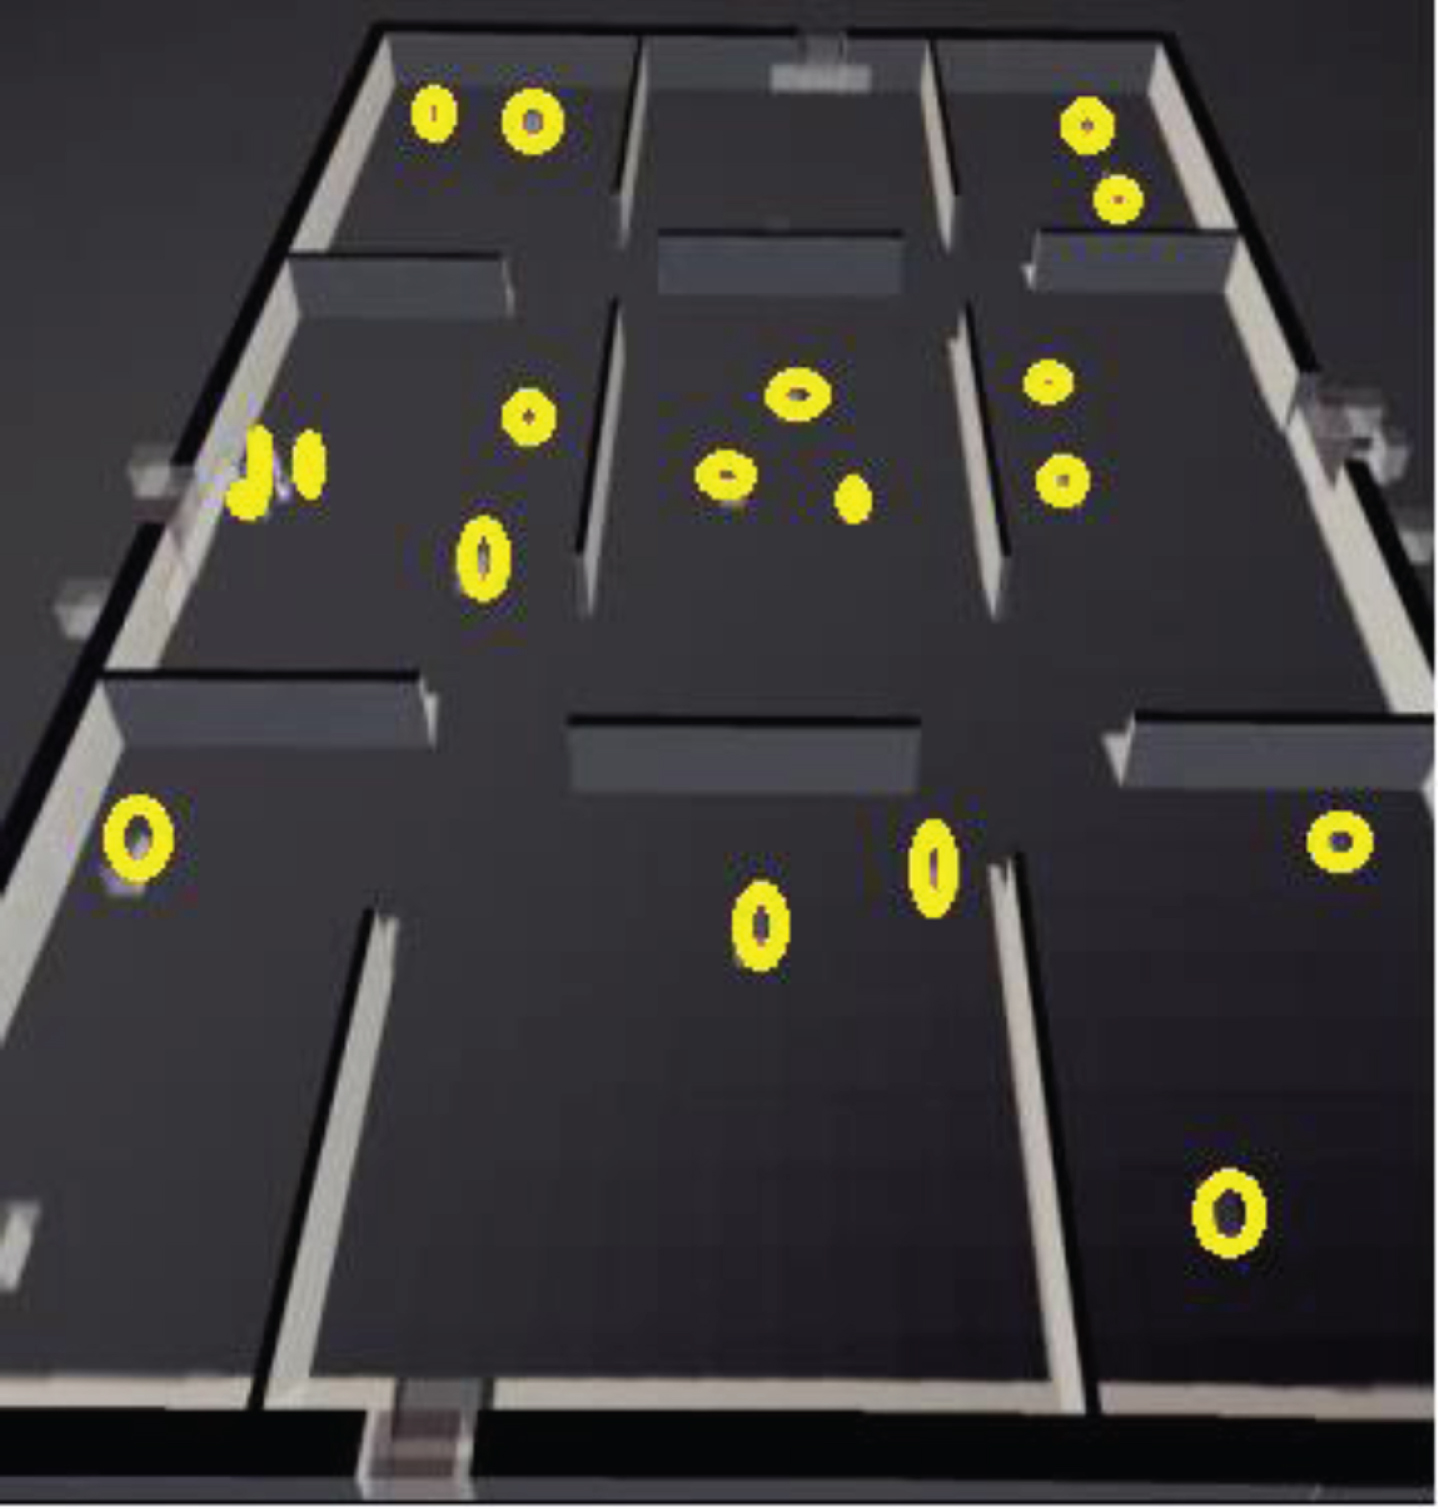
Crowd feature identification mark diagram.
In order to verify the effectiveness of the path planning model and collision avoidance model based on the beetle antennae search algorithm proposed in this article, this article first built a crowd evacuation simulation system based on the Unity3D 2018 version development engine and Microsoft Visual Studio. In this paper, the crowd evacuation simulation system mainly includes modules such as scene modeling, character modeling, and UGUI. The relevant work to be done is shown in Fig. 8.
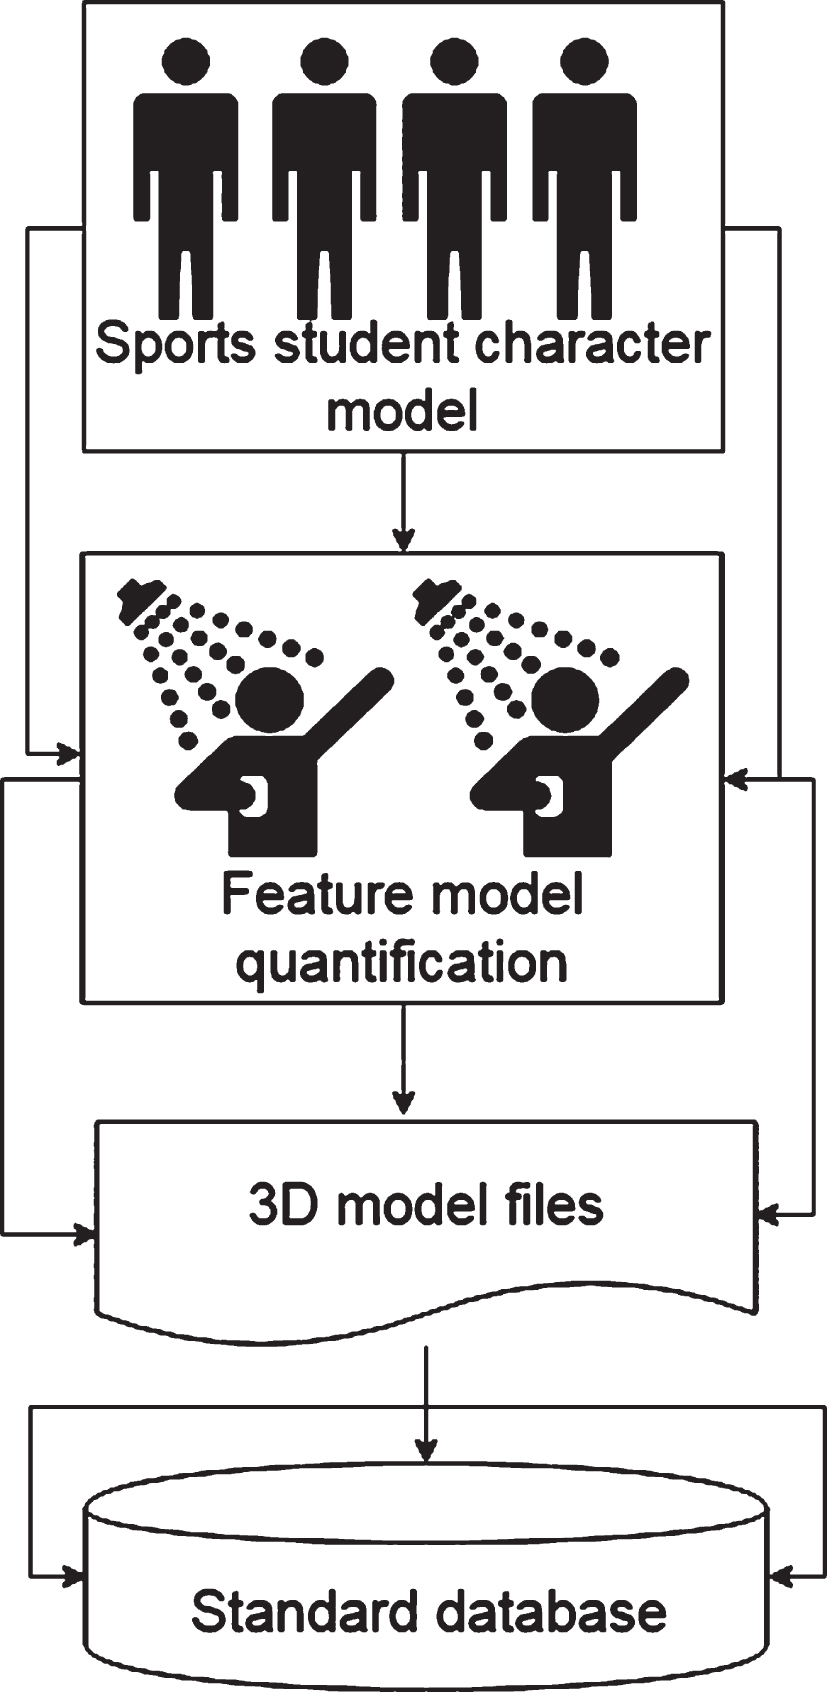
Related work of system implementation.
On the basis of the above analysis, the performance verification of the model in this paper is carried out. First, the quantitative analysis of the student movements captured in this paper is carried out, and the 100-meter sprint is taken as an example for research, and a total of 20 people participate in it. This study compares the measured time and the time spent in system identification, and the identification time of the eagle eye system. The results obtained are shown in Table 2 and Fig. 9.
Statistical table of time spent by sports students on 100-meter sprint
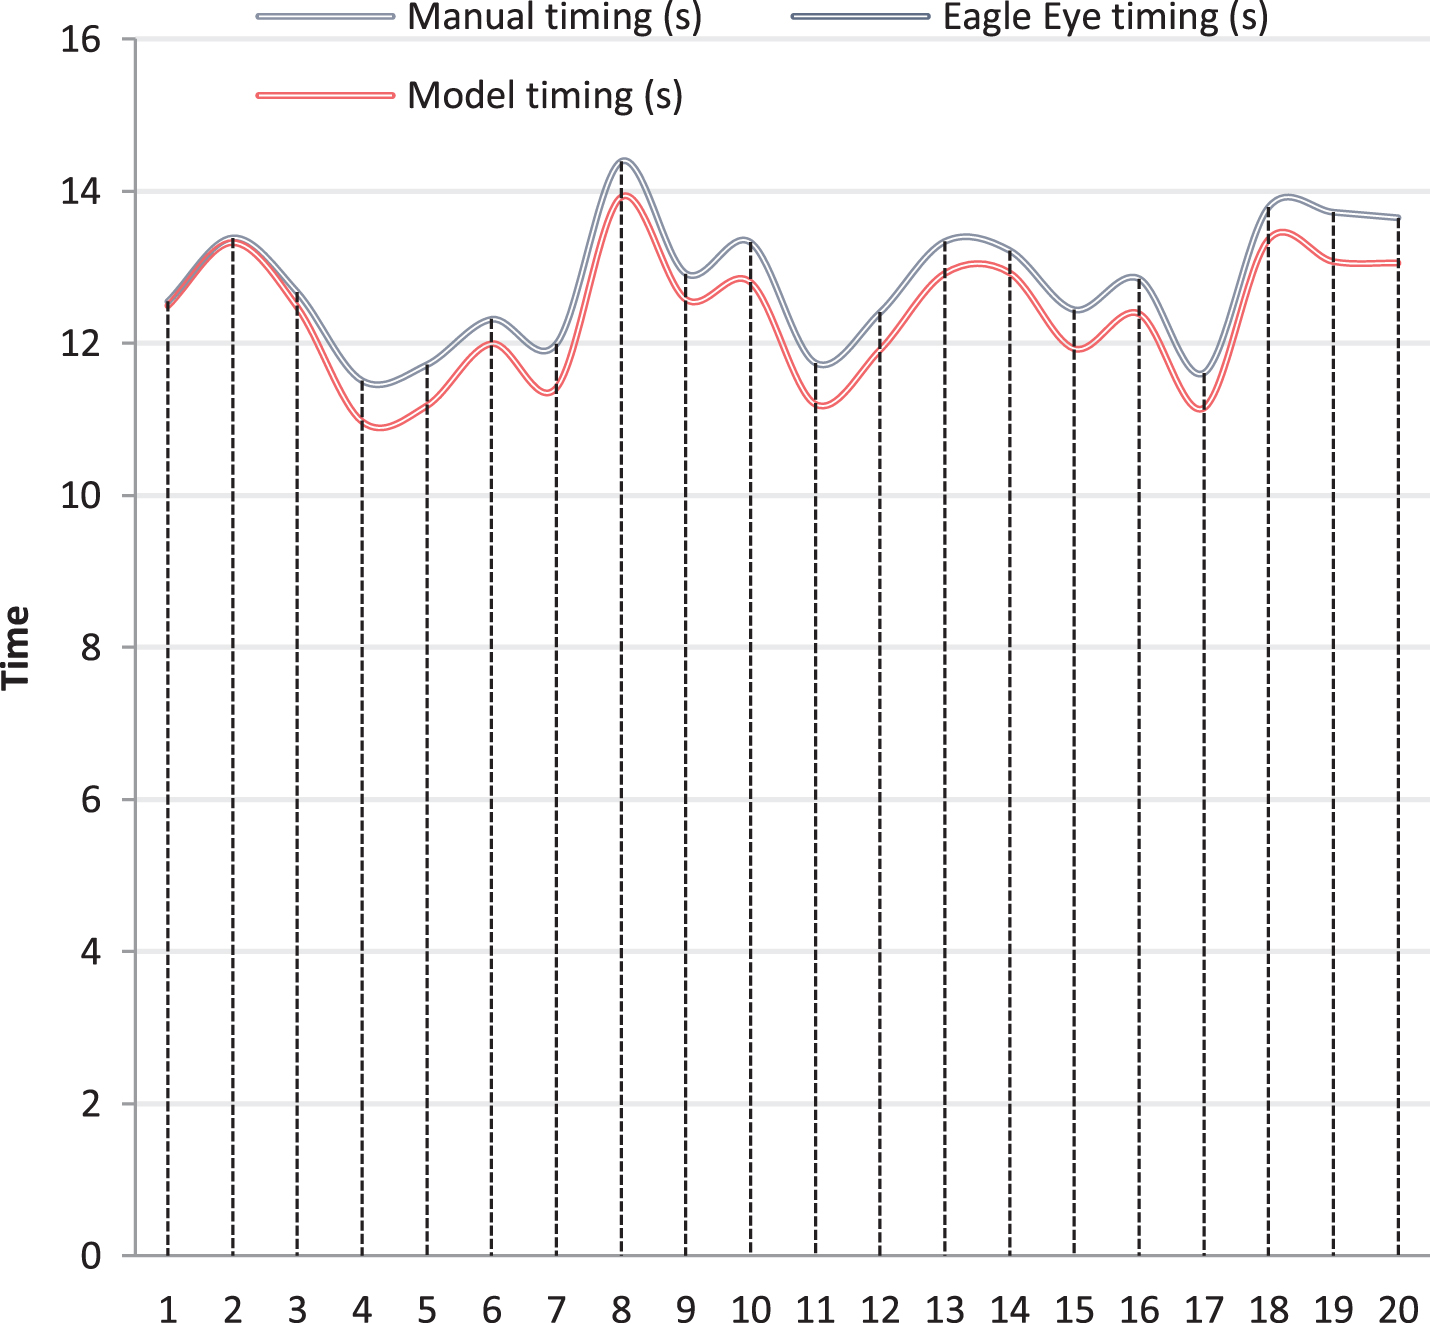
Statistical diagram of time spent by sports students on 100-meter sprint.
It can be seen from the analysis of Fig. 9 that in the statistics of sports students’ 100-meter sprint performance, the error of manual statistical method is relatively large, and the eagle eye timing is consistent with the timing results of the model system constructed in this article. It can be seen that the model constructed in this paper has a better effect on feature identification and time statistics. Next, the statistics of the accuracy of student’s movement feature identification are performed. The statistical analysis is also made with 20 students, and the two methods of artificial movement identification and model identification are compared. The results obtained are shown in Table 3 and Fig. 10.
Statistical table of accuracy rate of sports movement feature identification
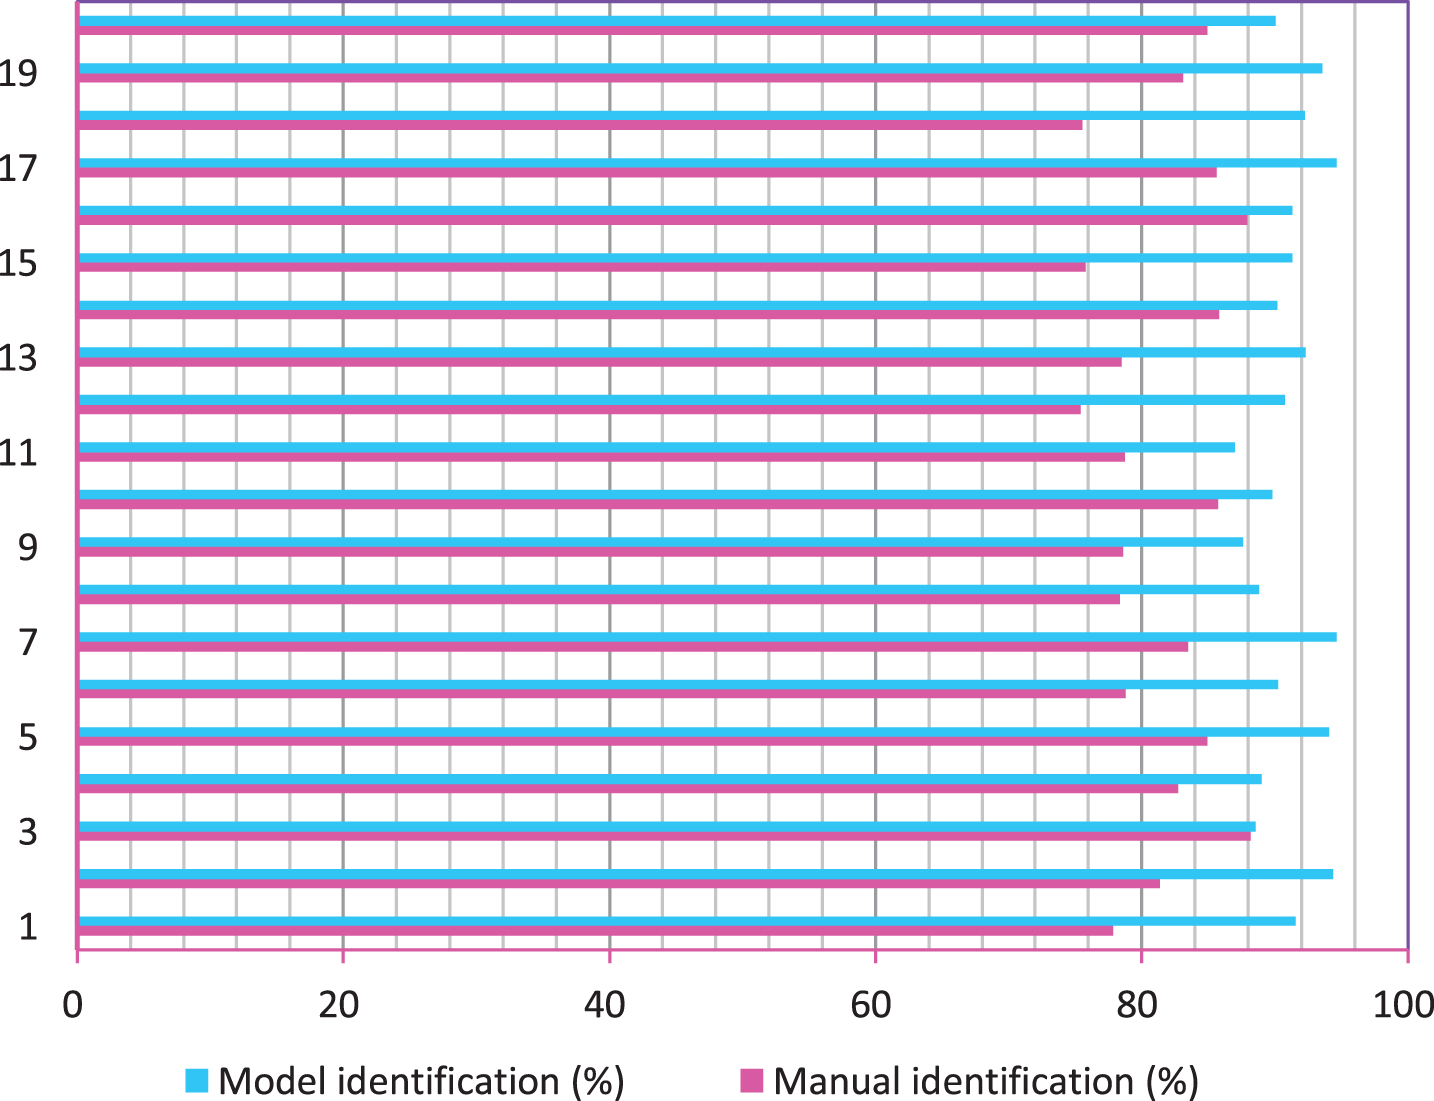
Statistical table of accuracy rate of sports movement feature identification.
As shown in Fig. 10, the model proposed in this paper has a high accuracy rate in sports action identification, so it can meet the actual needs.
Based on the actual needs of physical education, this article reforms traditional physical education methods, proposes a university physical education model based on virtual crowd simulation and digital media, and builds a corresponding system. Moreover, this paper uses feature identification to monitor classroom teaching and counts multiple parameters to assist the effective teaching activities. In model identification, in order to ensure that the topological information in each block is continuous, this paper also needs to perform additional processing on some vertices in discontinuous 3D space. The processing method is to assign the vertices in these three-dimensional spaces to the nearest and adjacent blocks. In this paper, in order to further compress the grid data, a method based on three-dimensional grid coordinate value prediction is used. This method translates and rotates each frame in each category, and then calculates the difference with the key frames in each category. The key frame does not perform any processing, that is, the original three-dimensional coordinate data is retained. The comparative test shows that the model proposed in this paper has good performance.
Footnotes
Acknowledgment
This work was supported by research project of humanities and social sciences in colleges and universities of Anhui Province (NO:SK2019A0428).