
Abstract
Blindness is one of the serious issues in the present medical world scenario mainly caused by Diabetic Retinopathy (DR). It is a diabetes complication, that is produced due to the problems in retina blood vessel. For clinical treatment, it will be extremely helpful, if diabetic retinopathy is detected in early stages. In recent years, the manual detection of DR consumes more time and moreover, the detection of DR in early stages is still a challenging task. In order to avoid these issues, this research work focus on an automated as well as effective solution for detecting DR symptoms from retinal images and requires less time for accurate detection. A Novel histogram equalization technique is used for performing contrast enhancement and equalization in initial pre-processing stage. Then, from these pre-processed images, image patches are extracted regularly. Improved Discrete Curvelet Transform based Grey Level Co-occurrence Matrix (IDCT-GLCM) is used in second stage for extracting features. Then, extracted features are given to Classifier. At last, an Improved Alexnet model-based CNN (IAM-CNN) classification approach is used for diagnosing DR from digital fundus images. In terms of accuracy, specificity and sensitivity, effectiveness and efficiency of proposed method is shown by extensive simulation results.
Keywords
Introduction
Among diabetic patients, blindness is commonly caused by Diabetic retinopathy (DR). In 2014, around 422 million diabetic patients are there in the world according to the World Health Organization (WHO) [1]. Some class of retinopathy is developed by around 35% for damage accumulation to small blood vessels in retina. Among special patients’ group, DR prevalence is much higher [2]. For instance, in rural areas, type II diabetic patients is around 40% and type I diabetic patients is around 86% have DR and 43% is the estimated DR rate. During DR gradual development, there is a sight loss variation.
Diabetes produces a disease called Diabetic retinopathy (DR). Patient’s eye retina is damaged by diabetes and so, it is termed as diabetic retinopathy. Permanent blindness may be caused by this disease. Based on patient’s threat level, various level classifications can be done in DR [3]. The stage with mild and moderate threat level is called as Non-Proliferative Diabetic Retinopathy (NPDR) and it is a first stage and Proliferative Diabetic Retinopathy (PDR) is a second stage with severe threat level and leads to complete blindness. MicroAneurysms(MAs) is a DR’s early stage and in retina, small blood vessels swelling cause this. Further, signs of Non-Proliferative Diabetic Retinopathy include soft exudates (EXs), hard exudates (EXs) and Hemorrhages (HMs) [4]. Diabetic retinopathy classification is shown in Fig. 1.
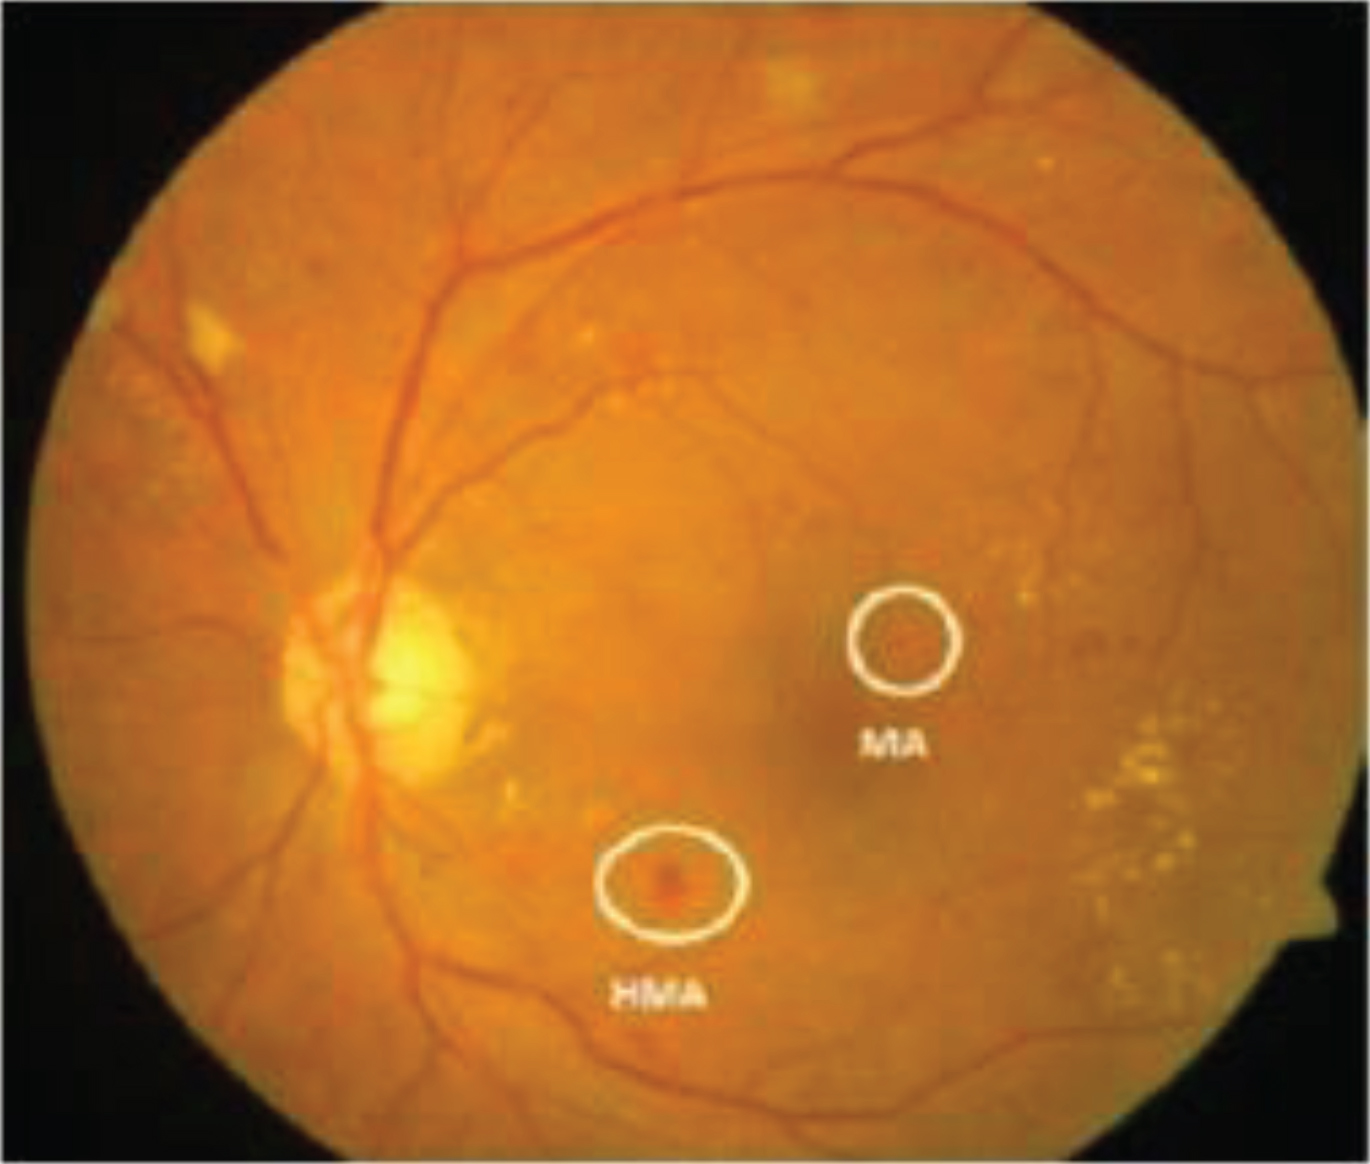
Microaneurysms and Hemorrhage.
Using early diagnosis of this disease, around 90% of diabetic patients can be saved as acknowledged by various researchers. A person with diabetes is having high chance of diabetic retinopathy (DR). But, there exist various therapies [5]. Around 50% of cases are cured by an accurate as well as early diagnosis and by treatment application. Among working-age, blindness is majorly caused by Diabetic Retinopathy (DR). Visual loss is prevented by early detection as well as with timely treatment.
Diabetic retinopathy (DR) is a common retinal complication which is associated to diabetes. In advanced and middle age groups, blindness is a major cause. It is an ocular diabetes appearance [6]. It is an universal disease. Around 80% of patients having diabetes for more than 10 years are affected by this. The more extended an individual has diabetes, the higher their odds of creating diabetic retinopathy.
Due to the increase in imaging platforms availability in worldwide, for DR screening, Fundus photography is adapted widely. Against other DR screening techniques, binocular slit-lamp ophthalmoscopy showed its ability. Ophthalmologist consultation is not required in fundus photography and it is a cost effective technique [7]. Eyes can be differentiated by graders with various DR severities and eyes with PDR are identified which needs urgent treatment referral.
For making automatic DR diagnoses, computers are used widely for making more techniques [8]. From fundus images, useful information are extracted first using various traditional feature extraction techniques. Then classifiers of certain class are given with these features. AdaBoost, support vector machine and random forests are some example classifiers [9]. Techniques based on hand-crafted feature are highly labor intensive and their results are not up to the level of requirement.
In various areas, revolutionary results are produced by deep neural networks (DNNs) in recent days. In natural language processing and computer vision, breakthroughs are brought by this technique [10]. When compared with other machine learning and artificial intelligence techniques, better performance is exhibited by deep neural networks in various applications. DNN has now been widely used in DR diagnosis and significant results are being achieved [11]. With all these advances, automatic DR diagnosis systems remain unavailable for clinical applications and it requires much more work. Improved Alexnetmodel based CNN (IAM-CNN) classification approach is proposed in this work fir classifying DR in its early stage.
Organization of this paper is described as, review of related works reported in latest literature are given in section 2 and proposed diabetic Retinopathydiagnosis technique and classification of DR are presented in section 3. The performance analysis of the Proposed technique is presented in section 4 and concluding remarks are presented in section 5.
Various recent techniques presented in the literature for diabetic retinopathy detection are thoroughly reviewed in this section.
Gulshan et al. [12] detected diabetic macular edema and diabetic retinopathy automatically using a deep learning algorithm in retinal fundus photographs. For classification of image, deep convolutional neural network is trained, which is a special neural network type with optimization and retrospective development data set with 128 175 retinal images is used and for ophthalmology senior residents, image gradability by licensed ophthalmologists panel, diabetic macular edema and diabetic retinopathy it is graded 3 to 7 times. From development set, two operating points are selected to evaluate this algorithm. For high sensitivity one is selected and for high specificity, another one is selected. In development set, with high sensitivity, second operating point is used. In EyePACS-1, 93.4% specificity and 97.5% sensitivity and in Messidor-2, 93.9% specificity and 96.1% sensitivity are produced.
Gardner et al. [13] detected diabetic features in fundus images using neural networks and ophthalmologist screeningfundus images set is compared for evaluation. From a fundus camera, captured a 32 normal and 147 diabetic images and on computer, they are stored, and back propagation neural network is used for analyzing it. In retinal image, features are recognized by training the network. Assessed various network variables and digital filtering methods effects. Then randomized 101 normal and 200 diabetic images and used in evaluating performance of a network in diabetic retinopathy detection against ophthalmologist. For vessel recognition, detection rate of 91.7% and for exudates, 93.1% and for haemorrhages, 73.8% is produced. For diabetic retinopathy detection, 88.4% of sensitivity and 83.5% of specificity is achieved by this network when compared with ophthalmologist results.
Sinthanayothin et al. [14] analyzed digital colour retinal images by developing an automated screening system. This is done to extract non-proliferative diabetic retinopathy (NPDR) feature. Performed color images high performance pre-processing. A new method called ‘Moat Operator’ is combined with Recursive region growing segmentation algorithms for detecting NPDR features automatically. Haemorrhages and microaneurysms (HMA) features are included and they form one group and another group is formed using exudates. For exudates detection, around 99.7% specificity and 88.5% sensitivity is produced. In 14 retinal images, HMA made its presence. For HMA detection, 88.7% specificity and 77.5% sensitivity is produced by this algorithm.
Usher et al. [15] detected diabetic retinopathy features automatically in color digital images using a system and in diabetic retinopathy screening, its potential is evaluated. Color standardization and contrast enhancement are done in the pre-processing step of the system. Possible lesions are revealed using segmentation and artificial neural network is used for lesion classifications. From 500 patients, image subset is collected and used for training this system and on test set image having 773 patient’s data is used for comparing the system’s performance with human grader. For diabetic retinopathy screening, this system can be utilized. Around 94.8% of sensitivity is produced.
Abramoff et al. [16] acquainted a discovery calculations appear with develop, and further enhancements in identification execution can’t be separated from best clinical practices, in light of the fact that the exhibition of serious calculation improvement presently has arrived at the human intra reader changeability limit. The fundus photographic set from each visit was broke down by a solitary retinal master; 793 of the 16,770 sets were delegated containing more than negligible DR (edge for referral).
The results of the two algorithmic finders were applied independently to the dataset and looked at by standard factual measures. DR identification calculations accomplish practically identical execution to a solitary retinal master peruser and are near experienced, and further quantifiable enhancements in location execution are impossible.
Ravishankar et al. [17] proposed another imperative for optic circle discovery wherein, initially, the significant veins are identified and utilize the convergence of these to locate the estimated area of the optic plate. This is additionally confined utilizing shading properties. Furthermore, it is shown that huge numbers of the highlights, for example, the veins, exudates and microaneurysms and hemorrhages can be distinguished precisely utilizing diverse morphological tasks.
Broad assessment of the calculation on a database of 516 pictures with fluctuated complexity, brightening and sickness stages yields 97.1% achievement rate for optic circle confinement, an affectability and explicitness of 95.7% and 94.2% respectively for exudate recognition and 95.1% and 90.5% for microaneurysm/drain identification.
Ting et al. [18] screened diabetic retinopathy as well other eye related diseases using deep learning system (DLS) which is a machine learning technology. In detecting clinic-based multiethnic populations with diabetes, age-related macular degeneration (AMD) in community, possible glaucoma, vision-threatening diabetic retinopathy, referable diabetic retinopathy, evaluated DLS performance. For diabetic retinopathy identification and other eye related disease identification, high specificity and sensitivity values are produced by DLS and retinal images of diabetes patients from multiethnic cohorts is used in this evaluation. In health care setting, DLS applicability and in improving vision outcomes, DLS usage needs to be further evaluated.
Gómez-Ulla et al. [19] detected and graded diabetic retinopathy (DR) in digital retinal images using a web-based system which is developed for reference center. At two peripheral units, using a nonmydriatic camera, from 70 diabetic patients, 126 eye fundus images containing four nonstereoscopic digital retinal images are collected. To a reference center, these images are forwarded using web-based system via internet, where one ophthalmologist, diagnosis and grade these images. Two other ophthalmologists are also doing the same process in every peripheral unit after examining the patients. These results are used for making comparison of results. In all cases, DR grading is done using an Airlie House’s modified severity scale. For continuous data, the Intra class Correlation Coefficient (ICC) and for categorical data, unweighted are used for assessing the agreement between observers. For diabetic patients treating at low cost, teleophthalmology is used as an alternative among various health professionals. It has high adaptation and expansion possibilities.
Sopharak et al. [20] detected diabetic retinopathy by implementing Fuzzy C Means (FCM) clustering. Before the extraction features, contrast enhancement pre-processing step is carried out. Features like edge pixels count, hue, standard deviation on intensity and intensity are extracted. These features are given as an input to segmentation stage which uses FCM clustering technique. Morphological method is used for tuning first result. expert ophthalmologists’ hand-drawn ground-truths are compared with detection results for validation. Overall performance is evaluated using metrics like accuracy, positive likelihood ratio (PLR), positive predictive value (PPV), specificity and sensitivity. Successful detection of exudates are done using proposed method and it produced 87.28% sensitivity, 99.24% specificity, 42.77% PPV, 224.26 PLR and 99.11% accuracy values.
Zhang et al. [21] detected artifacts and reflections in an image in addition to denoising and normalization using a new pre-processing technique. Proposed a mathematical morphology based segmentation technique for new candidate. Novel contextual and classical features are used for characterizing these candidates. Among candidates, exudates are detected using random forest algorithm in the last stage. The e-ophtha EX database is used for validating this method and around 0.95 AUC is produced. In other databases around 0.95 and 0.93 AUC is produced which is better than state-of-the-art techniques.
Marín et al. [22] detected blood vessels in digital retinal images using a new supervised technique. For classification of pixels, neural network (NN) scheme is used in this method. For pixel representation, 7-D vector composed of moment invariants and gray-level -based features is computed. Publicly available STARE and DRIVE database is used for evaluating this method. In those databases, experts are marking vascular structure precisely in retinal images and is widely used for this purpose. When compared with other existing techniques, better performance is exhibited by proposed method on both datasets. In STARE images, accurate vessel detection is done using this method. All analyzed segmentation techniques are outperformed by a new supervised neural network scheme application to this database, even with the usage of DRIVE database for training NN. For computer analysis like automated screening to detect diabetic retinopathy in early stages, this blood vessel segmentation proposal is more suitable because of its robustness and effectiveness in various image conditions, fast as well as simple implementation.
Osareh et al. [23] followed few key pre-processing steps for developing fuzzy C-means clustering. Investigated an artificial neural network classifier for classifying segmented regions into either non-exudates or exudates. In images having retinopathy evidence, for identification, around 88.9% of specificity and 95.0% of sensitivity is produced by proposed system. For this specific problem, there will be a proper balancing between specificity and sensitivity tradeoff. In classification based on exudates, around 94.1% of specificity and 93.0% if sensitivity is produced.
Supervised learning is employed by all these methods and reference image is compared with segmented image. All disease characteristics are not checked by this technique. Only fed image characteristics are compared. This is a major drawback. So, in this area, there is a need to have accurate as well as effective DR detection technique.
Proposed methodology
For an effective automated diabetic retinopathy (exudates, retinal hemorrhage and micro-aneurysm) detection, a new system is proposed in this work. This is detection is carried out on retinal fundus images dataset. Novel histogram equalization is used for performing contrast enhancement and equalization in initial pre-processing stage. Then, from these pre-processed images, extracted image patches regularly.
Improved Discrete Curvelet Transform based Grey Level Co-occurrence Matrix (IDCT-GLCM) is used in second stage for extracting features. Classifier performance is increased using this method. At last, an Improved Alexnetmodel based CNN (IAM-CNN) classifier is proposed for effective classification of DR from digital fundus images. Figure 2 shows architectural overview of proposed diabetic retinopathy disease detection technique. Proposed method’s detailed implementation phases are discussed in this section.
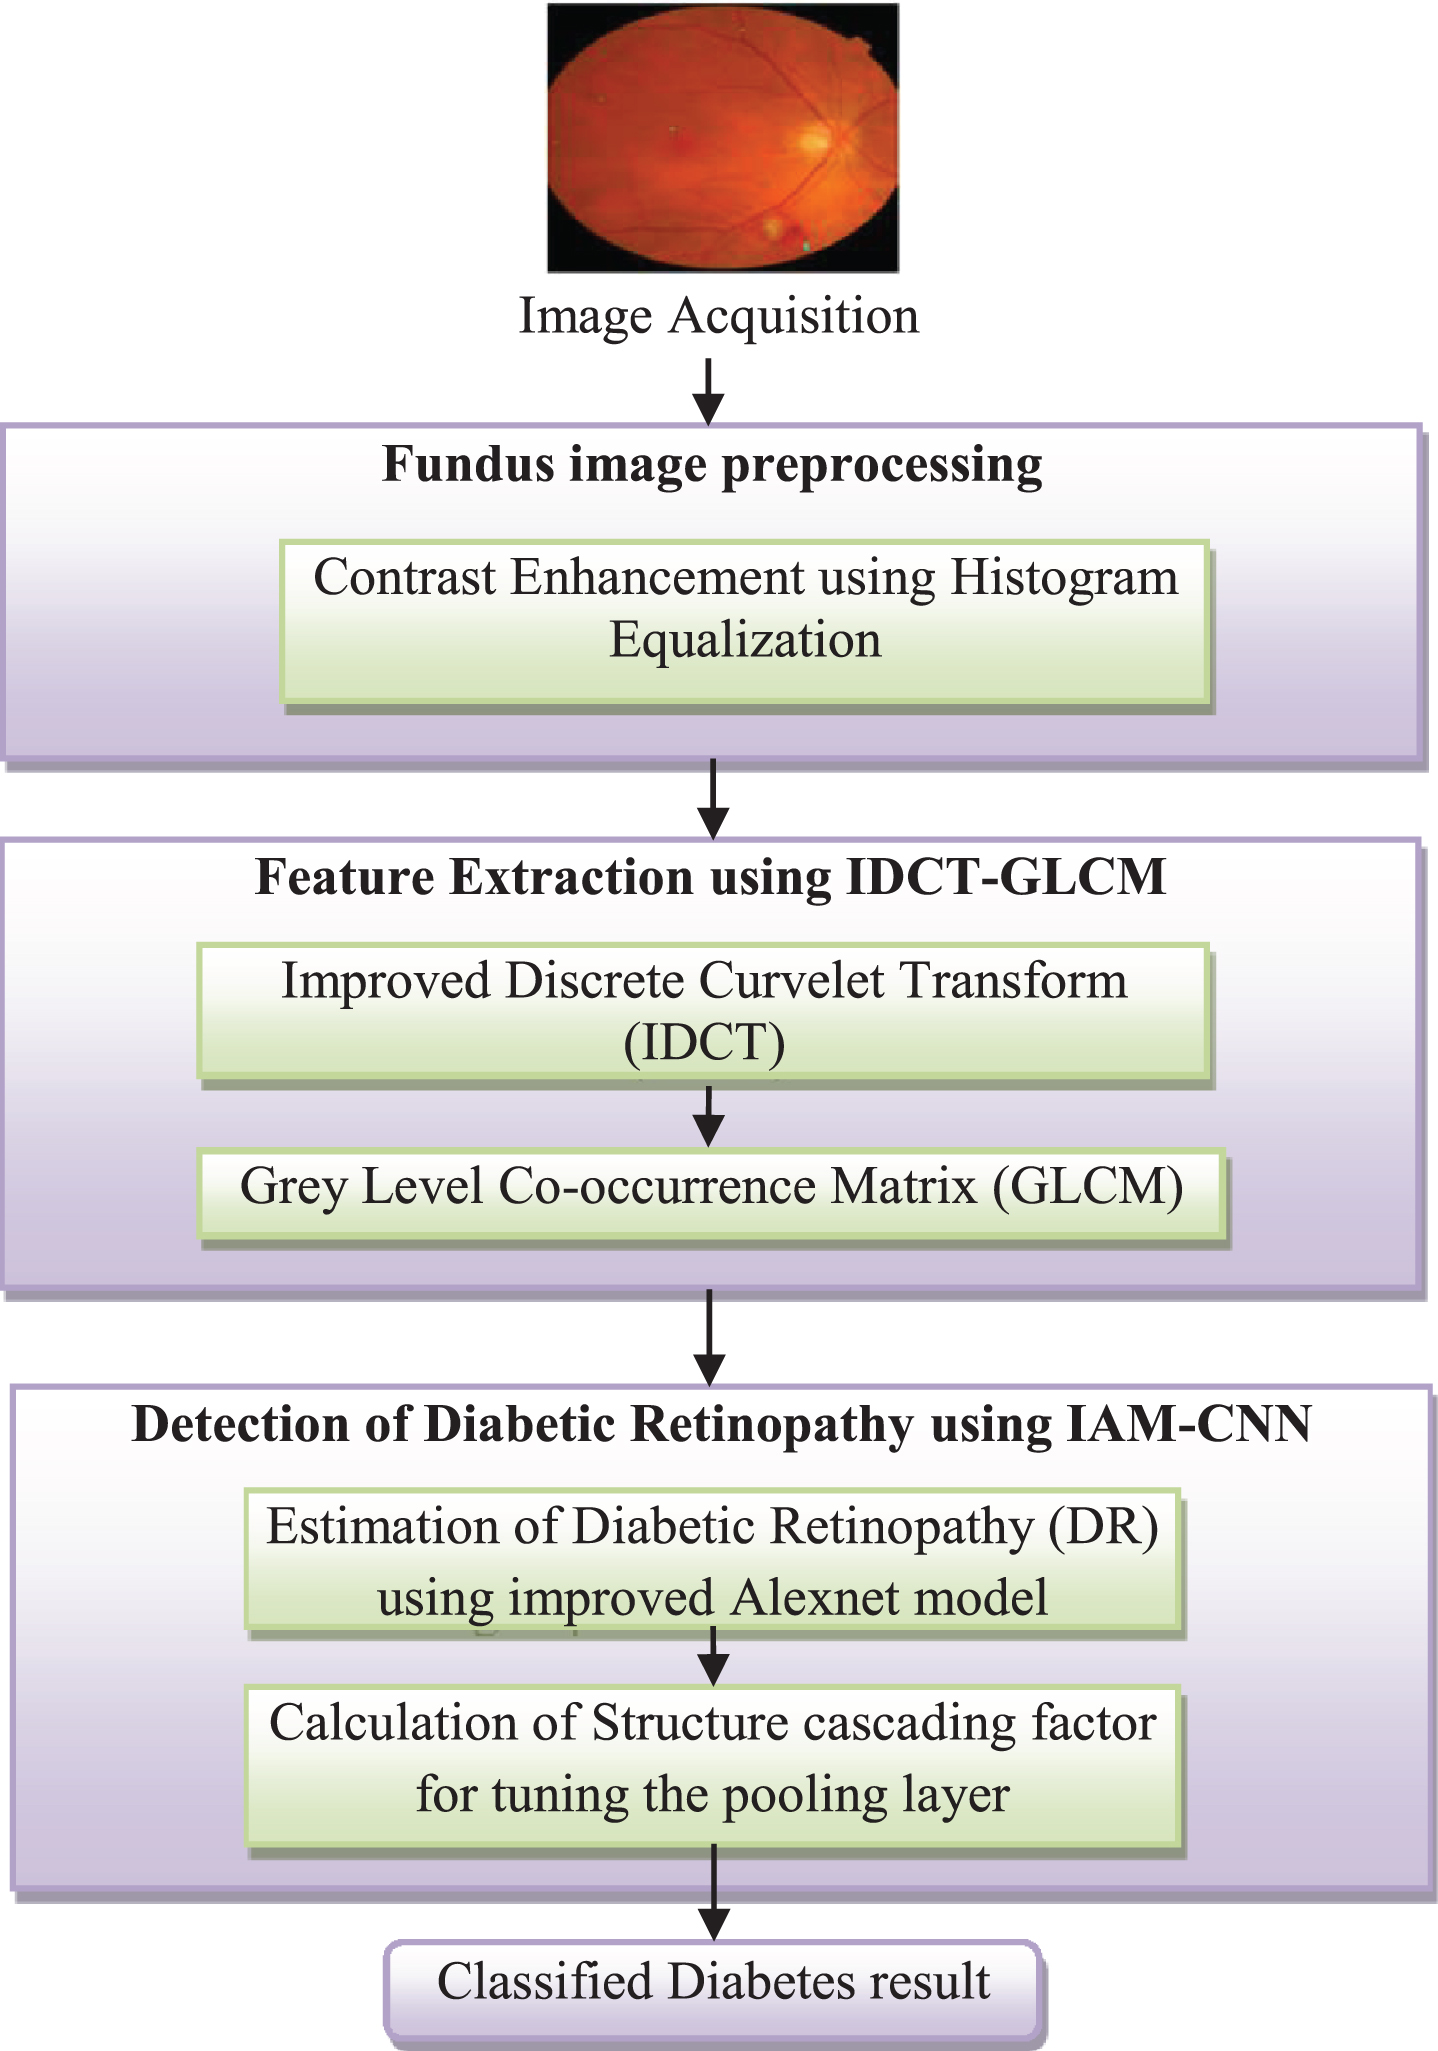
Overall Process of the Proposed Technique for Detection of Diabetic Retinopathy.
In the retinal fundus image, among various objects, interested objects are represented using low intensity pixels. So, used minimum intensity criteria for identification of those objects. In an entire image, brightness is flattened using a histogram-based contrast enhancement technique, which is a local contrast enhancement method, where, brighter areas are not over exposed and darker areas are enhanced [24]. Certain areas of an image are over enhanced by simple histogram equalization techniques and it leads to degradation of image. In image’s darker as well as in brighter regions, loss of information is caused by this and retinal details may be blurred.
Low signal areas will be darkened and over explosion of brighter regions are produced because of this. These problems are eliminated using local contrast enhancement introduction, where small areas having similar contrast are formed by splitting an image. This makes the enhancement of every area. Illumination and contrast are increased in a considerable manner by using histogram processing like specification and equalization in further retina image analysis. And, then the Image features are enhanced using contrast enhancement. Performed contrast limited histogram equalization and it is performed after the formation of smaller blocks by splitting an image.
Image contrast is enhanced using histogram equalization. Over full range, intensity values are spread. Images having non-uniform equalization in background are not suitable for histogram equalization, as extra pixels are removed from dark regions and to light regions extra pixels are added. In output image, high dynamic range is produced because of this. Even distribution of contrast throughout entire available dynamic range in a specified image is a major objective of histogram equalization.
Following steps are involved in histogram equalization process. Image reading Original image’s probability, PDF and histogram are computed. Using expression (3), histogram equalization is performed.
Histogram is a two-dimensional graph, where event whose frequency needs to be computed are represented in X axis and that event’s frequency are represented in Y axis. In image, pixels are used for representing the term event [25]. Bars are used for representing pixel’s occurrence frequency in images. General expression used for computing histogram is given by,
Where, kthgray level value is represented as r k which lies between [0 to L-1], in an image with gray level r k pixel count is represented as n k .
Tendency of event occurrence is represented by probability. Pixels corresponds to event and their occurrence in an image given by probability in image processing. General expression used for computing every pixel’s probability is given by,
Where, pixels count is represented as n k , image dimensions are represented as mn, in an image rows are given by m and columns are given by n.
Input image’s contrast is enhanced using a technique called histogram equalization and intensity range are stretched out. There is a chance for contrast decrease, in worst equalization process. Transformation function in discrete domain is expressed as,
Where, probability density function is represented as P k (r).
Equalized image having enhanced contrast is obtained by rounding off the values derived using expression (3) and mapping them with original image. On input image, above mentioned steps are performed for getting equalized image with more contrast and more like an original image.
In order to present edges in a better way and other singularities along curves, proposed numerous multi resolution analysis tools using the success of wavelets in recent days. But wavelets are having limited directional features. So, at multi-direction and multi-scale level, matrices group are used for describing a signal in a powerful method called Curvelets [26]. Much fine directions count is obtained using increased scale value.
Fingerprint image core’s manual direction is required in this technique for ensuring accuracy. Complex image enhancement process is needed in this technique before Curvelet features extraction. Binarization which is a process converting gray scale image into binary image, image filtering, local ridge frequency estimation across fingerprint and local ridge-orientation are the major complex image enhancement process.
Original image is decomposed into five-scale Curvelet coefficients using improved discrete Curvelet transform (IDCT) in the first stage of this work and fundus image, for smoothening ridges discontinuities, Curvelet filter is constructed using Curvelet coefficients relationship at adjacent scales. At coarsest scale, Curvelet coefficients calculate gray-level co-occurrence matrices (GLCM) is computed in second stage and GLCM based texture features are computed. At last, for setting up an Improved Alexnetmodel based CNN (IAM-CNN) classifier, feature set is formed using this combined IDCT-GLCM based features.
Improved discrete curvelet transform (IDCT)
The noise is exceeded when the signal is processed by the wavelet transform from high frequencies (low dilatations) to low frequencies (high dilations). In addition to its property to detect singularities. The curvelet transform allows to extend this application to detection of extended objects, it is used to represent the structures in 3-D. The curvelet transform is based on the calculation of the wavelet transform 1-D. Singularities along curve and edges are represented by designing a family of frames in Curvelets. At every length scale, Curvelet transform is a multiscale pyramid having various positions and orientations and at fine scale, it is a needle-shaped elements. Useful geometric features are there in Curvelets and which makes them differ from wavelets. For example, highly anisotropic behavior is exhibited by Curvelets and it includes width and length of a variable. Decrease in scale increases anisotropy at fine scale as per power law. Currently available and fastest Curvelet transform is Curvelets by warping, which is utilized in this work. At various angles and scales, generated various Curvelet coefficients groups after Curvelet transform. Matrix Cj,l represents Curvelet coefficients at angle l and scale j, and there will be change to coarsest scale from finest in scale j, and at top-left corner, angle l starts and in clockwise direction it increases.
Assume original image is represented as f (t1, t2) , 1 ⩽ t1 ⩽ N1, 1 ⩽ t2 ⩽ N2 and its 2D discrete Fourier transform is represented as
Where, P
j
= {(n1, n2) , n1,0 ⩽ n1 < n1,0 + L1,j, n2,0 ⩽ n2 < n2,0 + L2,j} and window function
The 2 j ’s releveant parameter is represented as L1,j and 2j/2’s releveant parameter is represented as L2,j and they are the window function support interval’s width and lenth components.
Where
At every position, angle and scale, a signal is described by power in Curvelet transform. In addition with variable width, Curvelets is having variable length. Directional capability is enhanced by Curvelet transform and when compared with multiscale transforms like wavelet transform, singularities along curves and edges are represented in a better manner using Curvelet transform.
However, DCT has certain implementation inconveniences. They are, same norm is not exhibited by curvelet basis functions, with various size, sub-bands are formed by organizing curvelet coefficients, fixed redundancy ratio and there will be a variation within a range and memory allocation problem are caused by this. So, discrete curvelet transform based on Polar angle function is introduced in this work. It corresponds to ‘engineering’ approach for implementing curvelet transform. When compared with existing transforms, various advantages like easy implementation, hierarchical data structure and low redundancy ratio are exhibited by curvelet transform.
•
In this section, defined a polar angle functions set. Like angle function of continuous case V(t), their squares are summed up to one. Shearing relationship is used for replacing rotation relationship between two functions, because, for discrete frequency plane, defined new angle functions in this.
With essential support in (- π/4, 3π/4) range, there is a need to define angle functions. The N intermediary functions
With main support from –1 to
A function T (θ) is defined for converting
Then f θ’s N polar angle functions are defined from functions
The 1-D functions
Anti-symmetric nature of two functions T (θ ± π/4) ±1 can be verified easily. Around π/4 value, v
l
(θ) , l = 2, … . . , N - 1 is flipped for constructing other N polar angle functions as allowed by this.
In v
N
(θ) and vN+1 (θ)’s overlapping regions, v
l
(θ)’s square sum is equal to 1. It can be shown by using T (θ - π/4) -1’s anti-symmetric property. In addition, all angle polar functions v
l
(± θ)’s square sum is also equals 1.
Between the pixels, spatial relationships are considered in textures and they are examined by a statistical technique called Gray-level co-occurrence matrix (GLCM). An image texture is characterized using GLCM functions. In an image, occurrence of pixel pair with specific values in specified spatial relationship is computed in this for GLCM creation and from these matrices, statistical measures are extracted [27]. In image, gray levels count defines rows and columns count in a GLCM matrix.
Angular relationship θ between pixel pair and distance between them d are the two parameters used for computing GLCM. The θ is quantized in four directions (0°, 45°, 90°, and 135°) and d = 1. For image I, nonnormalized GLCM p
ij
, brightness levels i and j, square window N×N are defined as,
If argument is true, then C { · } = 1, else C { · } = 0. Twice counting of every pixel pair is represented by a signs ± and ∓ in expression (10). For making GLCM diagonally symmetric, they are counted once in backward and once in forward. For every direction θ0 and θ1. Following describes the procedure used for extracting features.
Where |i - j| = n.
Where,
Where, matrix C2,l size is represented as (m1, m2) and l = 1, 2, 3, 4, 5, … . . , 16.
For reducing time of recognition and assuring accuracy of classifier, in even directions only curvelet coefficients averaged l1-norm is computed in all above mentioned steps.
In image classification, problems are addressed by employing most effective CNN architectures called Alexnet architecture [29]. For diabetic retinopathy detection, proposed Alexnet model is shown in Fig. 3. Following describes the operations used for implementing proposed Alexnet architecture.

Proposed Alexnet Model for Diabetic Retinopathy Detection.
Input fundus image is resized in first steps using respective height and breadth of pixels and input fundus image depth is represented using three color channels A scalar product of image’s small portion with its assigned weights are computed and which defines neurons output. Along breadth and length, repeated this process. In convolutional layer, performed this operation. Employed an element-wise activation function in Rectified Linear Unit (RELU) layer. With 0, all negative activations are replaced by this layer. Non-linearity is introduced into the system for performing the same and function –f(k) = max (0, k) is applied. Along spatial coordinates, reduced samples in pooling layer and this process is termed as decimation. For every image, class score is computed by Fully Connected (FC) layer and prediction is produced. For every prediction class, computed probability score and predicted class corresponds to a class having maximum probability score.
The existing CNN model enhancement is a major objective, where image’s target distribution and characteristics are fully utilized for enhancing CNN representation power. For specified task, before arriving final representation, size of representation which defines resolution of feature map will be decreased to outputs from inputs in general. Overfitting problems are raised because of this. Feature map resolution drop is slowed down due to stride reduction and image information will be lost. So, to rectify representational bottlenecks and for learning more spatial information, multi-resolution features are integrated.
AlexNet uses Rectified Linear Units (ReLU) instead of the tanh function, [30]. ReLU’s advantage lies in fater training time; a CNN using ReLUtechnique was able to reach a 25% lesser error rate results in six times faster on the CIFAR-10 dataset when compared with CNN using tanh.
•
With respect to computation, convolutions having large spatial filters are highly expensive. Two cascaded 3*3 convolution is formed by splitting 5*5 convolution for minimizing computational cost around 1-(9 + 9)/5*5 = 28%, which is shown in Fig. 4. A structure 3*1 convolution followed by a 1*3 convolution is formed by splitting 3*3 convolution, which minimizes around 1-(3 + 3)/3*3 = 33% of computation cost. Rise in cost of computation which is caused by parameters count increase can be minimized by convolution decomposition.

Structure Cascading Factor for Alexnet Model.
In this work, the specified dataset used for classifying the fundus images, conducted various experimentation using CNN architecture based on proposed DR-IAM technique. Test on fundus images are used for evaluating proposed Alexnet architecture’s performance. Performance metrics like precision factor, accuracy, specificity, sensitivity is computed using below mentioned expressions after computing all these values for every image class.
Ratio between correctly identified positive observations to all expected positive observations defines precision [31].
Ratio between correctly identified positive observations to over-all observations defines sensitivity [32].
Precision as well as Recall’s weighted average defines F1 score [32]. As a result, it considers false positives and negatives.
With respect to negatives and positives, computed accuracy as,
Proposed CNN method based on DR-IAM produces better precision value, when compared with various existing techniques. Proposed histogram equalization technique generates a resultant image, which is an encouraging one and DR-detection system’s overall success rate is enhanced by the pre-processing technique. Precision metrics comparison of existing methods and proposed DR-IAM is shown in Fig. 5. Around 98.78% precision value is produced by proposed CNN based on DR-IAN, which is significant when compared with the precision values of 88.45%, 91.57% 96.7% obtained by existing techniques DR-NN, DR-WTH [31] and DR-CGLCM [32] techniques respectively.

Proposed and Existing Method’s Precision Comparison.
Recall metrics comparison of existing methods and proposed DR-IAM is shown in Fig. 6. Around 93.57% recall value is produced by proposed CNN based on DR-IAN, which is a greater value when compared with 87.68%. recall value of DR-NN and 89.54% recall obtained by DR-WTH and 91.84% recall obtained DR-CGLCM technique. At training phase beginning, there is a rapid increase in value as shown and distance between points are reduced, which stabilizes the output. Improved discrete curvelet transform (IDCT) is used for distance reduction.

Proposed and Existing Methods Recall Comparison.
F-measure metrics comparison of existing methods and proposed DR-IAM is shown in Fig. 7 and it shows that, when compared with existing techniques, better F-measure value is produced by proposed DR-IAM based CNN. Same angle polar function cascading at low resolution is shown by adding GLCM and IDCT and parabolic scaling rule is followed for fixing directional bands count. Using this created a discrete decomposition which is faithful to IDCT transform definition.
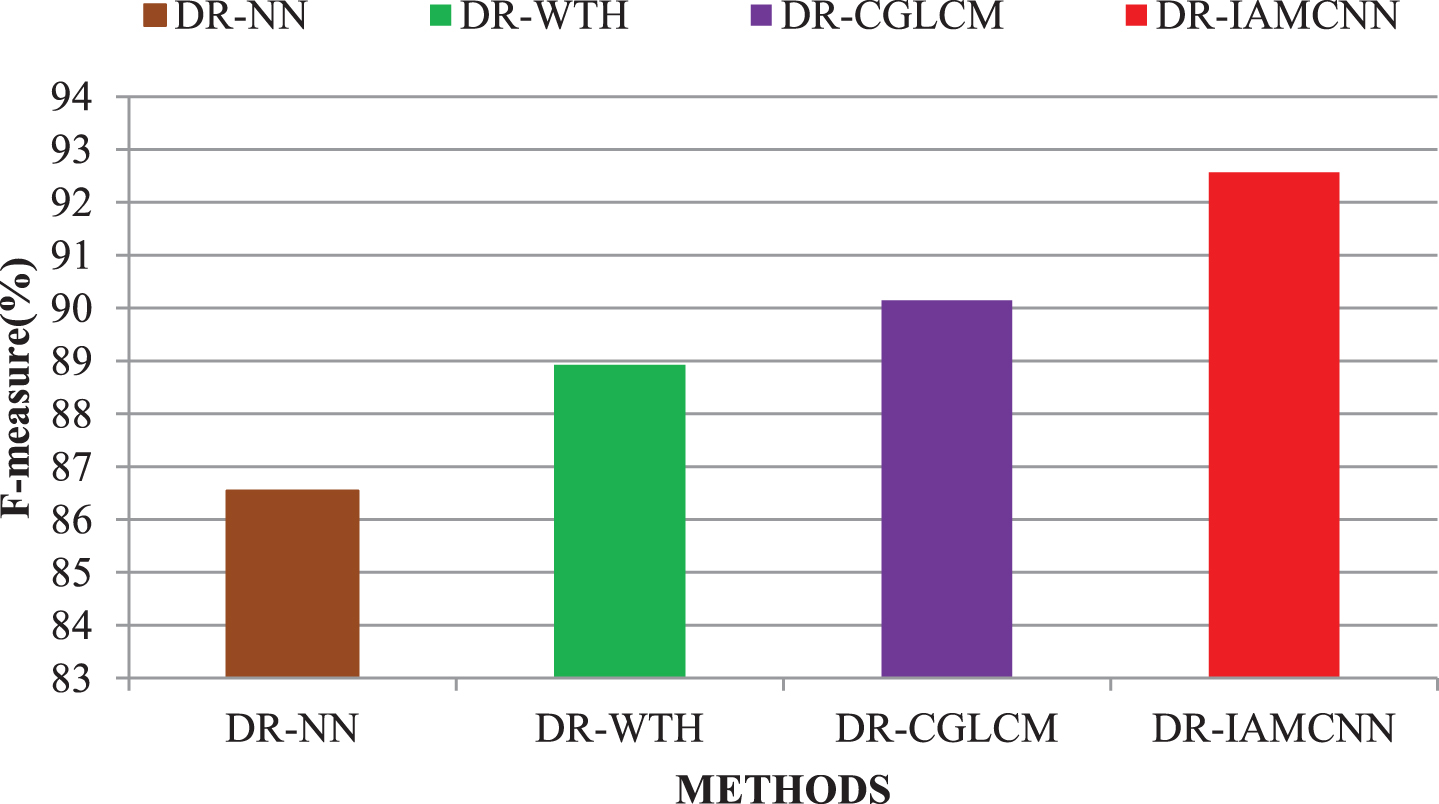
Proposed and Existing Methods F-Measure.
Alexnet CNN architecture based on Structure Cascading Factor is computed for increasing accuracy performance of the proposed method, where, there is an effective tuning for the pixel deviations estimate according to distance for every point. Accuracy metrics comparison of existing methods and proposed DR-IAM is shown in Fig. 8. Around 97.81% accurate results are produced by proposed CNN based on DR-IAN, which is a greater value when compared with the accuracy results of the existing methods taken for comparison.

Proposed and Exisiting Method’s Accuracy Comparison.
Detection and treatment to diabetic retinopathy in early stage avoids severe vision loss of diabetic patients. For diabetic retinopathy patient’s classification, proposed method is aiming to provide optimum solution based on disorder severity. Classifier performance is enhanced by proposing IDCT-GLCM in this work. When compared with existing transforms, various advantages like easy implementation, hierarchical data structure and low redundancy ratio are exhibited by this technique. For addressing problems in classification and providing better accuracy, recent and efficient Deep learning methodology is used. In improved AlexNet lower layers, one or two convolutional layers are added to verify proposed DR-IAM based CNN’s performance depth effect. Structure cascading factor is utilized by AlexNet model. Large factor is decomposed into two small factor cascaded symmetric structure in improved AlexNet model. The proposed improved Alexnet architecture performance is evaluated with respect to performance metrics like F-measure, recall, precision and accuracy. There is a significant enhancement in improved AlexNet model performance as indicated by results of experimentation with around 97.81% of classification accuracy, which is greater than existing model’s accuracy in diabetic retinopathy detection. Future improvements will build on these successes to further reduce the risk of vision loss and will lead to early diagnosis and less invasive treatments.