
Abstract
The uncertainty issue in real-work optimization affects the level of optimization significantly. Because most future uncertainties cannot be foreseen in advance, the optimization must take the uncertainties as a risk in an intelligent way in the process of computation algorithm. Based on our risk-sensitive filtering algorithm, this study adopts a model-predictive control to construct a risk-averse, predictable model that can be used to regulate the level of a real-world system. Our model is intelligent in that the predictive model needs not to identify the system parameters in advance, and our algorithm will learn the parameters through data. When the real-world system is under the disturbance of unexpected events, our model can still maintain suitable performance. Our results show that the intelligent model designed in this study can learn the system parameters in a real-world system and minimize unexpected real-world disturbances. Through the learning process, our model is robust, and the optimal performance can still be retained even the system parameters deviate from expected, e.g., material shortage in a supply chain due to earthquake. When parameter error risks occur, the control rules can still drive the overall system with a minimal performance drop.
Introduction
The upstream and downstream of the supply chain cannot be integrated easily because of their conflicting objectives [1]. Stochastic demand in the market affects the ability of suppliers and gives pressure from changes in production and inventory over time. Therefore, the interaction among the members of the supply chain is a dynamic system that changes and develops over time. Supply chain management aims to optimize and improve the efficiency of the entire system. However, this objective cannot be achieved easily because complex network relationships and uncertainties can be found in all links. Thus, the overall supply chain performance is directly or indirectly reduced because of unanticipated situations, which results in tangible or intangible losses of enterprises. Therefore, uncertain factors are likely to extend the whole supply chain manufacturing network. This outcome is unavoidable, so we must control and manage the supply chain by understanding uncertain factors [2], using innovative methods, and adjusting production capacity to achieve various goals of the supply chain. We can also ensure the competitiveness of companies because customer orders are satisfied accurately and in real-time [3].
Many products are characterized by a short life cycle, which is necessary to seize the opportunity to join the market and meet market demands such as seasonal clothes and accessories, smartphones, and electronic products. In such a case, all suppliers in the supply chain must have the ability for Quick Respond (QR) to reduce lead time and improve supply flexibility [4]. Although the order-taking process is always consistent and arranged carefully, it may still cause upstream and downstream manufacturers to face shortage or overage because of the changes in terminal demands or the direct and indirect effects on-site productivity. Thus, a model-predictive control (MPC) [5, 7] has been developed and widely applied in inventory control systems. Given the advantages and characteristics of this method, the estimation technique of status parameters and optimum control is applied to construct proper dynamic program modes and controller parameters that can predict the system output.
The MPC method can achieve the default control goal effectively, but the best solution is obtained under a designed supply chain system model. If the supply chain behaviour or dynamic supply chain system model is incomplete or inconsistent with the existing system, the best solution in the actual system may not even be a feasible solution. This situation results in an error, which in turn weakens the performance of the original solution of the supply chain. Thus, we also apply a risk-sensitive method to improve MPC and enhance its performance [8]. The risk predictive order control system for the supply chain is constructed to observe the input change in the economic entity of each stratum. It can predict and analyse the output of the order control system and identify the appropriate order control strategy for the supply chain system to maintain the inventory in a three-echelon supply chain near the safety stock curve. Thus, the system can achieve robustness through risk aversion and afford error even if the model establishment is imprecise, incomplete, and inconsistent with the real-world system, thereby achieving optimal ordering policy.
Supply chain production strategies are generally composed of push and pull, which are mainly based on forecasted or actual customer demand [9]. Traditionally, the push production strategy is usually adopted to implement production management, whereas production prediction is based on a long-term prediction. Manufacturers usually predict customer usage based on orders received from retailers, and then implement production plans according to speculated demand data, such as material requirements planning. Whenever market demands change, a long lead time is required to respond to changes in the market [3, 10]. Also, errors under multiple adjustments can be caused easily by demand prediction, such as the bullwhip effect. A supply chain based on a pull production strategy is demand-oriented and can respond rapidly to actual customer needs. Production is based mainly on the needs of actual customers instead of predicted data. Members adopt a fast information flow mechanism to transfer customer needs, such as a POS system that can support retailers to cope quickly with customer needs. However, it is difficult to perform correctly unless the various prerequisites of this system are implemented correctly [11], such as process design, operation standardization, smooth production, consistent quality. Our model proposes robustness to predict risks. Thus, it can help both production types in terms of minimum potential issues, shortening lead time, reducing inventory for push-type, and enhancing efficiency for pull type.
In a network of production facilities, safety stock placement is determined at the network level to hedge against uncertainty to provide customers with the promised service level [12, 13]. Inventory shortage in production results in stock losses, loss of sales, production bottlenecks, and low customer satisfaction. In contrast, inventory overage results in enterprise loss because products must be sold in discount or scrapped in no value. Therefore, the inventory control strategy must consider the interaction between the upstream and downstream in the supply chain to implement a dynamic, safe stock adjustment [14] and achieve optimum control. Also, the inventory control of supply chain members usually adopts EOQ, periodic, order point [15, 16], but these methods are limited due to mathematical programming for inventory [17, 18]. To face the inventory issues and model limitations as mentioned above, we add uncertainty to consideration to face market demand or production. This study uses the concept of system control theory to design the inventory model in the supply chain. Thus, it can handle unstable market demand in the function of real-time response and prediction and maintain inventory near the safety stock curve.
Unlike previous studies, this study aims to identify the best order strategy based on the order and consumer needs by precise prediction. In the inventory model, the previous inventory is used to predict the inventory of the next period. The safety stock standard and optimization objective function are applied to minimum error to obtain the best order strategy to solve problems on inventory overage or shortage. Our risk-sensitive filtering establishes the theoretical background and methodology in Section II, then develop the model in Section III. Experimental simulation is performed in Section IV to verify our model feasibility. We also summarize our study, contributions, managerial implications, and suggestions for future researches in the last Section.
Theoretical background and methodology
Kalman filter theory is well-known and can estimate the status value of the dynamic system in real-time and predict the state of the next period. Past collections or measurement data do not need to be saved. The method can also correct parameters and predict output values in real-time in the process of calculations [19, 20].
The concept of risk-sensitive filtering is similar, but the major difference is that uncertainty exists in the system model of risk-sensitive filtering. Given a discrete-time state system, if the internal state cannot be measured, then the observed values can be used to estimate the internal state of the system. The Gauss-Markov linear system is shown in the following equation:
If the model is known, then the estimate of the internal state is just like that of an optimal filter, which is just the same as the Kalman filter. However, if the model is uncertain when the model
Risk-sensitive filtering is estimated as:
where
In Eq. (4), J
k
(ω) refers to the cost function of risk-sensitive filtering, which represents the system performance in the risk and cost estimator; θ is a risk-sensitive parameter, which must be more than 0 due to risk aversion;
Kalman and risk-sensitive filters aim for minimum variance estimation to obtain the best estimate. However, the Kalman filter estimate must be established under a premise regarded as a real environment system in a fixed model, whereas a Risk-sensitive filtering estimate is not required to be in such condition. In other words, a risk-sensitive filtering system allows the model to exist uncertainty. In many real cases, the dynamic parameters of the system are unknown or changing, and the disturbance features of the noise are also unknown. That is, the measurement system comes with measurement error, and the noise is under change over time. The performance of the Kalman filter sharply reduces once the disturbance feature of the noise deviates from the original hypothesis. In the environment with an uncertain system, Ford (1999) [21] pointed out that a risk-sensitive filter is more suitable than KF. Moreover, the final simulation result shows that the measurement estimated cost of the risk-sensitive filter is small, which indicates good performance. Therefore, we explore the system uncertainty by adding the concept of risk-sensitive filter, so that the robustness of the system is enhanced than previous studies on ordering and inventory management.
Model foundation and hypothesis
This study explores a supply chain environment for the three-echelon production process, including tier-1 supplier, tier-2 supplier, and OEM manufacturer. Push and pull production strategies are adopted to observe the relationship and various problems between the three-echelon supply chain on order, inventory, and order fulfilment.
Figure 1 shows the relationship between three-echelon logistics in the established risk- predictive order control system and information flow. In the figure, we extend the model developed by [23] that three circles respectively represent the order controller of the three-echelon production procedure under the control structure. This controller is used in this study to properly control order strategies in all echelons so that their inventory quantities are maintained in the safety stock curve and avoid shortage. In the figure, the dotted line is used to represent information flow. In each production flow, the intelligent controller is used to consider the order demand in the downstream and the warehouse inventory and the order release to the upstream. The solid line represents logistics. Based on the downstream order demand, the factory sends the finished products from the warehouse to the customer at the next tier.
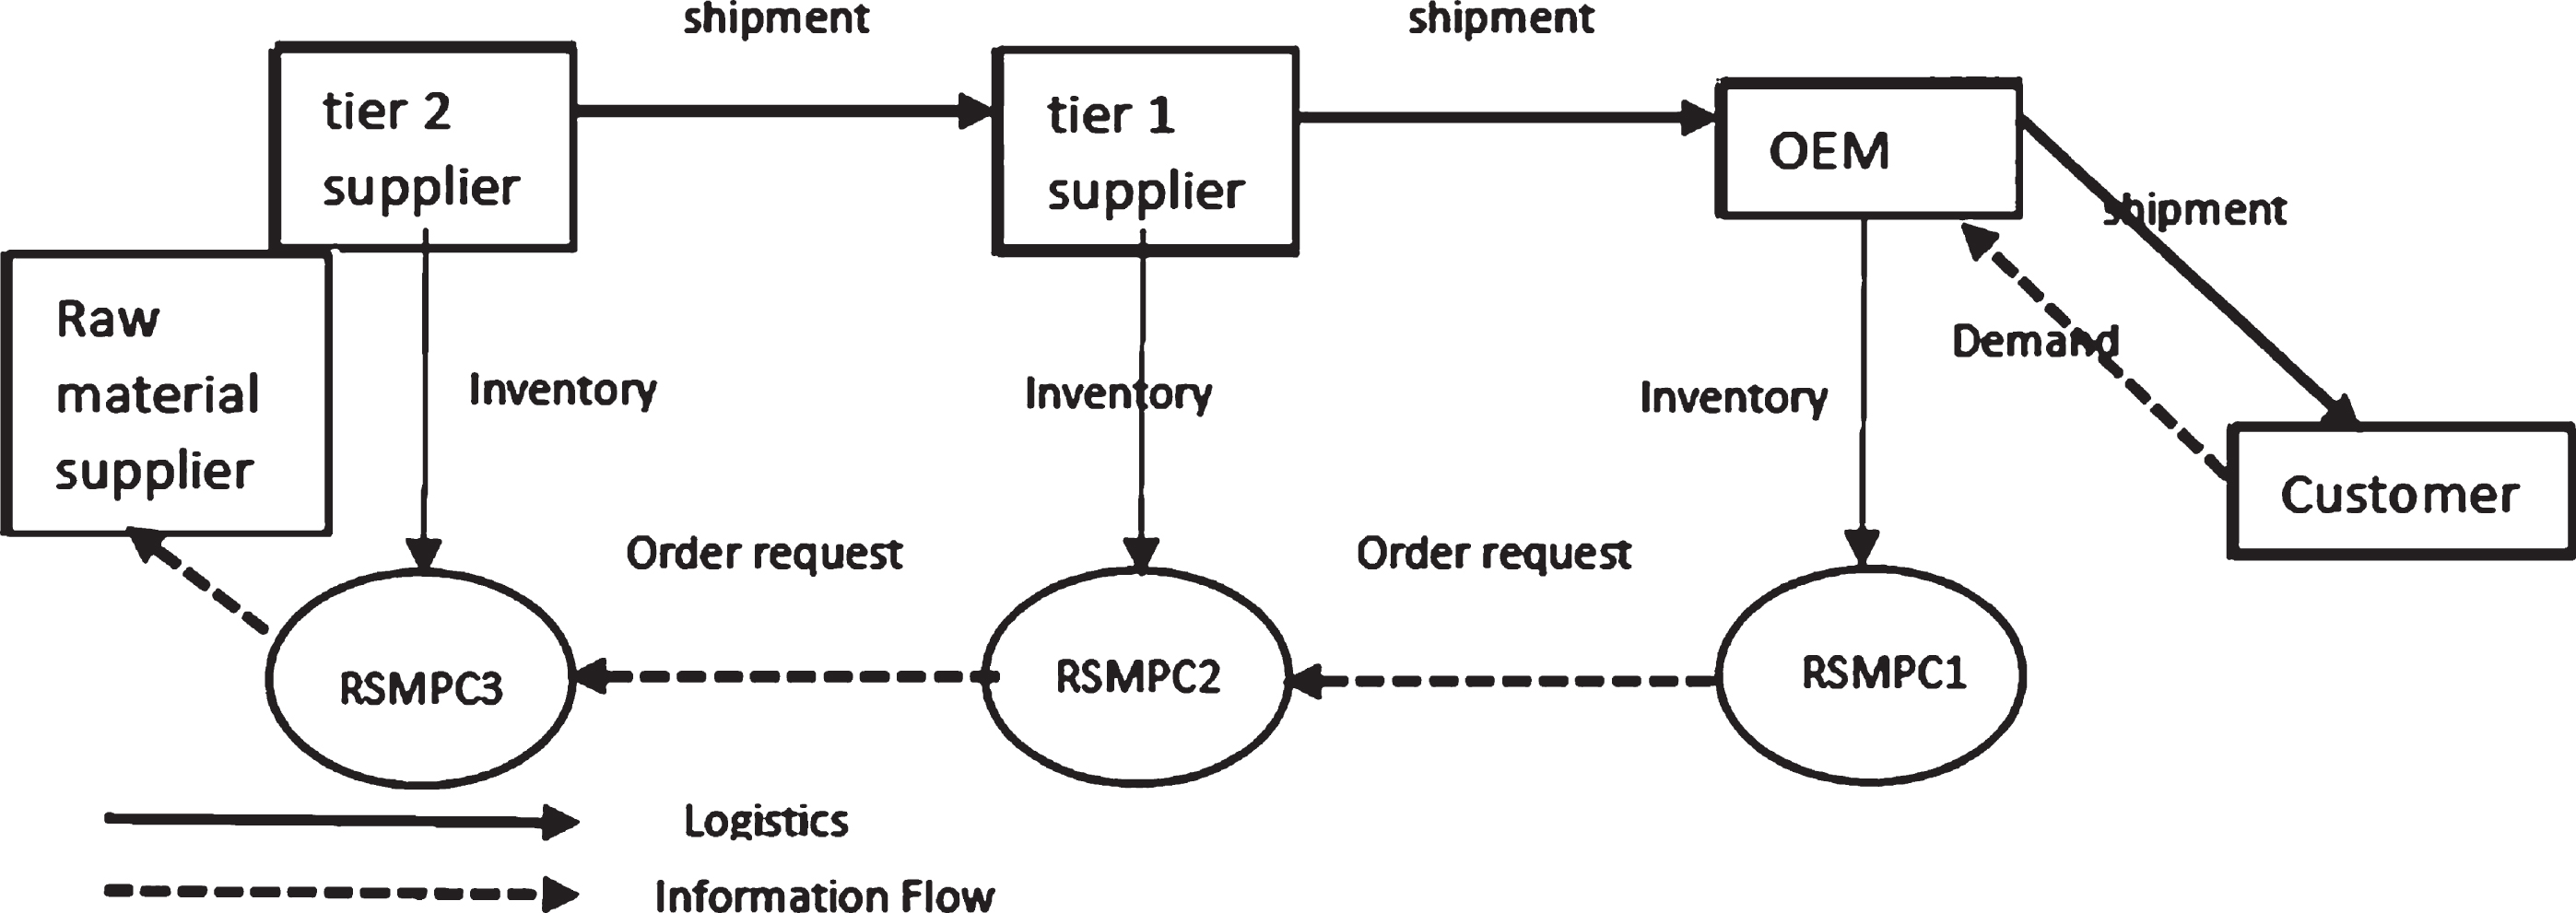
Three-echelon chain logistics and information flow.
The model assumes that
1. Each order is regarded as an independent system model represented by state equation and transfer function. System time is constructed in the discrete-time domain.
2. Factors include inventory quantity, order quantity, and shipment at each tier. Other factors, such as transportation time, logistics distribution, cost, or factory machine equipment, are assumed to be in the best state in this study and can be studied in the future.
For model development, risk-sensitive filtering is used to construct a risk predictive order control system in the supply chain at each tier. Changes in the previous input of each economic entity are observed using the characteristics of MPC, such as stable, no error, and perfect control. Thus, historical inventory data and order control can be observed in all echelons in the past and can be used to estimate and predict the inventory near the safety stock curve. Therefore, real-time shipment can be reached to meet the demand of downstream orders to solve excessive stock or short supply in the supply chain. We also explore the precision of the model hypothesis. The controlled objective function of the risk-predictive order control system designed in this study shows risk factors; that is, the three-echelon supply chain model is inconsistent with the actual supply chain in the environment system. We analyze the properties of the risk predictive order control system and the mode predictive order control system in previous studies and compare their performance. The three-echelon supply chain predictive order control system architecture is shown in Fig. 2.

Risk aversion model predictive order control system architecture in a supply chain.
This study is based on the concept of the state-space formulation system inventory model designed by previous scholars [24–26]. The plant model of the three-echelon supply chain is constructed using the discrete state equation as the inventory model for each tier, as shown in Eqs. (8), (9), (10), (11), and (12), are the model constraints.
The inventory system model is given as follows.
i = 1, 2, 3 refer to the second-order supplier, first-order supplier, and OEM, respectively.
Equations (8) and (9) show the inventory model of each tier. x i (k) is a 2×1 vector, which is the internal state of the system and cannot be observed externally. Internal state xi1 (k) represents the inventory of finished goods at time point k. xi2 (k) represents the inventory of work in process (WIP) at time point k. This system model considers the inventory state of the factory in the current period. Thus, product inventory in the factory during the current period (k) can be determined by the inventory (k-1) and the order quantity decided in the last period minus the demand of downstream customers in the last period. The actual delivery in the current period does not necessarily meet the needs of downstream customers. Therefore, x i (k) maybe negative, which means the inventory cannot meet the needs of downstream customers.
In addition to the state system design, this study constructs the inventory model at each tier in the supply chain with the transfer function. In control theory, Laplace transform must be conducted for transfer function in the time domain if the system is constructed in the type of continuous-time. This process builds the model and develops the relationship between input and output in the s domain (or Laplace s domain). The research model is constructed in the form of discrete-time. Therefore, z-transform is used to transform the model into the z domain as well as to facilitate model construction.
The input signal of the system is u (k) and the output signal is y (k). The relationship between input and output in the time domain can be represented by convolution:
where
Equation (16) shows the transfer function, which is constructed to describe the characteristics of the system model. Figure 3 also shows the block diagram of transfer function G (z).
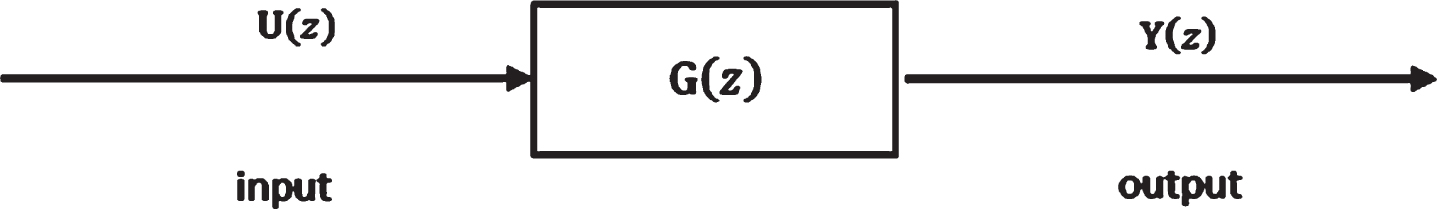
Block diagram of the transfer function.
Motivating by the inventory system model in [27], we improve and develop the supply chain inventory model further. In this model, I (z) is used to represent the inventory; input U (z) of the inventory system model refers to order and demand represented by O (z) and D (z), respectively; U (z) refers to a two-dimensional vector.
Figure 4 shows the block diagram of the supply chain inventory system model and variables used in this model are listed as follows.
I: Inventory
O: Order quantity
D: Market demand
L: Production lead time
Direction from O (z) is positive because ordering increases inventory, and direction from D (z) is negative because market demand decreases inventory. Blocks z-1 and z-L are shift operators in the control representing time delay; block
In Fig. 4, the inventory model in the supply chain at all echelons is represented by the following:
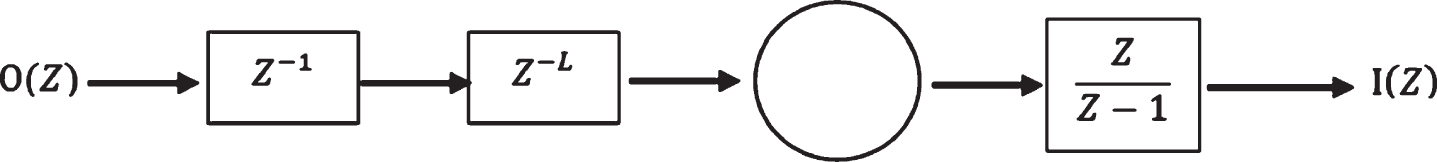
Block diagram of the supply chain inventory system model.
The transfer function of the inventory system can be represented as follows.
We searched for optimal parameters through system identification based on the inventory system model established in the previous Section. A total of 500 time-series data of
The initial data transferred to the z domain are used for comparison with the inventory system model. Y
g
(z) and U
g
(z) are first transformed to the data pattern of identification. The least-square method is used to evaluate the optimum parameter values. In this equation, L is used as an integer.
MPC is combined with risk-sensitive filtering to explore the three-echelon supply chain inventory and order control. Model predictive control is a control algorithm based on the prediction model. Historical input and output values are created to construct the predictive model of the MPC controller to predict the future output. Intelligent risk-sensitive filtering MPC is similar to MPC in terms of the objective of the operation. However, IRSMPC is more conservative than MPC in deciding strategies and considers model uncertainties. Moreover, θ is a risk-averse parameter in the cost function.
Figure 5 shows the control policy architecture of the IRSMPC controller in the system. Formulas

Control policy architecture of IRSMPC controller.
The order control strategy calculus process of the supply chain is shown in Fig. 6 in the appendix section. A three-echelon supply chain system environment is first designed to establish the inventory model in all echelons based on State Space and Transfer Function. The IRSMPC controller is designated as the order control system based on the established inventory model. Demand patterns in the supply chain are set before the experiment. These patterns are pull-demand (MD) and push-demand (UD) strategies. The standard for safety inventory in all echelons is set as η to calculate the predictive model. The first goal of this model is to estimate the internal inventory of the system and then solve the optimal order function.

Calculation process of order control model.
Matlab is used to construct the order control system for the supply chain. A simulation experiment is conducted for the MPC and IRSMPC systems to determine the optimal order control. This process ensures that all members of the supply chain maintain their inventory near the safety inventory level. The efficiency of the MPC and IRSMPC controllers is examined and compared simultaneously.
Experiment design
We use “day” as the unit for this experiment and simulate a total of 100 data in each experiment. A safety inventory level of 1 (k cartons) is set in each experiment to observe whether the actual inventory in all echelons is maintained near the safety inventory level. We use impulse and the Step Function pattern as test functions against the design of customer demand (d3) in the final assembly plant. Pull and push types are set against the demand (D) forecast of each tier use for their downstream customer. Variables are set as MD (measured disturbances) and UD (unmeasured disturbance). MD means each tier sends real-time feedback of its actual demand for the materials to the upstream. UD means all echelons must predict demands by themselves. The simulation performance of all echelons is represented in Eq. 23 by the square error (MSE) of the inventory level y
i
and safety stock standard η in each tier to compare the difference between the performance of IRSMPC and MPC. The experiment shows that the risk-averse order control system is more robust than the model predictive order control system, which tolerates system error to obtain better performance.
The primary purpose of this study is to design an IRSMPC system that can tolerate risk in the system. Thus, situations of the system model and the actual environment system are discussed. One situation assumes the designed model conforms with the actual environmental system (model-accurate). In contrast, the other indicates that the designed model does not conform to the actual environmental system (model-mismatch). The model is assumed to be inaccurate (to suffer inventory risk), to compare the performance of IRSMPC and MPC systems.
First, the experiment is conducted against the designed state-space system model. Second, the simulation experiment is conducted against the transfer function system model but only under the model-mismatch situation to test the extreme ability of the system. We assume a serious situation in model-mismatch so that the model is out of control under an extremely inconsistent situation. We then test the performance of IRSMPC and MPC systems. The experimental design is shown in Table 1.
Summary of symbolic description:
Experimental design
Note: Model “A”– model is accurate; Model “M” – model is mismatched.
All echelons in the supply chain denote the order quantity of the downstream as the source of demand information (in the assumed MD and UD types). Therefore, we start the experiment by observing from the downstream.
Eight experiments are conducted for the state space order model. The first four experiments are conducted when the supply chain demand adopts the pull strategy (MD), and the later four experiments are performed when the push strategy (UD) is adopted. Changes in inventory, demand, and order policy in the three-echelon supply chain are observed when models in the designed MPC and IRSMPC order systems.
Results of the eight experiments show that the MSE value is small, and the model performance is better when the function is model-accurate as compared with model-mismatched. Such results also prove the three-echelon supply chain can stabilize the entire production activity when IRSMPC is applied. Because the MSE numbers are small in most modes, thereby ensuring inventory control in the upstream regardless of whether MD or UD demand strategy system is used. The fluctuation of IRSMPC is also smaller than that of the MPC system. Therefore, the risk-averse predictive order control system can stably control the inventory of all echelons with better performance than that of the model predictive order control system. The former is also highly tolerant of risks, such as imperfect and incomplete establishment, inconsistent with the actual system, or incorrect prediction. Thus, interference is the least and robustness is reliable, making the risk-averse predictive order control system the best order control strategy.
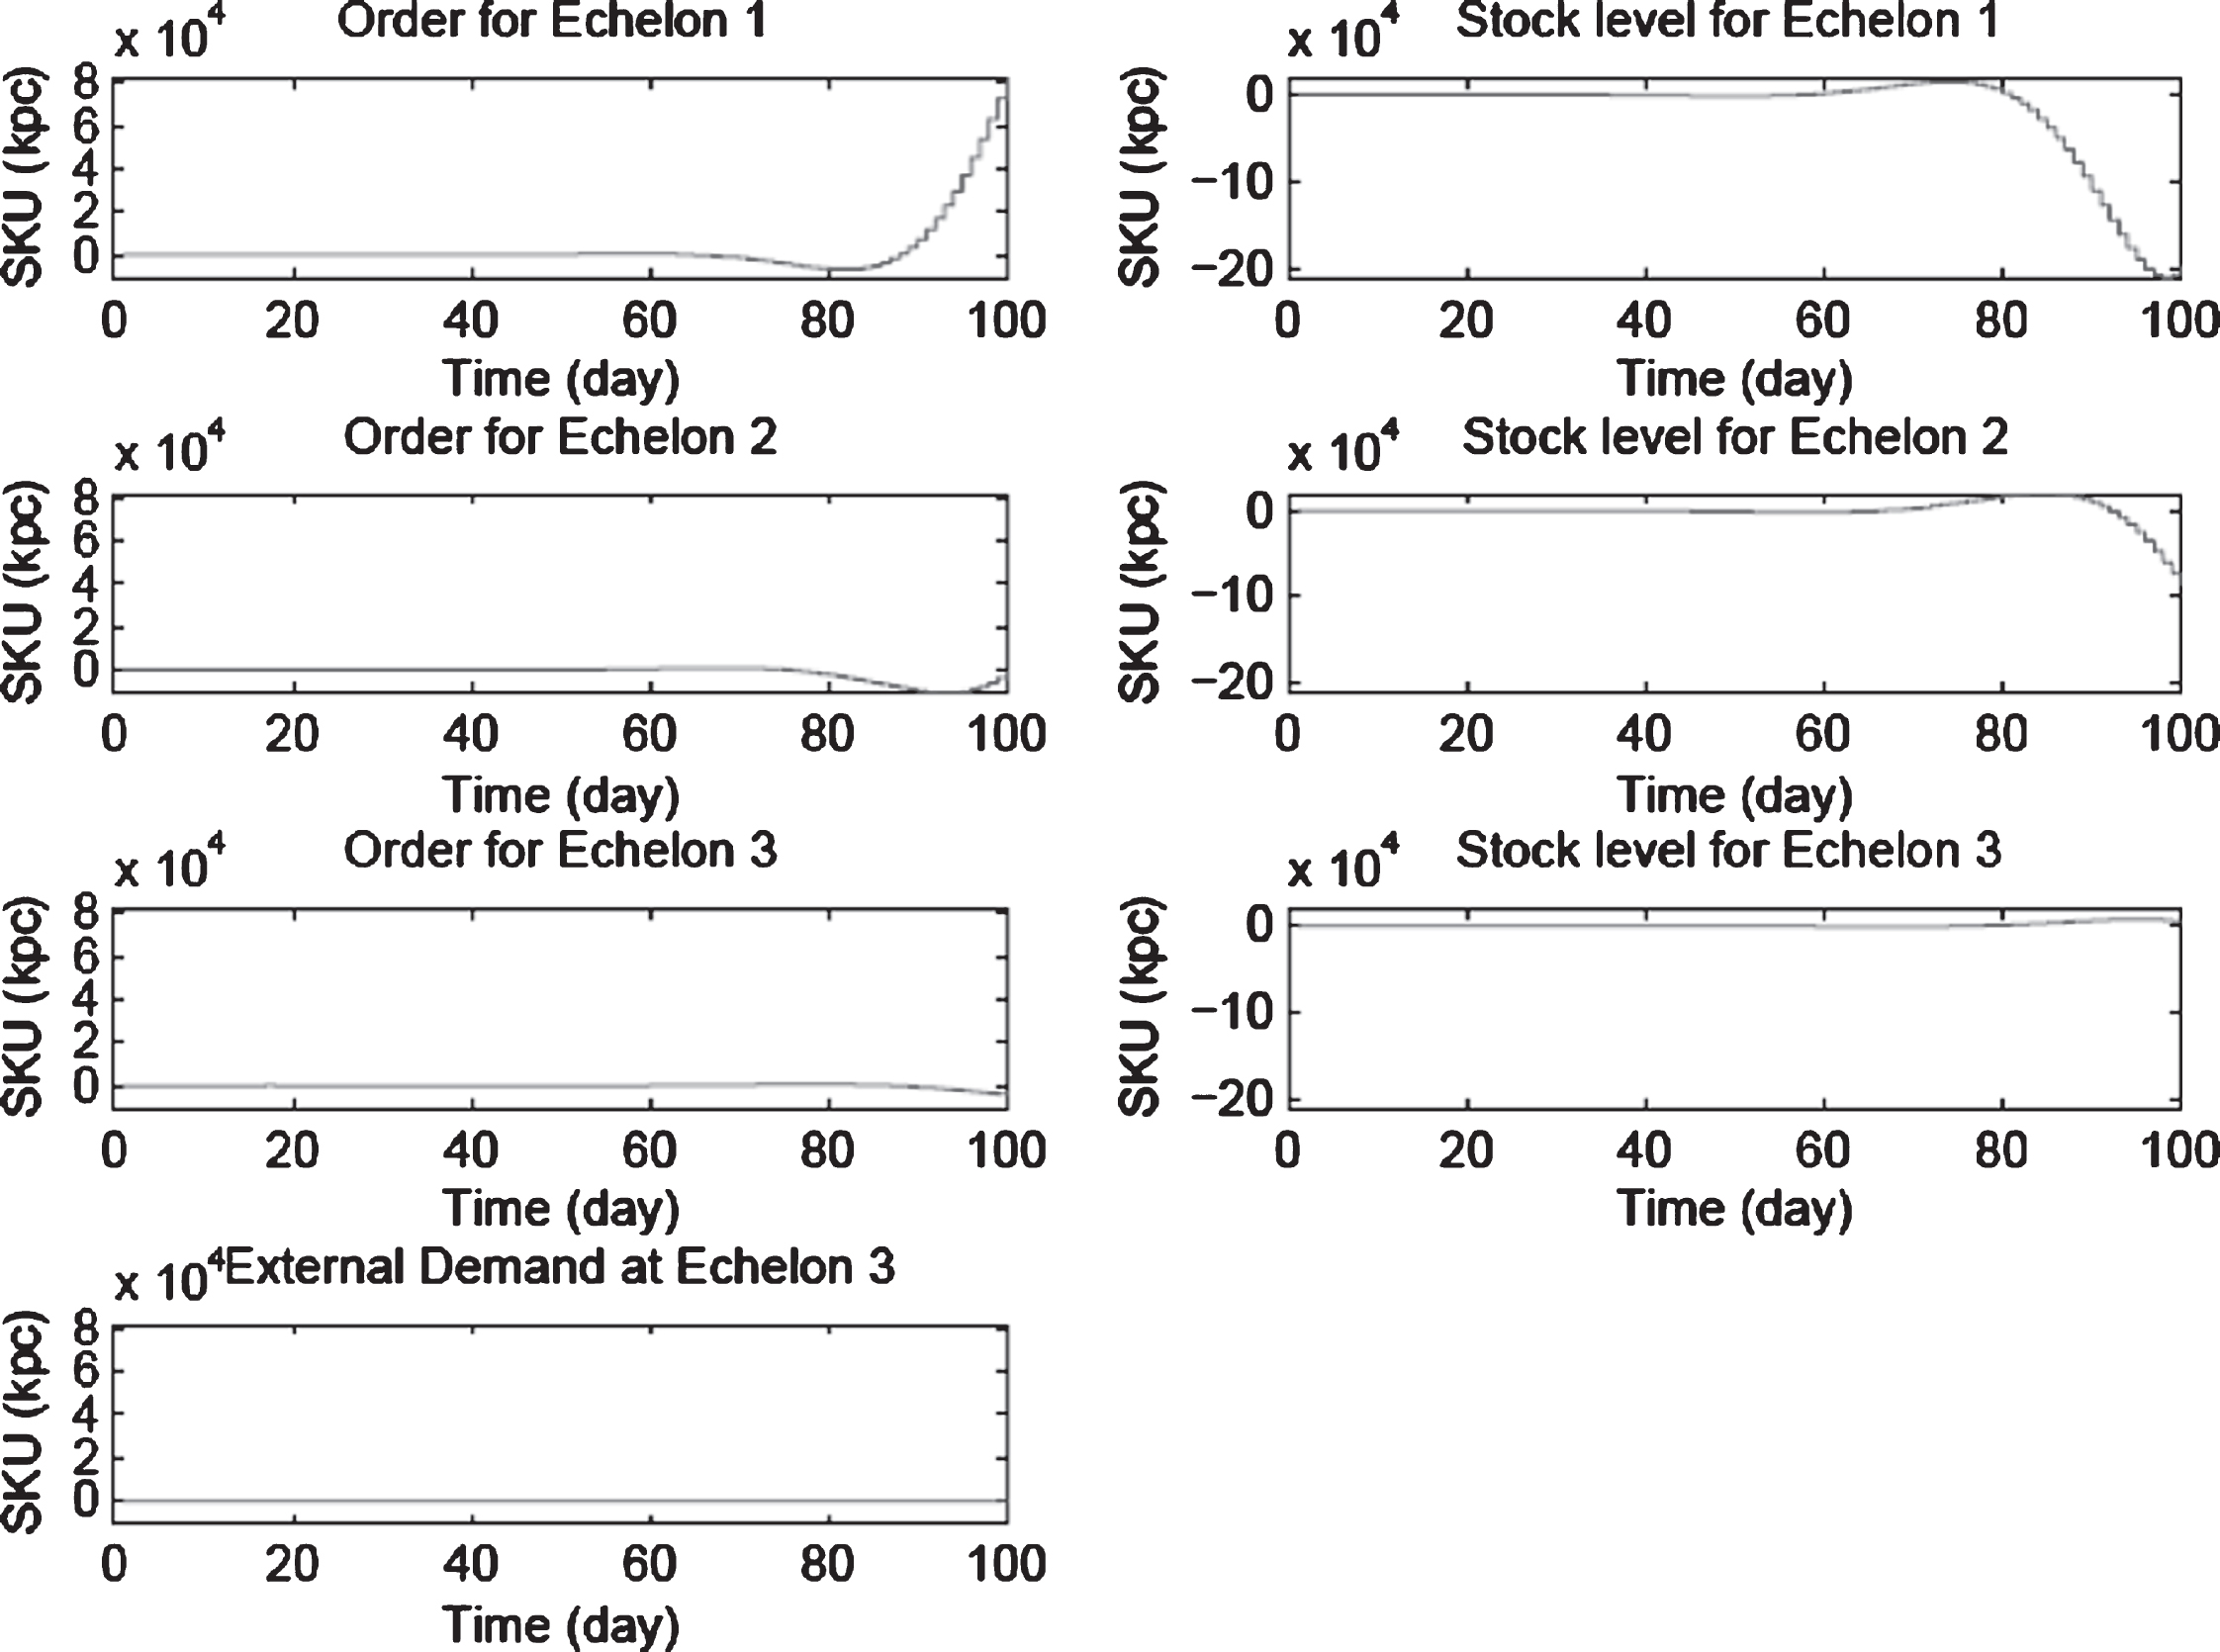
We take configuration 1 as an example of these supply chain simulation results, which are shown in Fig. 7. The curve in a light colour represents the consistency of the design with the actual environmental system. The curve rendered in dark colour indicates the designed model is inconsistent with the actual environmental system.

Simulation results for configuration 1.
The condition design under transfer function representation is based on the experimental objective of the delay model; thus, the system is difficult to control. The primary purpose is to test the extreme ability of the system. In this study, an ARX model is fitted using 500 times time-series data produced randomly as the actual environment system model. We test the extreme ability of IRSMPC and MPC in the extreme model-mismatched case. Given that the fitted ARX model is considerably different from the delay model designed in the study, the supply chain cannot be stabilized significantly at this time through the control system. Thus, we only observe the performance of the OEM echelon to test the capacity of the MPC and IRSMPC. The performance of all calculated echelons is shown in Table 4.
According to the results, the performance of order control system under IRSMPC is better than that of MPC because of small MSE values, regardless of whether a push- or pull-demand strategy is employed. Therefore, the ability of a risk-averse predictive order control system to tolerate inventory risk is again proven.
We take configuration 9 as an example of these supply chain simulation results, which are shown in Fig. 8. The curve in a light colour represents the consistency of the design with the actual environmental system. The curve rendered in dark colour indicates that the designed model is inconsistent with the actual environmental system.
Simulation results for configuration 9.
In existing studies, optimization was characterized by stable properties, perfect control, and absence of error. MPC can achieve default control goals effectively if everything goes as expected in the real applications. However, suppose that the assumed supply chain model is insufficient and incomplete, a significant error that causes a vast difference between the performance of the best solution of the original supply chain and the actual performance will plummet. To establish an improved inventory control system, we use risk-sensitive filtering and MPC to compensate for the shortcomings of MPC and enhance the robustness. Second, previous studies on inventory using supply chain mode predictive control are discussed in a single model. We develop a new model using machine learning fitting method. The designed IRSMPC system is more tolerant of inaccurate system establishment risks than the traditional MPC system.
Finally, the simulation results can verify the risk-averse predictive order control system. Its performance is better than that of MPC regardless of whether push or pull demand strategies are used. In terms of risk inconsistency between the IRSMPC model and the actual environmental system, the difference between MSE values and the original model-accurate MSE is smaller than that under MPC condition. That is, IRSMPC performance can tolerate the error of inventory risks. Thus, this approach is considered an optimal order control policy.
Future studies may consider other conditions in the supply chain, such as distribution, cost overflow, machine capability, or resource issue. The complexity of the supply chain design may be improved, and network supply chains or multiple product combinations can be discussed. Advanced nonlinear models can be considered in the future.
Footnotes
Acknowledgments
This work was supported in part by the NPUST-KMU JOINT RESEARCHPROJECT, (#NPUST-KMU-109-P009). The authors also thank to the Ministry of Science and Technology, Taiwan, R.O.C., under Grant Numbers MOST 109-2410-H-992-018-MY2 and MOST 109-2221-E-037-005, and the “Intelligent Manufacturing Research Center” (iMRC) from the Featured Areas Research Center Program within the framework of the Higher Education Sprout Project by the Ministry of Education (MOE) in Taiwan, R.O.C.