
Abstract
Online Distance teaching for multiple smart classrooms by famous teachers, as an effective solver for the problem of lack of excellent teachers, has become a new popular teaching mode. However, one of the key problems to be solved urgently for this teaching mode is how to monitor children’s class status and effectively feedback their listening standing to teachers. Installation of intelligent pressure cushion on the chair of smart classroom to monitor children’s classroom state can be a powerful way to improve teaching effectiveness for the online distance teaching mode. This paper presents a new method for monitoring children’s classroom behavior based on intelligent cushion, which can identify basic children’s classroom behavior by classifying the original intelligent cushion pressure signal and evaluating the effectiveness of the classifier. To be concrete, the present method uses intelligent pressure cushion to collect data and denoises the original data by digital filter, and then extracts the time-domain and frequency-domain features of time-series pressure signals based on sliding time window. Finally, it uses machine learning to identify children’s status. In addition, by feature selection to reduce the data dimension, integrating different classifier to classify the extracted features, the efficiency of the present method is greatly improved.
Introduction
Education is the cornerstone of human development, and education for children is even more important. How to improve the quality of children’s education is still a key concern of education. The “double teacher” education model can just improve the quality of education to a certain extent.
The “Double Teacher” mode is a new online teaching mode that has been very popular in recent years. In this way, the lecturer is a famous teacher with rich teaching experience. There are 4-5 classrooms in the class, and about 20 students in each class. They are online through the Internet. The whole class listens to the lectures by the famous teachers. Each classroom is equipped with a separate teacher to supervise the classroom discipline and answer questions for the students.
In such a classroom, the student’s listening state is more difficult to supervise than the traditional classroom, because the teacher is not standing on the teacher’s podium, but on the screen. Therefore, it is difficult for students to focus on their own attention to the lecturer. Moreover, children’s minds are not fully developed and mature. There will be many meaningless behaviors in class, such as walking and sleeping. In addition, it is difficult to study children’s behavior research with adult thinking. Therefore, how to effectively supervise the children’s listening state is also an urgent problem to be solved in the “double teacher” mode.
There are two general methods of supervising children in traditional classrooms. The first is the teacher’s personal supervision, but the teacher’s judgment on the state of the children’s lectures requires the accumulation of experience, which leads to low classroom management efficiency. The latter one relies on video surveillance. Video surveillance can only be applied in traditional classrooms, and it is fixed and very inconvenient. However, video surveillance is limited by the angle and clarity of the camera, and the same needs people to identify and judge, so the accuracy of monitoring and supervision is not satisfactory. The pressure cushion is an analysis of the change in the child’s sitting posture pressure data. Even if it is not directly observed, the child’s listening state can be accurately recognized by the change of the child sitting posture pressure value.
Wang Yongmei et al. used temperature sensor and heart beat sensor to collect children’s behavior data, and proposed a HMM parallel model structure to analyze and identify children’s behavior.
Yuan Lili developed a level of attention test software, which first presets the six initial sitting postures, then collects the student sitting class sitting data, uses SPSS software to perform statistics, and compares the similarities and differences between the preset values and the collected values. In this way, the identification of the student’s sitting posture is completed.
Recently, Huayuan University of Science and Technology, Yan Yuanyuan, released a research method that uses early warning values to analyze children’s physiological indicators. According to the early warning indicators, new children’s physiological data can be directly analyzed and the results obtained.
In addition, domestic research on children’s issues is basically still using questionnaires to organize effective questionnaires, and then use SPSS software for statistical analysis. Or directly in the hospital’s database to call a case of a child’s abnormal disease directly for statistical analysis. Or use the observation method to record and analyze the behavior of some children for a certain period of time, and then draw conclusions.
Kathleen B. Aspiranti used a multi-baseline design approach to study the destructive behavior of autistic children in independent primary school classrooms using a color wheel system.
Veenman and Betty used random control group generated by online database search and random effect meta-analysis to analyze the influence of age, gender and intervention time on children’s destructive classroom behaviors.
Graziano used a rating scale to collect students’ classroom behaviors, and constructed a growth curve model to analyze children’s personality traits, thereby explaining differences among children with disruptive behavior disorders.
Bowling adopted mixed effect logistic regression to study the relationship between exercise in school and students’ classroom performance, and finally came to the conclusion that students’ self-regulation ability and classroom performance would be better if they did aerobic exercise on time.
Veenman, Betty used a randomized control group generated by an online database search to analyze the effects of age, gender, and intervention time on destructive classroom behavior in children using random effects meta-analysis.
Graziano uses a score sheet to capture students’ classroom behavior, constructs a growth curve model to analyze children’s personality traits, and uses this to explain the differences between children with destructive behavioral disorders.
Bowling uses a mixed-effects logistic regression to study the relationship between exercise and student performance in the classroom, and concludes that students who do aerobic exercise on time have better self-regulation and classroom performance.
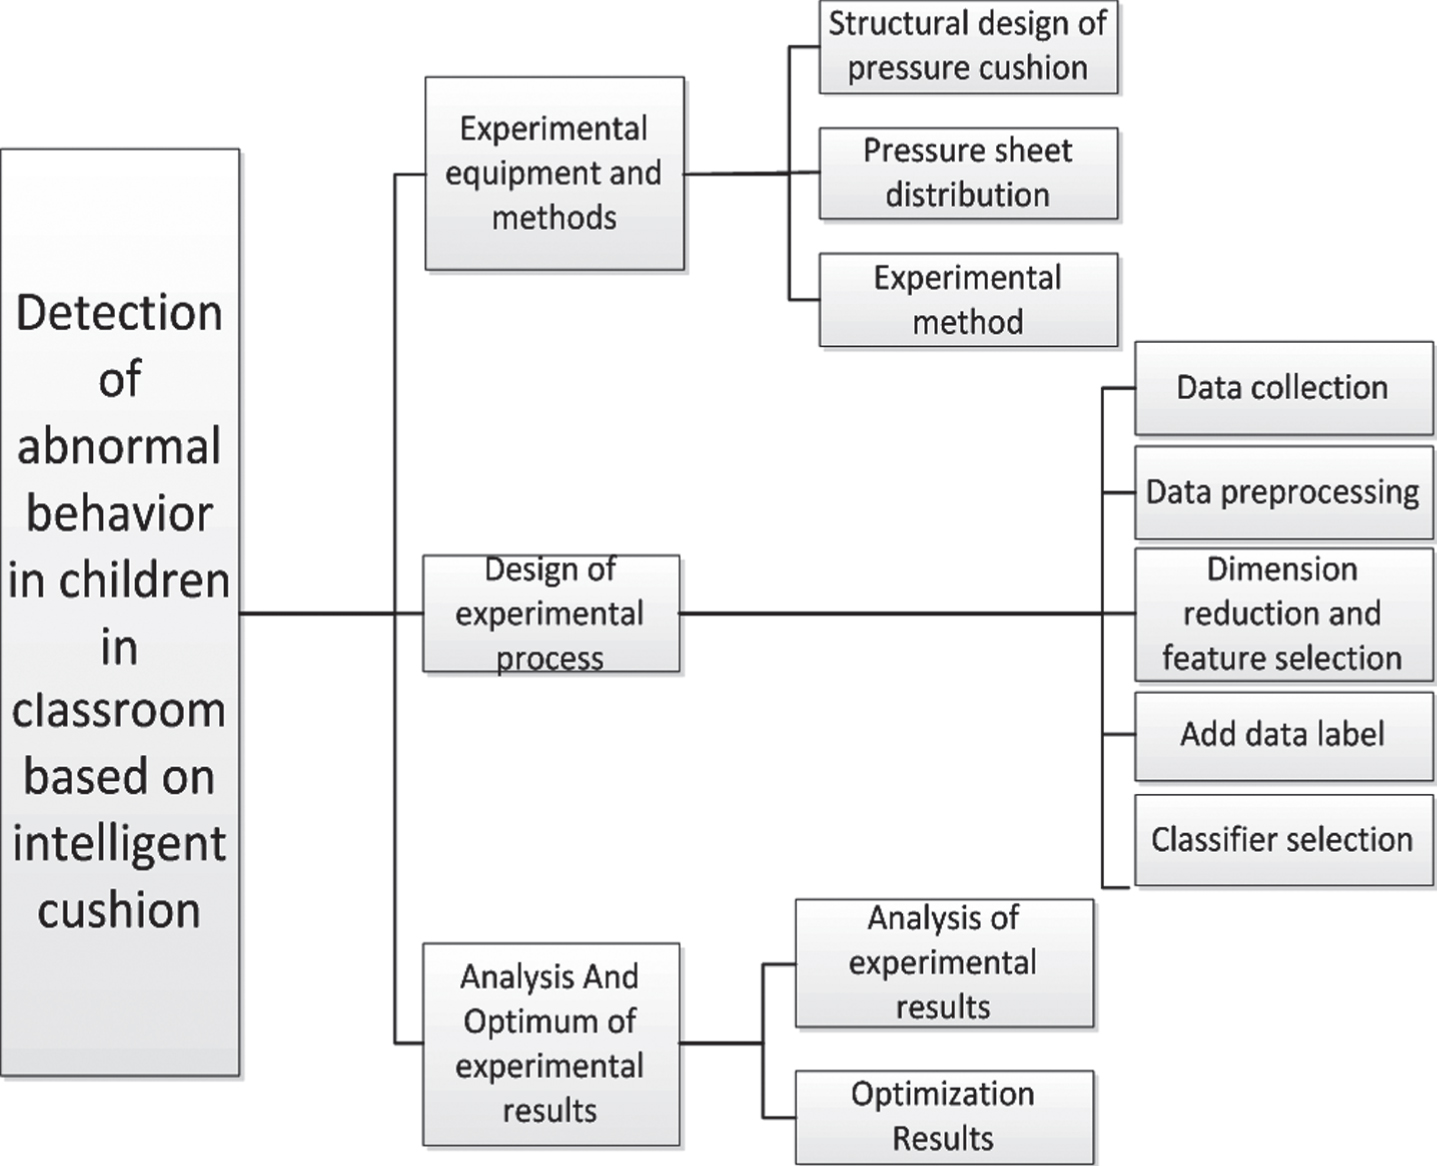
In this study, the pressure cushion was used to collect the sitting pressure values of the children during the lectures to classify the children’s classroom behaviors, and the current state of the children’s lectures was obtained. This is a kind of classroom supervision mode with hidden and high efficiency for the new type of network teaching and the “double teacher” classroom education mode. It can also be used as a teacher-student interaction mode in the classroom. The system can feed the child’s current class status to the teacher. Teachers can adjust their lecture content and course duration based on the feedback they receive as Fig. 1. In addition to this, the method has other meanings in application:
This method greatly reduces the cost compared to conventional video surveillance. Both in terms of materials and subsequent maintenance, there are great advantages. Through this system, teachers can judge the state of children’s classroom lectures, and change their teaching methods accordingly, so that children have more interest in listening to classes, and ultimately improve their teaching level. Through the system, a database of children’s classroom behavioral stress can be established. It is able to record the sitting position of the child in the classroom and can be applied to other fields.
Design process.
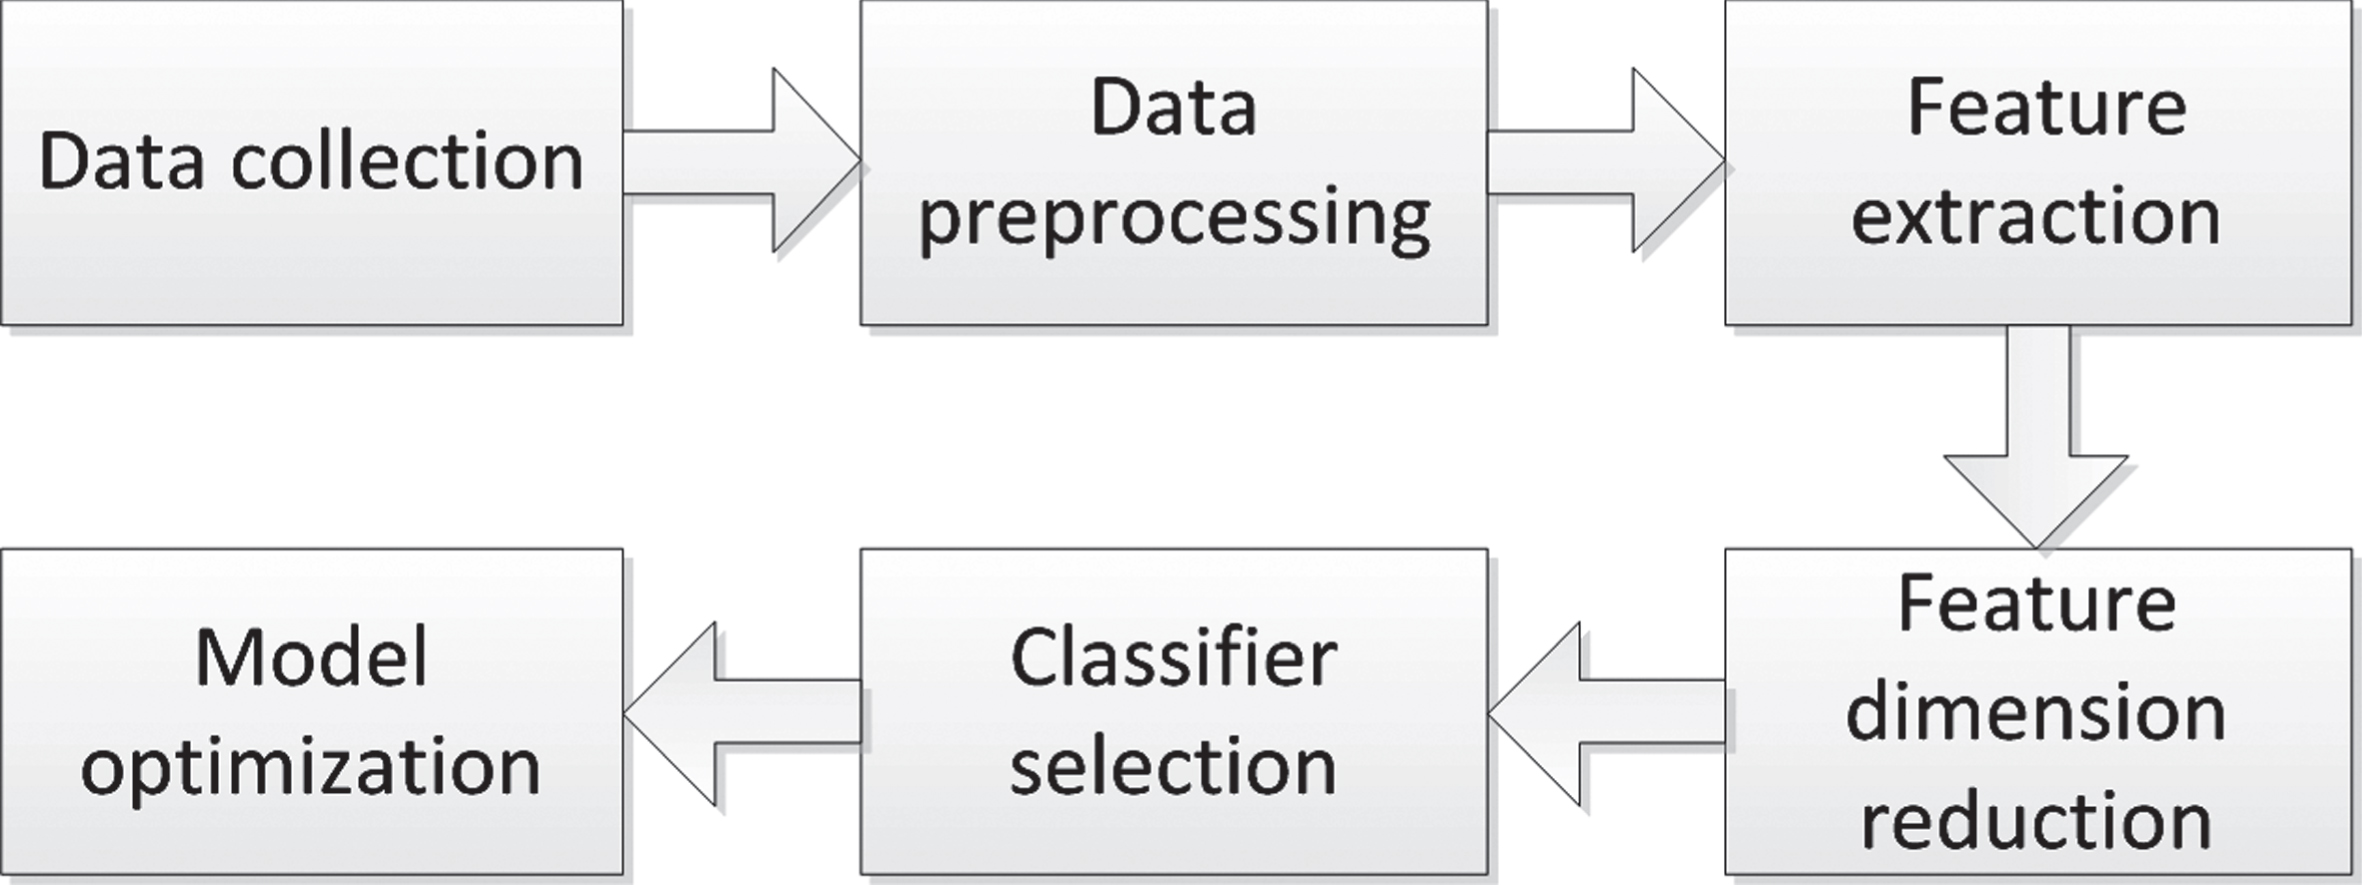
The main research ideas of this paper are: firstly design the structure and experimental flow of the pressure cushion. The second step collects experimental data according to the experimental process and processes it, constructs a machine learning model, and adjusts various parameters to achieve the maximum classification success rate of the model. The third step uses the new data to validate the model and view the experimental results. Different dimensionality reduction methods and classifiers are selected, and the classification accuracy of different dimensionality reduction methods and classifiers is compared, and the combination with the highest accuracy is selected as the final machine learning model like Fig. 2.

Correspondence between pressure data collection and children’s listening status.
The experimental method
Monitoring the current state of the student’s class is the ultimate goal of the entire experiment, which requires monitoring the current state of each student in the “Double Teacher” mode. Under the “Double Teacher” teaching mode, it is required to monitor the current state of each student in the classroom. The current classroom teacher can always know the status of each student in the classroom, and finally give feedback to the lecturer. Here we only analyze the state of the individual children’s lectures.
Firstly, according to the characteristics of children’s classroom behavior, the children’s classroom behavior is abstracted, then the collected pressure data is processed and classified, and the related machine learning model system is established. Through the analysis of the data, the child’s current listening state is obtained like Fig. 3.
Experimental total flow chart.
The modeling of the sitting pressure data generated during the class listening of the children is collected, and the data is first sorted out to remove the data lines containing blank values and missing values. Then, the shaped data is selected and the corresponding data features are extracted, and the extracted data features are dimension-reduced. The classifier is used to classify the reduced-dimensional data and construct a machine learning model. Finally, test the new data using the trained machine learning model.
The main functions of the cushion design are mainly from the following aspects, including collecting the pressure data of the child sitting posture, converting the collected pressure data into digital form and transmitting pressure data, and judging the child’s listening state according to the change of the pressure data.
There are several options for the pressure pad layout of the pressure cushion. The mosquito coils are shown in Fig. 4(a), the overall pattern is shown in Fig. 4(b) and the four corners are shown in Fig. 4(c). The mosquito-repellent film structure is not widely used in practical applications, so it is not chosen. The comprehensive pressure data collection is very large, the memory requirements are very high, and the data collected therein is disorderly, which is not very suitable for analysis. The four-corner distribution not only considers the problem of data volume during online monitoring, but also the cost problem. It can also clearly find some relationship between data distributions. Therefore, the four-corner distribution method is finally determined as the pressure sensor layout structure.

Pressure sheet layout.
In Fig. 5 the pressure cushion used in this experiment consists of a cushion, four 4.5 cm x 4.5 cm pressure sensors, a Bluetooth connection module, a processor and a battery.

Pressure cushion hardware structure diagram.
The seat cushion is made of a common 3 cm thick sponge cushion, which is neither thick enough to affect the accuracy of the sensor nor affects the listening state of the children’s classroom.
The pressure sensor is the FSR406 sensor of Interlink Electronics of the United States. This is a small, lightweight, high-sensitivity ultra-thin resistive pressure sensor with linearity error of less than 3% and stable performance. It is widely used in industrial fields, automotive systems and medical systems. However, the measurement accuracy of this sensor is not very high. Because this experiment does not require high measurement accuracy, and the cost of the sensor is not high, it is suitable for this experiment.
The processor selects the AVR microcontroller, which has good security, running speed and scalability, and is very suitable for simple system development.
Data collection
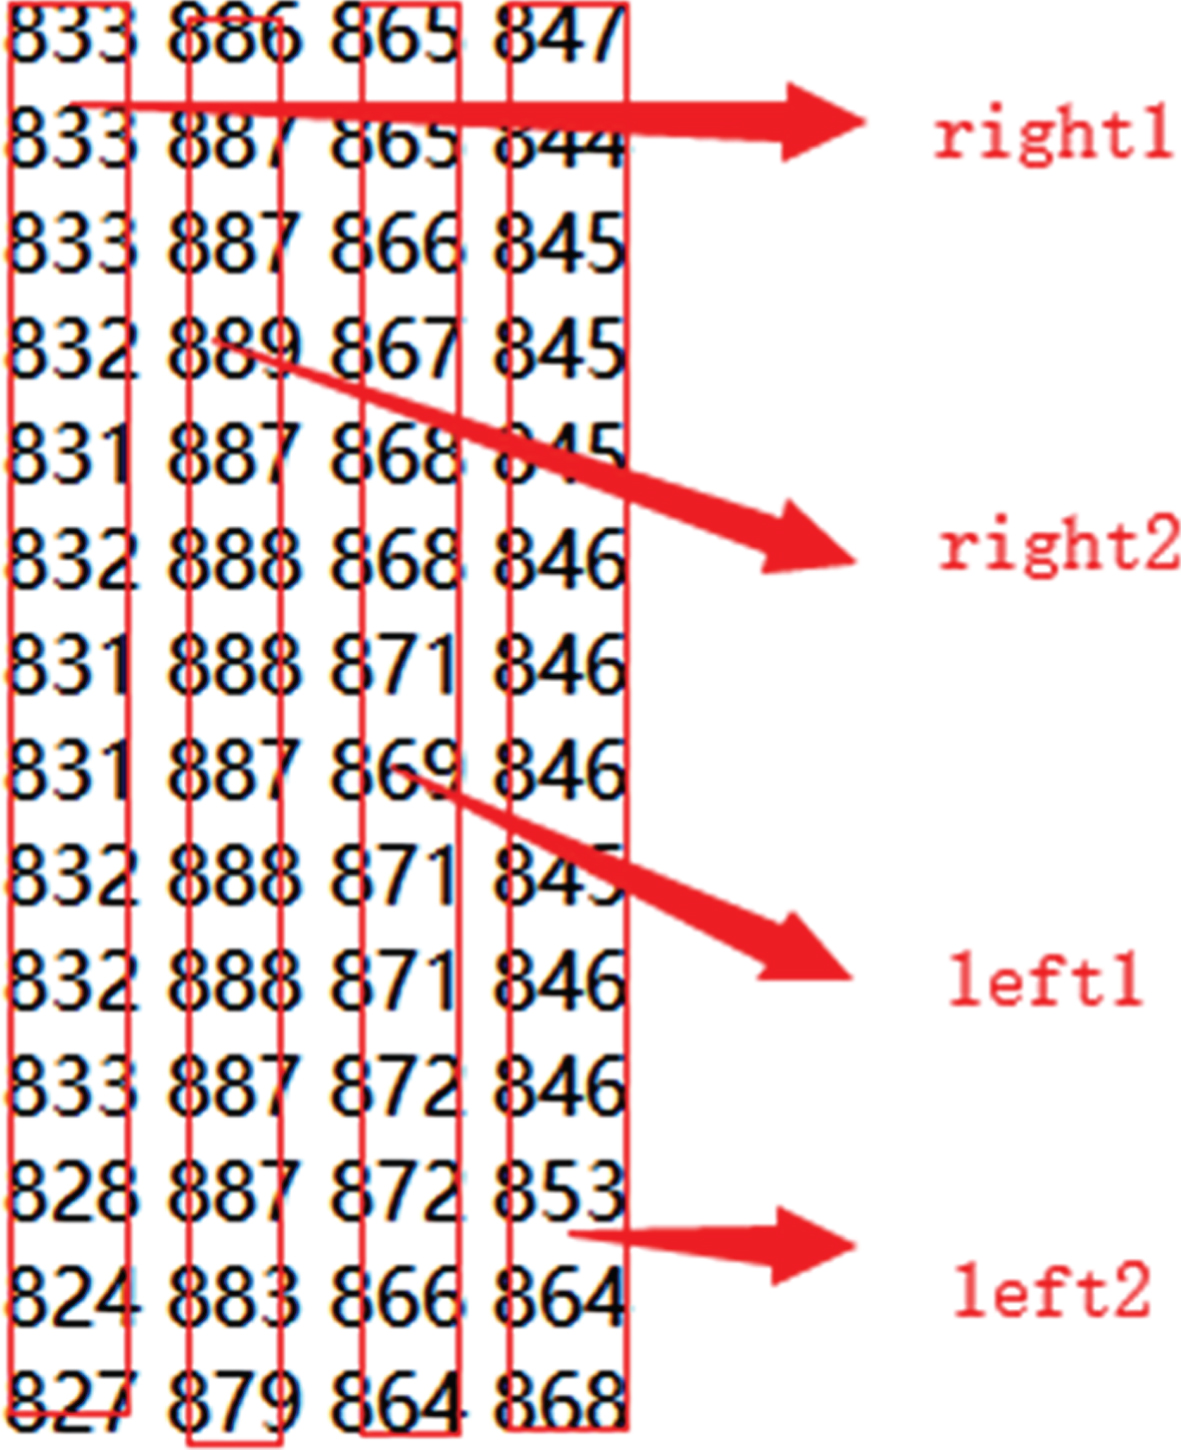
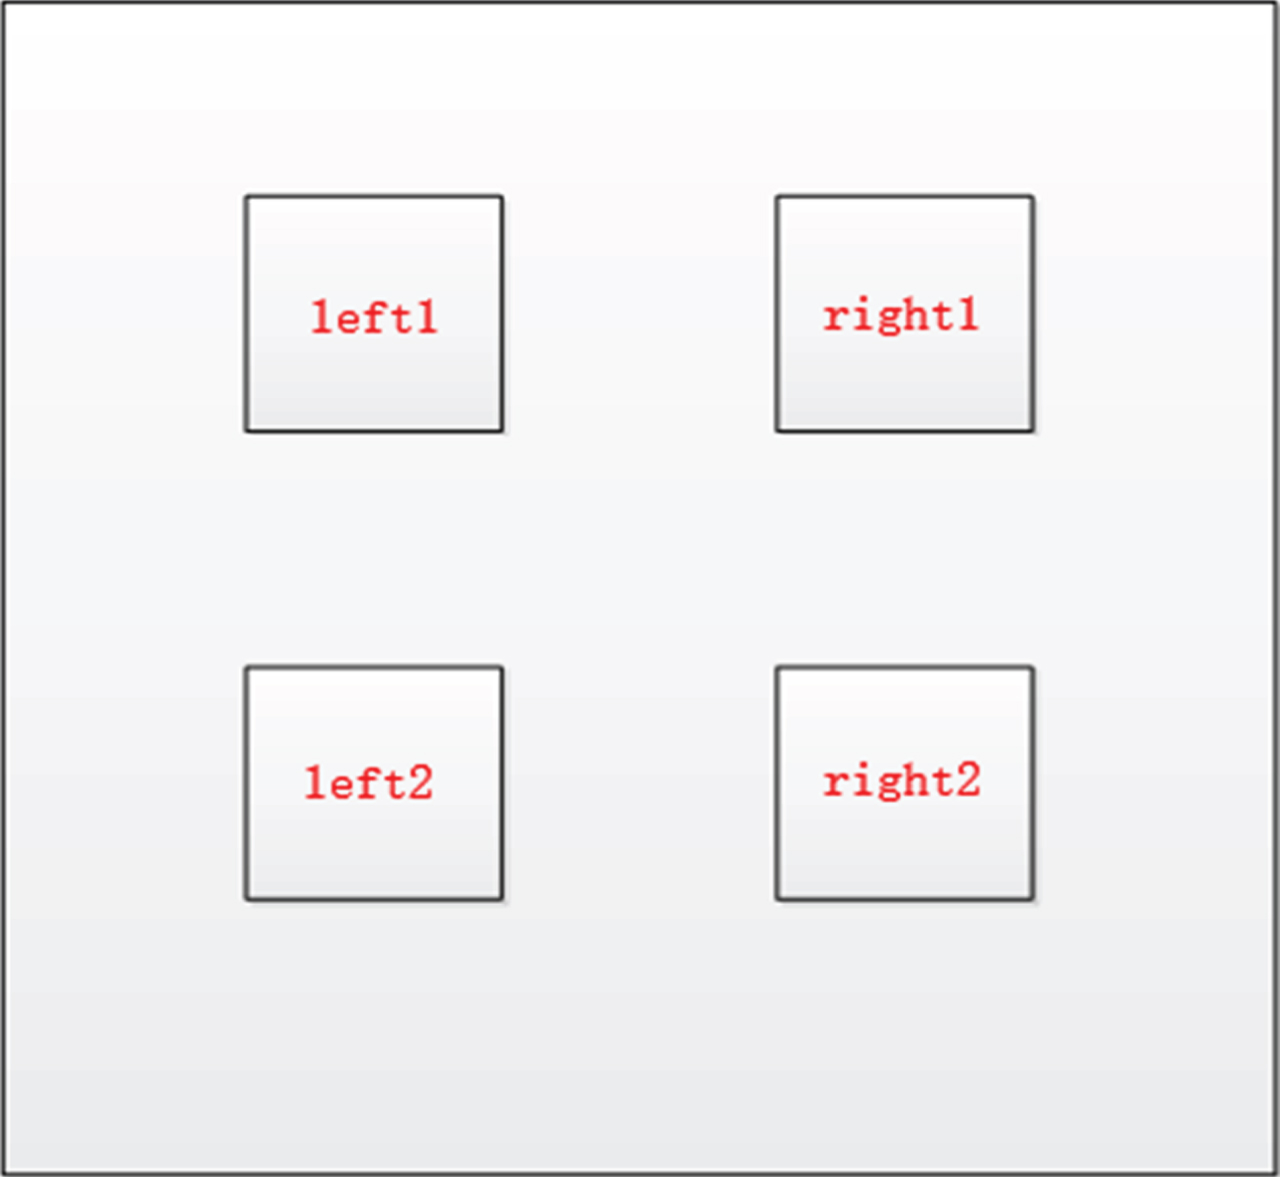
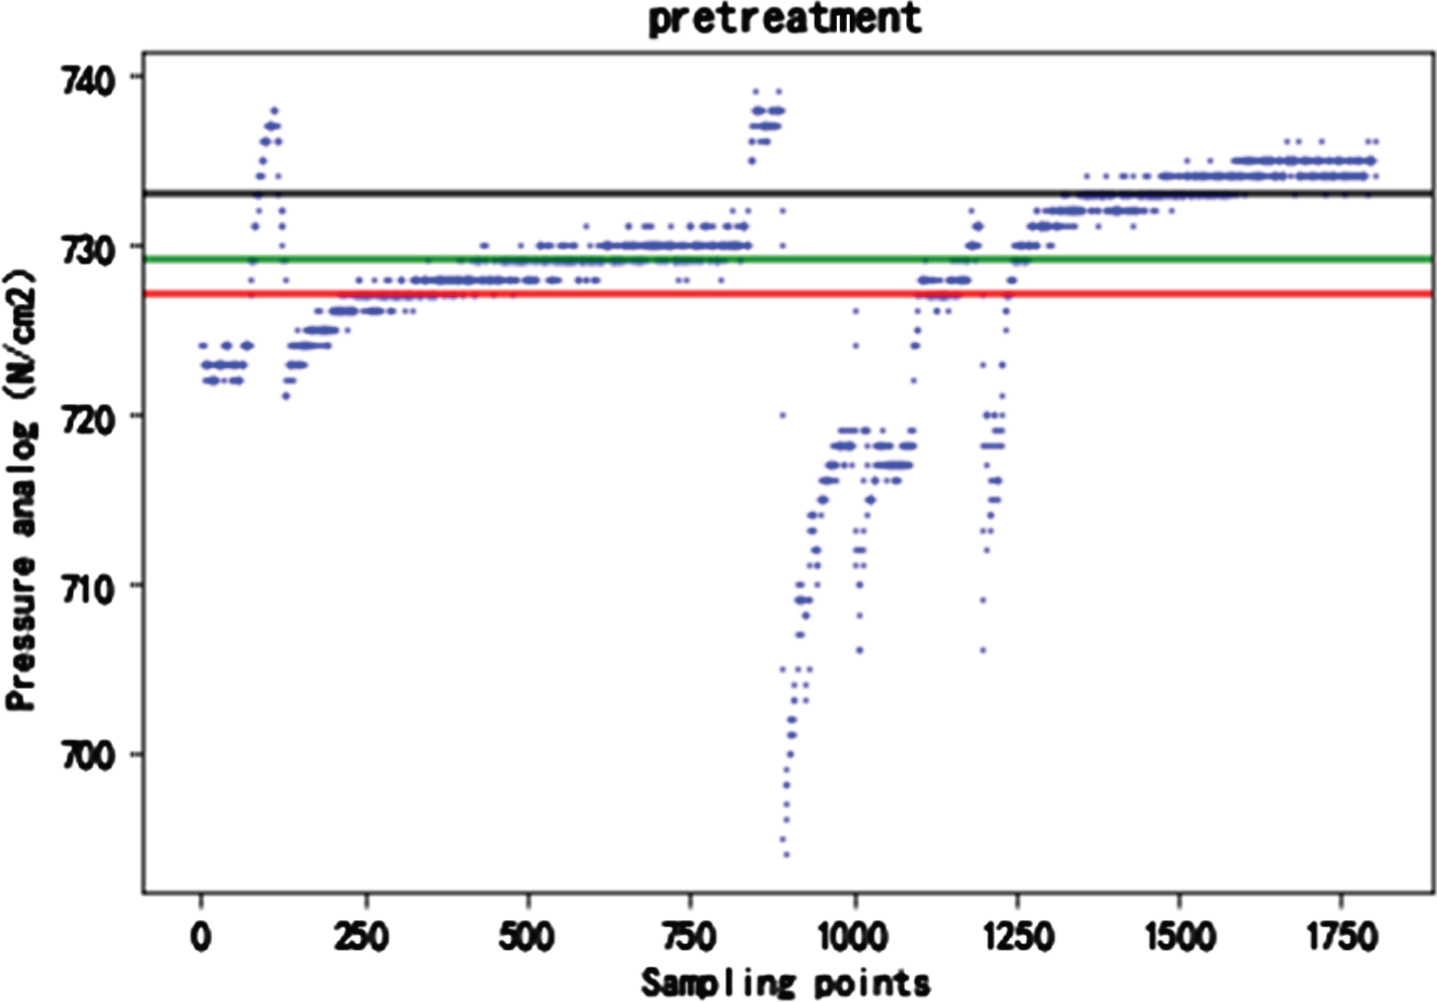
Since the four pressure pieces are distributed at the four corners of the seat cushion. The actual measured four pressure data are shown in Fig. 6. Four data sources corresponding to the inverted U-shaped distribution of right1, right2, left2, and left1 of the pressure cushion like Fig. 7.
Raw data.
Post-shaping data.
Within the range, the pressure sensor converts the child’s pressure at each pressure point into a resistance value. The smaller the student’s surface pressure at each pressure point, the greater the resistance. The unit of each pressure value in the data is N/cm2.
The experimental data of three different sitting posture behaviors of three experimental subjects were collected in Table 1. Each piece of data is collected for one hour. The data acquisition frequency is 10 HZ.
Experimenter data
In the process of data collection, we subjectively divided the sitting state into three types according to the switching frequency of sitting position, as shown in Table 2.
Switching frequency of sitting position
As shown in Fig. 8 (a), (b) and (c), it can be seen that when the listening state is quiet, the pressure values of the four data pressure points are basically linear, and the pressure values of the two pressure data collection points in front of the seat cushion are biased. High, indicating that the sitting position is relatively forward; as shown in (d) (e) (f), when the sitting posture switching frequency is low, the data fluctuates but the frequency is not very high, and the pressure value does not change very much and between the pressure points The image features are not obvious; as shown in (g)(h)(i), when the sitting frequency is very high, the data fluctuation is very severe, and the data between the peaks and valleys is very different, and the image characteristics between the pressure points are not obvious.

Pressure data map.
It can be seen from the data graph that the distribution characteristics of these three types of data are not very obvious, especially the high frequency of sitting frequency switching and the low switching frequency of sitting frequency. It is difficult to distinguish from images, so machine learning is used. The method of classifying these data makes sense.
As is showned in Fig. 9, the original data is shaped, the blank line data is deleted, the remaining components in the original data are removed, and only the digital portion of each set of data is retained. The data after shaping is preprocessed to remove missing values and fill in blank values.
Data preprocessing.
Since the collected pressure values are substantially continuous, it is unlikely that any two adjacent pressure point points will differ too much. Finally decided to do subjective processing. That is, in the case where the error of two adjacent points is greater than 150, the back point is regarded as an abnormal value point, and the mean value of the entire column value is newly given.
Based on the processed data, features are extracted for the four-dimensional data.
Features are extracted after the raw data is processed. The pressure value of each pressure point is processed by the time window idea. As shown in Fig. 10, three minutes of data is extracted as a time window for three minutes as a set of data. Take one minute as the step size, and process all the data of this group for the same time, and perform the same processing on all the 9 groups of data.
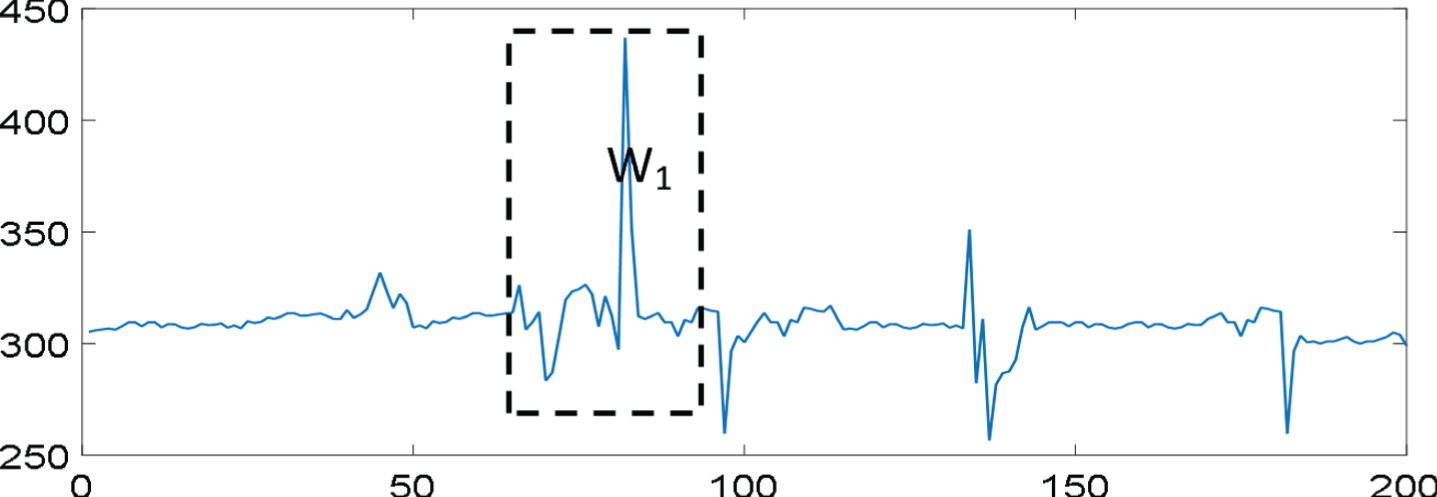
Sliding time window.
The data in each time window is extracted separately in the time domain and the frequency domain, and the mean, mean square, median, maximum and minimum, peak, skewness and other characteristics are extracted and considered. The feature of relevance extraction. The 20 features of Table 3 were extracted for each pressure point. In addition to considering a single pressure point, the relationship between the pressure points is also considered, as shown in Table 4.
Independent pressure point extraction features and their names
Feature extraction between pressure points
Insert 300 points between adjacent pressure values to make the curve smooth. As can be seen in Fig. 11, the blue is the original curve and the red is the smoothed curve. It can be seen from the figure that the curve is smoothed and the glitch and outliers in the original data are removed.
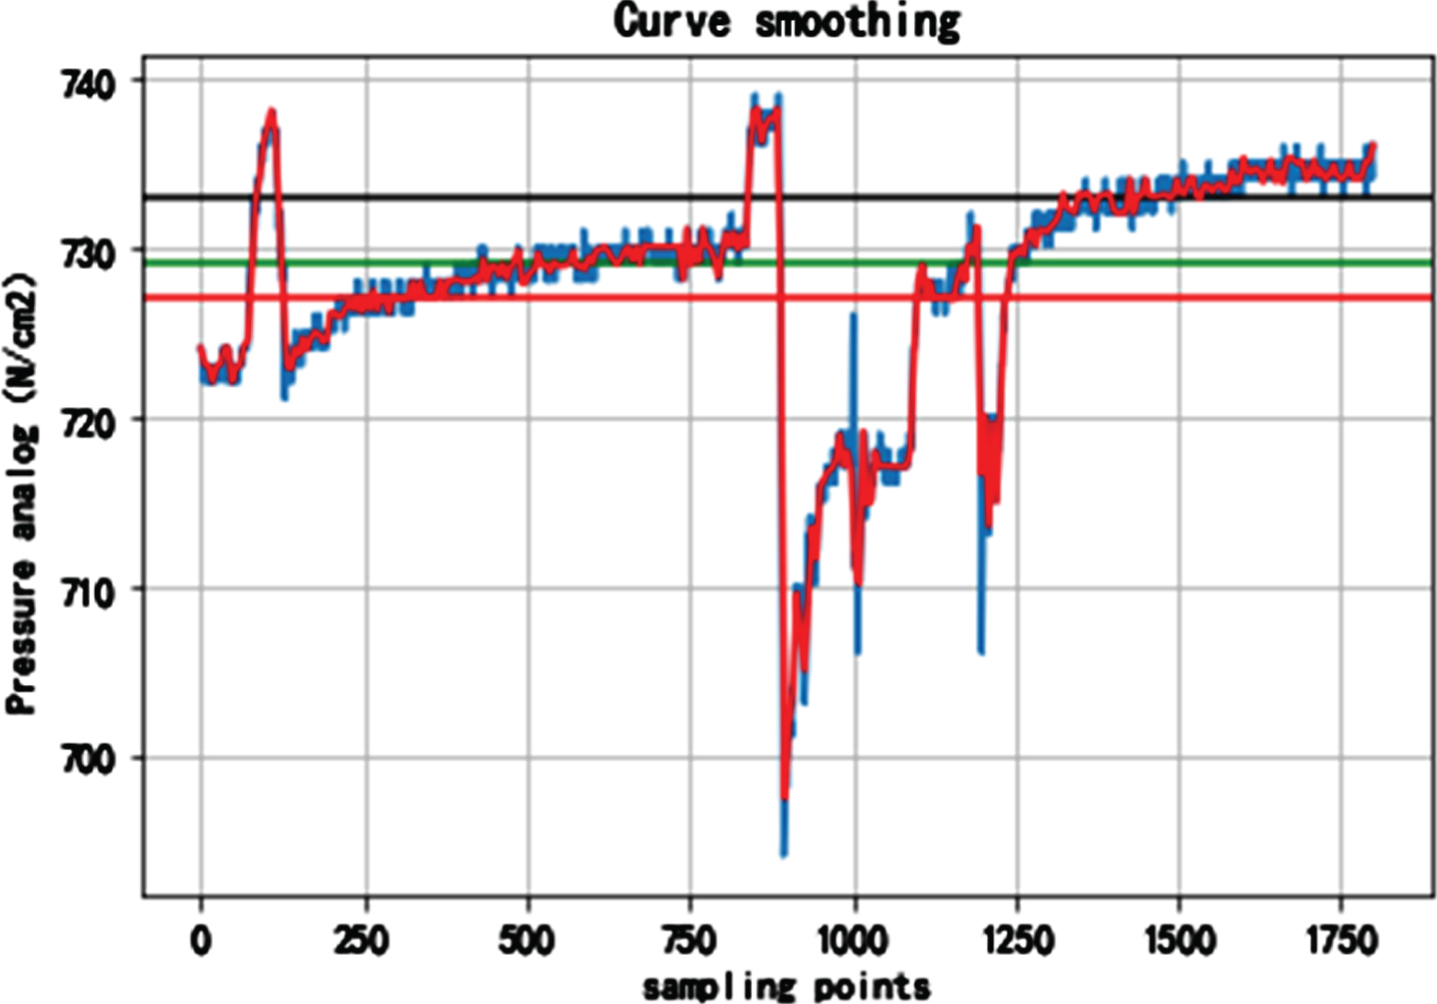
Image comparison before and after smoothing.
ISOMAP is a nonlinear dimensionality reduction method and is an unsupervised algorithm in fluid learning in Fig. 12. There are two main concerns in ISOMAP. The first is to choose the appropriate number of neighbors to choose the neighborhood, not too big or too small. The second point is to pay attention to the connectivity of the construction diagram. Once some areas on the way are not connected, an “open circuit” is generated. Both of these points are misleading for the calculation of the shortest path behind. So the key to using ISOMAP is to adjust the parameters to a reasonable range.
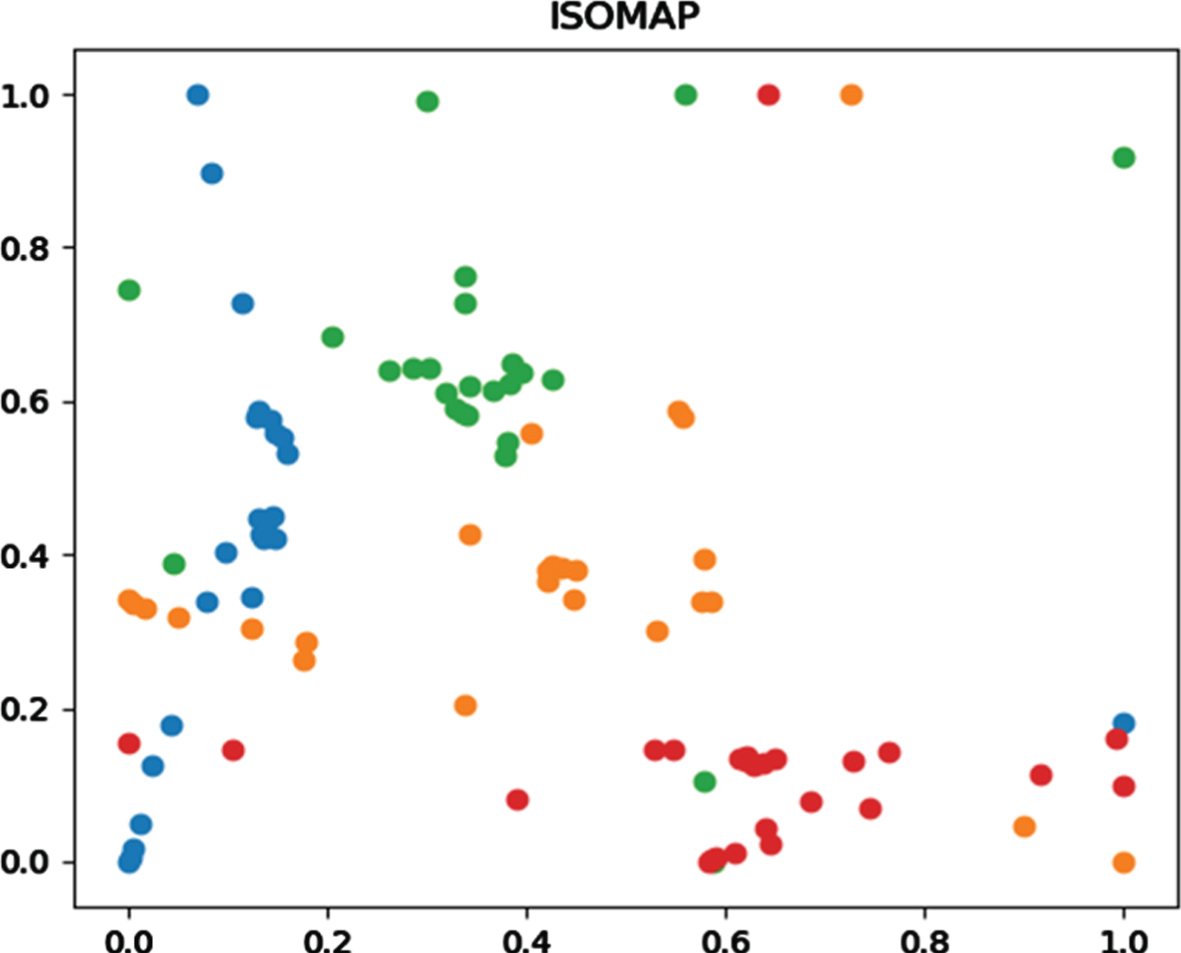
Data dimensionality reduction scatter plot.
In addition to ISOMAP, dimension reduction methods such as KPCA and t-SNE are also selected in this paper just like Fig. 13 and Fig. 14, but the effect of dimension reduction is not very ideal.

KPCA dimension reduction.
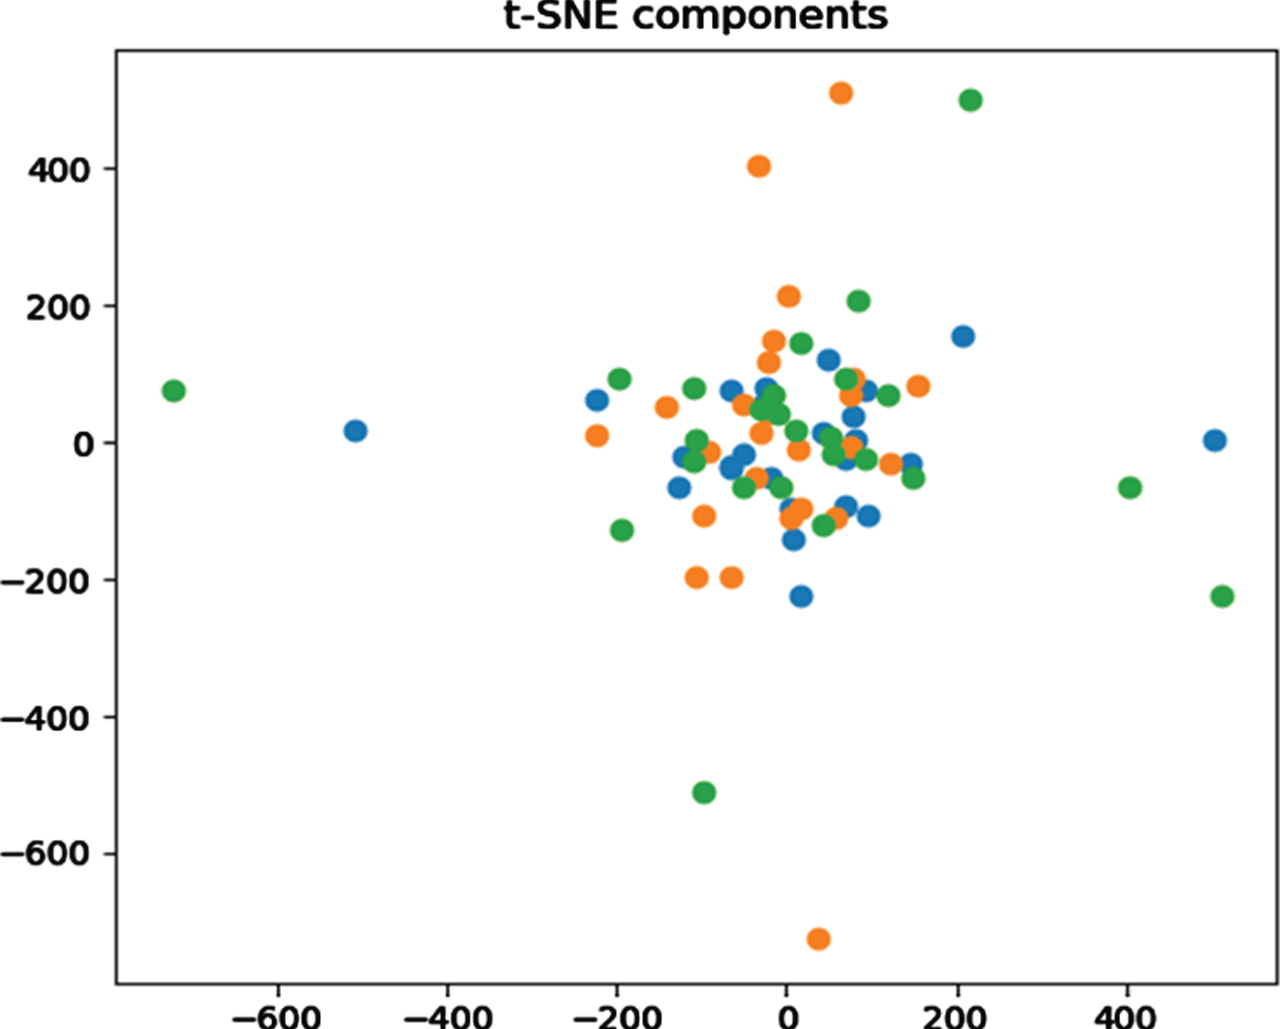
t-SNE dimension reduction.
In order to facilitate the training of subsequent data, it is necessary to manually label children’s behaviors to distinguish the children’s listening status at this time.
According to Chen Kaige’s survey of children’s classroom sitting posture in a primary school in Hangzhou, 16.7% of the children’s sitting postures in the lectures were “sitting in the middle of the chair, leaning forward”, and 61.1% of the children’s sitting postures in the lectures were “sitting in the chair”. In the middle, the body is straight.” 22.2% of the children’s sitting posture is “sitting at the back of the chair” as a classroom listening position. In addition, each person’s sitting habits and sitting postures have their own characteristics, and it is not very representative of the state of the lectures only from the child’s sitting posture.
In this paper, the children’s classroom behavior can be divided into three basic states: the basic posture is not moving, the sitting posture is low frequency and the sitting posture switching frequency is high. As shown in Table 5.
Classification of children’s classroom status
Classification of children’s classroom status
According to the experimental results, children aged 7–10 years have active attention in the classroom for about 15 minutes, while children aged 12 and above have better focus in the classroom than the children in the lower grades. About ten minutes.
It can be seen that children have some small frequency of distraction when they are listening carefully, and such a state is characterized by a lower frequency of sitting posture switching. Define the child status at this time as 1.
If the child’s class is almost silent and very quiet, then the classmate is most likely to be sleeping or playing with a mobile phone. The performance on the pressure value is that the pressure value is basically stable and there is no significant change. Define the state of the child at this time as -1.
If the exercise frequency is relatively high, then the classmates’ attention is more serious. At this time, the sitting frequency will be very high. At this time, the child’s listening state is defined as 0.
Stacking is a hierarchical fusion model that trains the secondary classifier to use the output of the underlying classifier to train to get a final output.
The advantage of Stacking is that it can be applied to any weak classifier, constructed by cross-validation method, and has strong stability. This is currently the most efficient way to improve machine learning. The only drawback is that the construction is complex and difficult to explain commercially.
Here in Fig. 15, the underlying classifier selects five kinds of random forest, extreme random tree, linear SVM, AdaBoost and GradientBoosting, and the secondary classifier selects the decision tree.
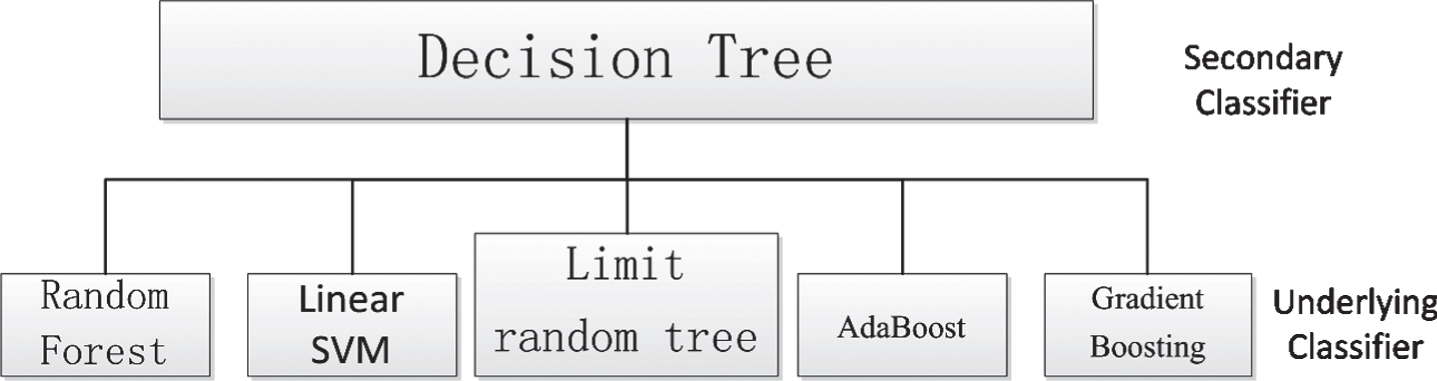
Stacking schematic.
Experimental results and analysis
Once the model is built, the model is validated. First, collect a small amount of new data. This new piece of data is collected in quiet state.
As can be seen from Fig. 16, in the test data of more than ten minutes, in addition to the first intense movement, there is not much sitting switching or movement, and it is basically in a stable state.
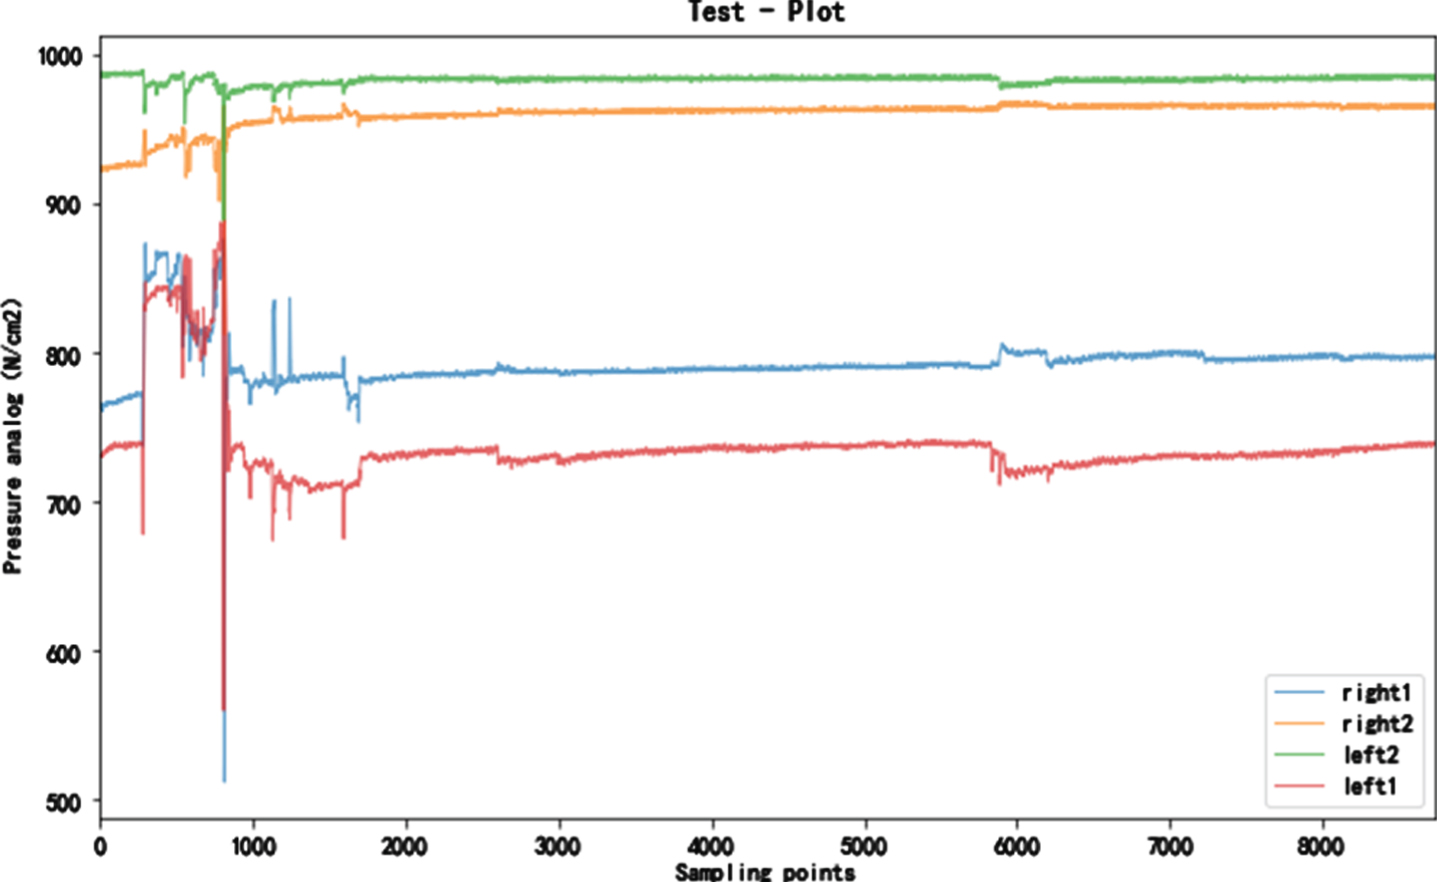
Experimental results verification.
Do not define labels for this set of data, bring them into the model, and view the test results.
Based on the final result, view the classification as follows in Fig. 17.
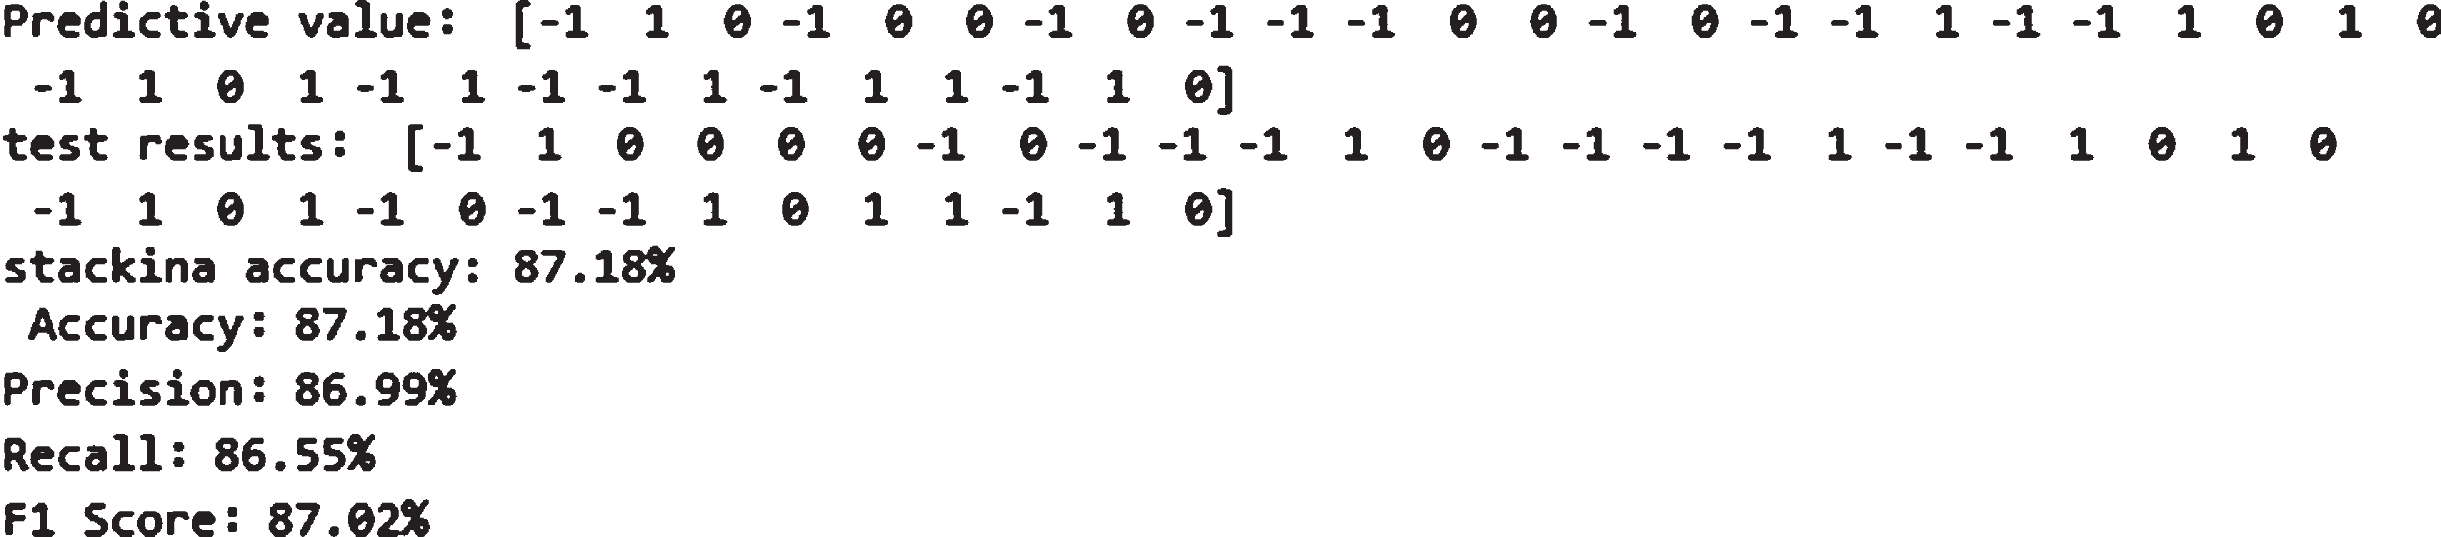
Model evaluation.
In the actual operation, among the 39 test sets, y value and 39 prediction results, there are 4 prediction errors. It can be seen that the predicted values in the test set are not much different from the actual predicted prediction results in Table 6, which is in line with the actual accuracy.
Stacking evaluation indicators
The representative meaning of each parameter is as follows:
Accuracy: Accuracy is the ratio of the correct number of predictions to the total. Generally, the higher the accuracy, the better the classification effect of the classifier.
Precision: The proportion of the positive samples that are predicted to be correct.
Recall: The true correct proportion of the positive sample of the forecast.
F1 Score: It is difficult to make a judgment because the results of both the accuracy rate and the recall rate sometimes appear contradictory. At this time, we must consider the F1 value. The F1 value is a comprehensive consideration of these two evaluation indicators, usually the larger the F1 value, the better.
The error rate matrix indicates the exact level of the prediction rate, the brighter the color, the higher the error rate.
0, 1, and 2 in the horizontal and vertical coordinates in the error rate matrix correspond to three states: the quiet state in the original data, the low sitting frequency, and the high sitting frequency. It can be clearly seen from the Fig. 18 that the rectangular area except that the child sitting posture switching frequency is low and the sitting posture switching frequency is high is white, and the remaining blocks are gray or black. This indicates that the model has only made a mistake in distinguishing between the low and high sitting frequency of the child’s sitting posture, and there is basically no prediction error in other places.
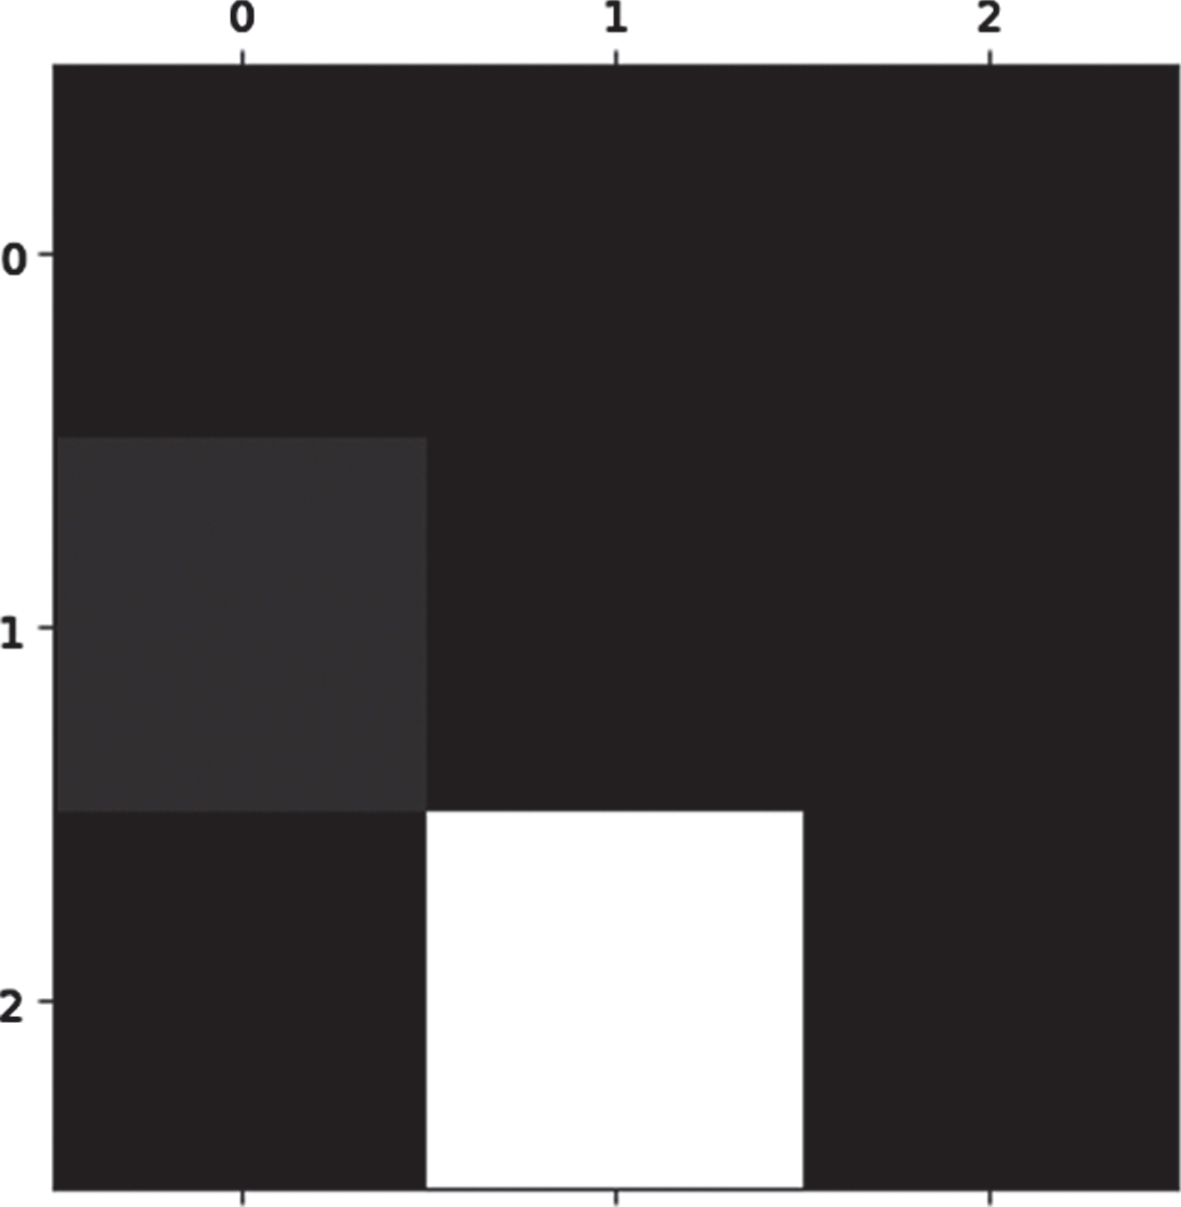
Error rate matrix.
The reasons for this may be: The amount of data collected is not enough. The distinction between the two cases is not very high in the process of collecting data. Factors such as height and weight were not completely eliminated during data extraction.
Because the dimensionality reduction methods have their own advantages and disadvantages, and different dimensionality reduction methods have different accuracy rates for different classifiers.
Each dimension reduction method and the classifier are respectively corresponding one by one, and the score of the classifier is obtained in Table 7.
Scores of different dimensionality reduction methods on the classifier
Scores of different dimensionality reduction methods on the classifier
From the scorer score, using ISOMAP dimension reduction and using Stacking classification results is the best, with an accuracy rate of 87%.
This paper expounds the background and significance of the research on children’s behavior based on pressure cushion, and introduces the current research situation of children’s classroom behavior at home and abroad. Based on the combination of the two, a system for classifying children’s classroom classes is designed. The system mainly uses the machine learning method to design, and the accuracy rate of children’s behavior classification in the classroom reaches 87%.
This paper mainly completes the collection and preprocessing of pressure data and extracts features from the already processed pressure data. The ISOMAP was selected for dimensionality reduction to improve the readability and rationality of the data. And use the stacking classifier for classification. Different dimensionality reduction methods and different classifiers were selected for optimization selection, and finally the combination with the highest classification accuracy was selected.
Footnotes
Acknowledgments
This paper has been funded by the National Key R&D Program of China (2020YFB1712404 and 2019YFB1600404) and the National Natural Science Foundation of China (71672137).