
Abstract
Knowledge graphs are useful sources for various AI applications, however the basic paradigm to support pilot training is still unclear. In the paper, It is proposed to generate the customized knowledge graph of flight trainings using machine learning method for the flight training program. In order to provide the successful key to the further understanding of the learning problems between the students and the instructors. In this research, we collected data from an aeronautical academic in Taiwan that students were trained for Recreation Pilot License Program. We performed a test on 24 students at the first of each training course, 16 data of collected been used on building the module, 8 of them used to exam the module. There are 12 courses in the training program, and 30 hours total time were suggested by academic. The score which we applied on test were based on LCG method which is the sum of Maneuver and SRM Grades. For the indicators of course component in Learner Centered Grading, namely (a) CCS1: Operation & Effect of Controls; (b) CCS2: Straight & Level; (c) CCS3: Climbing & Descending; (d) CCS4: Turning; (e) CCS5: Stalling; (f) CCS6: Revision; (g) CCS7: Circuits; (h) CCS8: Cross-Wind Training; (i) CCS9: Circuit Emergency; (j) CCS10: Solo Circuit; (k) CCS11: Forced Landing; and (l) CCS12: Precautionary & Searching Landing. Through the method of Knowledge Graph, we deduct and predict the number of hours that need to be added for each student’s learning. Using the dynamic knowledge graph to display the key issues of the course learning continuously, and make follow-up decisions for the students, instructors and airliners.
Introduction
As the pilot labor demands were expanding from Asia in the past couple of years, and aviation safety is another key issue for them. There are increasingly more airlines concentrate on recruit as well as train their own pilot in local. In order so as to take the difficulty in pilot-supply tighten. In the next 20 years [3], The worldwide demand of new pilot will be 790,000, and the demands of Asia-Pacific will be 261,000. For airlines, just how to regulate the training expense in brand-new pilot is a vital concern. The Learner Centered Grading from FAA-Industry Training Standards (FITS) program is a more objective method to review a pupil pilot. The FITS idea has actually been focused as an effectiveness method in lots of academics and different level of flight licenses. From this point of view, FITS is a noticeable factor to consider when we speak about the examination of student pilot. The FITS program considers the human factor involved as well. Due to different capabilities, limitations, strengths, or weaknesses in human being. The human factors can affect aviation safety broadly. Through the LCG method, to ensure the pilot perform the accuracy in different scenario, in order to reduce the human error. Then we need a reliable approach to anticipate the hours of pilot training, human abilities, limitations, and also other characteristics. That’s why we generate a multi-relational graph - knowledge graph. The benefit of the forecast is not just for instructors as well as trainees, however additionally for airliner to evaluate their pilots.
What is the knowledge graph and FITS?
There are lots of definition of Knowledge Graph in the past few years [14]. A knowledge graph (a) mainly describes real world entities and their interrelations, organized in a graph, (b) defines possible classes and relations of entities in a schema, (c) allows for potentially interrelating arbitrary entities with each other and (d) covers various topical domains.” [15] A knowledge graph is a multi-relational graph composed of entities as nodes and relations as different types of edges [16]. A knowledge graph mainly describes real world entities and their interrelations, organized in a graph. Knowledge in pilot training has a complex logical relationship. The facility of knowledge graph construction [17] is to identify, summarize and systematize the knowledge, and also to build a reliable knowledge design. The FAA-Industry Training Standards [7, 12] (FITS) program that is a flight training program between Federal Aviation Administration, Industry, as well as Academic community that are more convenient, more accessible, less costly. And revamp the flight training develop the dry run to the real-world obstacle. Therefore, the FITS [8, 9] approval the training program and also syllabus have to consist of the complying with concepts: (a) Scenario Based Training (SBT), (b) Single Pilot Resource Management (SRM), and (c) Learner Centered Grading (LCG,). SBT [5, 9–11] ought to be released throughout the curriculum which based upon the guidance of FAA Generic Master Syllabus. The situations must considerate to the airplane, specific flight characteristics, and also the similar flight setting. It should always require the pilot to make real-time decisions in a realistic setup. As soon as the trainee has actually executed the required skills, the scenarios must be prepared and also led by the trainee. SRM [1, 8–11] is clearly defined as Aeronautical Decision Making, Risk Management, Task Management, Details Monitoring, Automation Management, Flight Management, Situational Awareness, and CFIT Awareness. Therefore, it needs to belong of every section of each situation. SRM will be a graded item during pre-flight, pre-takeoff, takeoff, climb, cruise, descent, approach, and landing. It’s various to supplier’s educational program. The learner centered grading is a method for the instructor as well as trainee to establish the trainee’s degree of expertise and also understanding. “ Perform “ is used to define proficiency in a skill thing such as an approach or landing. “Manage-Decide” is made use of to explain proficiency in the SRM location such as ADM. Explain and practice are made use of to define student discovering degrees below effectiveness in both. From the above ideas, the pilot in training will certainly have the opportunity to exercise, sort out the problems as well as tasks. The previous study reported [2, 6] the FITS additionally enhance the performance in Commercial Pilot Educating Program, as well as successfully decreased virtually 1/3 flight hours to satisfy Commercial Certification.
What is the Learner Centered Grading? Because the training is learner centered, the success of the training is determined in the complying with wished trainee results. The FITS separate LCG into the following sections [8]:
(a) Maneuver Grades
Describe –at the conclusion of the scenario, the PT will certainly have the ability to describe the physical characteristics and also cognitive components of the circumstance activities. Instructor support is required to efficiently perform the maneuver. Explain –at the completion of the scenario, the student will certainly have the ability to define the scenario activity and recognize the underlying concepts, principles, as well as procedures that make up the task. Trainer support is required to effectively carry out the maneuver. Practice –at the completion of the scenario, the trainee will certainly have the ability to plan and implement the situation. Coaching, instruction, and/or assistance from the CFI will correct deviations as well as mistakes recognized by the CFI. Perform - at the completion of the scenario, the PT will certainly be able to do the task without help from the CFI. Mistakes and discrepancies will certainly be determined and also corrected by the PT in a prompt way. At no time will the successful completion of the task remain in doubt. Not Observed –Any occasion not completed or required.
(b) Single Pilot Resource Management (SRM) Grades
Explain –the student can verbally recognize, explain, and also comprehend the dangers inherent in the flight scenario. The student will certainly require to be motivated to identify risks and make decisions. Practice –the trainee is able to determine, recognize, and use SRM principles to the actual flight scenario. Mentoring, instruction, and/or help from the CFI will rapidly fix minor variances and mistakes identified by the CFI. The pupil will be an active decision maker. Manage/Decide - the trainee can correctly gather the most important information available both within and outside the cockpit, identify feasible courses of action, assess the threat inherent in each course of action, and also make the suitable decision. Instructor treatment is not needed for the safe completion of the flight.
In the LCG concept [9, 10], the student must attain a brand-new degree of learning through each flight. It additionally means the grading must be progressive.
In 2011, Shaobo Huang [13] proposed the prediction of student academic performance helps instructors develop a good understanding of how well or how poorly the students will perform. And instructors can take proactive measures to improve student learning. One of models was developed using multivariate linear regression (MLR).
Materials and methods
Data collecting
For this research, we accumulated information from an aeronautical academic in Taiwan with students who were trained for Recreation Pilot License Program. We carried out a test on 24 students when they start the first training of each course, 16 data of collected been utilized on developing the module, 8 of them utilized to examination the component. There are 12 training courses of the training program, and 30 hours total time were suggested by academic (see Table 1). The score based on LCG method which is the sum of Maneuver and SRM Grades (see Table 2) when we performed the test.
The Course Component and Suggested Training Hours
The Course Component and Suggested Training Hours
The score points between Maneuvers Grades and SRM Grades
From earlier research studies as defined over, we attended to twelve variants from the dimensions of course component as the indicators of course element in Learner Centered Grading, namely (a) CCS1: Operation & Effect of Controls; (b) CCS2: Straight & Level; (c) CCS3: Climbing & Descending; (d) CCS4: Turning; (e) CCS5: Stalling; (f) CCS6: Revision; (g) CCS7: Circuits; (h) CCS8: Cross-Wind Training; (i) CCS9: Circuit Emergency; (j) CCS10: Solo Circuit; (k) CCS11: Forced Landing; and (l) CCS12: Precautionary & Searching Landing.
Results
In the research using intelligent knowledge graph methods, calculated by data analysis software-Gephi. We selected 12 of 24 sets data, and filtered the original data by two different sets of criteria, (a) The CCS is a value of 7 or more and AT is a value of 3 or less, used to present excellent performance. (b) The CCS is a value equal to or below 4 and the value of AT is 8 or higher, used to present a weak performance condition. In order to intuitively discover patterns, isolate structure singularities or faults during data sourcing. It turned out the 18 Knowledge Graphs of 12 pilot students by 18 datasets. The results are shown as the following:
For PT1, there are 12 CCS values equal to or more than 7.0 points, and lead to 9 AT values are or less than 3.0 hours. And most of them are within suggested training hours (see Table 3 & Fig. 1).
The data of PT 1, when the CCS is a value of 7 or more and AT is a value of 3 or less
The data of PT 1, when the CCS is a value of 7 or more and AT is a value of 3 or less
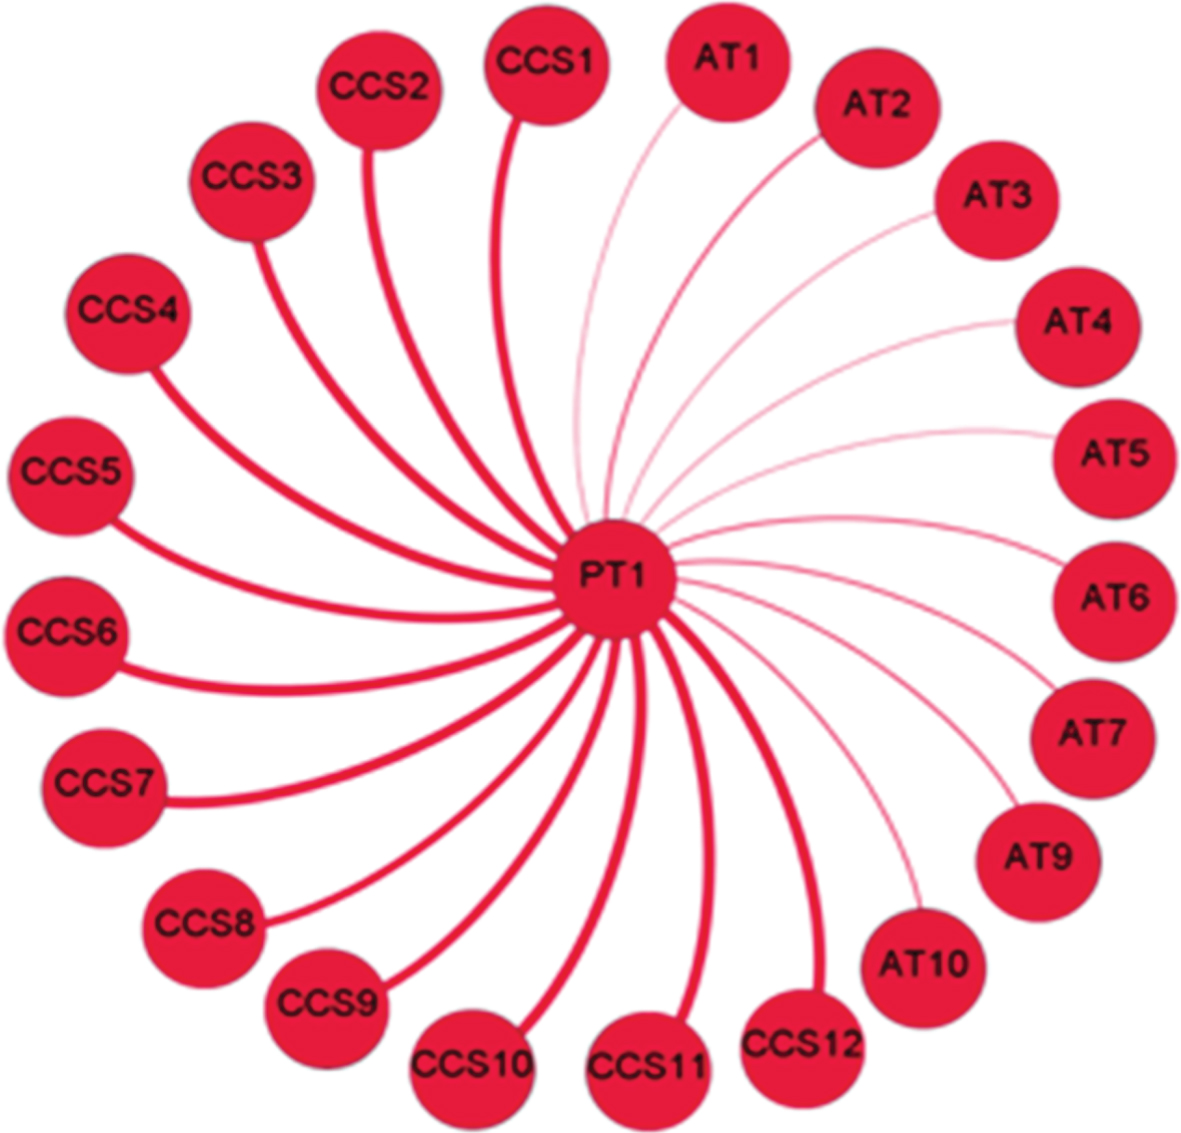
The knowledge Graph of PT1, when the CCS is a value of 7 or more and AT is a value of 3 or less.
For PT2, there are 12 CCS values equal to or below 4.0 points, and lead to 3 AT values are or more than 8.0 hours. And all of 12 courses are more than suggested training hours (see Table 4 & Fig. 2).
The data of PT 2, when the CCS is a value below 4 and the value of AT is 8 or higher
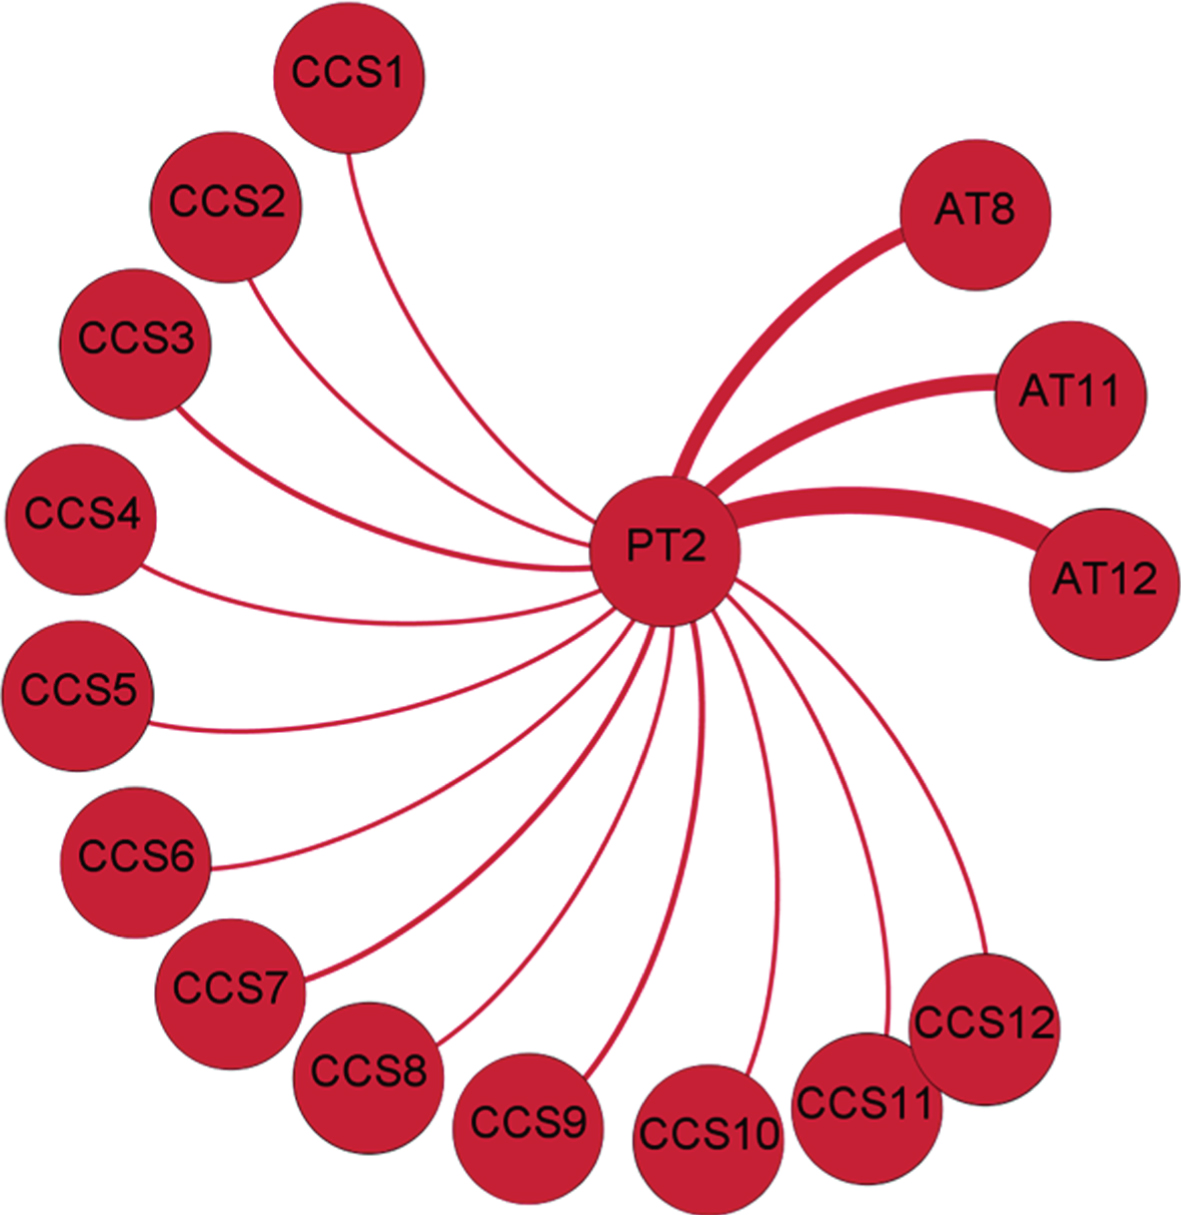
The knowledge Graph of PT2, when the CCS is a value below 4 and the value of AT is 8 or higher.
For PT3, there is no CCS value more than 7.0 points, but lead to an AT values is or less than 3.0 hours. (see Table 5 & Fig. 3).
The data of PT 3, when the CCS is a value of 7 or more and AT is a value of 3 or less
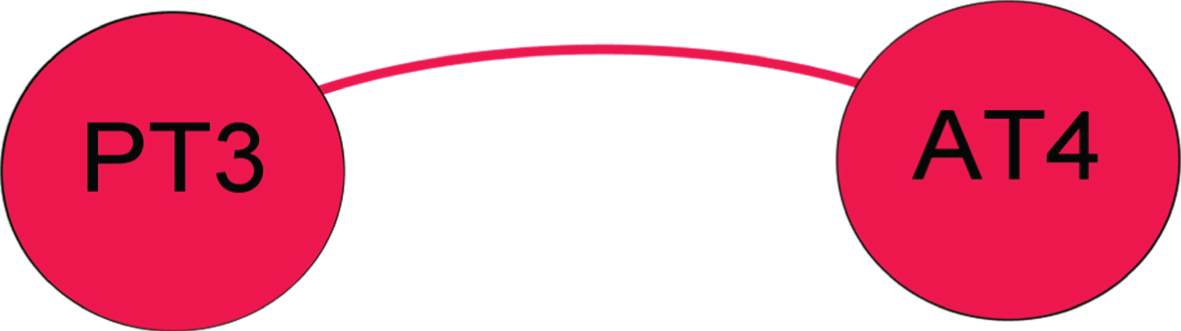
The knowledge Graph of PT3, when the CCS is a value of 7 or more and AT is a value of 3 or less.
For PT3, there are 12 CCS values equal to or below 4.0 points, and lead to 3 AT values more than 8.0 hours. And all of 12 courses are more than suggested training hours (see Table 6 & Fig. 4).
The data of PT 3, when the CCS is a value below 4 and the value of AT is 8 or higher

The knowledge Graph of PT3, when the CCS is a value below 4 and the value of AT is 8 or higher.
For PT4, there are 9 CCS values equal to or more than 7.0 points, and lead to 7 AT values are less than 2.0 hours. And most of these 9 courses are within suggested training hours, except CCS7 (see Table 7 & Fig. 5).
The data of PT 4, The CCS is a value of 7 or more and AT is a value of 3 or less

The knowledge Graph of PT4, when the CCS is a value of 7 or more and AT is a value of 3 or less.
For PT4, there is no CCS values equal to or below 4.0 points, but lead to 1 AT value is more than 8.0 hours. And half of 12 courses are more than suggested training hours (see Table 8 & Fig. 6).
The data of PT 4, when the CCS is a value below 4 and the value of AT is 8 or higher
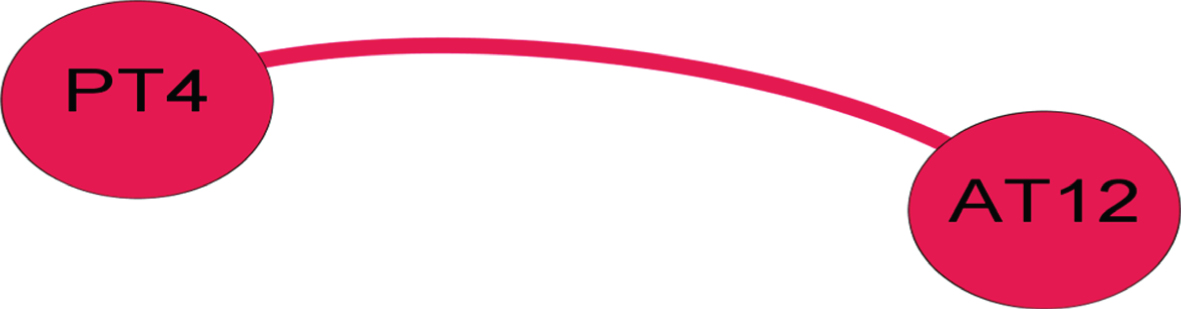
The knowledge Graph of PT4, when the CCS is a value below 4 and the value of AT is 8 or higher.
For PT5, there are 5 CCS values equal to or more than 7.0 points, and lead to 8 AT values are or less than 3.0 hours. And 3 of 12 courses are within suggested training hours (see Table 9 & Fig. 7).
The data of PT 5, The CCS is a value of 7 or more and AT is a value of 3 or less
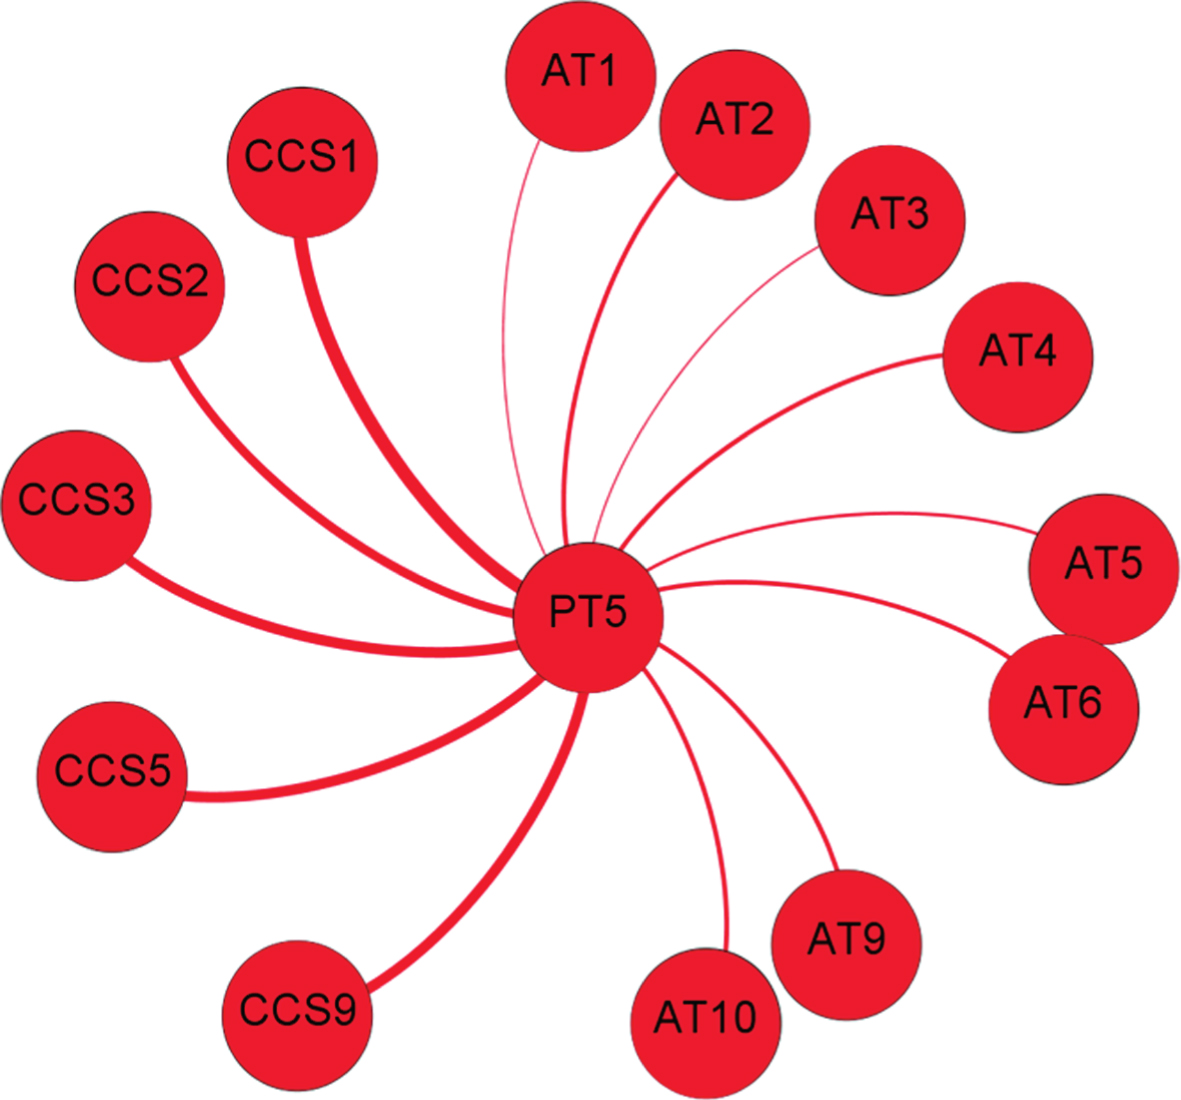
The knowledge Graph of PT5, when the CCS is a value of 7 or more and AT is a value of 3 or less.
For PT5, there is a CCS values equal or below 4.0 points, and lead to 2 AT values are or less than 8.0 hours. And 9 of 12 courses are more than suggested training hours (see Table 10 & Fig. 8).
The data of PT 5, when the CCS is a value below 4 and the value of AT is 8 or higher

The knowledge Graph of PT5, when the CCS is a value below 4 and the value of AT is 8 or higher.
For PT6, there are 7 CCS values equal to or more than 7.0 points, and lead to 6 AT values equal to or less than 3.0 hours. And half of them are within suggested training hours (see Table 11 & Fig. 9).
The data of PT 6, The CCS is a value of 7 or more and AT is a value of 3 or less

The knowledge Graph of PT6, when the CCS is a value of 7 or more and AT is a value of 3 or less.
For PT6, there is a CCS values equal to or below 4.0 points, and lead to 3 AT values are more than 8.0 hours. And 9 of 12 courses are more than suggested training hours (see Table 12 & Fig. 10).
The data of PT 6, when the CCS is a value below 4 and the value of AT is 8 or higher
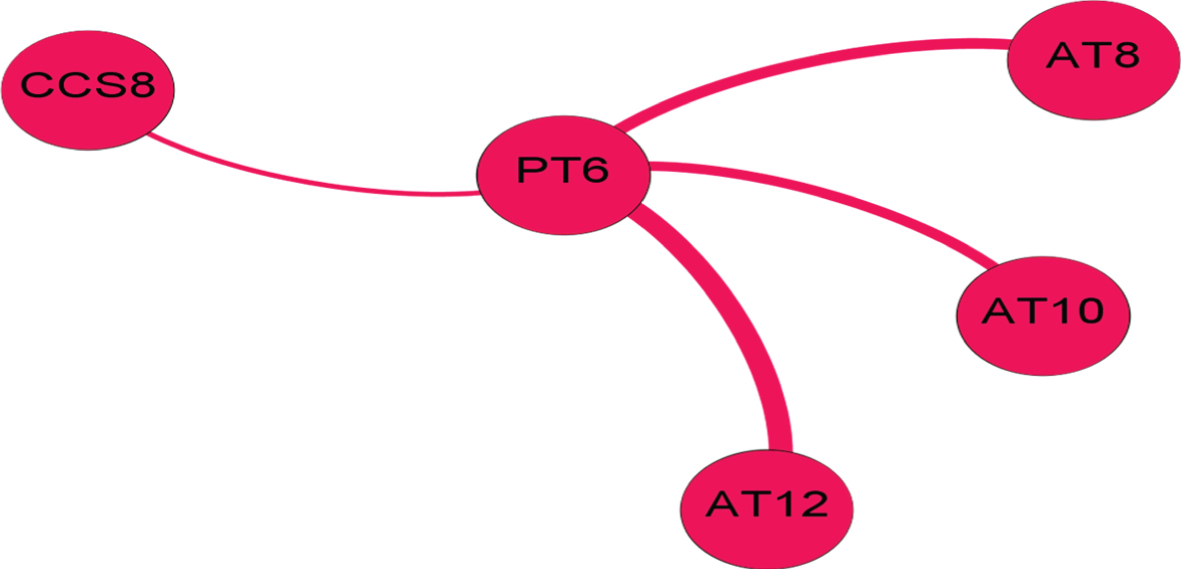
The knowledge Graph of PT6, when the CCS is a value below 4 and the value of AT is 8 or higher.
For PT7, there are 12 CCS values more than 7.0 points, and lead to 12 AT values are equal to or less than 3.0 hours. And all of them are within suggested training hours (see Table 13 & Fig. 11).
The data of PT 7, The CCS is a value of 7 or more and AT is a value of 3 or less
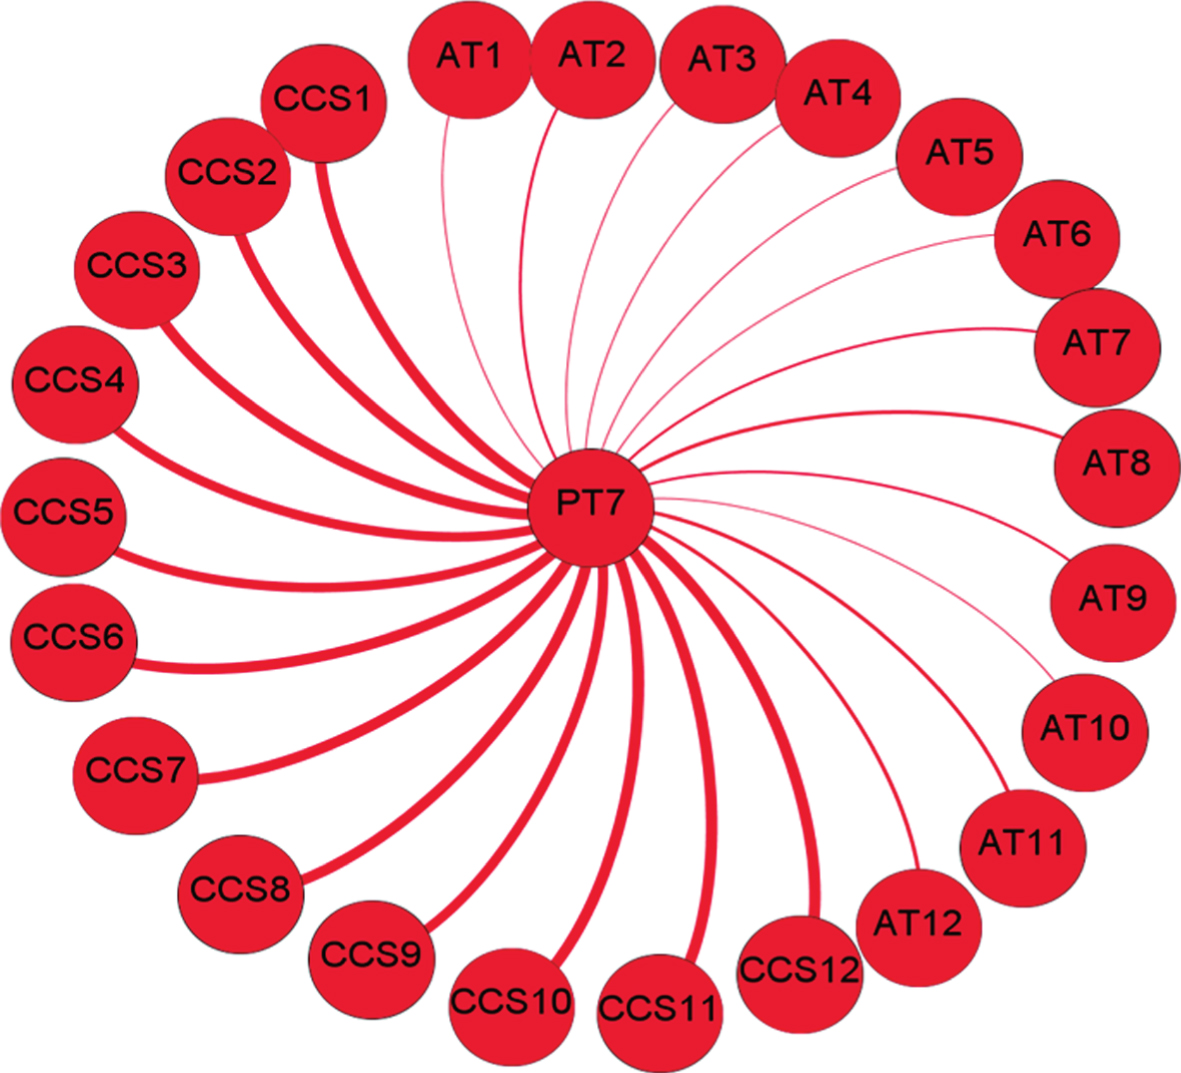
The knowledge Graph of PT7, when the CCS is a value of 7 or more and AT is a value of 3 or less.
For PT8, there are 12 CCS values equal to or below 4.0 points, and lead to 9 AT values are more than 8.0 hours. And all of 12 courses are more than suggested training hours (see Table 14 & Fig. 12).
The data of PT 8, when the CCS is a value below 4 and the value of AT is 8 or higher
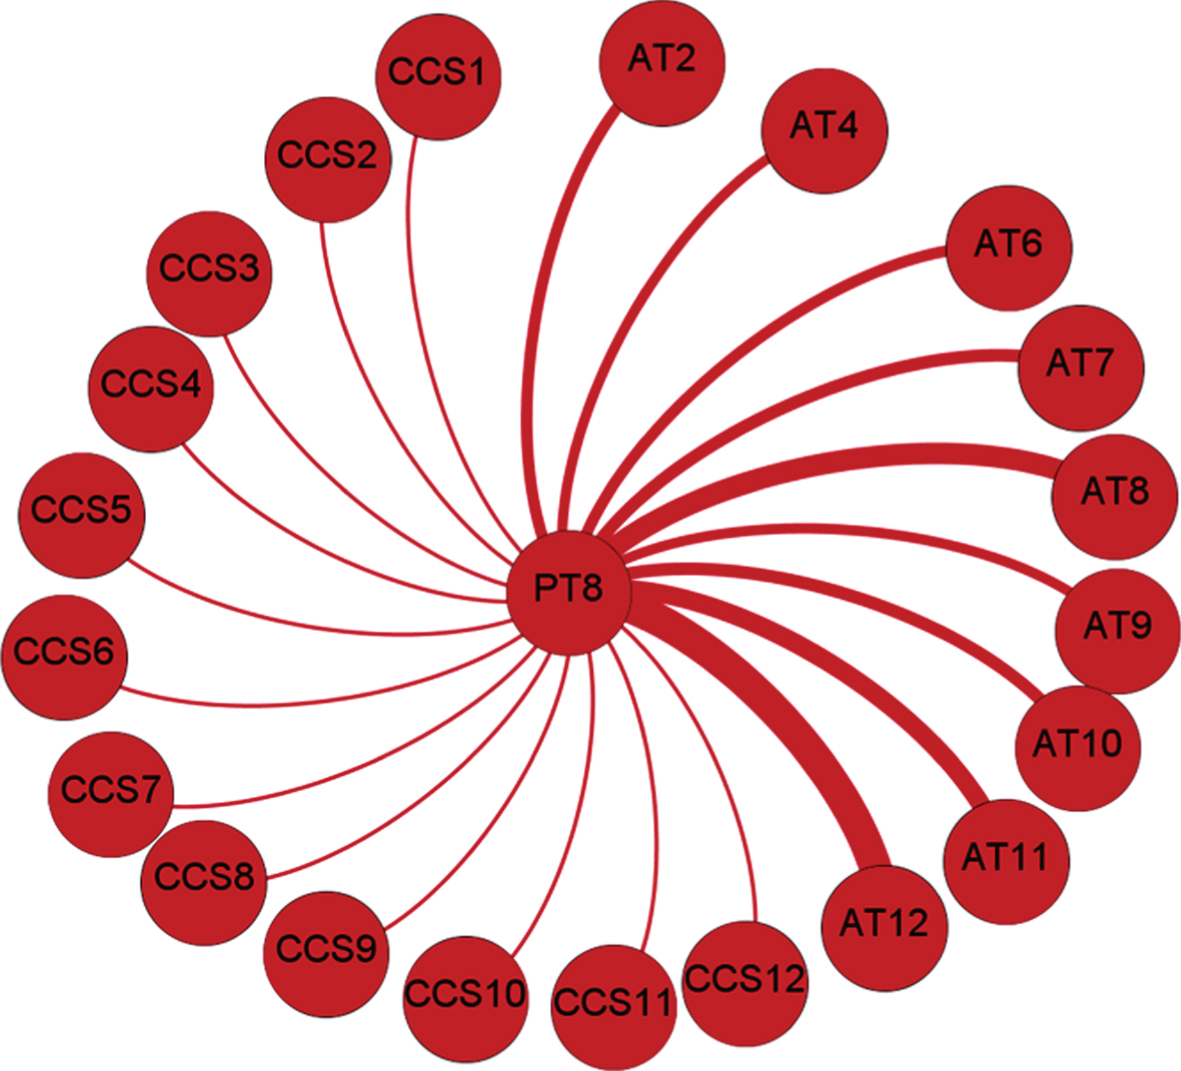
The knowledge Graph of PT8, when the CCS is a value below 4 and the value of AT is 8 or higher.
For PT9, there are 7 CCS values equal to or more than 7.0 points, and lead to 5 AT values are equal to or less than 3.0 hours. And 4 of 12 courses are within suggested training hours (see Table 15 & Fig. 13).
The data of PT 9, The CCS is a value of 7 or more and AT is a value of 3 or less
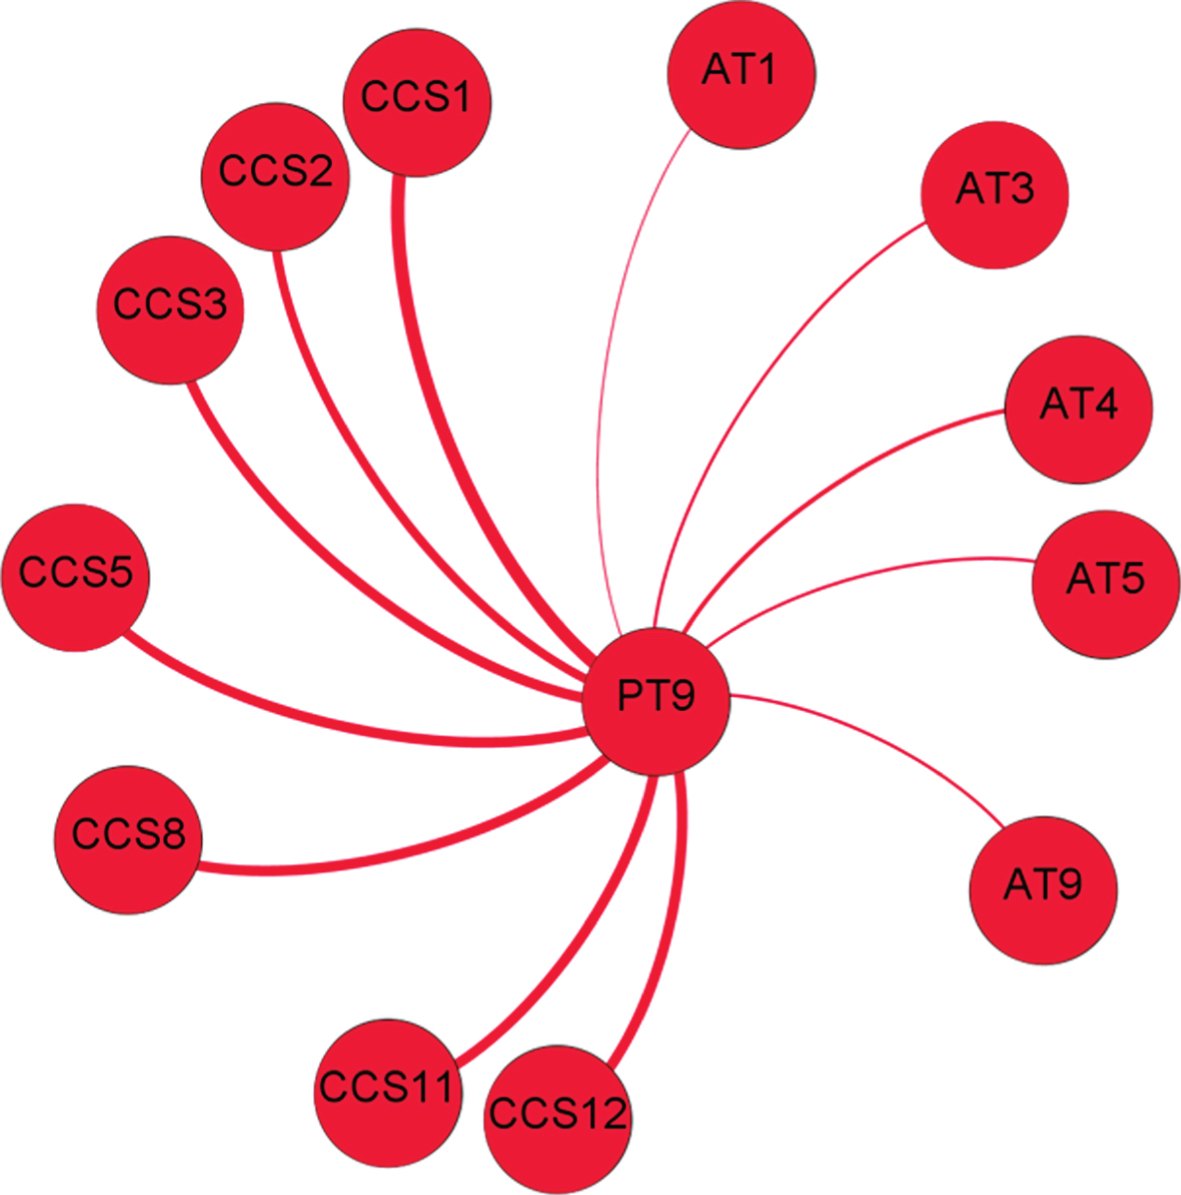
The knowledge Graph of PT9, when the CCS is a value of 7 or more and AT is a value of 3 or less.
For PT9, there is no CCS values equal to or below 4.0 points, but lead to an AT values equal to or more than 8.0 hours. And 8 of 12 courses are more than suggested training hours (see Table 16 & Fig. 14).
The data of PT 9, when the CCS is a value below 4 and the value of AT is 8 or higher
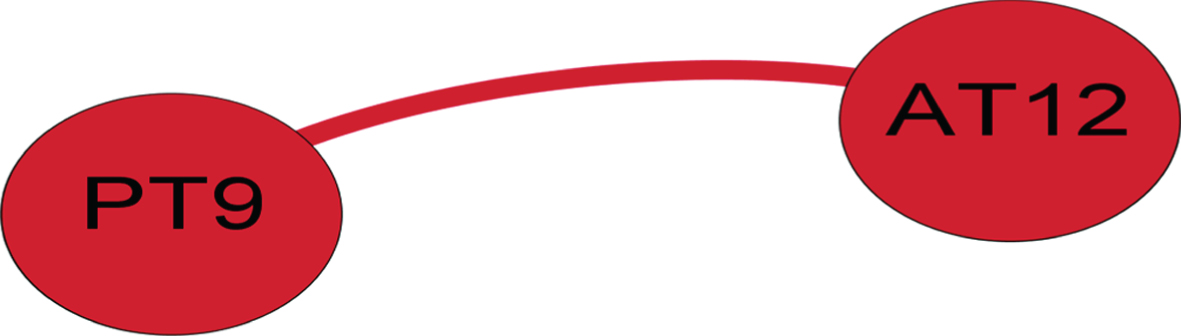
The knowledge Graph of PT9, when the CCS is a value below 4 and the value of AT is 8 or higher.
For PT10, there are 12 CCS values equal to or more than 7.0 points, and lead to 10 AT values equal to or less than 3.0 hours. And all of them are within suggested training hours (see Table 17 & Fig. 15).
The data of PT 10, The CCS is a value of 7 or more and AT is a value of 3 or less

The knowledge Graph of PT10, when the CCS is a value of 7 or more and AT is a value of 3 or less.

The knowledge Graph of PT11, when the CCS is a value of 7 or more and AT is a value of 3 or less.
For PT11, there are 2 CCS values equal to or more than 7.0 points, and lead to 5 AT values equal to or less than 3.0 hours. And 5 of 12 courses are within suggested training hours (see Table 17 & Fig. 15)
For PT11, there is no CCS values equal to or below 4.0 points, and lead to 3 AT values are more than 8.0 hours. And 5 of 12 courses are within suggested training hours (see Table 19 & Fig. 17).
The data of PT 11, The CCS is a value of 7 or more and AT is a value of 3 or less
The data of PT 11, when the CCS is a value below 4 and the value of AT is 8 or higher
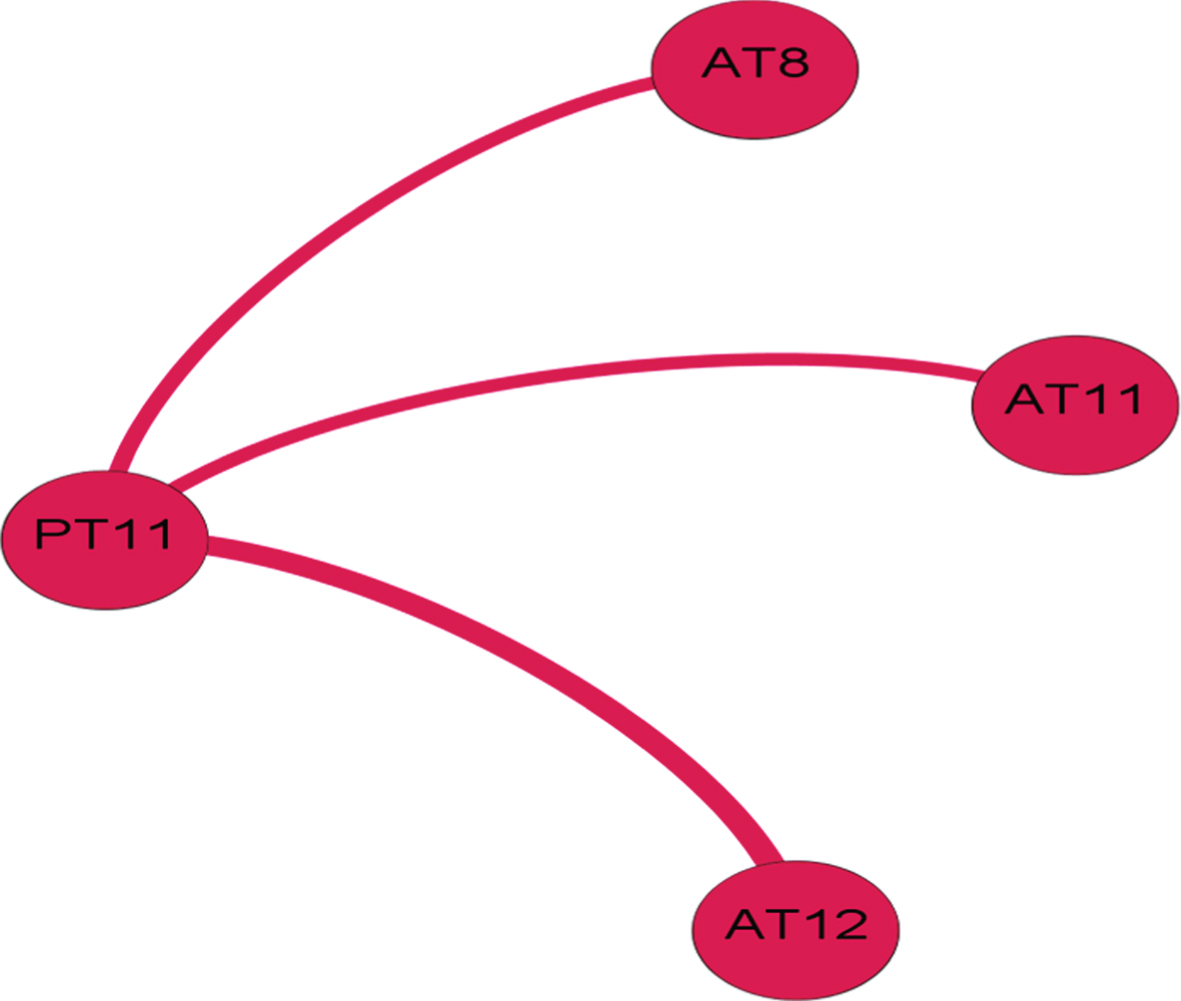
The knowledge Graph of PT11, when the CCS is a value below 4 and the value of AT is 8 or higher.
For PT12, there are 12 CCS values more than 7.0 points, and lead to 9 AT values are equal to or less than 3.0 hours. And 10 of 12 courses are within suggested training hours (see Table 20 & Fig. 18).
The data of PT 12, The CCS is a value of 7 or more and AT is a value of 3 or less
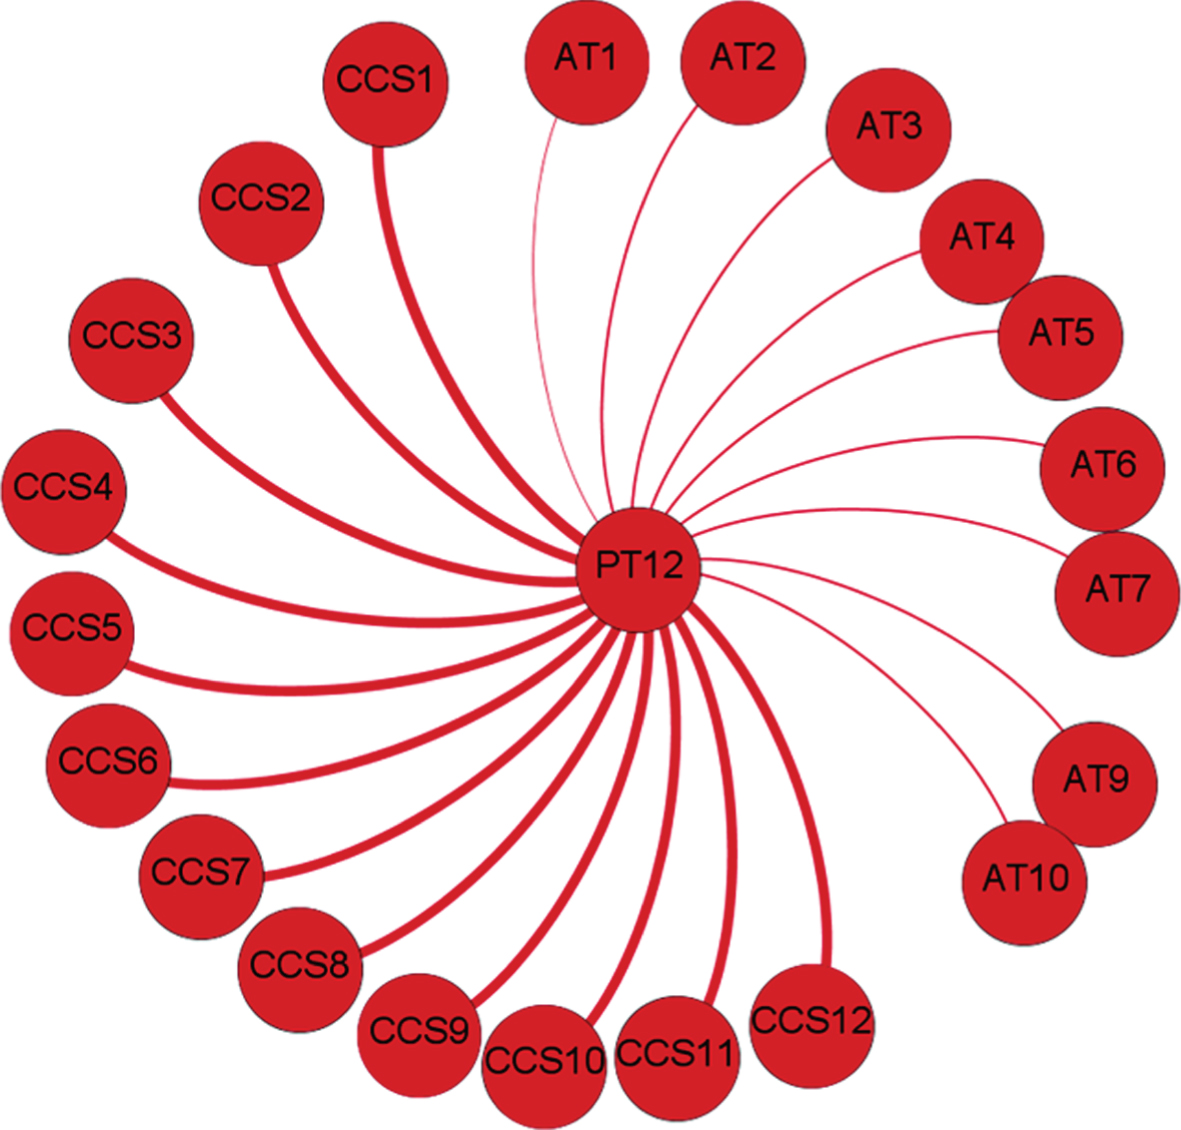
The knowledge Graph of PT12, when the CCS is a value of 7 or more and AT is a value of 3 or less.
From the results above, we had some findings as below: If the Course Component Score from LCG is less than 7 points, then the actual training hours will be more than suggested. From the knowledge graph has shown that is a native-relation between CCS and AT hours. By the limitation of sampling size, we could not precisely conduct the ratio of CCS and AT hours. 3 Pilot Students (PT1, PT7, PT10) can complete the course11&12 within suggested time. In the challenge courses, it will appear the gap between Strong and Weak performance of pilot students. The amount of courses that CCS values is below 4 points, it lead to the amount of courses would not within suggested training hours.
- Strength:
The pilot training forecasting system can easily find out the relevant of elements.
-Weakness:
By the limitation of LCG score, the strength of the elements on the pilot training knowledge graph cannot be recognized easily. The CCS is the sum of Maneuvers Grades and SRM Grades score, but we don’t know the distribution of them. Thus, we know the relevant of course component and performance, but could not understand the detail.
For the future work, we can adjust the method of data collecting. Collect the Maneuvers Grades and SRM Grades score separately, to analyze strength and weakness of each student in each course. And attempt to construct the connection of each course, to get a precisely prediction.
Conclusions
In the research using Customized knowledge graph methods, calculated by data analysis software-Gephi. We selected 12 of 24 sets data, and filtered the original data by two different sets of criteria. It turned out the 18 Knowledge Graphs of 12 pilot students by 18 datasets.
From the results obtained, it can be understood that the Customized Knowledge graph is an efficient method to intuitively discover patterns, isolate structure singularities or faults during data sourcing. Regardless the lack of samples, we have proposed a new way to forecast the training hours of student pilot. Hence, these findings help airliners to forecast the expense in pilot training, include money and time. Making decision much more effectively and easily in pilot training policy for individual pilot (e.g. continue training or not?). Furthermore, the forecasting system can be applied to any level of pilot license or training. The airline managers could find out the relevant of human factors and LCG scores in each pilot student, in order to improve the aviation safety. From the perspective of each student, The predict system will easily analyze and forecast in the following training. The instructor or student not only understand the cost in the future, but also know how to improve the learning results.