
Abstract
This study developed a smart cane with remote electrocardiogram (ECG) and fall detection. The cane comprises a self-developed ECG detection circuit, fall detection module composed of a three-axis gyroscope and three-axis accelerator, and two wireless transmission modules. The data reception end features a human–machine interface with self-developed ECG analysis and fall detection programs, providing reference data for identifying an abnormal situation. The hardware of the proposed system is divided into two parts. First, ECG detection is achieved using a copper column-shaped detector in place of conventional ECG electrodes. The self-developed sensor circuit amplifies the collected signals and filters unwanted noise to generate complete ECG signals. An Arduino MEGA microcontroller board and the two wireless transmission modules then transmit the signals to the human–machine interface. Second, fall detection is achieved using the aforementioned fall detection module to collect numerical data, which are then transmitted to the human–machine interface through the Arduino MEGA and wireless transmission modules. The proposed system can be applied to real-time monitoring and provide reference data for health care professionals and nursing personnel.
Introduction
In the United Nations’ most recent analysis on the trend of population aging, the worldwide proportion of older adults aged≥60 years was 13% [1]. In Taiwan, the proportion of older adults aged≥65 years reached 14% in 2018, making the country an aged society [2]. In the most recent report by the World Health Organization [3], heart attacks were ranked first among the top 10 causes of death worldwide, and ranked second among older adults aged≥65 years in Taiwan [4]. Falls are another prevalent problem among older adults, who often experience knee deterioration and impaired physical mobility; in Taiwan, falls are the common cause of accidental death among older adults aged≥65 years [5]. To alleviate inconvenience for people with impaired physical mobility, various assistive devices have been created, including wheelchairs, walking canes, and walking aids; walking canes are the most common. However, most commercially available walking canes emphasize that their function is to help users walk more efficiently; few products feature functions for monitoring users’ physiological conditions.
Conventional electrocardiogram (ECG) devices are large, expensive, and cannot be integrated with assistive devices. ECG detection mostly involves the use of adhesive electrodes by healthcare professionals. Consequently, its operation can be highly inconvenient and it cannot be applied to home health care or real-time data acquisition. Although scholars have proposed various ECG detectors for home use, they are mostly designed for people without impaired physical mobility, not those requiring walking aids [6–9]. Furthermore, such detectors mainly focus on circuit design, physiological signal capture, and data transmission [10–14]; few emphasize analyzing the acquired ECG signals. Regarding fall detection, scholars have adopted methods such as video surveillance and smart floor tiles [15,16, 15,16]. However, no study has explored fall detection during walking.
According to the aforementioned assertions, this study proposed a smart cane with remote electrocardiogram (ECG) and fall detection. The hardware of the proposed system comprises an ECG detection circuit made of copper columns and a fall detection module with a three-axis gyroscope and three-axis accelerator for capturing signals. After captured signals are processed, they are transmitted through wireless transmission modules to a remote monitoring display. Regarding the software of the proposed system, ECG analysis software is used to examine P- and R-wave signals captured by the ECG detector, which can identify cardiac arrhythmia. Fall detection signals are captured by an Arduino MEGA microcontroller board and analyzed using mathematical equations; the results are displayed on a human–machine interface to indicate whether a fall or tilting has occurred. This study used LabVIEW software to develop a window interface. The proposed system can be applied to real-time monitoring and provide reference data for health care professionals and nursing personnel.
System framework and hardware design
Overall system structure
The system framework is divided into three areas, namely the front-end detection device, signal processing device, and back-end display (Fig. 1). ECG detection involves the use of a detector made of copper columns. The detector detects micro-ECG signals from users’ palms, and the detected signals are amplified and filtered before being captured by the Arduino MEGA. Subsequently, the signals undergo analog-to-digital conversion (ADC) before being transmitted by the wireless module to the ECG analysis program written by using the LabVIEW platform. The analysis results are then displayed on the human–machine interface. Fall detection signals are detected by the MPU-6050’s three-axis gyroscope and three-axis accelerator. Data are captured by the Arduino MEGA and transmitted to LabVIEW through the wireless module. The data are calculated, and the calculation results are displayed on the human–machine interface.
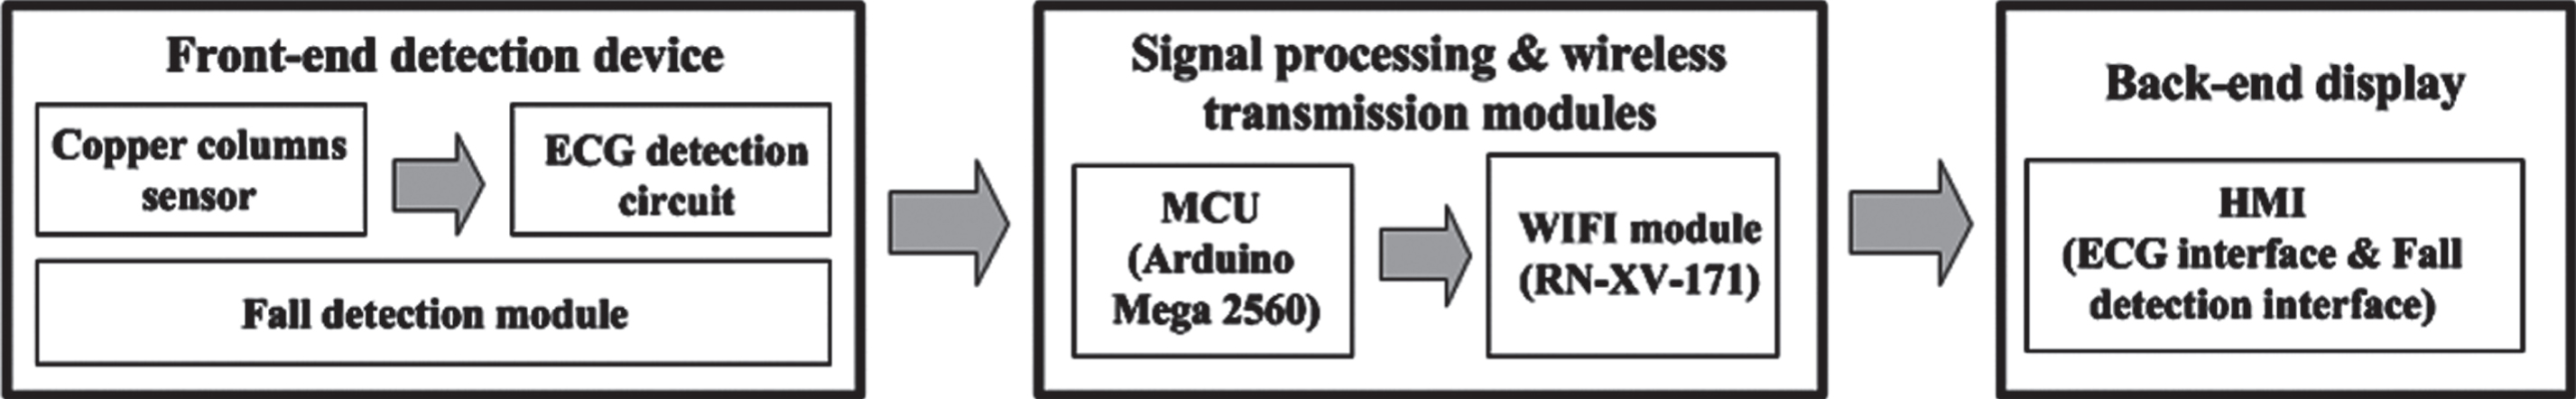
Overall structure of proposed system.
The front-end detection device is composed of a copper column detector and detection circuit. The copper column detector senses micro-ECG signals from users’ palms. The fall detection module is composed of the MPU-6050 three-axis gyroscope and three-axis accelerator, and determines the tilt angle of the user. The detection circuit is composed of an instrumentation amplifier, Butterworth low-pass filter, and noninverting amplifier to measure ECG signals
Design of the copper column detector
To ensure the copper column detector’s accuracy, this study tested three metal materials, namely copper, iron, and aluminum, which exhibit resistivity of 1.7 × 10⁻⁸, 9.78 × 10⁻⁸, and 2.82×10⁻⁸, respectively. Because copper has the highest conductivity as well as excellent ductility and malleability, it was selected as the column detector’s material (Fig. 2).

Image of copper columns.
The signals sent from the copper column detector to the detection circuit were extremely weak. Therefore, amplifiers were installed to magnify them and a filter was used to remove high- and low-frequency noise, thereby improving the detection accuracy. Surface-mount devices were used as detection elements to reduce the circuit size, which allowed the circuit to be installed in a walking cane. The designs of the instrumental amplifier, Butterworth low-pass filter, and noninverting amplifier are described as follows. Amplifier circuit design. The weak ECG signals detected by the copper column detector ranged between 10 and 20 mV. In general, such signals should be amplified to 500 mV to 2 V for subsequent analysis and processing with a microcontroller. Therefore, this study amplified the ECG signals by adopting a 10X instrumental amplifier and 6X noninverting amplifier to achieve an amplification rate of 60X. The instrumental amplifier features the AD620 integrated circuit manufactured by Analog Devices, Inc., which has the advantages of a simple amplification design and low energy consumption; hence, it is highly applicable to portable devices. Figure 3 illustrates the design of the instrumental amplifier circuit. Filter circuit design. A filter circuit removes noise from an amplified signal. The amount of high- and low-frequency noise that is filtered differs according to the type of physiological signal. ECG signals range between 0.1 and 100 Hz. This study adopted both high- and low-pass filters to remove noise from signals of different frequencies. The high-pass filter is composed of parallel-connected capacitors and resistors, and filters signals below 0.3 Hz to remove low-frequency interference caused by body vibrations and breathing. The entire detection circuit incorporates two high-pass filters that are separately placed behind the instrumental amplifier and Butterworth low-pass filter. The sixth-order Butterworth low-pass filter comprises an NE5534 integrated circuit and filters high-frequency signals above 17 Hz. The amplitude and frequency response of the Butterworth low-pass filter is generally flat in the passband, and the extent of amplitude attenuation in the cutoff region is low. A Butterworth low-pass filter of a high order is more effective at noise filtration and exhibits a favorable roll-off rate. However, the circuit of such a filter is also more complex. Figure 4 presents the design of the filter circuit. Noninverting amplifier. ECG signals amplified using an instrumental amplifier and filtered by a filter are insufficient for analysis. Therefore, a noninverting amplifier was placed behind the filter to further magnify the ECG signals. Furthermore, the noninverting amplifier effectively removes common-mode signals. Figure 5 illustrates the design of the noninverting amplifier. Figure 6 presents a complete circuit diagram of the ECG detection circuit.

Circuit diagram of the instrumental amplifier.

Circuit diagram of the sixth-order Butterworth low-pass filter.

Circuit of the noninverting amplifier.

Circuit diagram of the ECG detection device.
An MPU-6050 (The production company is InvenSense. Located at Borregas Ave, Sunnyvale, CA, U.S.A) is a digital motion processor composed of a three-axis gyroscope and three-axis accelerator. The processor adopts an I2C (Inter-Integrated Circuit) bus to output six-axis rotation matrix digital data. It is commonly used to acquire motion data. Combining this processor with the Arduino MEGA enables the acquisition of angular speed and gravitational acceleration. The acquired data are transmitted through the wireless transmission modules to the human–machine interface for subsequent analysis. Figure 7 presents a circuit diagram of the MPU-6050.

Circuit diagram of the MPU-6050.
Signal processing is divided into two parts, namely the analog-to-digital conversion of ECG signals and the I2 C serial communication of the MPU-6050. Wireless transmission is achieved through two RN-171-XV wireless modules and a universal asynchronous receiver/transmitter, which is also used to output MPU-6050 and ECG data. The I2 C serial communication uses the SDA and SCL pins. Figure 8 illustrates the wiring diagram of the Arduino board and surrounding modules.
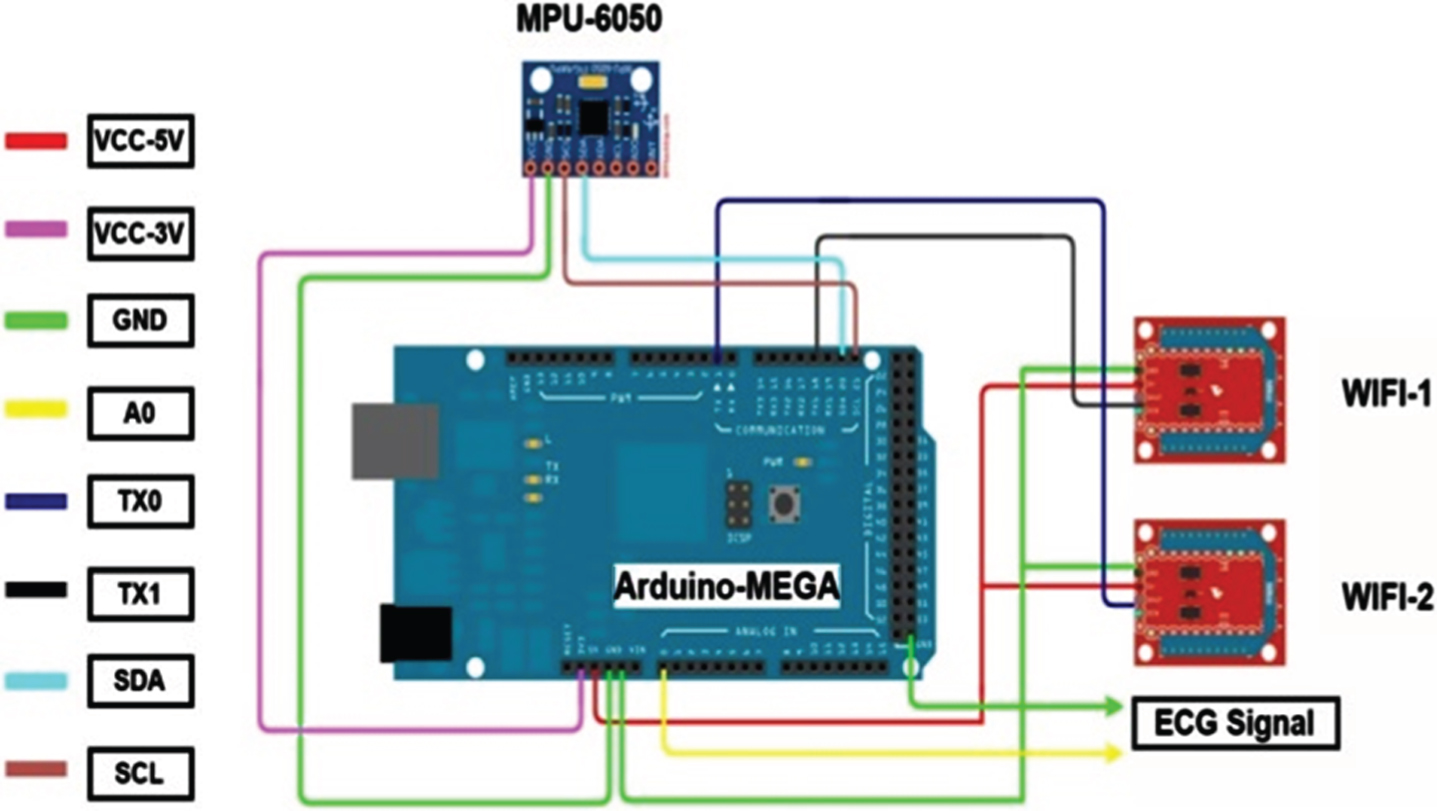
Wiring diagram of the Arduino MEGA and surrounding modules.
Regarding the signal processing, wireless transmission, and back-end interface display, software is required in addition to hardware configurations to control, capture, calculate, and display data as well as ensure the integrity of the proposed system. This study employed the Arduino MEGA as the core component for signal processing and a wireless module for data transmission. Finally, LabVIEW was used to perform data reconstruction and for the interface display. The development of related programs is described as follows.
Development of the data processing program
Design of the ECG signal capturing program
Because the ECG detection circuit captures analog signals, which are incompatible with LabVIEW, they should be converted into digital signals. Although LabVIEW has a built-in data acquisition function, it cannot perform wireless transmission. This study employed the Arduino MEGA as the core component for analog-to-digital conversion and data acquisition and the wireless module was used to transmit signals to LabVIEW. Data reconstruction, graphic generation, and data calculation and display are performed in LabVIEW. Figure 9 presents a flow chart of the Arduino MEGA capturing ECG signals, including the initial configuration, signal sampling, and data transmission.
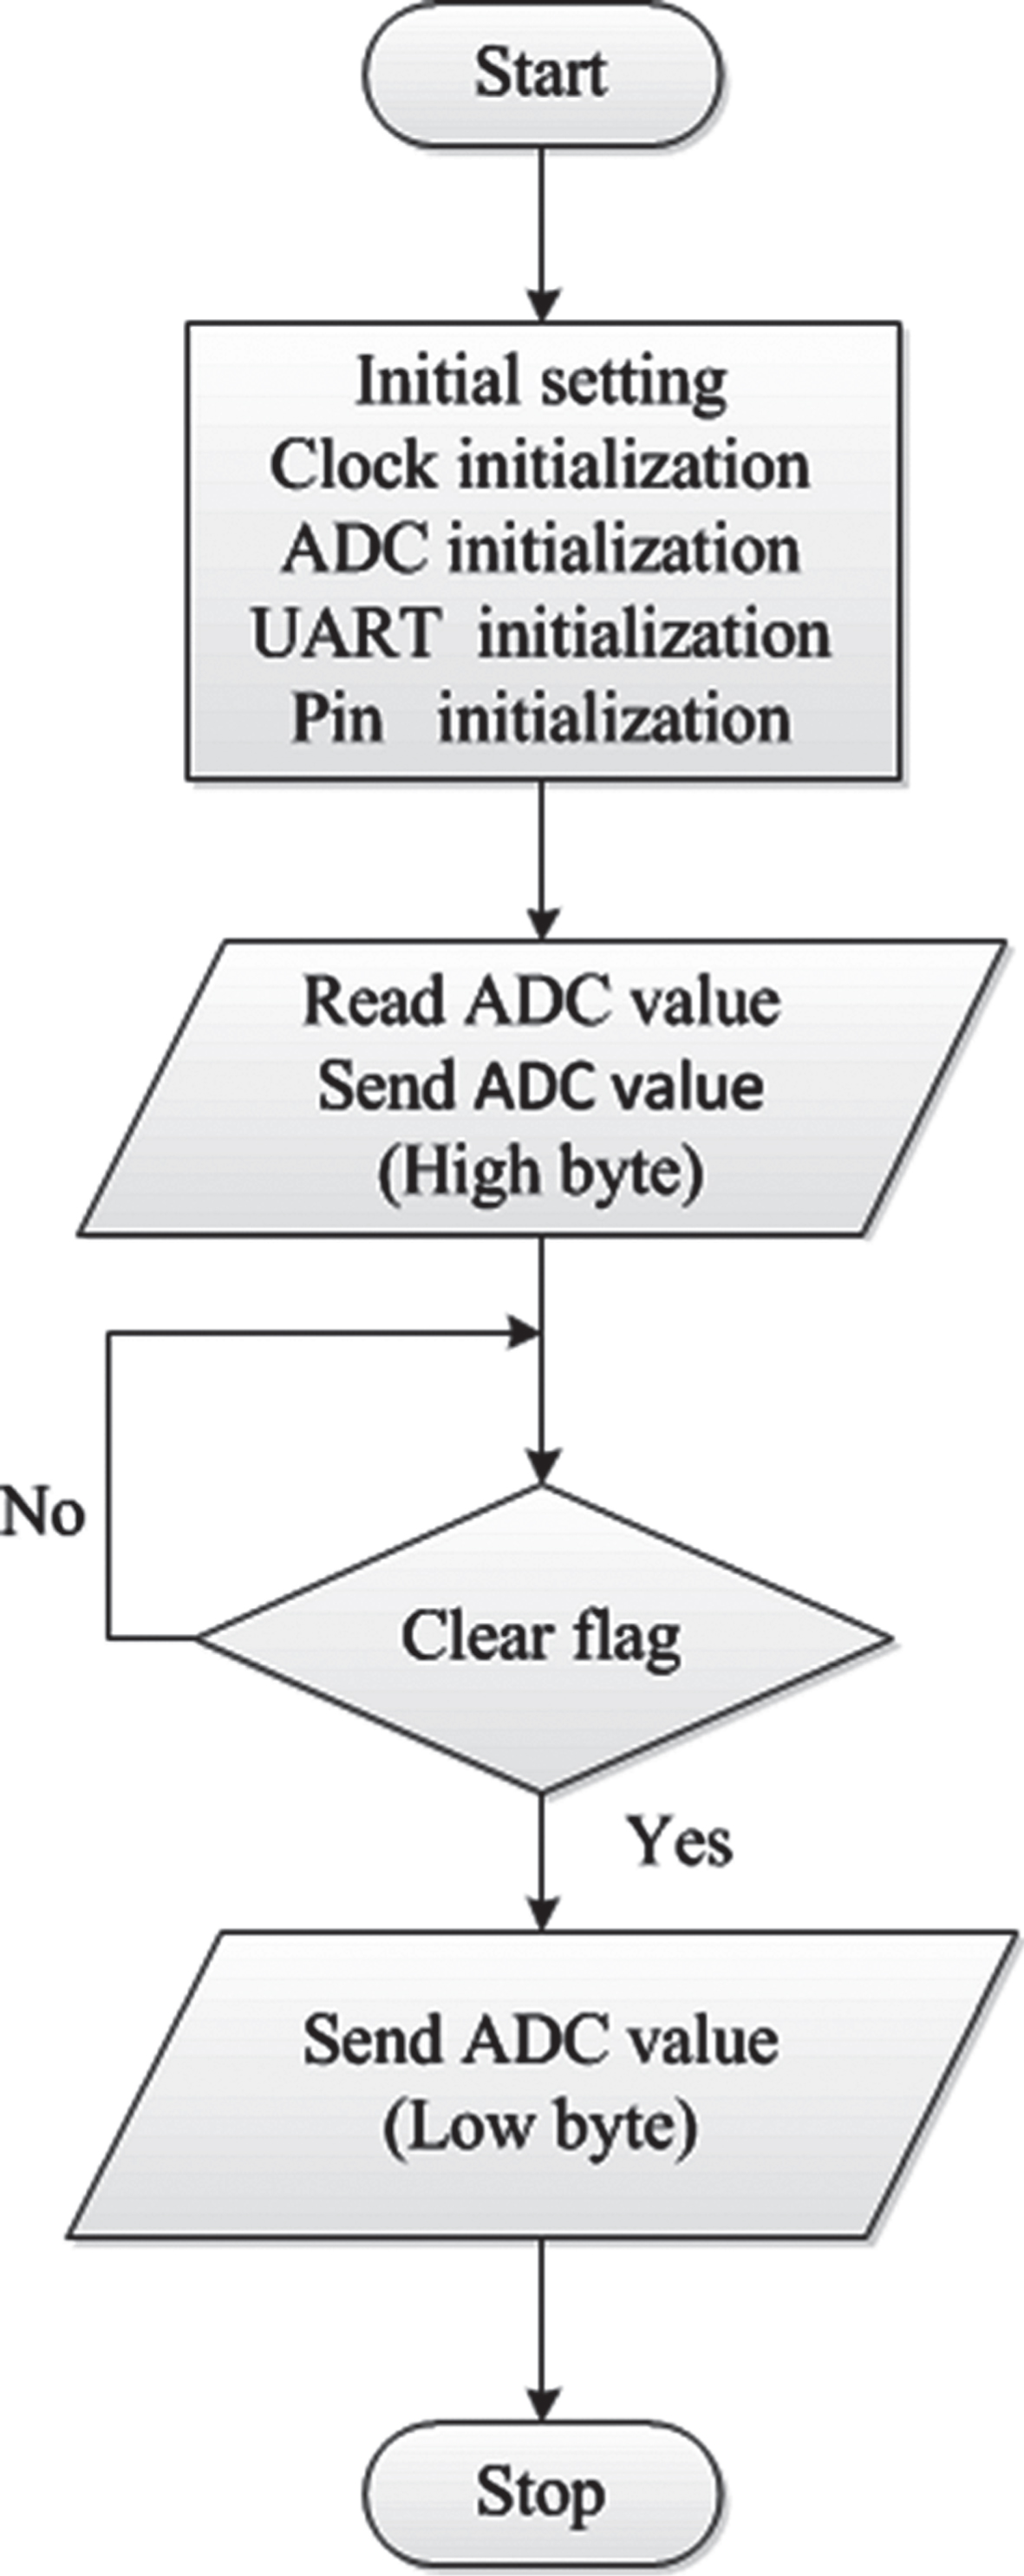
Program flow chart.
To read the angle data acquired from the three-axis gyroscope and three-axis accelerator, a program was required to drive the internal system. The MPU-6050 module employs the I2 C serial communication protocol. Because the Arduino MEGA is open-source, related function libraries can be found in the I2 C Device Library [17]. The downloaded function library can be placed in the main program library of the Arduino MEGA and opened in the Arduino integrated development environment.
Design of the fall detection program
The wireless modules were configured using the Tera Team terminal emulator program. The configuration steps were as follows: One of the RN-171-XV modules was connected to an XBEE module USB. Define the type area as indicated in Section 4.1. Tera Term was opened and a serial port was selected to access the program editing interface. Three “$” symbols were inputted into the editing interface to access the CMD mode, and the router name, router password, Internet Protocol (IP) address, and other related programs were typed. The programs were saved and restarted to complete the configuration.
Development of the human–machine interface
Development of the human–machine interface for heart rate examination
This study adopted LabVIEW for developing the human–machine interface, the functions of which include ECG signal capture, signal reconstruction, signal analysis, and identification of abnormal situations [18,19, 18,19]. The heart rate examination interface incorporates a home health care interface and professional health care interface. The first was mainly designed for users without professional medical knowledge, whereas the second was designed for those with such knowledge. Figure 10 presents a flow chart for the professional health care interface. Specifically, the P-P, R-R, and P-R wave intervals are examined, and the measurement data and warning lights are displayed on the interface. The process of identifying abnormal situations are described as follows: P-P wave data are collected continuously; a P-P wave interval greater or less than the standard value indicates an overly wide or narrow reading, respectively, and causes the proposed system to turn on a warning light. P-R wave data are collected continuously; a P-R wave interval greater or less than the standard value indicates an overly wide or narrow reading, respectively, and causes the proposed system to turn on a warning light. R-R wave data are collected continuously; an R-R wave interval greater or less than the standard value indicates an overly wide or narrow reading, respectively, and causes the proposed system to turn on a warning light.
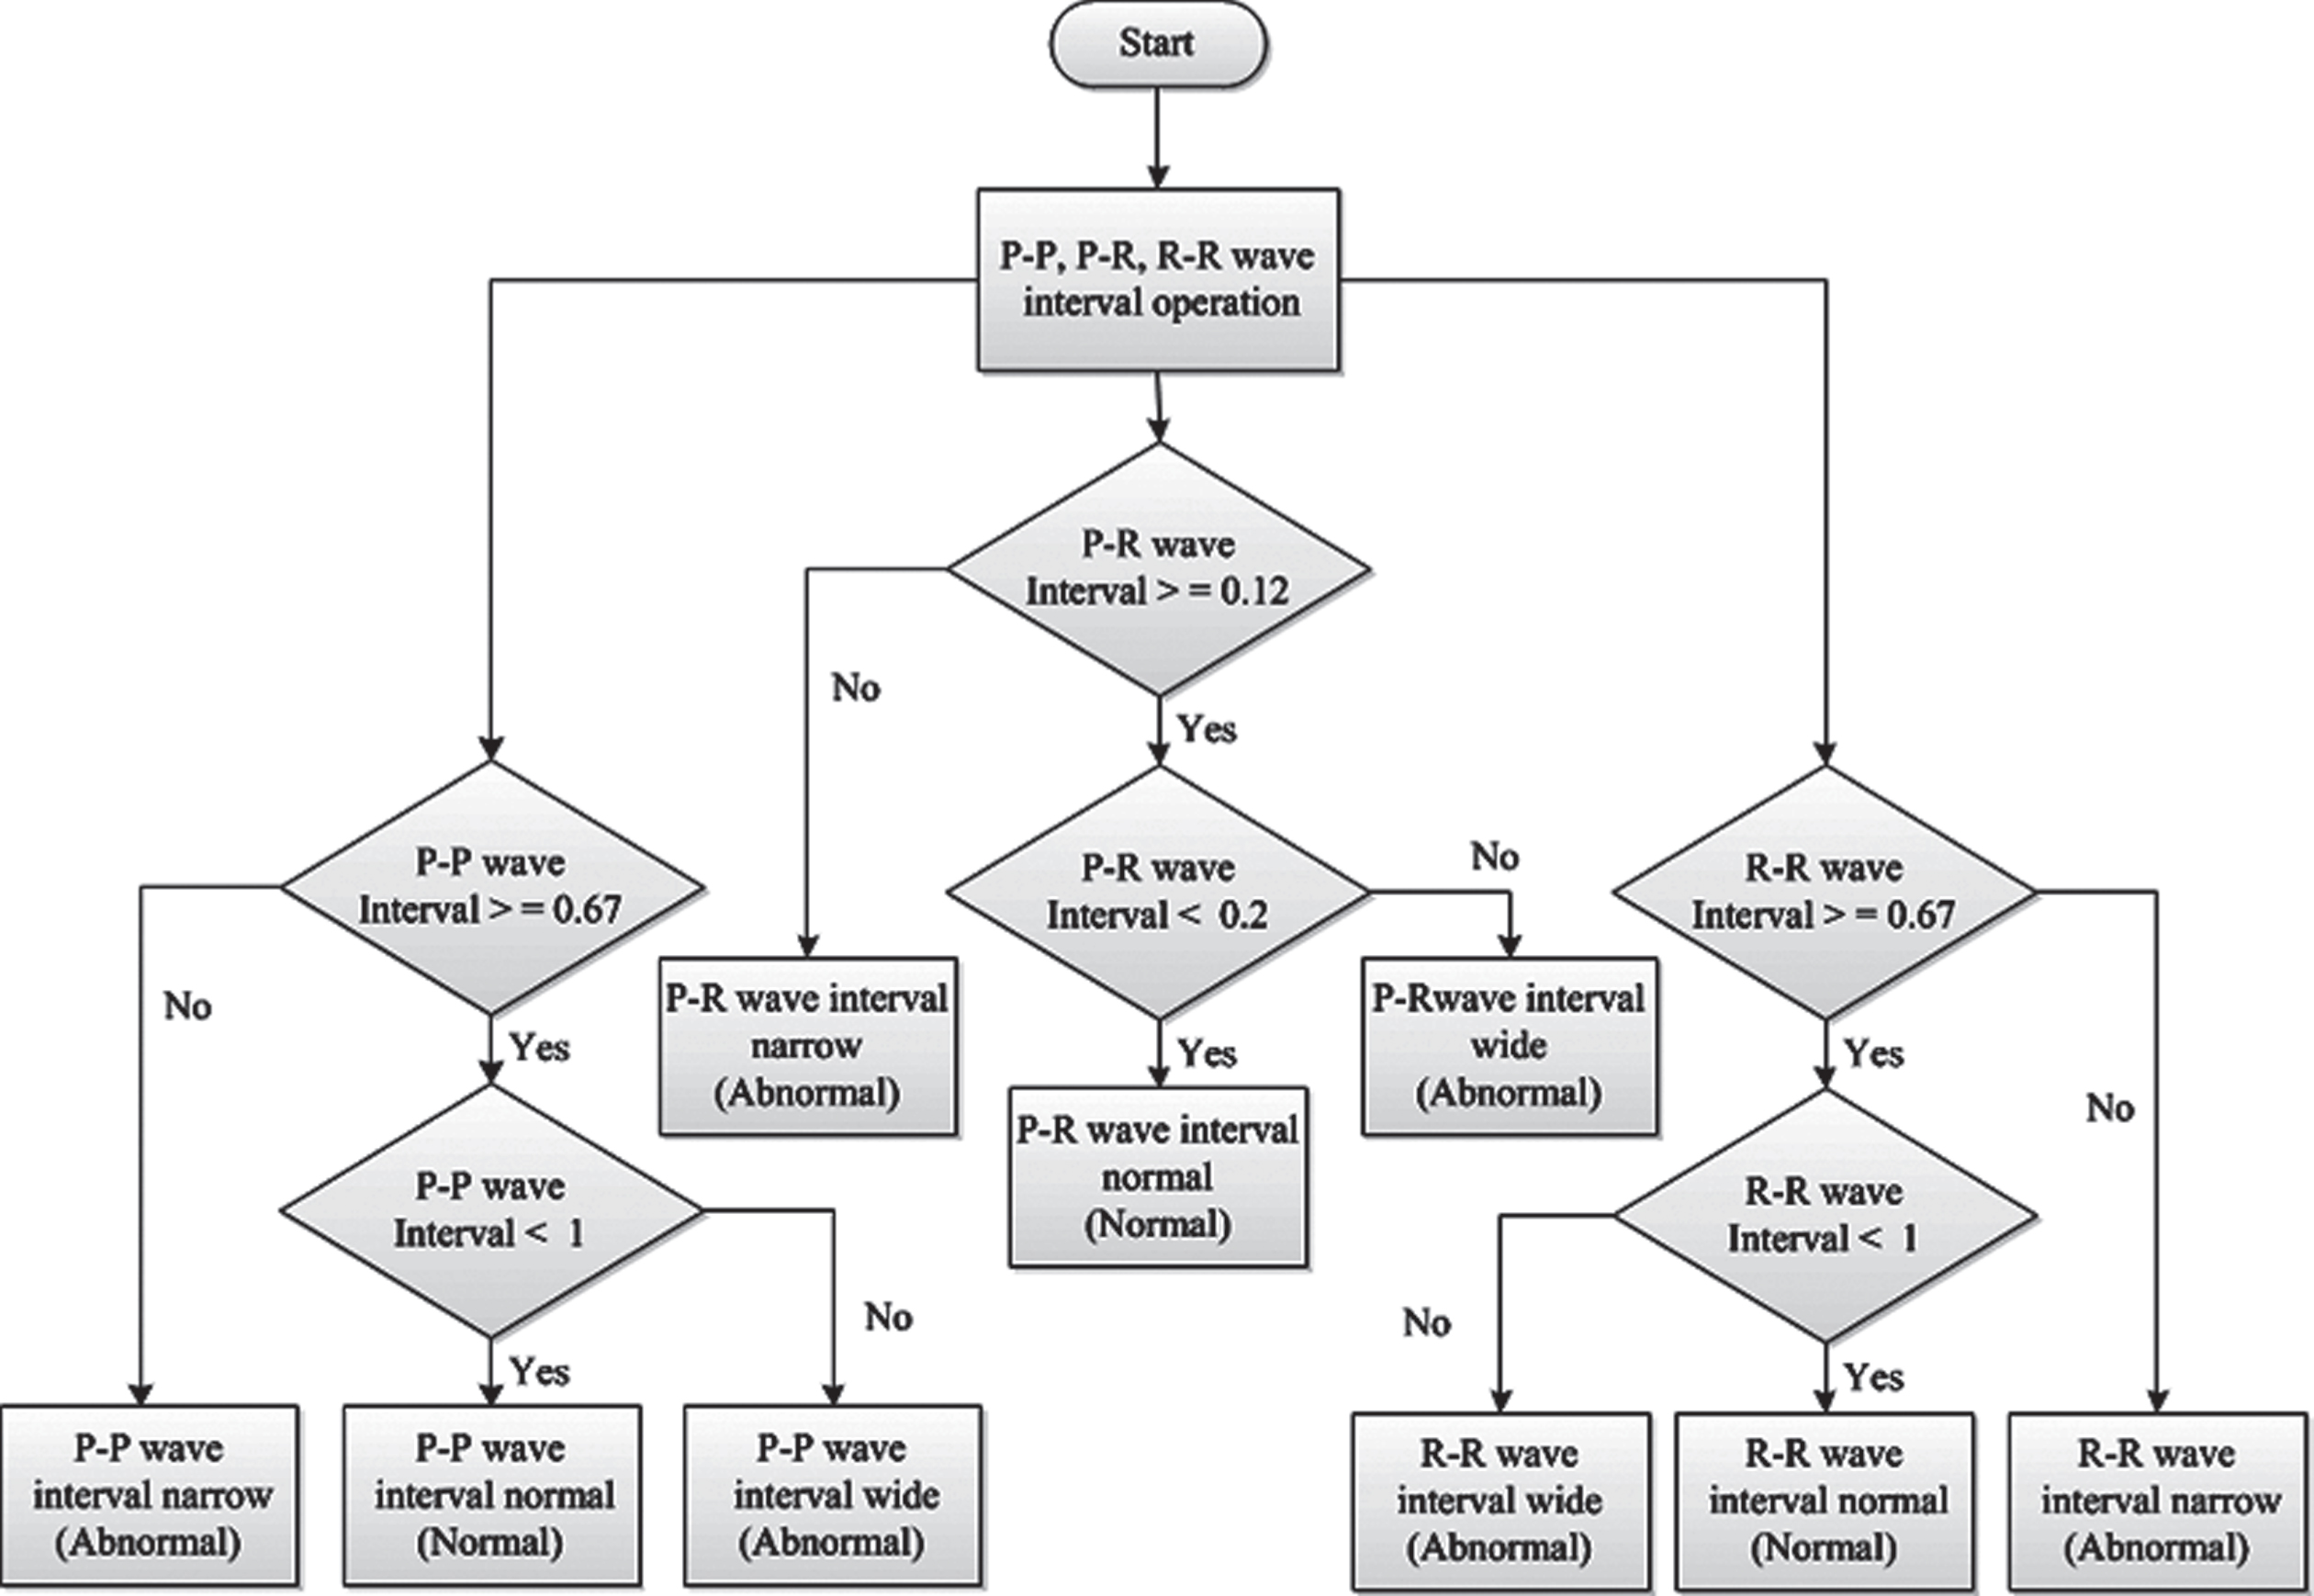
Professional health care interface for heart rate monitoring.
Figure 11 presents a flow chart for the fall detection interface. First, the Arduino program reads the six values obtained by the three-axis gyroscope and three-axis accelerator, namely gx, gy, gz, ax, ay, and az. These values are then converted and substituted into angle conversion equations to determine the related calculation results. Finally, the interface displays the tilt angle and fall detection results [20].
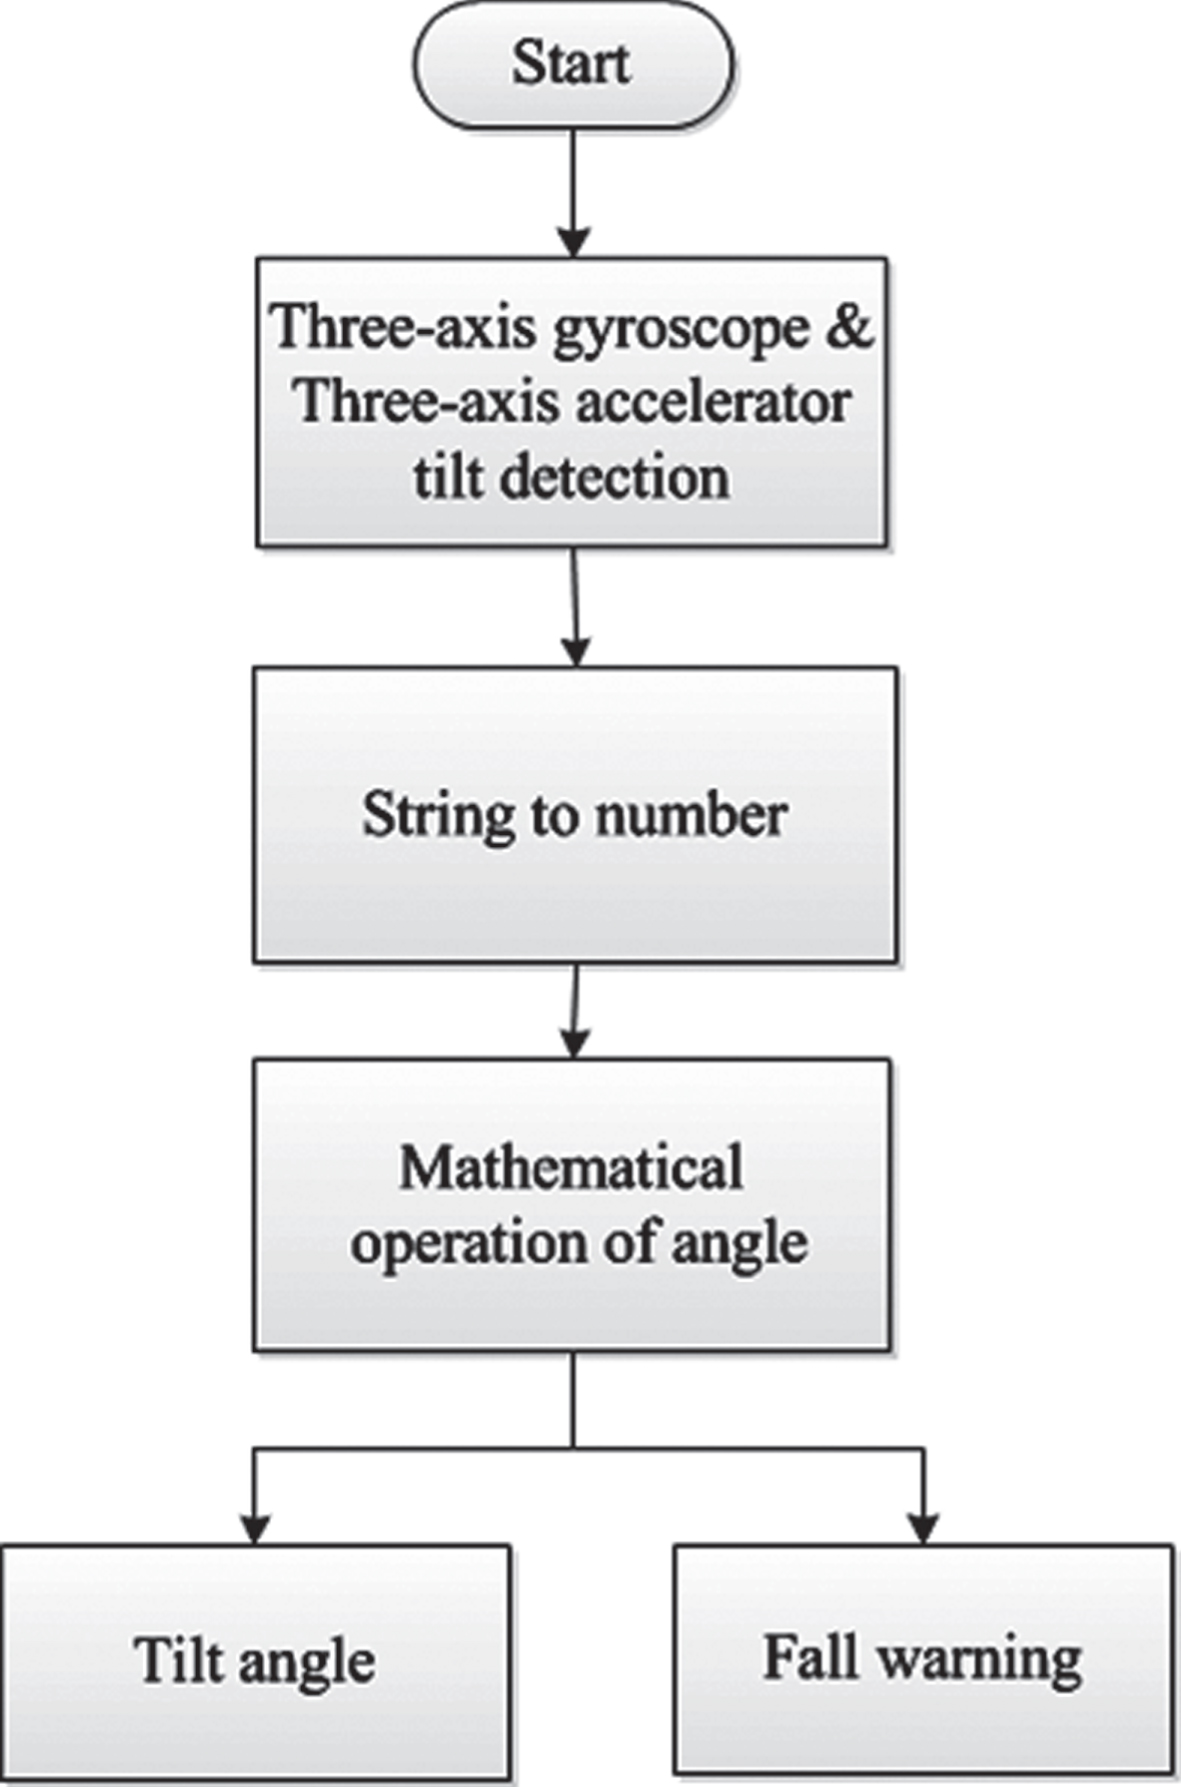
The flow chart for the fall detection interface.
The tilt angle is calculated as follows. Figure 12 presents the tilt model of the MPU-6050. Because gravitational acceleration is perpendicular to the horizontal axis, the following equations are used.
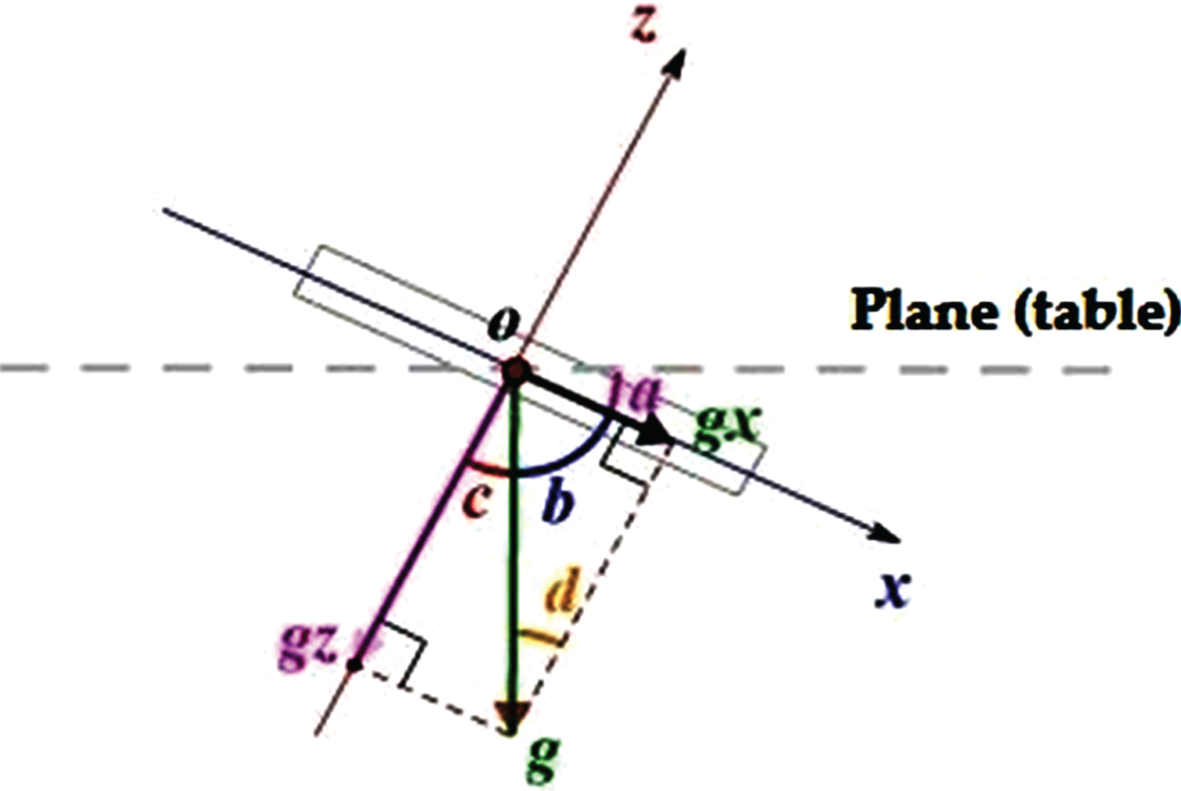
Tilt model of the MPU-6050.
Decomposing the force equation causes g, gx, and gz to form a rectangle, yielding the following equation:
The following equation is obtained using the law of sines.
Where g represents the acceleration of gravity, g x represents the component of gravity acceleration on the x axis, ∠a represents the angle between g x and the horizontal, ∠b represents the angle between g x and g, ∠c represents the angle between g z and g, and ∠d is the internal angle of ∠c.
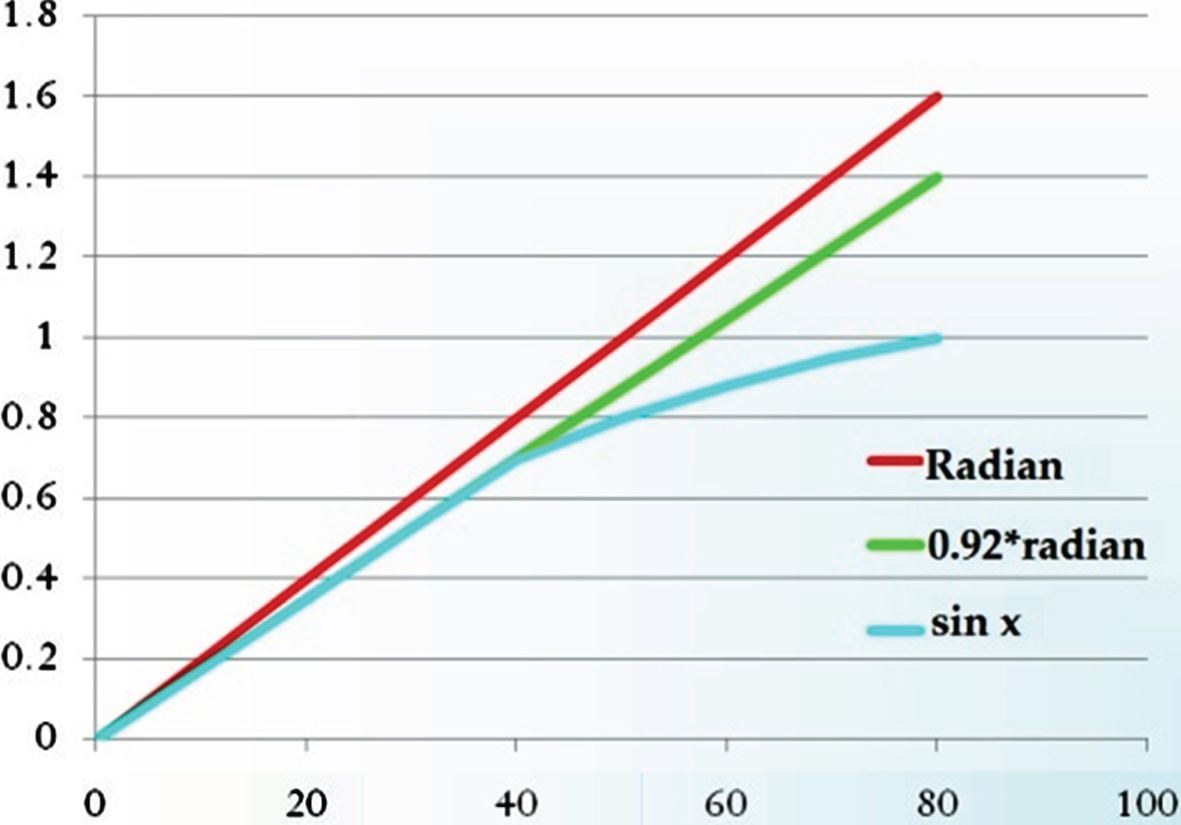
Figure 13 illustrates the curve diagram of the x-axis angle. The three curves each yield an equation, where k is the angle coefficient.
Curve diagram of the x-axis angle.
Following a series of comparisons, the following equations are obtained for angle calculation:
After the angle has been determined using the aforementioned equations, it can be substituted into other equations on the interface to determine the x-, y-, and z-axis angles as well as angle waveform graphs. When the tile value exceeds a certain threshold, the fall indication light flashes red.
Experiment preparations
This study used the Altium Designer software package (It is a PCB and electronic design automation software package. Production company location in Chatswood, Australia) draw self-designed circuits and convert the drawings into printed circuit boards for the circuit layout [21].
Subsequently, a mask aligner and etching machine were used to create the circuit boards, in which vertical interconnect accesses were created to weld related circuit components onto the boards. Figure 14(a) presents the physical device of the proposed system (length is 30 cm, width is 24 cm, height is 88 cm; weight is 1.3 kg). Physical detectors were separately placed in the handle and pillar of the walking cane. When users use both hands to grip the handle, a loop is formed to perform ECG detection. The plastic instrument box in the bottom of the walking cane contains various system modules, including the Arduino MEGA, ECG detection circuit, power source circuit, MPU-6050, and wireless modules, as shown in Fig. 14(b).
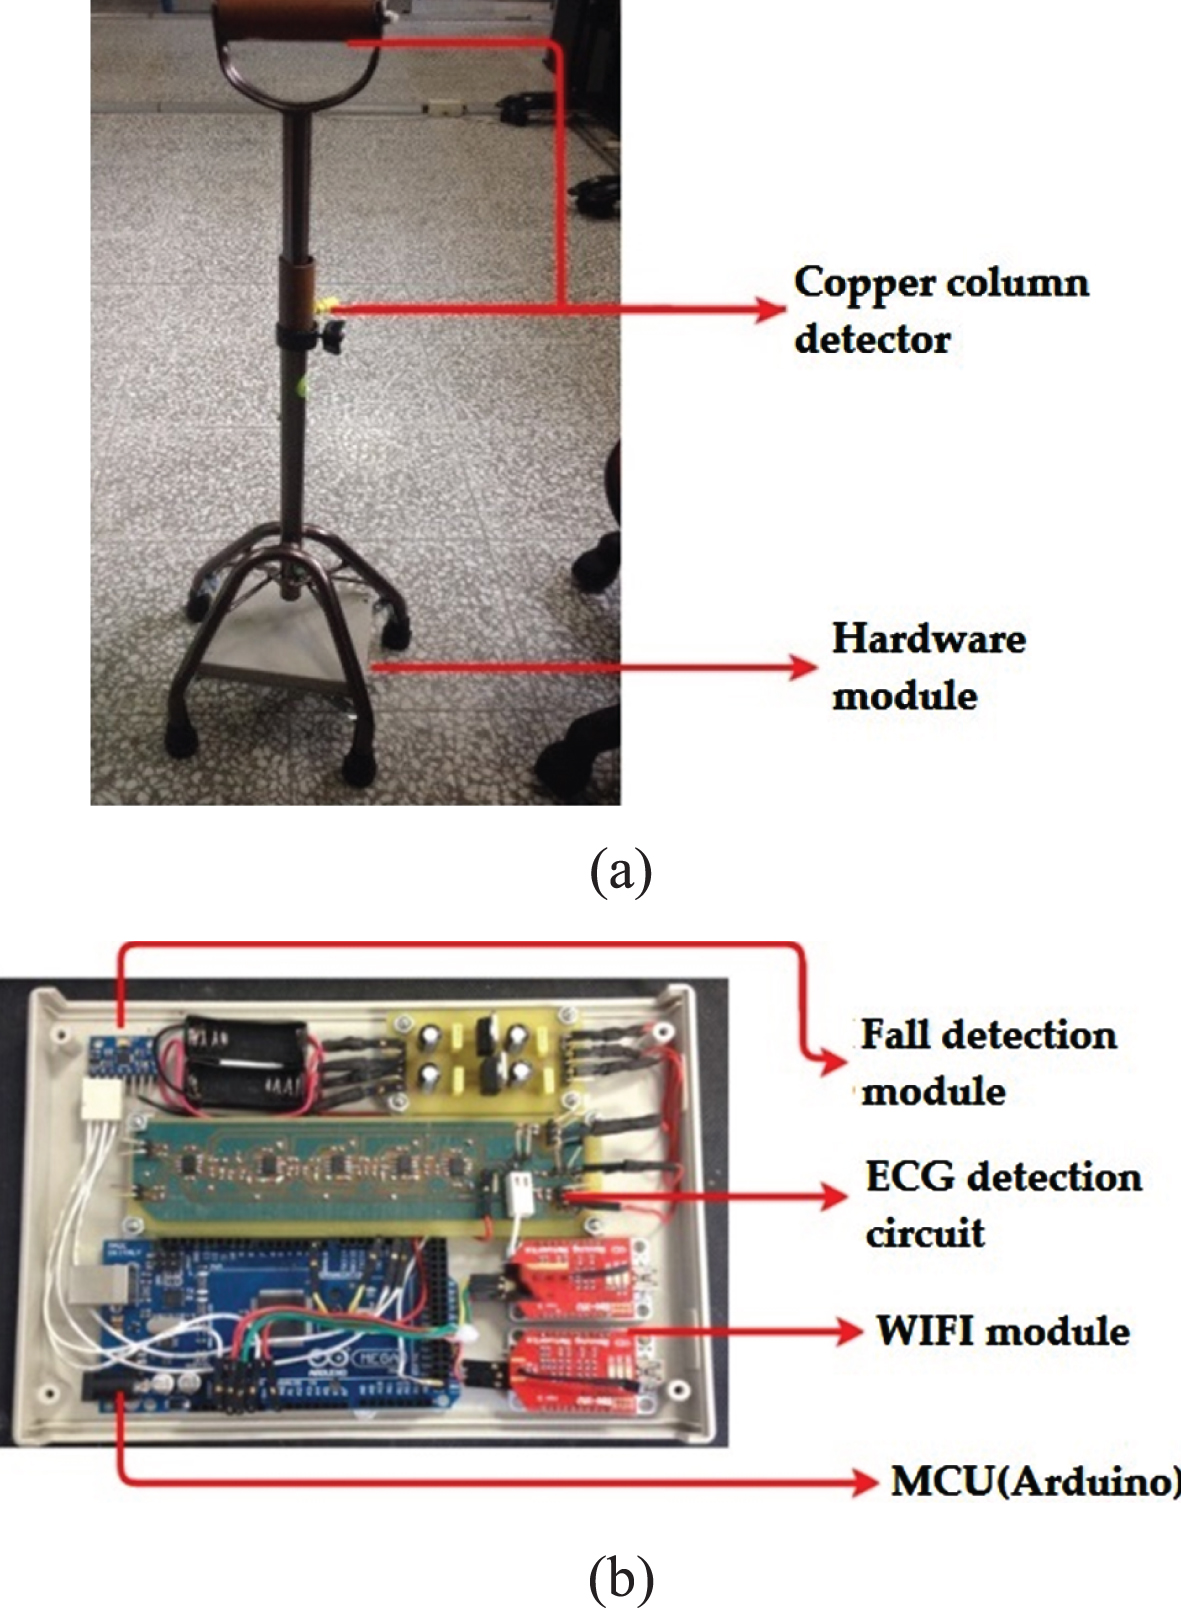
(a) Physical structure and (b) various modules of the smart walking cane.
Detection circuit testing
A Tektronix TDS3032B oscilloscope was adopted to conduct measurements. Although the collected data were amplified 10X using the instrumental amplifier, they could not be analyzed directly because they had not been filtered and a substantial amount of noise was present (Fig. 15).

Testing the instrumental amplifier’s output.
Figures 16(a) to (c) illustrate the ECG signal output of the filters. The signals obtained using the first-order filter, which removed high-frequency noise above 17 Hz, were still unsatisfactory for analysis. Therefore, second- and third-order filters were used to obtain a more complete ECG reading.
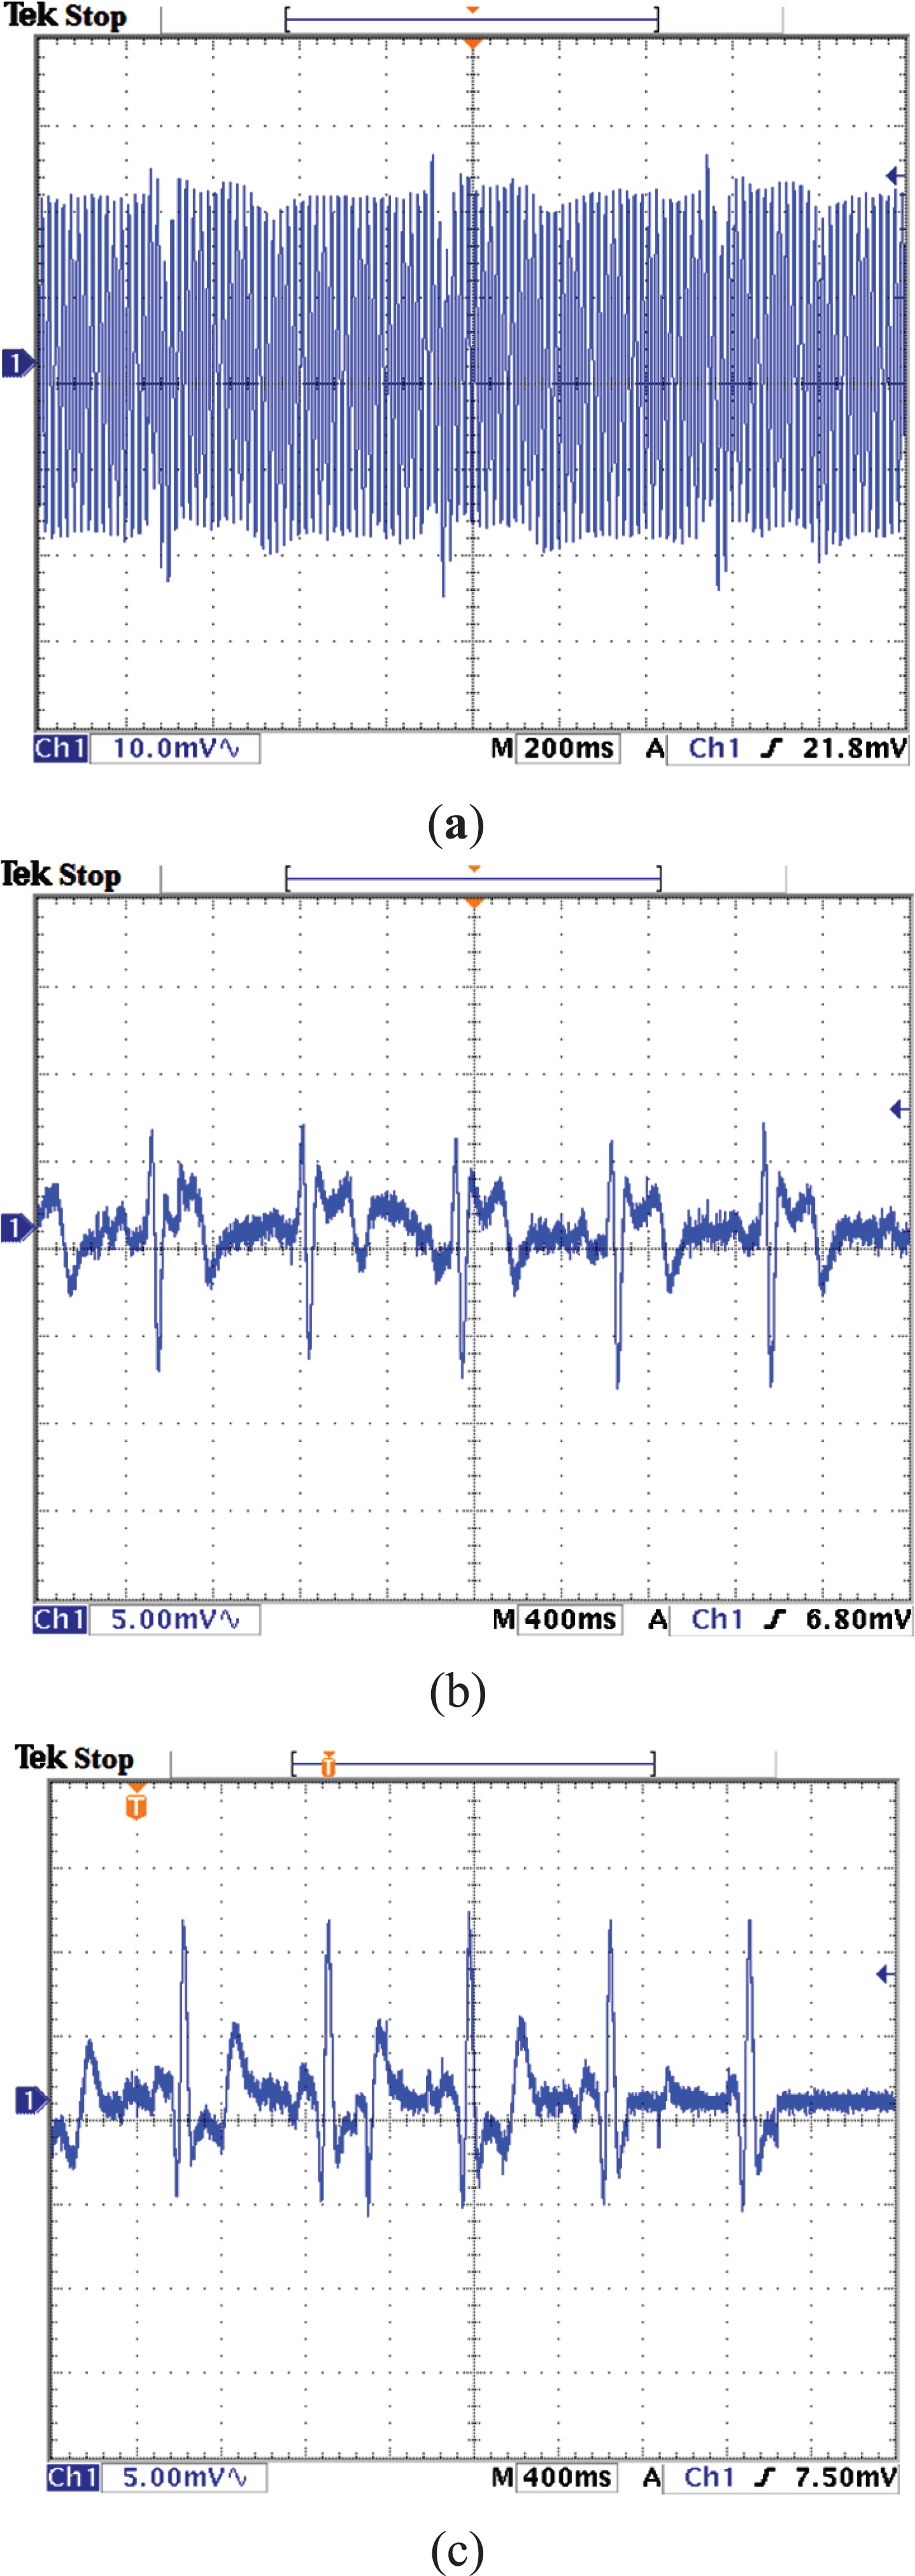
(a) First-order, (b) second-order, and (c) third-order ECG signal filter outputs of the Butterworth low-pass filter.
The filtered signals were amplified using the noninverting amplifier. As shown in Fig. 17, the amplified signals became observable.
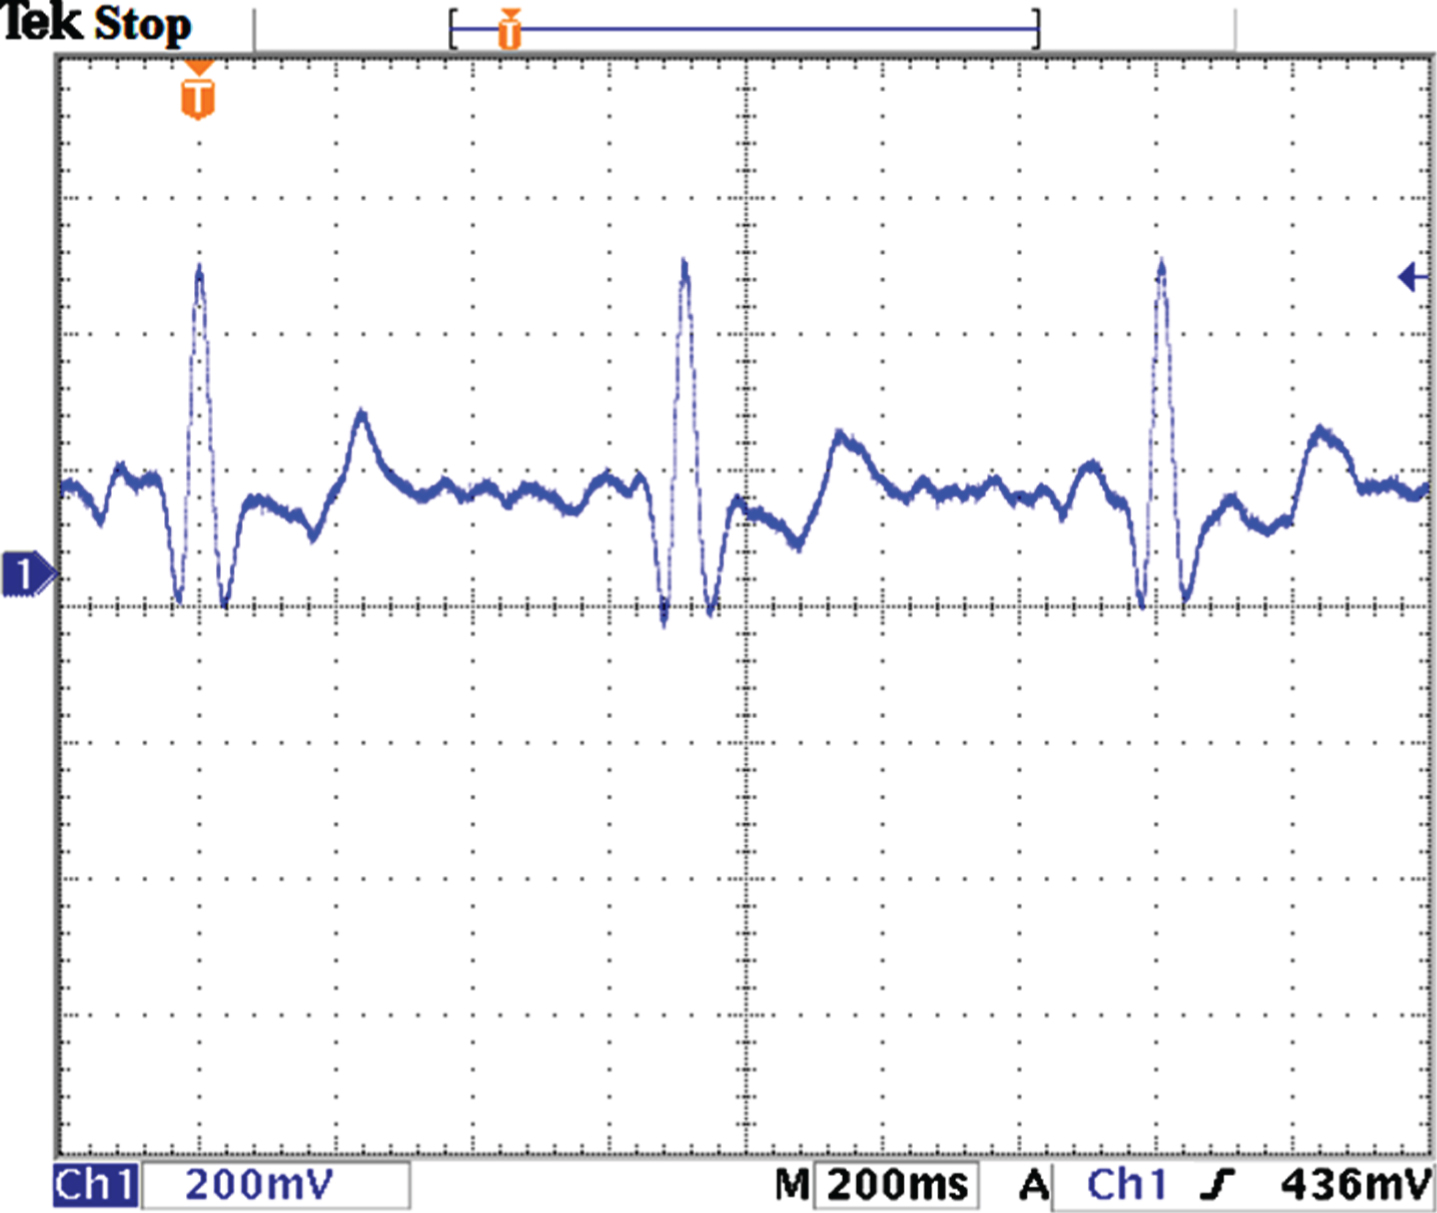
Testing the noninverting amplifier’s output.
The ECG signals obtained by using the detection circuit were transmitted through wireless transmission, for which the proposed system adopts two RN-171-XV wireless modules. The following operation steps were performed to verify whether the modules could function properly: One of the RN-171-XV modules was connected to the XBee Explorer USB and then to a laptop USB port to perform software editing. Tera Term was opened and the UBS-Com port in use was selected to access the configuration window. In the configuration window, three “$” symbols were inputted to access the wireless CMD. Prior to program editing, whether the wireless modules were connected to other devices was confirmed to ensure the program could be edited properly. Related parameters were inputted, including the name of the router to be connected, password, and the IP address required for wireless configuration. Next, related settings were saved and the test computer was rebooted to complete the configuration. Arduino software was used to burn the test program, and then the wireless module power cords, ground wire, and three TX pins were connected to the Arduino MEGA.
The test computer was connected to the configured router and the human–machine interface was used to perform testing. During testing, the IP and baud of the output and input ends had to be identical. Figure 18 presents the test results.
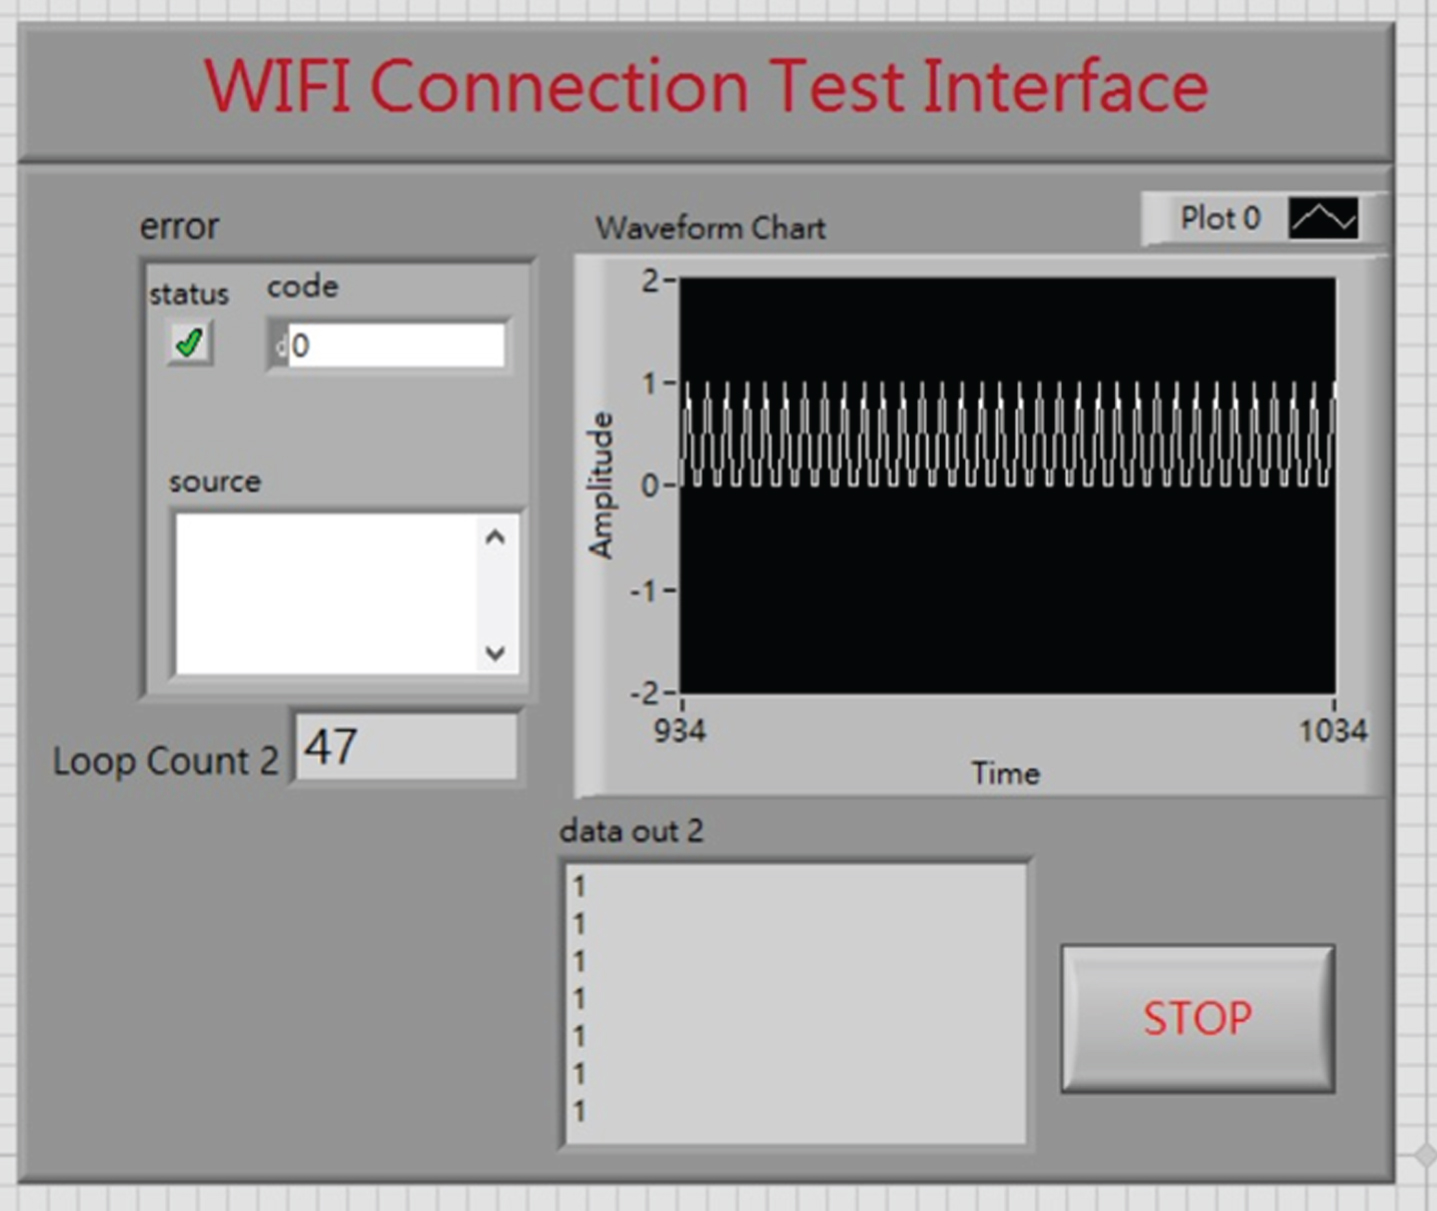
When testing the RN-171-XV wireless module.
Determining normal and abnormal ECG conditions
To ensure the feasibility of our experiment, we invited 16 residents to participate. Seven of the participants were men and nine were women; 10 had a medical history of cardiovascular disease by the broad definition, including 3 people with heart disease and high blood pressure, 6 people with high blood pressure. A cardiovascular disease status table was also created for investigation, as shown in Table 1.
Analysis of the participants’ cardiovascular disease status
Analysis of the participants’ cardiovascular disease status
In this experiment, a healthy participant and a patient with cardiovascular disease were recruited to test the human–machine interface. Figure 19 displays measurement results of a healthy participant. Figure 19(a) presents the home care interface, which indicates that both the body mass index and sinus rhythm of the participant were normal. Figure 19(b) presents the professional health care interface, which indicates that the P-P wave interval was 0.73 s (within the normal range (0.67–1 s)), R-R wave interval was 0.71 s (within the normal range (0.67–1 s)), and the P-R wave interval was 0.14 s (within the normal range (0.12–0.2 s)), verifying the functionality of the interface.
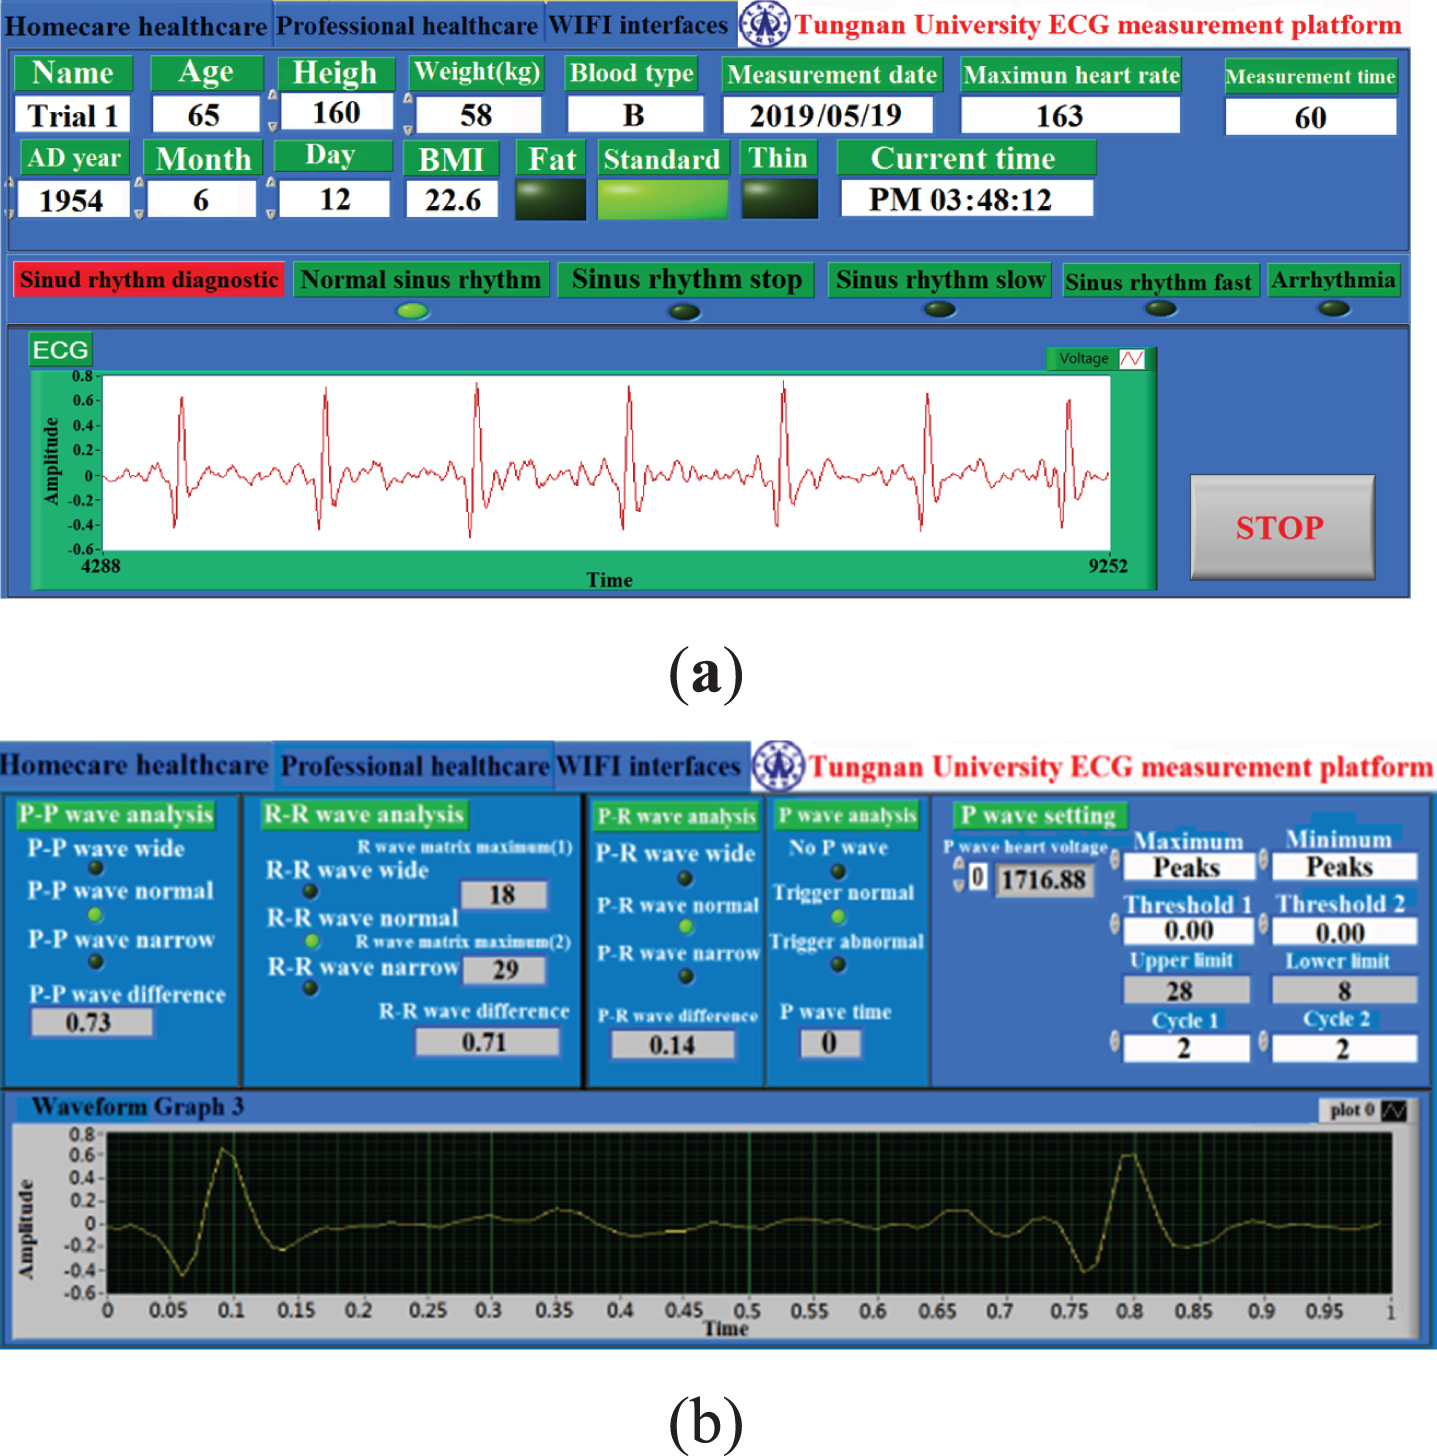
Measurement results of the healthy participant obtained from (a) the home care interface and (b) professional health care interface.
Figure 20 displays the measurement results of a patient with heart disease and hypertension. Figure 20(a) presents the home care interface, which indicates that the patient had an excessive body mass index and experienced cardiac arrhythmia (heart rate is slightly faster). Figure 20(b) presents the professional health care interface; the P-P wave interval was 0.62 s (below the normal range (0.67–1 s)), the R-R wave interval was 0.61 s (below the normal range (0.67–1 s)), and the P-R wave interval was 0.08 s (below the normal range (0.12–0.2 s)). All wave intervals bellowed the normal range, verifying that the proposed system can detect cardiac arrhythmia.

Measurement results of the heart disease and hypertension participant obtained from (a) the home care interface and (b) professional health care interface.
Figure 21 displays the measurement results of a patient with hypertension. Figure 21(a) presents the home care interface, which indicates that the patient had an excessive body mass index and experienced cardiac arrhythmia (heart rate is slightly slower). Figure 21(b) presents the professional health care interface; the P-P wave interval was 1.02 s (exceeding the normal range (0.67–1 s)), the R-R wave interval was 1.05 s (exceeding the normal range (0.67–1 s)), and the P-R wave interval was 0.21 s (exceeding the normal range (0.12–0.2 s)). All wave intervals exceeded the normal range, verifying that the proposed system can detect cardiac arrhythmia.
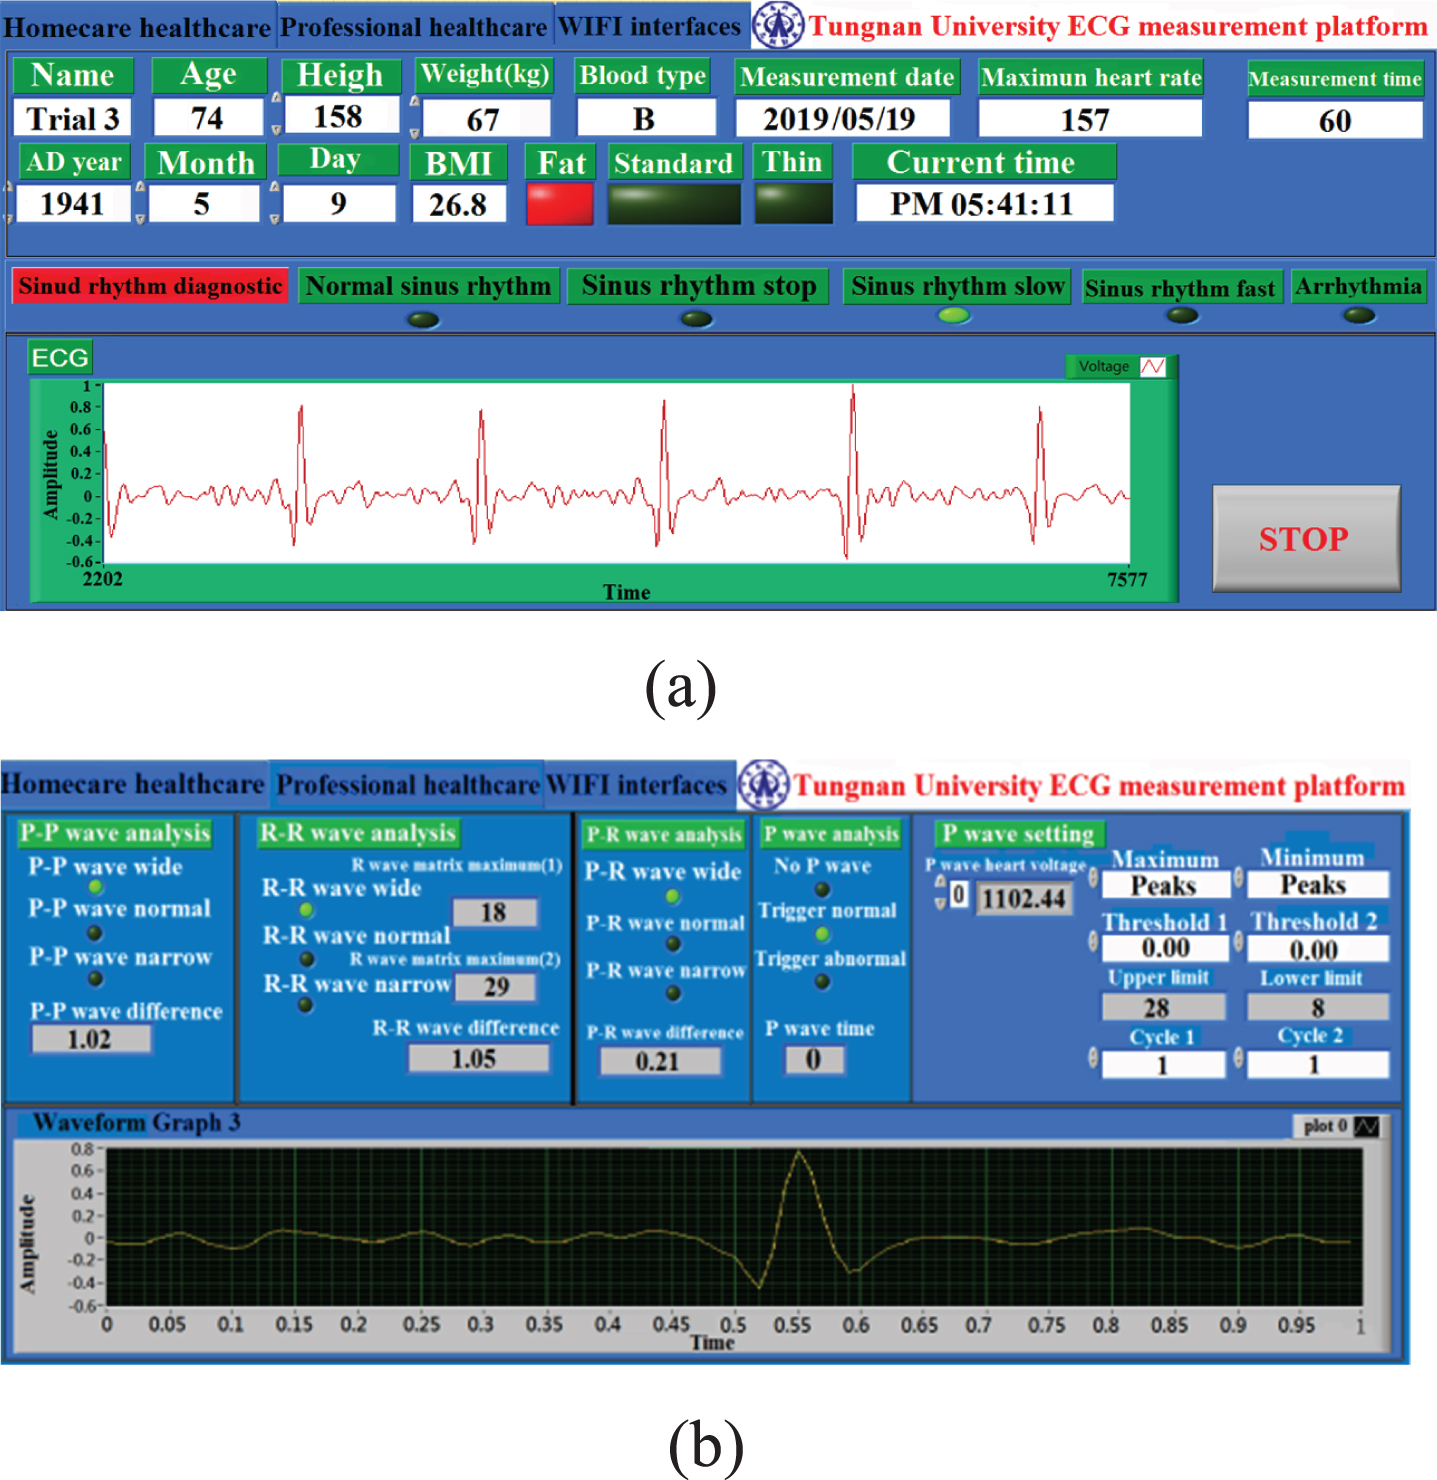
Measurement results of a patient with hypertension obtained from the (a) home care interface and (b) professional health care interface.
Table 2 summarizes the measurement results, which concur with the expected results
Results of ECG testing
The fall detection interface displays information that includes gravitational acceleration, angular speed, tilt angle, and angle change waveforms. In this study, the x-axis and y-axis angles were used to determine the occurrence of a fall; a tilt angle of ≥±60° indicated a fall. Testing was conducted on the tilt and fall in the x direction. Testing of normal tilt angles in the x direction. Figure 22(a) illustrates an x-axis tilt toward the left. The x-axis angle was 30.83° and the y-axis angle was –4.15°; both were within the range of±60°, and therefore, the warning light flashed green (safe), indicating that no fall had occurred (Fig. 22(b)). Figure 22(c) illustrates an x-axis tilt toward the right. The x-axis angle was –30.58° and the y-axis angle was 1.78°; both were within the range of±60°, and therefore, the warning light flashed green (safe), indicating that no fall had occurred (Fig. 22(d)). Testing of fall angles in the x direction. Figure 23(a) illustrates an x-axis tilt toward the left. The x-axis angle was 62.42° and the y-axis angle was 1.44°; because the x-axis angle exceeded±60°, the warning light flashed red (danger), indicating that a fall had occurred (Fig. 23(b)). Figure 23(c) illustrates an x-axis tilt toward the right. The x-axis angle was –60.39° and the y-axis angle was 2.93°; because the x-axis angle exceeded±60°, the warning light flashed red (danger), indicating that a fall had occurred (Fig. 23(d)).
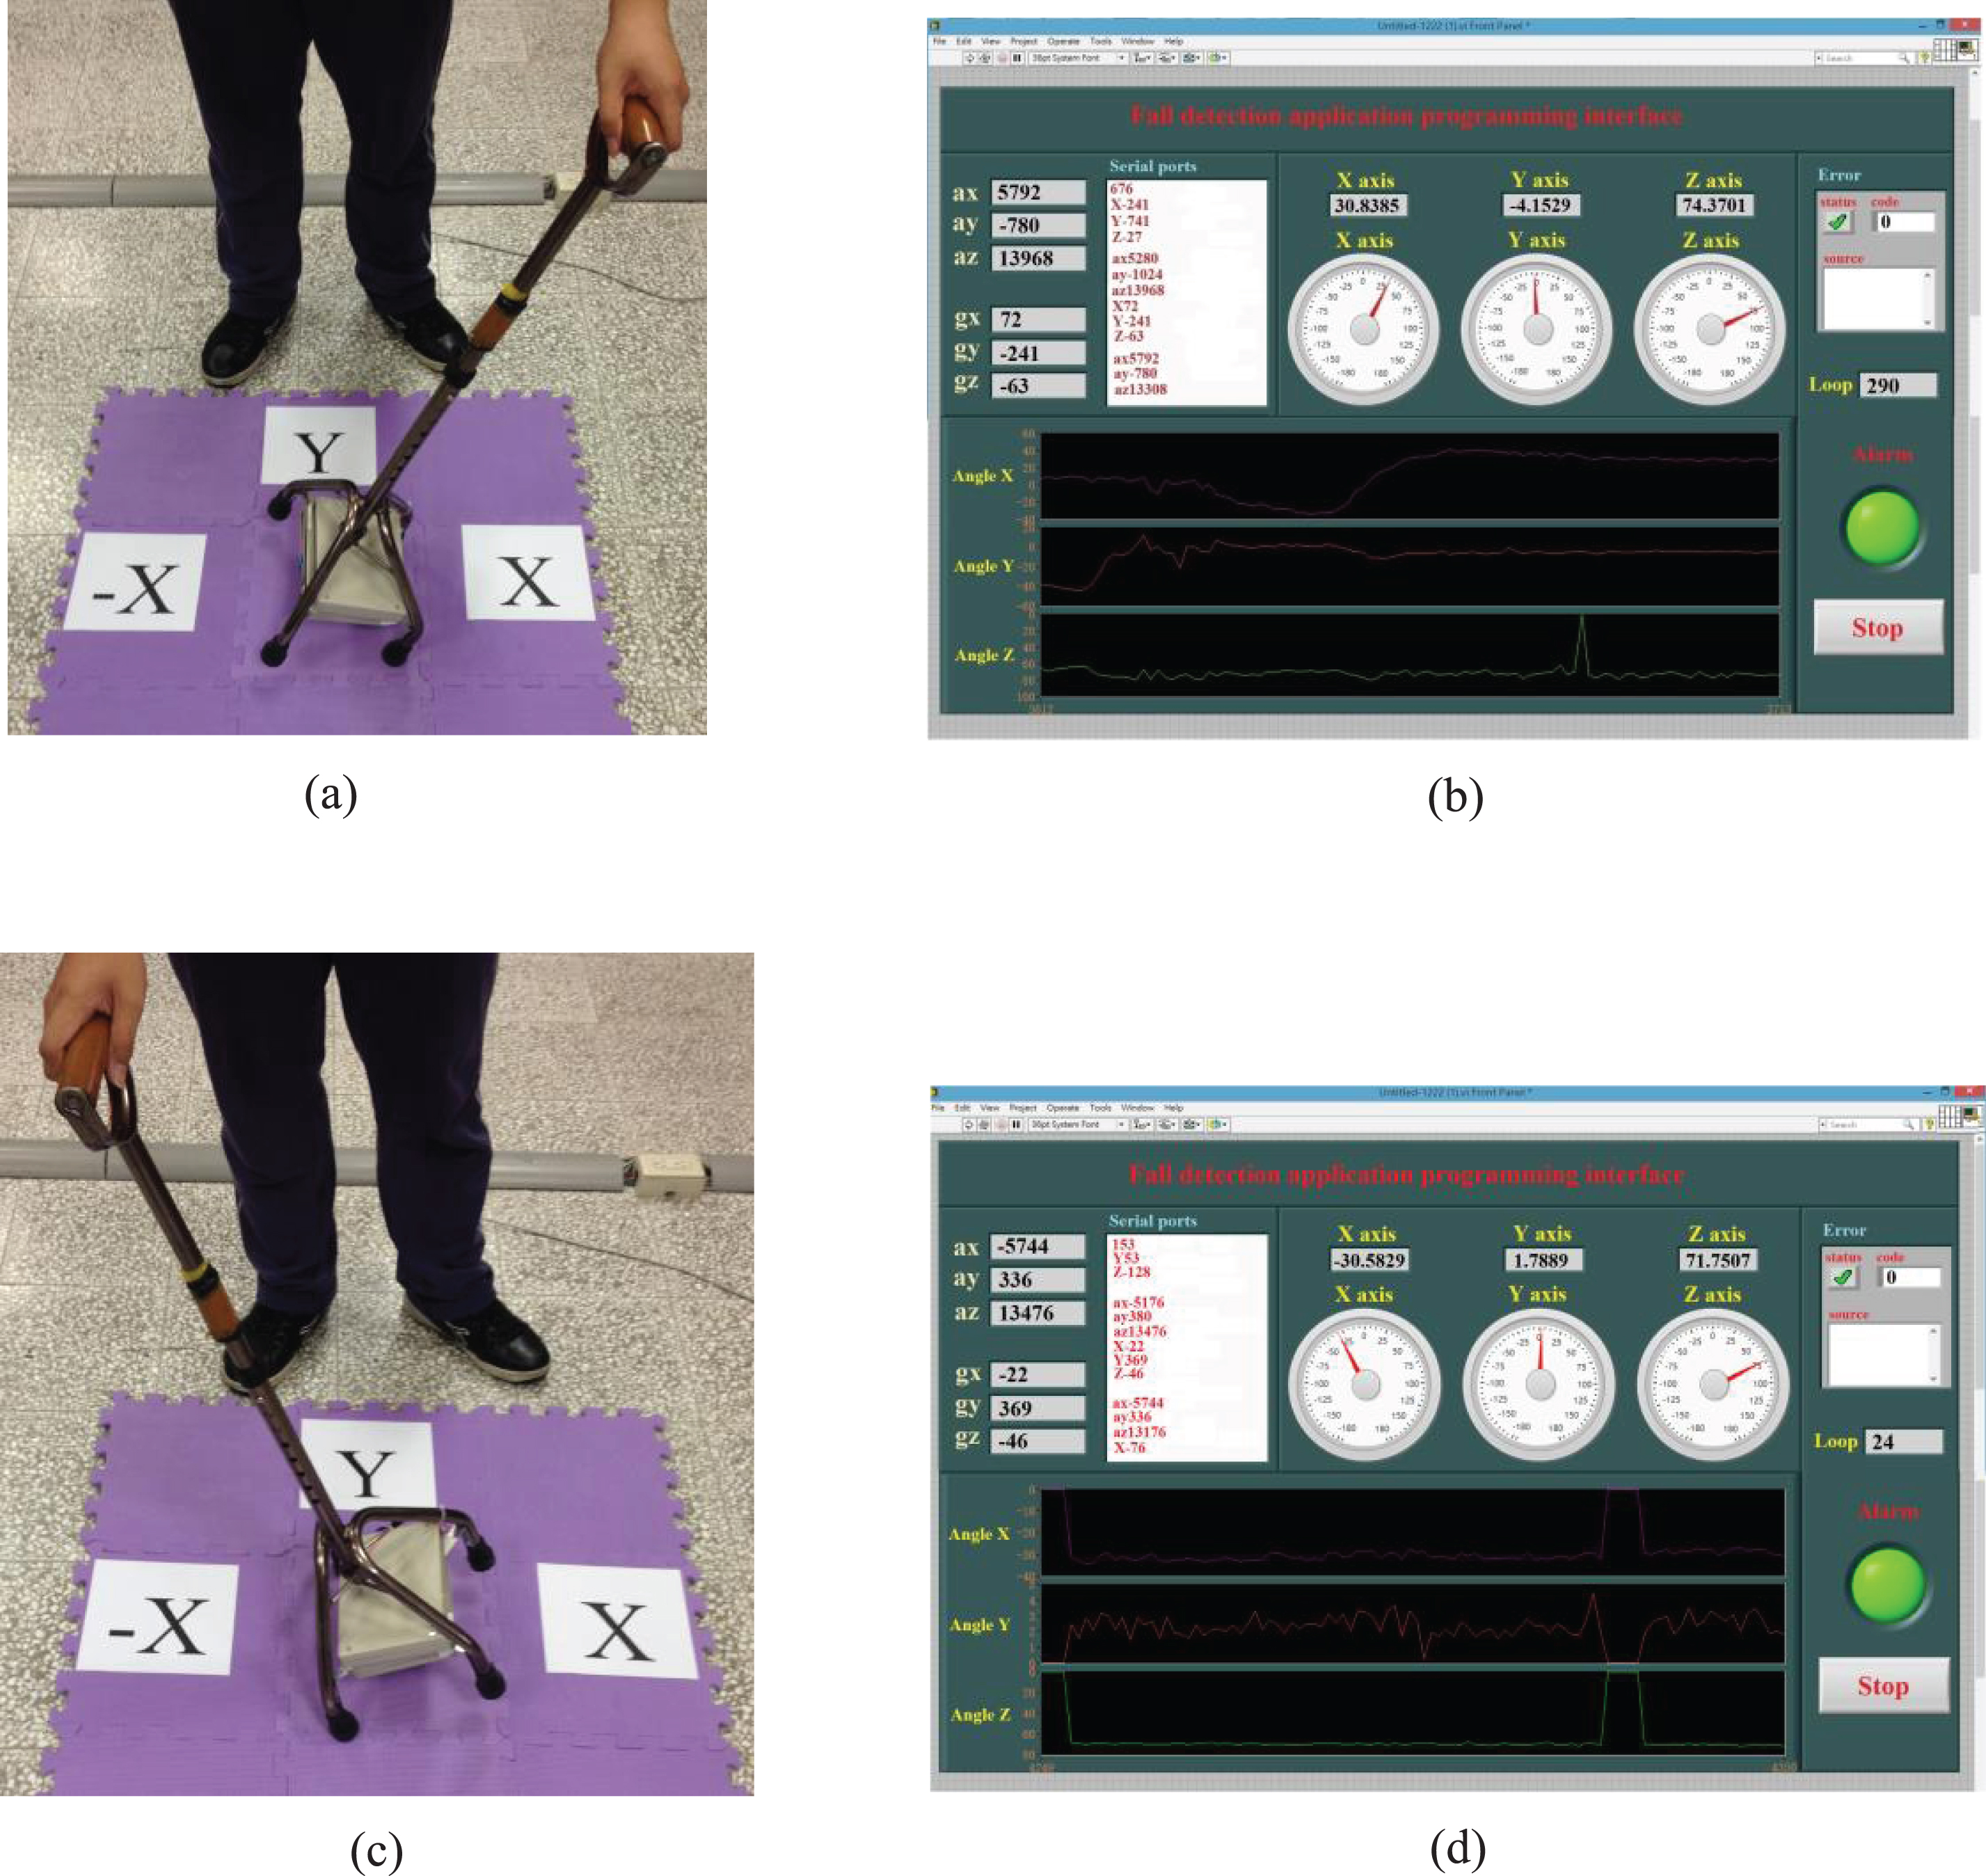
Testing of normal tilt angles in the x direction; (a) an x-axis tilt toward the left and (b) the detection interface; (c) an x-axis tilt toward the right and (d) the detection interface.
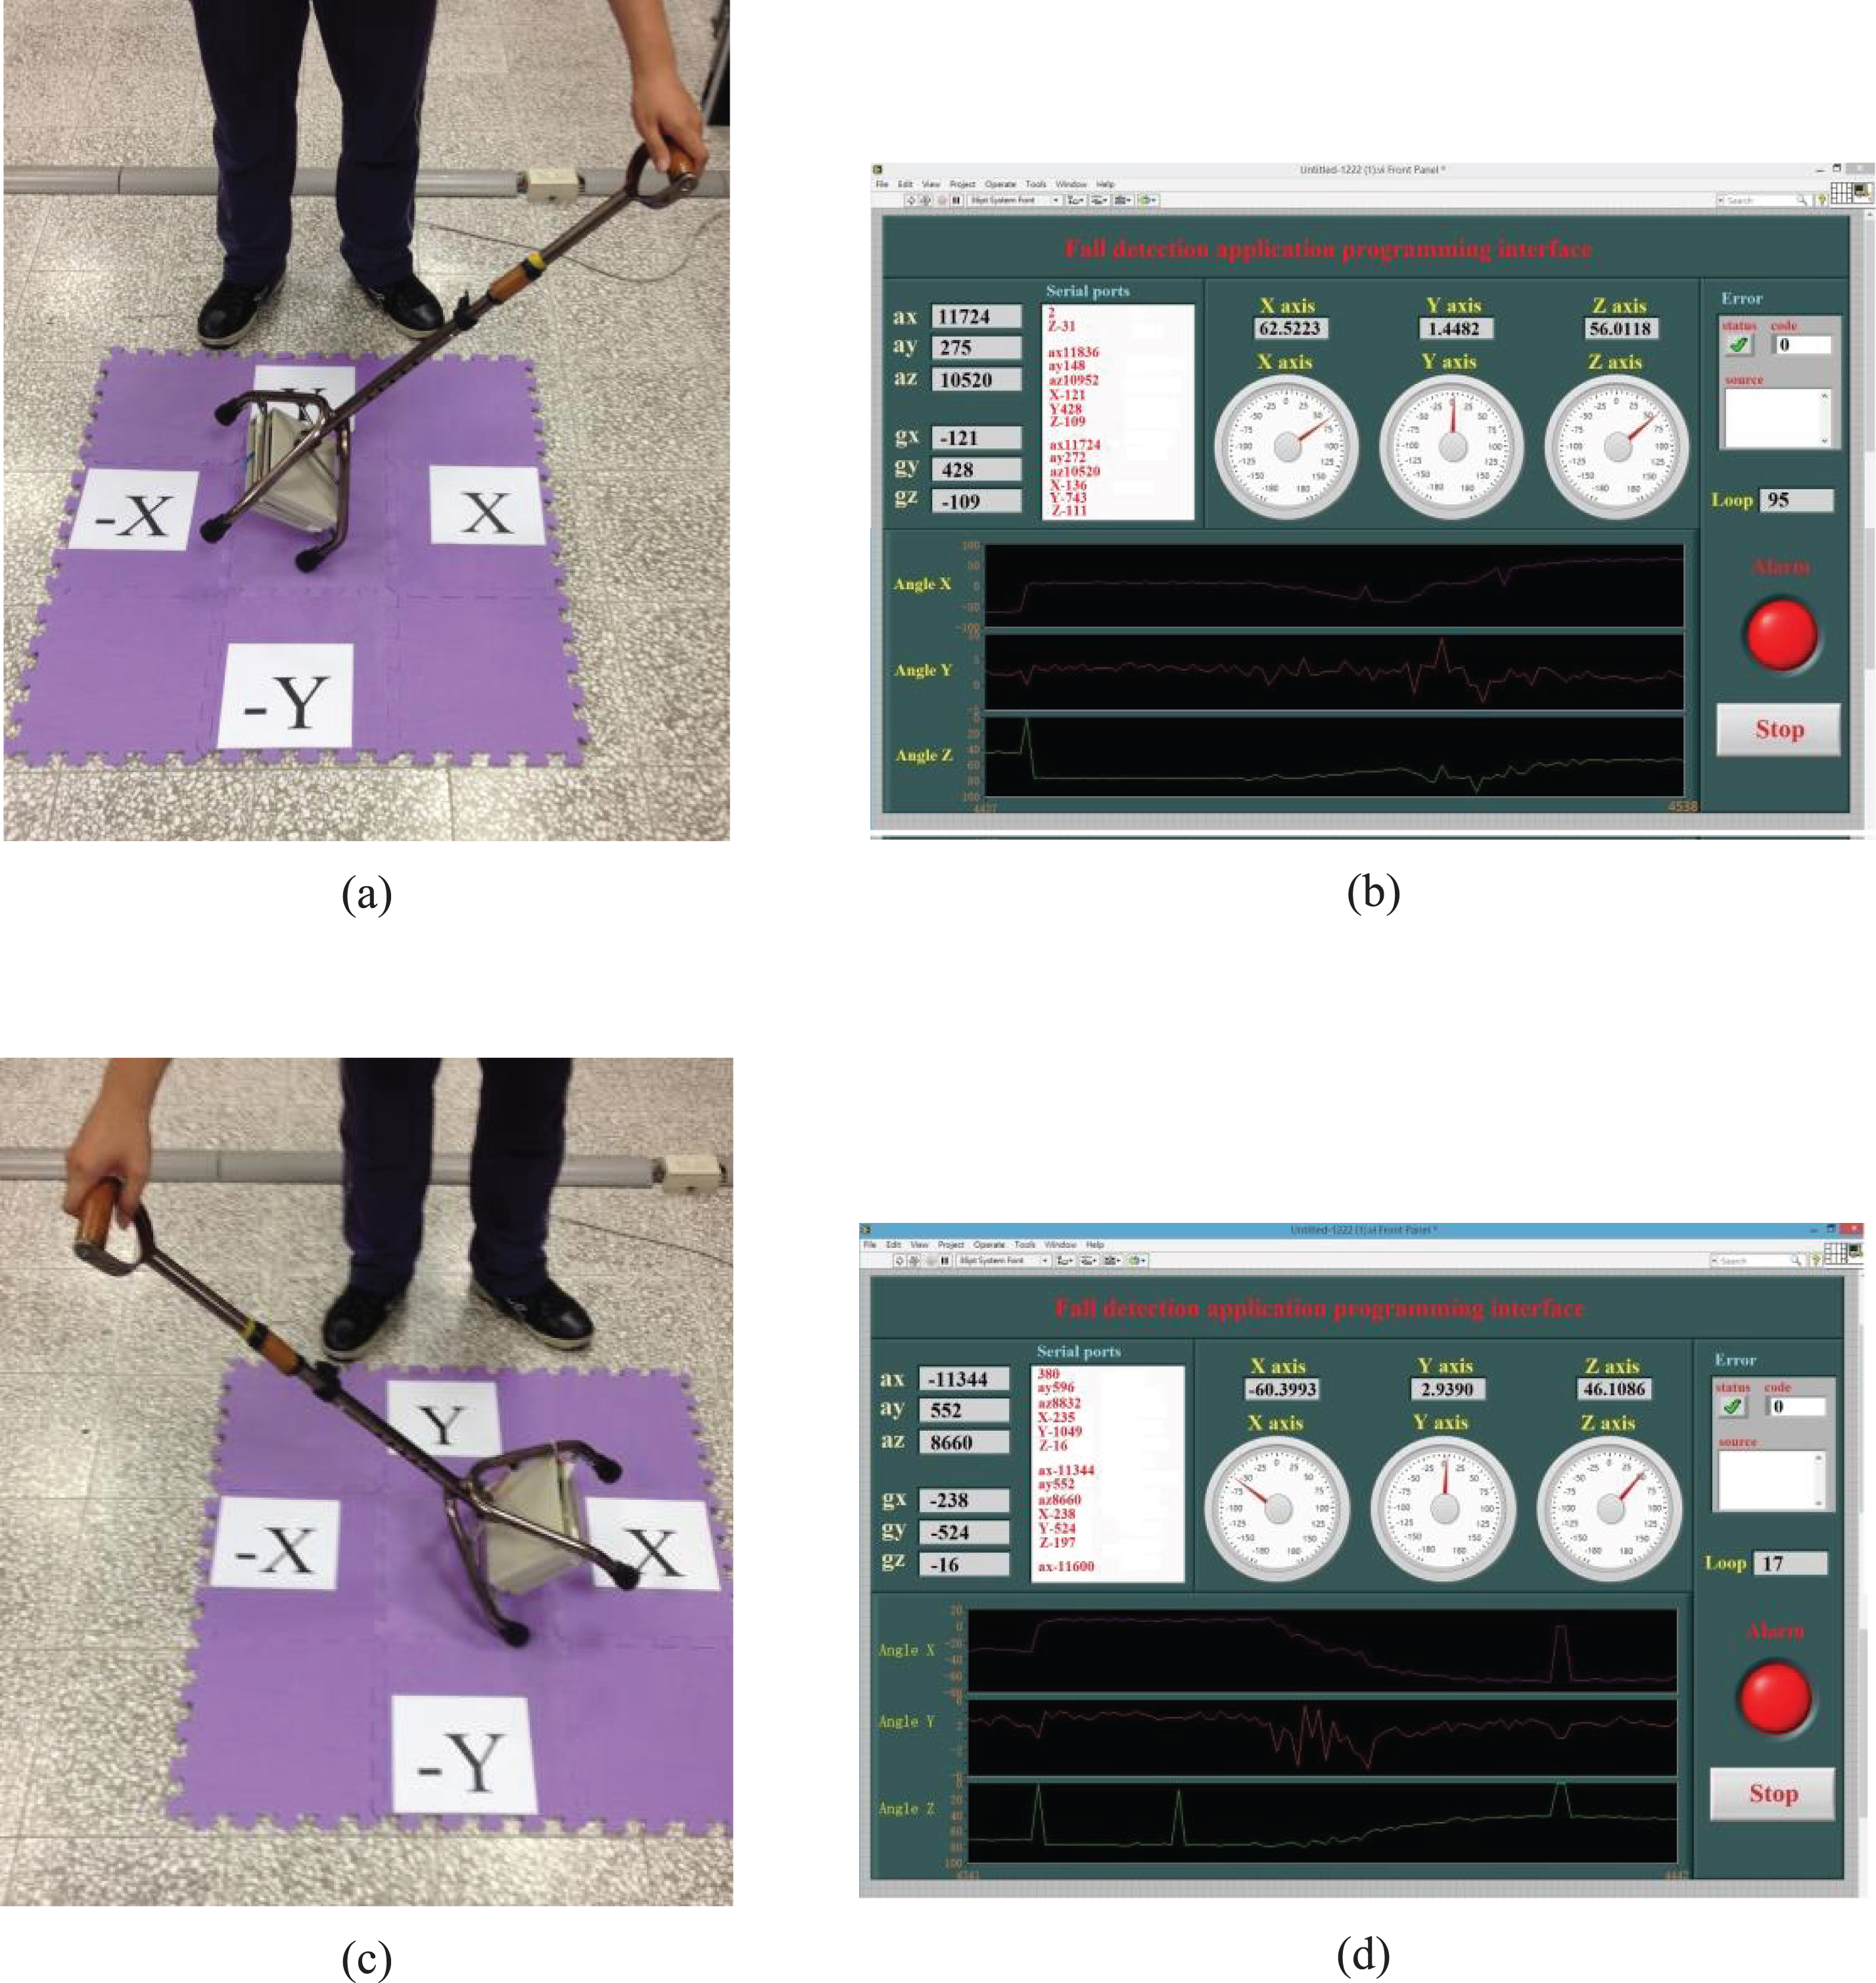
Testing of fall angles in the x direction; (a) an x-axis tilt toward the left and (b) the detection interface; (c) an x-axis tilt toward the right and (d) the detection interface
A total of 16 trials were performed for the fall detection test. Specifically, two trials were conducted each for normal tilt angles in the left and right x directions; two were conducted each for fall angles in the left and right x directions; two were conducted each for normal tilt angles in the left and right y directions; and two were conducted each for fall angles in the left and right y directions. Table 3 summarizes the results of these trials.
Results of fall detection
This study was conducted to develop a walking cane capable of real-time ECG measurement and fall detection. The proposed system features various functions that include abnormal heart rate detection, fall detection, remote data transmission, and a windowing interface display. This study makes the following four contributions: (1) The two metal sensors installed in the handle of the walking cane replace conventional ECG electrodes for acquiring real-time heart rate information and are simple, easy, and convenient to use. When the proposed system is not used for ECG measurement or fall detection, it can serve as a regular walking cane. (2) Handheld ECG detection circuit has be developed; signals captured using the self-developed ECG detection circuit can be reconstructed in a computer through a microcontroller, providing data for building a personal psychological database in the future. (3) The fall detection module created using the three-axis gyroscope and three-axis accelerator can not only be installed in walking canes to calculate tilt angles and determine fall occurrences but is also applicable to other assistive devices, thereby increasing the prevalence of such functions. (4) Using wireless transmission technology to monitor users facilitates understanding their conditions in advance to provide relevant responses when necessary. The proposed system can be used by not only recipients of home health care and patients with impaired physical mobility but also by health care professionals conducting follow-ups.
There is still a lot of work to be improved in this research. For example, although the hardware circuit achieves the purpose of actually displaying the ECG waveform, the circuit size is still too large, and the volume can be miniaturized through the circuit board wiring planning. In addition, the circuit still has a level drift phenomenon, and it can also be stabilized by improving the circuit in the future. In the wireless transmission part, although WIFI has a long transmission distance, the large power consumption is the main disadvantage. In the future, other transmission methods can be considered to reduce the problem of large power consumption.