



Abstract
The traditional distributed WSNs fire remote monitoring system has single monitoring variables and incomplete fire detection data, which leads to large monitoring error and long delay. A distributed WSNs fire remote monitoring system based on fuzzy algorithm is designed. The hardware part of the system consists of distributed WSNs fire remote monitor, air temperature and humidity parameters acquisition, LCD unit and system power supply unit. The remote fire monitor is designed by using microprocessor C8051F060, and the centralized monitoring of information is realized by using distributed WSNs. Based on this, the fuzzy algorithm is introduced to standardize the fire detection data, and the fuzzy similar matrix is established. According to the improved similarity coefficient, the matrix is solved, the fuzzy equivalent matrix is calculated, and the optimal threshold value of fuzzy monitoring is determined. The fuzzy language monitoring rules are set by using three fuzzy variables of current, temperature and smoke to complete the design of distributed WSNs fire remote monitoring system. The simulation results show that: compared with the traditional fire monitoring system, the system designed in this paper has higher throughput limit, shorter delay, and the accuracy rate of monitoring and alarm is higher than 95%. The experimental results show that the system has good generalization ability and is suitable for large-scale high-rise buildings and large-scale networks.
Introduction
With the emergence of a large number of high-rise buildings in modern metropolis, high-rise fire presents the characteristics of hidden occurrence and rapid development. It is necessary to establish a WSNs system which can detect and judge the fire and monitor the location and data of fire in the first time [1, 2]. At present, the relevant experts have obtained some good research results. For example, reference [3] designed a fire monitoring system by analyzing the behavior of NDVI (normalized difference vegetation index) and NBR (normalized combustion ratio) indexes before and after fire. The biggest limitation of track remote monitoring detection is that it exists in the sensor channel close to the date of fire. The area of burn area in for was 54.9%. In reference [4], a fire detection system based on near-infrared camera is designed. Eleven combustion ramp stacks were imaged simultaneously with near infrared and camera sensitive visible or red, green, and blue (RGB) light to compare performance. The quantitative differences between near infrared (NIR) and RGB (RGB) images in contrast with background and flame size were compared. The maximum likelihood classifier in envi is helpful to quantitative analysis. The difference between contrast and flame size was assessed statistically significant by randomized trials. The results showed that the contrast and flame size were significantly increased in all NIR images (P < 0.01). In reference [5], a fire monitoring system based on random forest machine learning method was designed to estimate the 1-hour average exposure to fine particles in British Columbia, Canada, during the wildfire season from 2010 to 2015 with a resolution of 5 km×5 km. The model uses remotely sensed fire activity, meteorology absorbed from multiple data sources, and geographic / ecological information.
In order to solve the problems of traditional methods, this paper designs a distributed WSNs fire remote monitoring system based on fuzzy algorithm. The hardware part of the system consists of distributed WSNs fire remote monitor, air temperature and humidity parameters acquisition, LCD unit and system power supply unit. This paper introduces fuzzy algorithm, uses three fuzzy variables of current, temperature and smoke, and sets fuzzy language monitoring rules to complete the design of distributed WSNs fire remote monitoring system. The simulation results show that the designed system has higher monitoring accuracy, better delay improvement effect and good application performance.
Design of fire remote monitoring system based on distributed WSNs
Hardware structure of indoor fire monitoring system
Design of distributed WSNs fire remote monitor
The remote fire monitor is composed of C8051F060 single chip microcomputer. It is based on 8051 core and adopts pipeline structure. The speed can reach 25 mips (25 MHz crystal oscillator), which is 10 times faster than the ordinary 51 single chip microcomputer. The structure diagram of the remote fire monitor system is shown in Fig. 1.
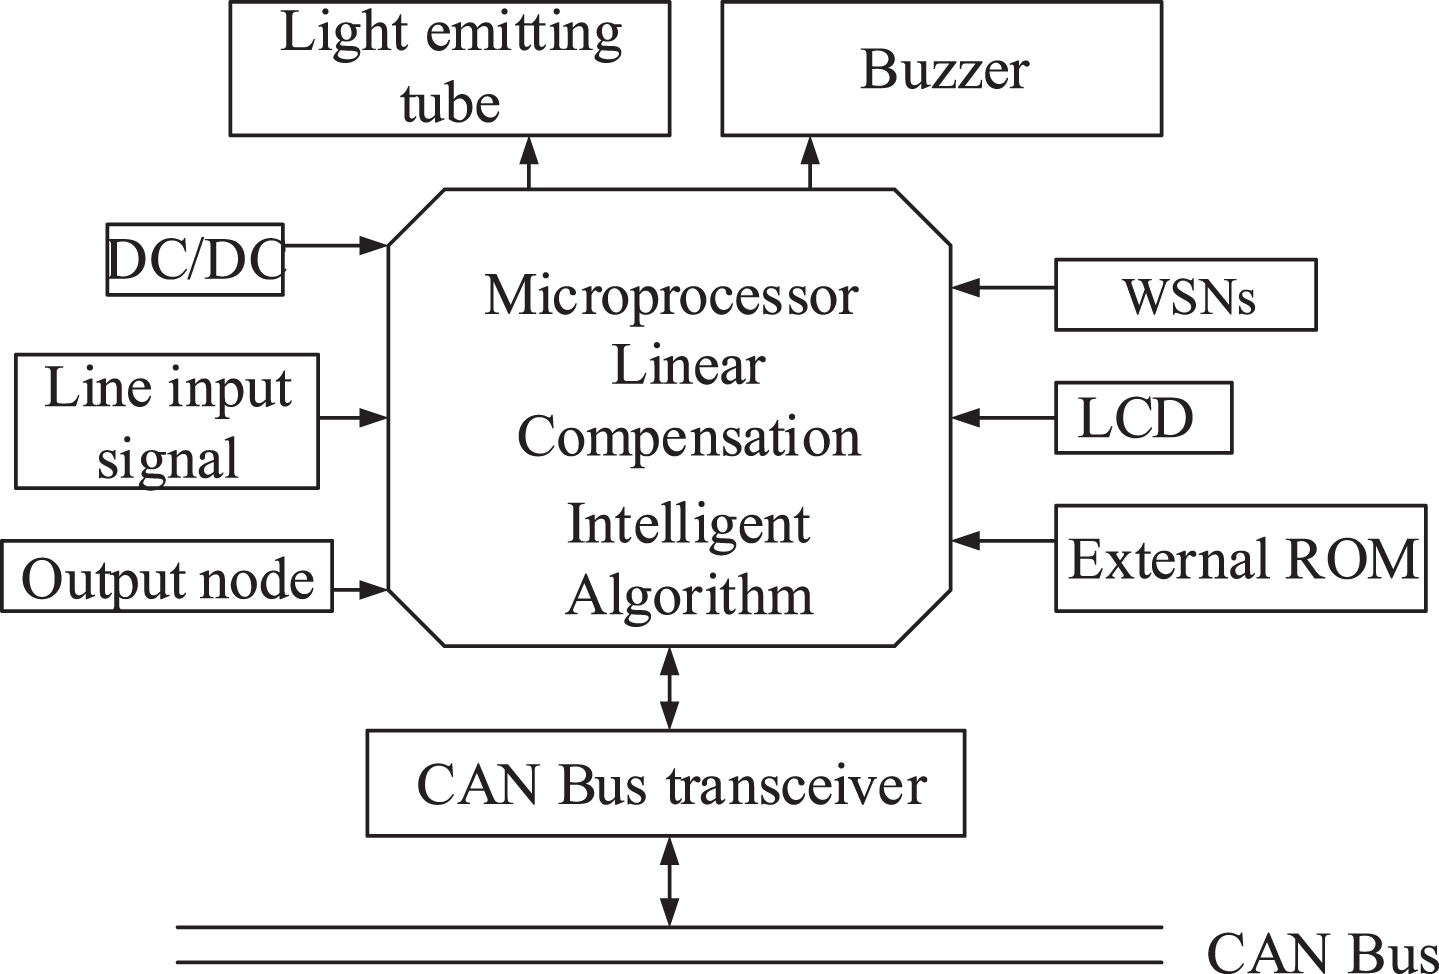
System structure block diagram of fire remote monitor.
Fire remote monitor is composed of sound and light alarm, keyboard and LCD display, distributed WSNs transceiver, external storage and clock generator, etc. its function process is: real time data such as IA, IB, IC, IN, IF and fault characteristic data transmitted by signal acquisition and processing unit are displayed through LCD, and transmitted to electrical fire monitoring equipment through distributed WSNs. When the alarm signal appears in the channel, the monitor drives the buzzer and sets the signal light of the corresponding channel to red, and saves the fault characteristic data to the memory to monitor the action of the trip node of the channel. For the convenience of users, LCD is set on the monitor Display function, convenient for users to observe the data of monitoring points, and use distributed WSNs for centralized monitoring; through key selection, you can view real-time data on the monitoring interface, set the current time, line alarm value, sensor parameters, alarm delay time, etc., through the alarm data interface, you can query the alarm reason, alarm time and alarm channel number.
In addition, due to the complex environment and many interference sources, in order to avoid the wrong action of the monitoring system and inaccurate data, the anti-interference problems are considered in the design of software and hardware of fire remote monitor, including power supply anti-interference, single-chip microcomputer system anti-interference, signal channel anti-interference, PCB anti-interference design and digital filtering, remote algorithm design, etc. The system power supply uses DC-DC converter to obtain stable DC voltage, the signal channel uses high-speed optocoupler to isolate the signal, and digital filter is added in the software design to further improve the anti-interference ability of the system.
In the power communication indoor fire monitoring system, the measurement range of indoor air temperature monitoring unit is 0°C to 50°C, and the DHT11 temperature sensor has the function of digital signal automatic calibration [5]. The special digital unit acquisition technology and temperature sensing technology are used to complete the indoor air temperature monitoring and control, with high reliability. The NTC temperature measuring element in distributed WSNs is connected with 8-bit MCU to complete communication. In each communication, the single line data is used to divide the data into decimal part and integer part. The improved monitoring system obtains the air temperature value according to this way. The circuit is shown in Fig. 2:

Indoor air temperature acquisition circuit.
In the process of indoor air humidity monitoring, HS1101 humidity sensor is selected. Its working principle is that the capacitance value increases with the increase of humidity. HS1101 sensor does not need to be calibrated, can be quickly dehumidified, automatic welding, has strong stability and anti-interference ability [6]. The response time is 5 s and the voltage is 5 V. The air humidity monitoring circuit is constructed, and the air humidity parameters are obtained and displayed by using ARM core processor and inputting waveform. The indoor air humidity parameter monitoring circuit is shown in Fig. 3:
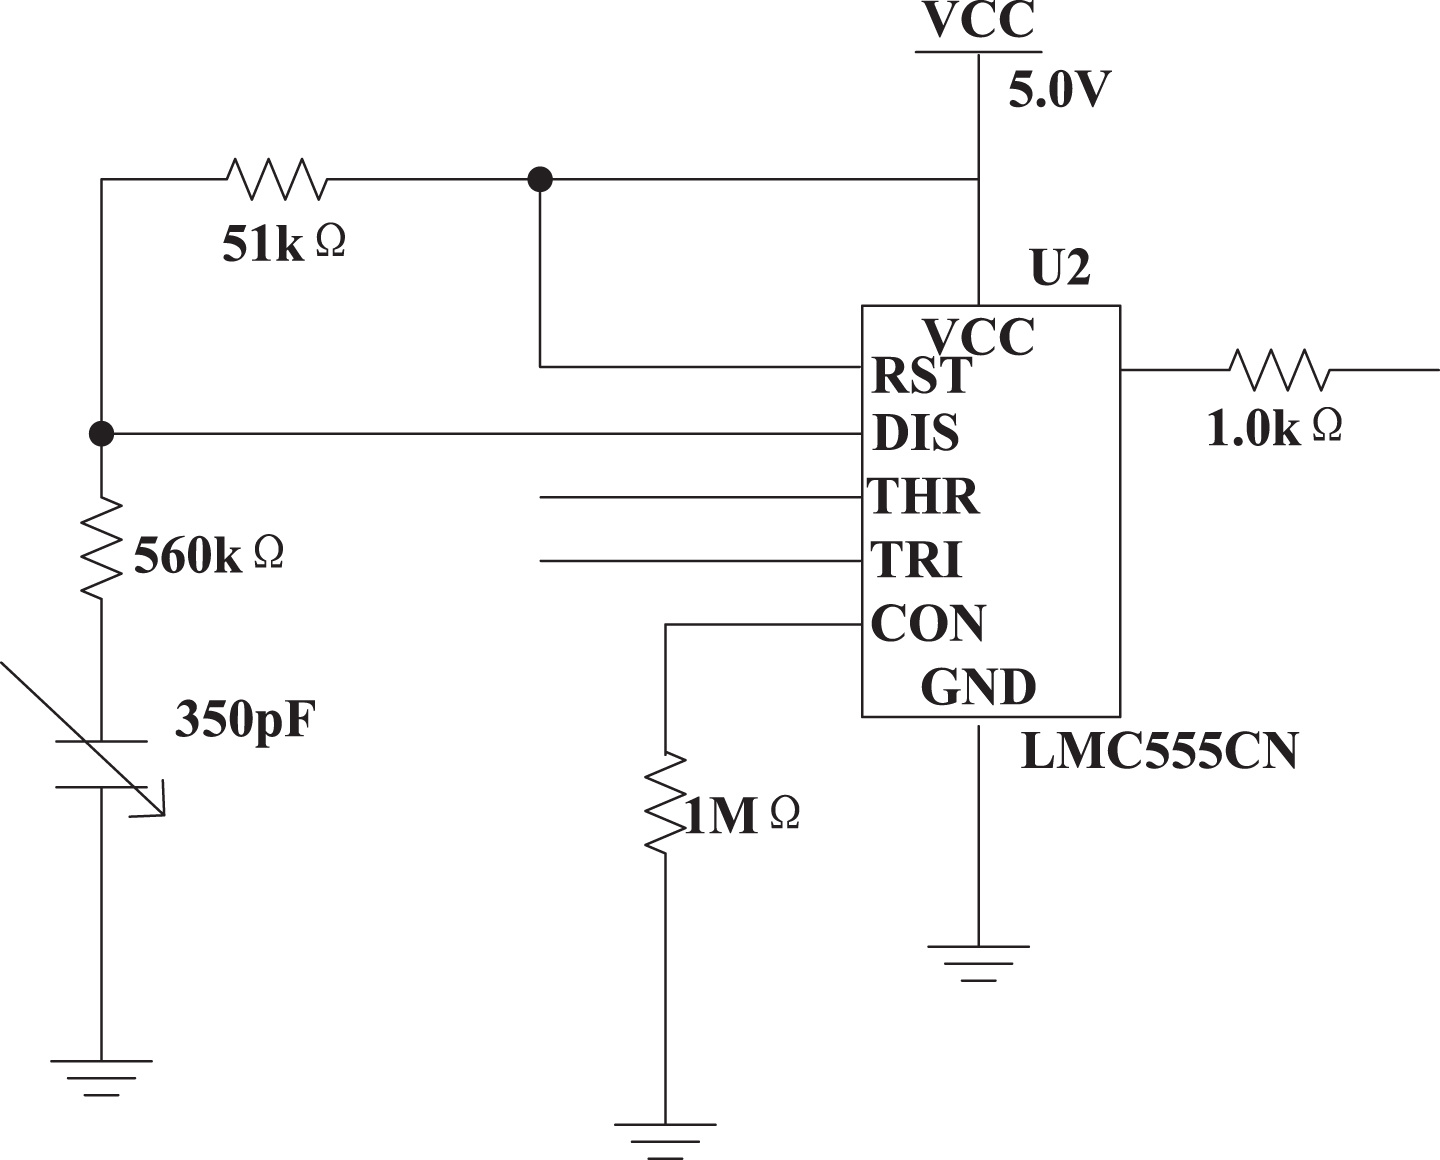
Circuit for acquiring indoor air humidity parameters.
The capacitance of humidity sensor is proportional to the air humidity. Output square wave of frequency change for arm acquisition. During the monitoring process, the HS1101 is charged. When the power supply on pin THR is 2/3 VCC, the output level of the chip is. When the power supply on THR is lower than 1/3 VCC, the chip outputs high level. It can be concluded that arm can capture the square wave with high precision.
Liquid crystal display unit is an organic light-emitting diode. Here, OLED is selected as the display part of fire monitoring system in power communication room. Based on the concept of low power consumption, the selected OLED has the following characteristics: it has its own light-emitting function, which can reduce the overall power consumption of the monitoring system. High contrast, light and small volume, easy to design, can be used in the case of large temperature span. The 0.96 inch OLED is used as the display part of the fire monitoring system in the power communication room. The circuit diagram is shown in Fig. 4.

LCD unit circuit.
The power supply unit is powered by dry batteries. Dry battery has the characteristics of low cost, easy to carry and easy to purchase. Many working elements can not only meet the requirements of low power consumption, but also can realize portable interface design. The power design principle of power supply for power communication indoor fire monitoring system is shown in Fig. 5:

System power circuit.
The main steps and objectives of remote fire monitoring using fuzzy algorithm are as follows:
Step 1: Standardize the fire detection data.
This step can remove the interference caused by index characteristics and order of magnitude. After standardization [7], the characteristic index values of all sample information are converted into values in the range of [0, 1], and the j-th characteristic standard deviation and average value of n samples are calculated
The standardized processing expression of original fire detection data is as follows:
Combined with the extreme value standardization formula, the standardized data is compressed into the closed interval [0, 1]:
In formula (4),
Step 2: Establish the fuzzy similarity matrix and calculate it according to the improved similarity coefficient.
There are many methods to calculate the similarity coefficient. In this paper, the combination of similarity matrix and distance matrix [8] is used, and the expression is as follows:
In formula (5), r
ij
represents a similar coefficient.
The angle cosine method is used to calculate the similarity degree between the samples, and the Mahalanobis distance method is used to obtain the similarity between the values between the samples, so as to obtain the similarity between all the classification samples, which is combined into a new similarity matrix R [9].
Step 3: Calculate the fuzzy equivalent matrix
The transitive closure operation of fuzzy similar matrix R is carried out to obtain the fuzzy similar matrix R* with genetic characteristics.
In formula (8), R2 = (r ij ).
Step 4: Determine the optimal threshold.
The threshold can be determined by drawing the cluster spectrum and combining with the actual situation. Due to the complexity of the field environment, it is difficult to analyze and process the parameter setting, and some parameters will change with the change of the environment. Therefore, the fuzzy algorithm is adopted in this system to eliminate the influence of external changes and disturbances. [10, 11] The block diagram of algorithm principle is shown in Fig. 6:

Principle block diagram of fuzzy algorithm for fire monitor.
It can be seen from Fig. 6 that the smoke concentration signal, temperature signal and current signal detected from the detected environment or line are fuzzified after signal acquisition and processing standardization, and the input value is converted into fuzzy quantity, and a distribution function of output quantity is determined through fuzzy logic reasoning. The clear normalization process is to convert the distribution function of the output into the normalized output and convert it to the actual output value, and finally get whether there is a fire or the line current is too large to alarm [12].
Since temperature detector and smoke detector are mainly used to detect building fires, current transformer and leakage current transformer are mainly used to monitor three-phase current in real time. Therefore, the sampling signals of temperature sensor, smoke detector and current transformer are used as the input signals of the fuzzy system. The fuzzy system uses three fuzzy variables: Current I, Temperature T and Smoke S. Set the fuzzy subset of the three fuzzy variables as PB,PM,PS,ZE [13]. Among them: PB is the high probability of fire, PM is medium fire probability, PS means there is little possibility of fire, ZE means there is no possibility of fire. It is abbreviated as big, medium, small and none. The establishment of language rules is the core of fuzzy processing of sensor information. Through practice, 64 fuzzy language monitoring rules are concluded in a constant temperature environment (i.e. the weight coefficient of current signal is the largest, followed by temperature and smoke is the smallest). if (current is ZE) and (temperature is ZE) and (smoke is ZE) then (The fire is ZE) if (current is PS) and (temperature is ZE) and (smoke is ZE) then (The fire is PS) if (current is PM) and (temperature is NP) and (smoke is ZE) then (The fire is PM) if (current is PB) and (temperature is ZE) and (smoke is ZE) then (The fire is PB) if (current is ZE) and (temperature is PS) and (smoke is ZE) then (The fire is PS) if (current is PS) and (temperature is PS) and (smoke is ZE) then (The fire is PS) if (current is PM) and (temperature is PS) and (smoke is ZE) then (The fire is PM) if (current is PB) and (temperature is PS) and (smoke is ZE) then (The fire is PB) if (current is ZE) and (temperature is PM) and (smoke is ZE) then (The fire is PS) if (current is PS) and (temperature is PM) and (smoke is ZE) then (The fire is PM) ...... if (current is PB) and (temperature is PB) and (smoke is PB) then (The fire is PB)
According to the fire characteristics and fuzzy rules, the fire simulation model can be determined as shown in Fig. 7.

Fire simulation model.
I, T, S are the standard 0 V∼5 V voltage signals of current, temperature and smoke signal respectively. After they are fuzzy, the corresponding distribution function is obtained through the logic reasoning of 64 fuzzy rules, and the output value is finally obtained.
The Fuzzy LogicToolbox provided by MATLAB is used to simulate the Fuzzy reasoning and Fuzzy monitor [14]. The fuzzy monitoring toolbox integrates visual tools such as FIS editor, membership function editor, fuzzy rules editor, rule browser and output preview, making it possible for users to quickly develop and design a fuzzy monitor.
The simulation scene network is divided into three levels: sensor subnet, convergence network and access network. The basic sensor subnet consists of four subnets (corresponding to four rooms) [15]. The middle-level aggregation network is divided into 4 regions on average, which store 4 sensor subnet data respectively and forward the received subnet data to the corresponding aggregation storage node. Every time the sink node receives N monitoring packets, it will report one fused packet to the sink node of the high-level access network. All floors are equipped with fixed base stations. The simulation topology is shown in Fig. 8. The experimental area is 300 m×320 m. The aggregation network adopts the architecture shown in Fig. 1. The structure of sensor subnet and access network is similar to that of convergence network. Among them, the sensor subnet is only set to enable the 2.4 GHz 802.15.4 protocol channel with a bandwidth of 250 kbps; Access network is only set with 900 MHz enabled 802.11 AH protocol channel with bandwidth of 2 Mbps. The convergence network has both the two communication modes mentioned above.
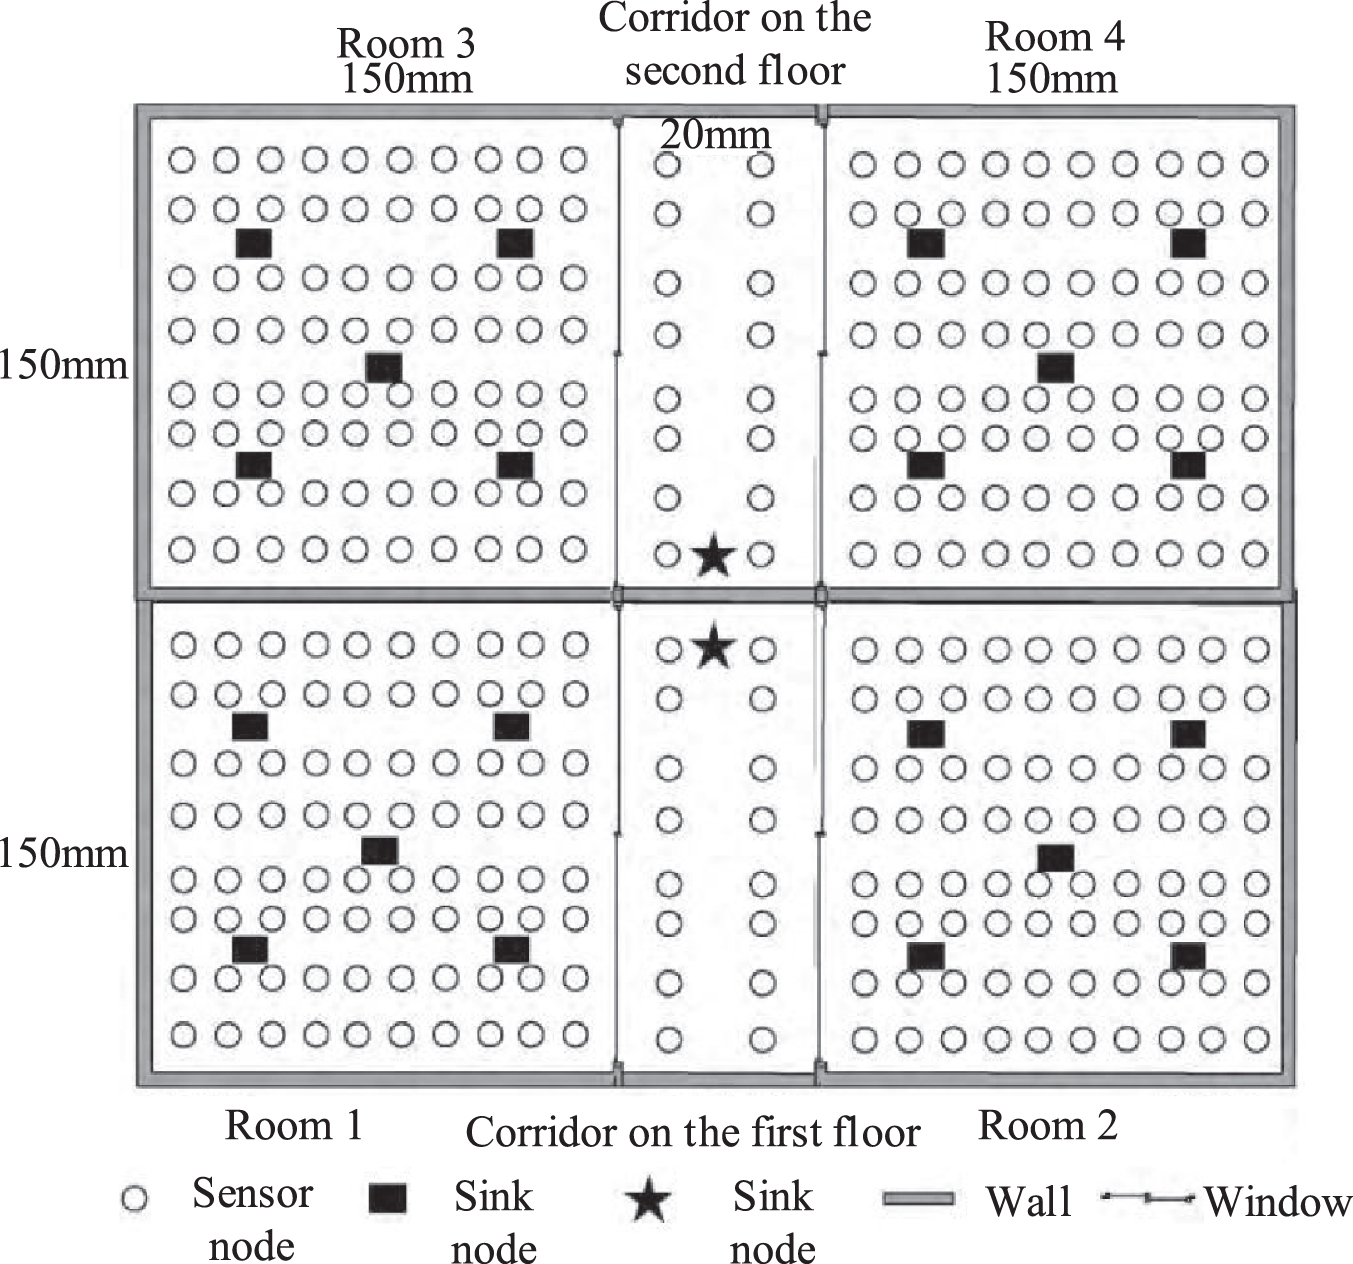
Convergence network architecture.
Each sensor subnet is responsible for the room has 80 sensor nodes. To simulate the overlapping part between subnets, 16 sensor nodes are set in 2 corridors respectively. The model has a total of 352 sensor nodes. There are 20 sink nodes. One sink node is set in each of the 2 corridors. Between rooms and corridors separated by Windows, all nodes are in normal condition; only the Sink node can communicate through the wall normally, so as to simulate the data collection, processing and transmission between the two floors. In this paper, two kinds of experiments are carried out on the proposed protocol stack: analyzing network performance such as network throughput and end-to-end delay; the method of establishing different scale network is used to evaluate the transmission capacity of architecture under the condition of large scale network.
Fig. 9 shows each signal and fire probability diagram after simulation. To 9 (a), for example, reflect the current and temperature signal fire probability, the size of the current signal and the temperature distribution in different area, the curve of color depth is also different, the deeper the color indicates the probability of fire, the more the more dark said the fire probability is smaller, at the same time as you can see the simulation curve is smooth, reasonable design shows that the fuzzy rules.

Fire simulation curve.
It is proved by practice that the system can still make accurate judgment in different seasons and changes of day and night, which fully shows the good reliability of fire simulation.
When a fire broke out at a certain point in the simulation room 1, the adjacent nodes monitored the abnormal data and sent the photos of the incident point and relevant visibility and temperature data upstream. The data packet became longer and the network throughput was observed. [16, 17] The system designed in this paper, document system [3] and document [4] are used in this experiment.
As shown in Fig. 10, when the packet load length is large, the throughput limit of packet saturation and discarding is higher. In this paper, the disaster data packet adaptive priority transmission, discard or delay the transmission of non-disaster information, improve the channel utilization and increase the network throughput.
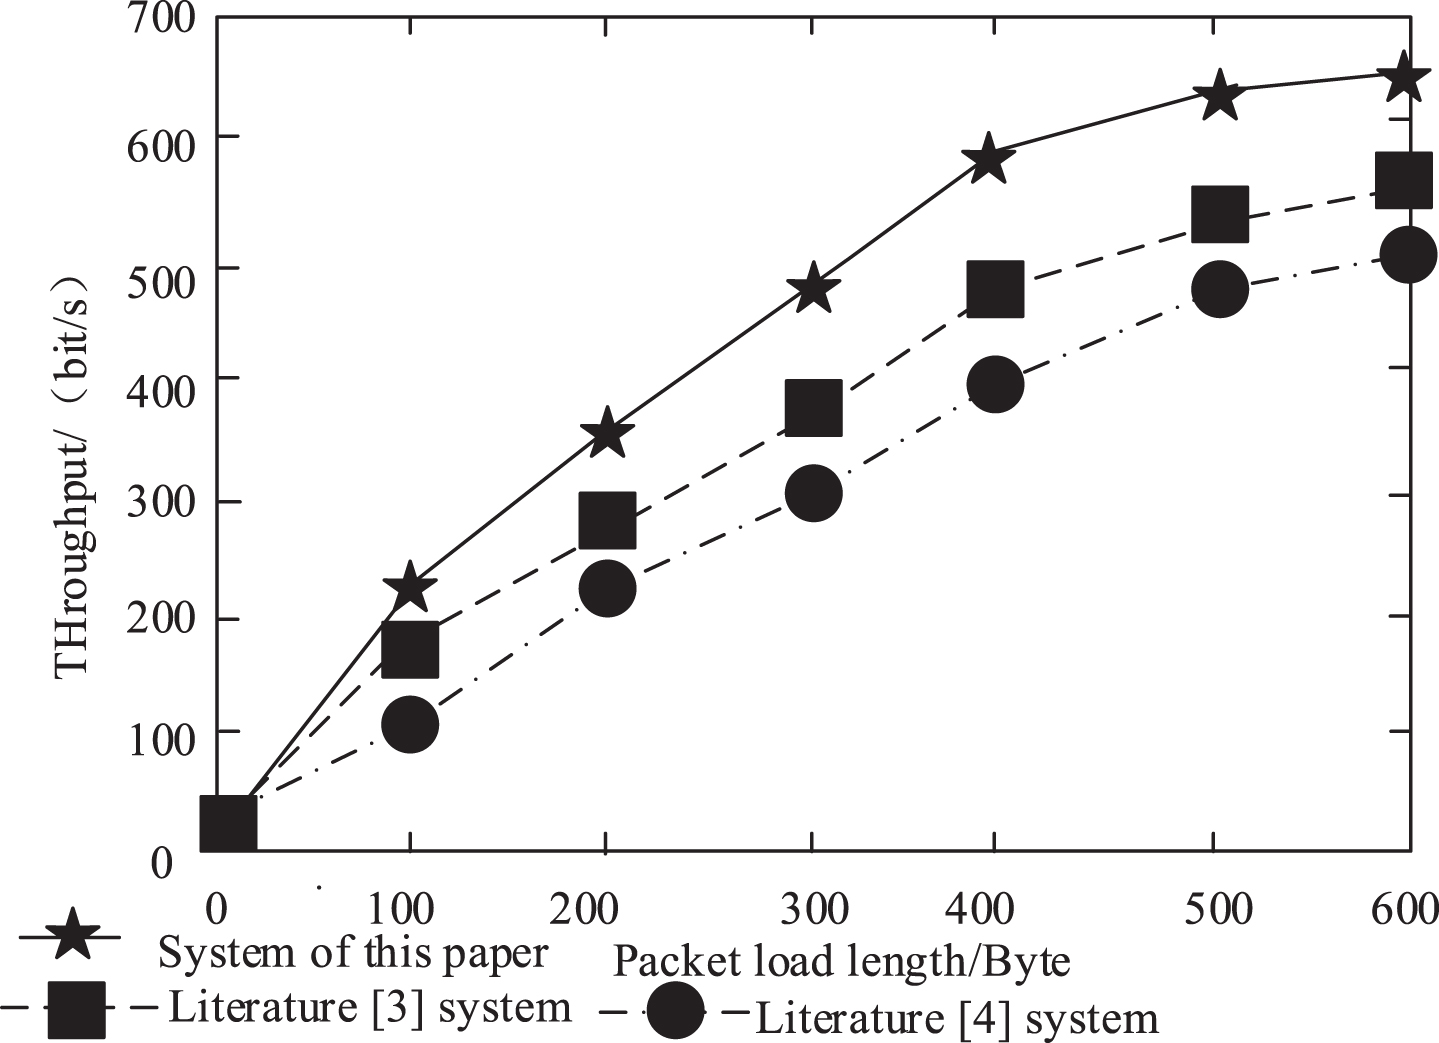
Comparison of network throughput capacity.
As shown in Fig. 11, the amount of end-to-end delay generated by this system with the increase of packet load length is less and relatively stable. This is mainly due to the fact that when the packet length is small, some cluster head nodes run out of energy or fail when the packet load length is large, and the cluster head nodes cannot be switched in time, resulting in the rapid increase of delay [18, 19]. The fuzzy algorithm in this paper can monopolize the channel in the end-to-end propagation, which is efficient and reliable [20].
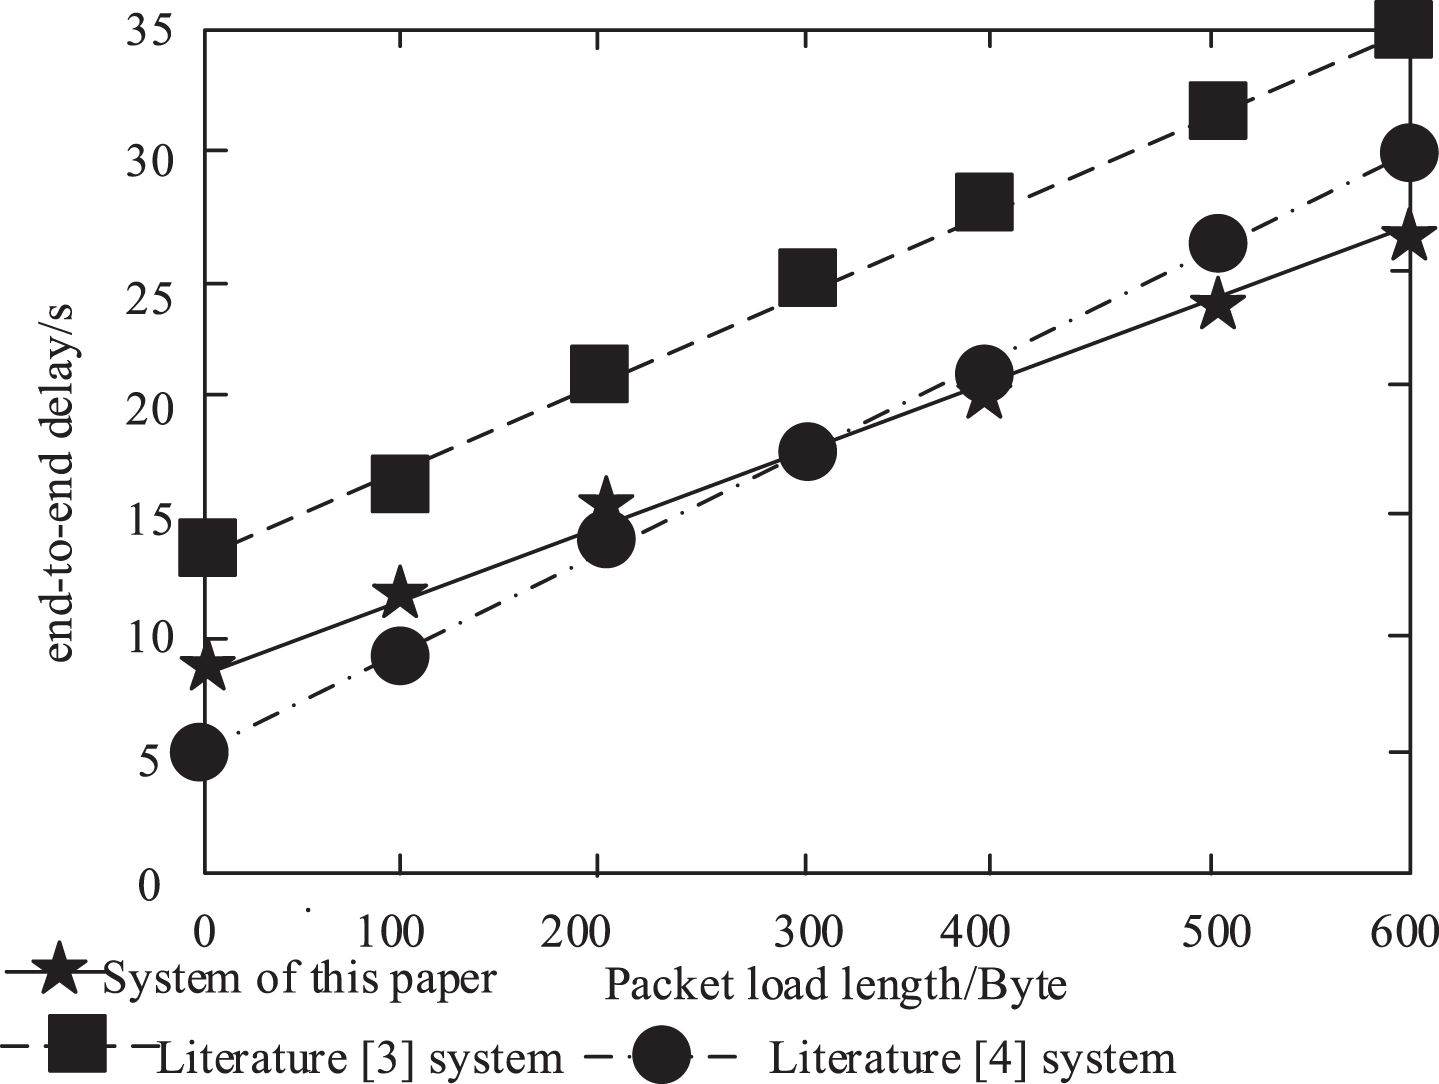
Delay comparison of different systems.
According to the data obtained in Table 1, the alarm accuracy rate within 5 seconds of the experiment is more than 95%. The average network accuracy of 352 subnet nodes is 98.02%, and the standard deviation is 0.36%; the average network accuracy of 1760 subnet nodes is 96.11%, and the standard deviation is 0.29%, which are relatively stable. Although the number of nodes in the two groups of subnets changes greatly, it has little impact on the fire information transmission capacity. It can be seen that the protocols in the designed system can be well coordinated, which is suitable for the priority receiving and sending and fusion processing of fire accident monitoring data in buildings, and has strong indoor environment monitoring ability and good generalization ability.
Monitoring and alarm accuracy of the system designed in this paper
At present, the establishment of fire monitoring system has realized the key technology, but from the overall system, the current system architecture has more functional considerations, but the creation of pertinence is not enough, there is no special system for fire monitoring, and the realization of the function is lack of network agreement guarantee. Therefore, a distributed WSNs fire remote monitoring system based on fuzzy algorithm is designed. The experimental results show that: compared with the traditional fire monitoring system, the system designed in this paper has shorter delay, and the accuracy of monitoring and alarm can be stable at more than 95%, which meets the relevant requirements in this field. However, due to the limited time of this study, the practical effect has not been verified, which is also the focus of future research, in order to lay the foundation for the in-depth study of relevant fields and experts.
Footnotes
Acknowledgments
This project is supported by the National Natural Science Foundation of China (No. 51479159)