
Abstract
Network security issues have become increasingly prominent, and information security risk assessment is an important part of network security protection. Security risk assessment based on methods such as attack trees, attack graphs, neural networks, and fuzzy logic has problems such as difficulty in data collection during the assessment process, excessive reliance on expert experience, failure to consider the actual network environment, or ineffective joint application. The qualitative and quantitative information security fuzzy comprehensive evaluation method uses the theory of fuzzy mathematics to better solve the above problems, so that the evaluation method is scientific, comprehensive and operable. To improve the accuracy of information security risk assessment in wireless sensor networks, we propose a fuzzy comprehensive evaluation method based on Bayesian attack graphs. This considers the impact of environmental factors of the assessed system on security risk and the spread of the effects on the Bayesian network. Therefore, this model can reflect possible situations due to network attacks in the wireless sensor network system. The results show that this quantitative evaluation method is applicable to assessing risk in wireless sensor network systems, and the results are more objective and accurate.
Keywords
Introduction
Wireless Sensor Networks (WSNs) are realized by deploying a certain number of sensor nodes in a target area. These nodes communicate in a radio, multi-hop, and peer-to-peer manner to form a self-organizing network [1]. The sensors in a WSN can communicate wirelessly, hence, the settings can vary more; the location can be moved, and it can be connected to the Internet in wired or wireless mode.
There are two types of information security risk factors faced by wireless networks. One is determined by the design and maintenance of special medium such as radio waves in wireless networks; the second includes data confidentiality, integrity protection, and network access control security. Compared with wired networks, wireless networks are more vulnerable to attacks. Therefore, if risk assessment methods for wired networks are used to evaluate wireless networks there will be relatively large errors, and its practicality is poor. This means that we have to improve wired network risk assessment methods based on the characteristics of the actual environment of wireless networks, and find a risk assessment method that is truly suitable for such networks. For network threat assessment methods, there are methods based on fuzzy logic and graph theory to perform modeling on the risk in the network, so as to effectively assess security risks. There are also security risk assessment methods that effectively combine attack graphs with fuzzy comprehensive analysis methods. However, these methods have certain dependencies and are not comprehensive enough [2].
Due to the uncertainty and difficulty of risk factors, wireless sensor networks risk assessment will be a complicated process. Information security risk assessment methods for wireless sensor networks typically include qualitative and quantitative methods, and also a combination of the two [3, 4]. The main characteristic of qualitative evaluation methods is strong subjectivity. It requires the evaluator to have a high professional knowledge and ability, otherwise the assessment results may be far from reality. Quantitative evaluation methods are more scientific, transparent, defensive, flexible, and consistent, but need to collect a large amount of information. These methods can involve regression, decision trees, factor analysis, and cluster analysis. Its characteristic is that some complex indexes in the wireless sensor networks are quantified, and the resulting calculation is complicated and time-consuming [5]. At present, qualitative and quantitative analysis methods are combined in most cases.
With the increasing awareness of information security risk assessment, a number of risk analysis approaches are also emerging and developing. However, no matter the kind of risk assessment method, it will involve the following aspects: 1) identifying the assets of the assessment object, 2) confirming the threats, vulnerabilities, and existing security measures of the assets, 3) identifying the risk level, 4) improving the security measures, and controlling the acceptable risk.
In order to improve the accuracy of information security risk assessment in wireless sensor networks, this paper tries to establish a model based on Bayesian attack graphs [6]. The research results show that the proposed quantitative assessment method is well-targeted and reliable. It is suitable for the information security risk assessment of complex wireless sensor networks, and the assessment results are more scientific and reasonable.
The bayesian attack graph model
This section first introduces the concept of attack graphs, and then proposes the Bayesian attack graph model.
Philips and Swiler first proposed attack graphs [7]. An attack graph is a graphical method to describe the whole attacker’s attack path from the starting point to the target. After analyzing all the configuration and vulnerability information of the network, it finds out all possible attack paths through global dependency relationships [7–10]. The formal definition of an attack graph is as follows:
This paper performs extensions on this basis. The attack graph is modelled, and a Bayesian attack graph is defined using a Bayesian network.
1) S = N internal ∪ N external ∪ N terminal . N external is a set of attributes S i . For S i , ∄a ∈ A|S i = post (a). N internal is a set of attributes S j . For S j , ∃a1, a2 ∈ A| [S j = pre (a1) and S j = post (a2)]. N terminal is a set of attributes S k . For S k , ∄a ∈ A|S k = pre (a).
2) τ ⊆ S × S. Assume S pre → S post ∈ A, then we have the ordered pair (S pre , S post ) ∈ τ. In addition, for S i ∈ S, Pa [S i ] = {S j ∈ S| (S j , S i ) ∈ τ} is called the father node set of S i .
3) ɛ is the set of two tuple elements of the form 〈S j , d j 〉. The definition is as follows: for all S j ∈ N internal ∪ N terminal , d j ∈ {AND, OR}. If S j = 1 ⇒ ∀ S i ∈ Pa [S j ], S i = 1, then d j is AND. If S j = 1 ⇒ ∃ S i ∈ Pa [S j ] , S i = 1, then d j is OR.
4) P is the collection of local condition probability distributions (LCPDs). Every attribute S j ∈ N internal ∪ N terminal has an LCPD to represent the value of Pr(S j |Pa [S j ]).
d
j
= AND d
j
= OR
When multiple conditions are involved, to calculate the local conditional probability, the following processes are carried out. For the case of ‘AND’, each condition is an independent event. The probability of destroying the target depends on the probability of using a single condition successfully. Thus, with the independence rule of an event, we have
Security risk assessment
Based on the definitions of the previous section, this section assesses the security risk of wireless sensor networks using the Bayesian attack graph model.
Risk assessment is the foundation and premise of risk management [11]. It is the possibility assessment for the vulnerability, potential impact, faced threats of information assets, and the combined risks of the three. It provides data support for risk management. At present, risk assessment techniques can be divided into two categories, namely static and dynamic risk assessment [12].
Static risk assessment assesses the system risk for a relatively short period of time or at a certain time point. The to-be-assessed system is considered as a stationary object, and the assessment process does not have continuity in time [13]. For a static risk assessment method, according to existing security risk assessment standards, the important elements include threateners, threats, assets, vulnerabilities, risks, etc.
Although the outcomes of static risk assessments are accurate, due to the variability and suddenness of network security incidents, they have a relative lag, the assessment costs are high, and cannot meet the actual demands [12]. Therefore, dynamic risk assessment techniques, which have the obvious advantages of being real-time, predictable, and low-cost, have attracted increasing attention recently.
Dynamic risk assessment considers the change of risk with the change of environmental factors based on the study of risk evolution trends, and, combined with system environment changes, evaluate the system security for a period. The continuous data of the to-be-assessed system is studied to analyze and predict the security status of the system. The assessment results have better real-time performance and are well targeted [14]. More details of the proposed method in this paper are discussed as follows.
Bayesian attack graph-based dynamic security risk assessment
First, according to the relevant literature, this paper decomposes the wireless sensor networks, establishes a security risk assessment index system, and determines the scope that needs to be assessed, as shown in Fig. 1.
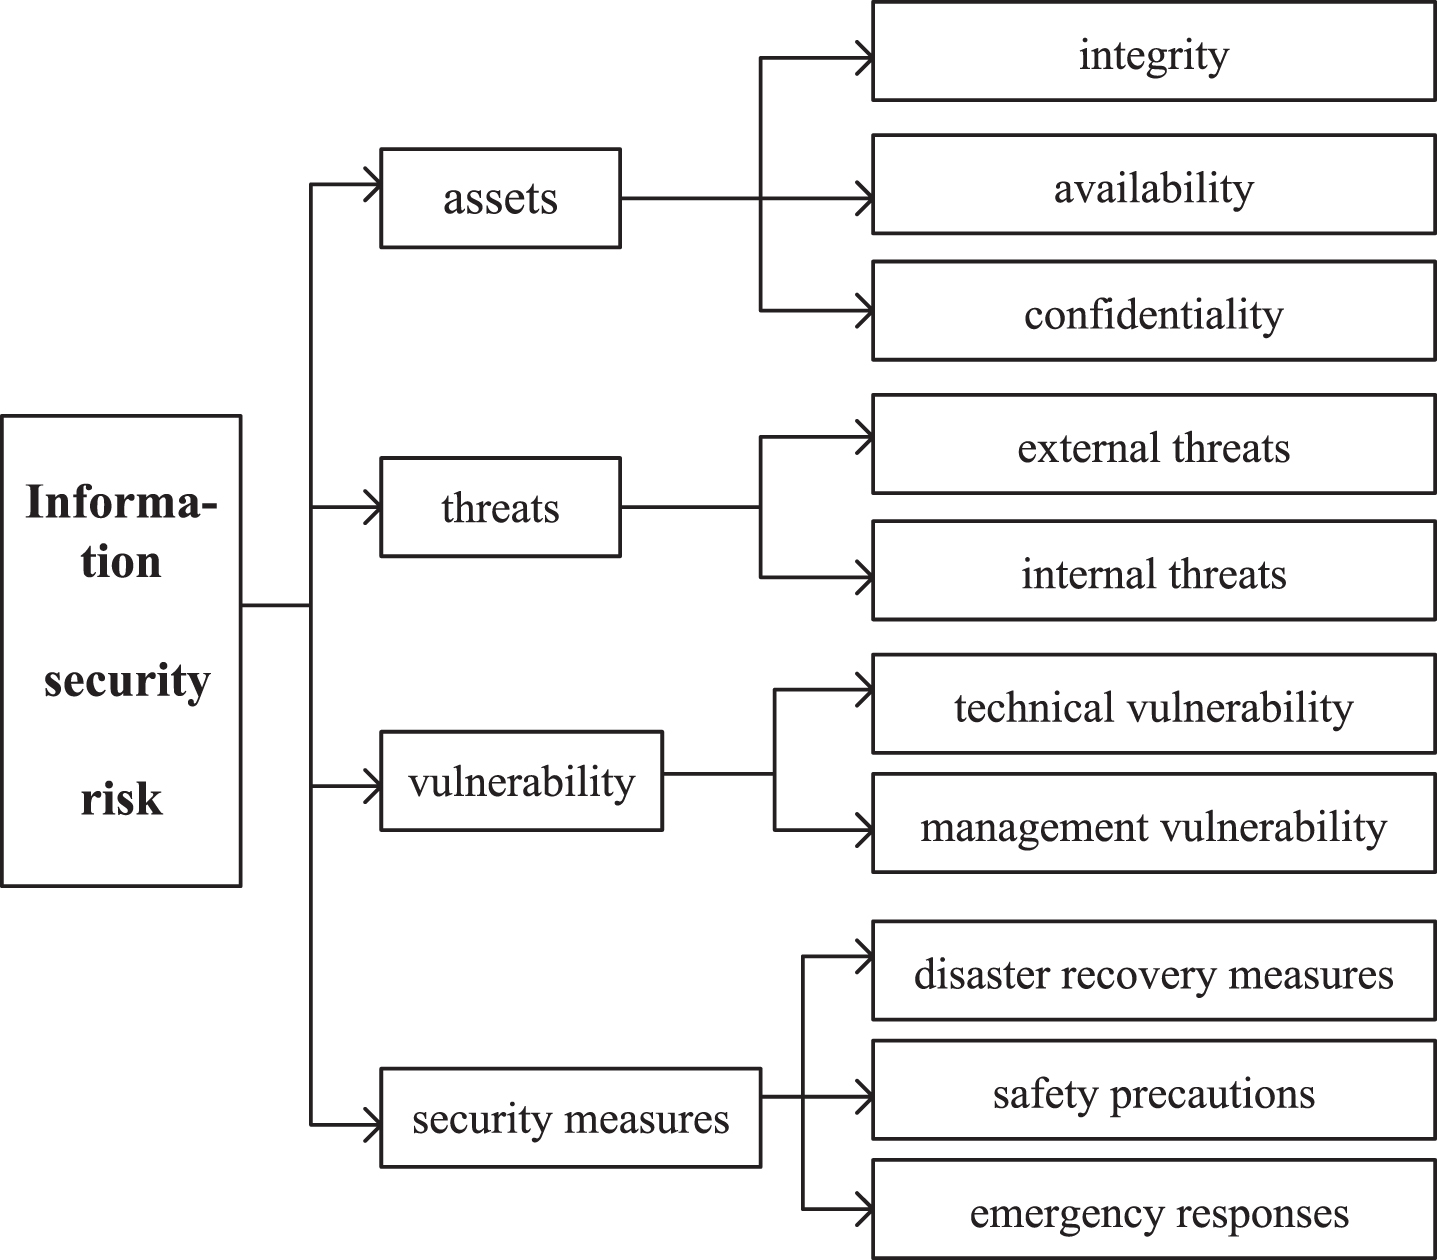
Risk assessment index system.
(texts in the above figure: information security risk; assets, threats, vulnerability, security measures; integrity, availability, confidentiality; external threats, internal threats; technical vulnerabilities, management vulnerabilities; disaster recovery measures, safety precautions, emergency responses.)
In the life cycle of the system, the probability of every network security factor may change. New security incidents will affect the security assessment results. The proposed Bayesian attack graph can determine the information security risk of wireless sensor networks from these new conditions by computing the posterior probability [15–18].
Assume S = {S1, . . . , S
n
} is a collection of attributes in a Bayesian attack graph.
To illustrate this, in Fig. 2, the system administrator notices an attack that has occurred at node A (the attacker destroyed the FTP server). Then node C’s posterior probability is calculated in the following way:
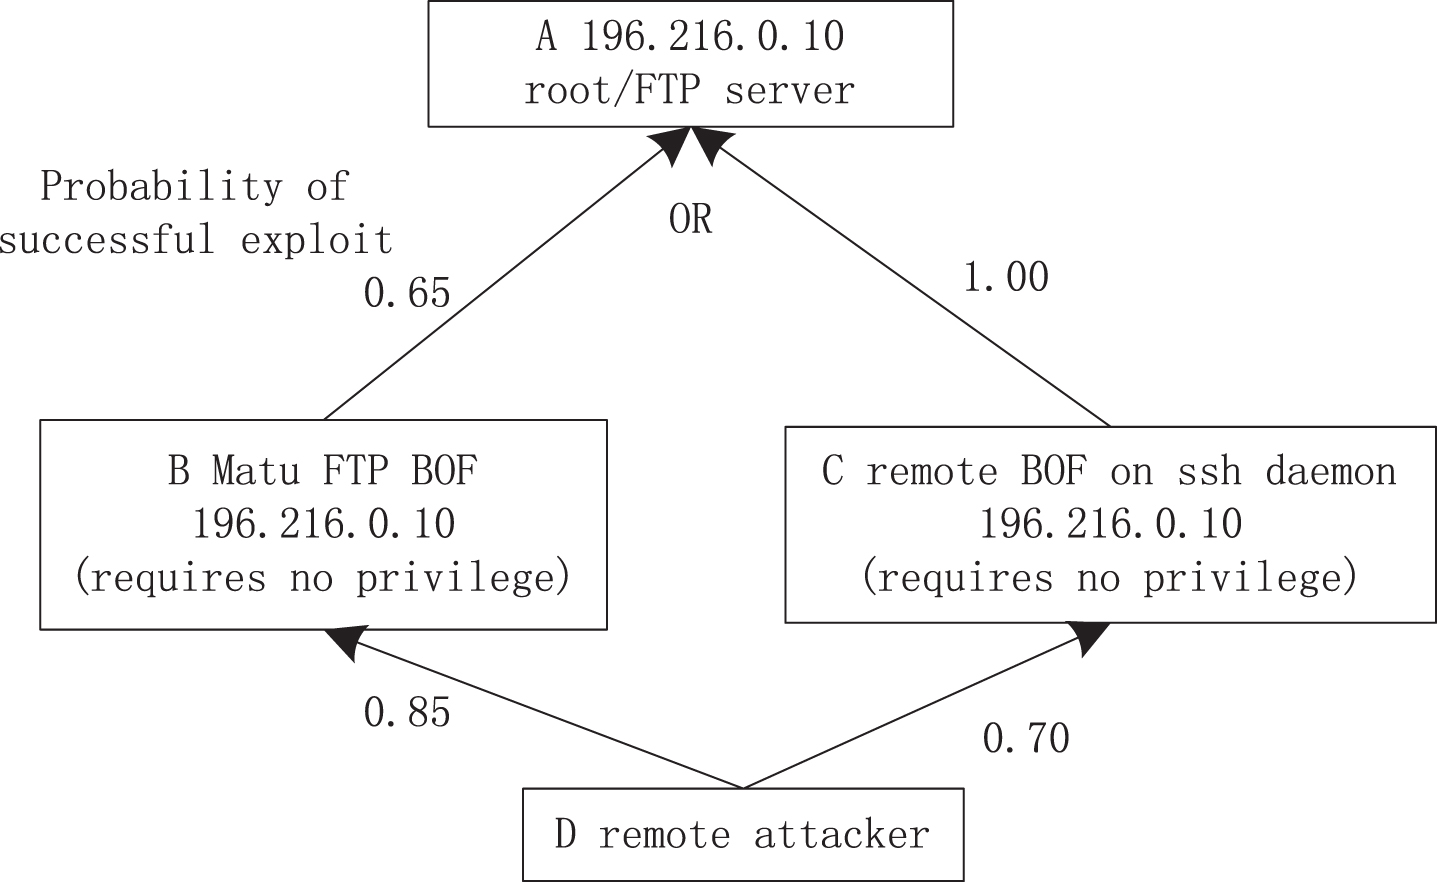
Example of a Bayesian attack graph.
Pr(C|A) = Pr(A|C) Pr(C)/Pr(A) =0.81, where
Pr(A) =0.61, Pr(C) =0.49
In a similar way, the posterior probability of node B can also be calculated. It is worth noting that, initially, the unconditional probability of node C is 0.49. After considering the incidents for node A, the posterior probability of node C becomes 0.81, which has an obvious increase. By considering the environmental information in the system, the security situation of a wireless sensor network system can be assessed more accurately and effectively [19–22].
The network in the above figure is used as a to-be-assessed network in this section for experimental analysis. This is to verify the rationality and effectiveness of the proposed Bayesian multi-step attack graph model in evaluating wireless sensor networks.
The network system shown in Fig. 3 includes three subnetworks: the demilitarized zone, the trusted zone, and the internal user zone. The three zones are divided by a firewall, and the whole network accesses the Internet through the gateway. The main services and the corresponding programs on each server/host are shown in Table 1.

Experimental network topology.
Services on each server/host
Potential network attackers mainly include external attackers accessing from the Internet and internal attackers accessing through the internal user zone. The constructed Bayesian attack graph, using the definition in this paper, is shown in the diagram below (Fig. 4).

Bayesian attack graph used in the experiments.
The semantics of all nodes in the above diagram are shown in Table 2.
Node semantics
In order to determine the utility of the proposed dynamic risk assessment method based on the Bayesian attack graph model, with the topological structure, accessibility, and network vulnerability of the above to-be-assessed network remaining unchanged, we simulated two application scenarios for experimental analysis.
Scenario 1: In this network, the Web Server is only an ordinary web server that publishes commonsense and introductory information. Web Server 1 stores data, documents, and the information needed for the Web Server, but no important or valuable data is stored. Both PC1 and PC2 do not store important or valuable information.
Scenario 2: In this network, the Web Server undertakes the main services of the network. Crashes or intrusion on this server will have a great impact on the enterprise. Important data, documents, and information needed for the Web Server are stored in the FTP Server and Database Server 1. The Email Server is an auxiliary mail server with a small number of users. The Database Server 2 stores mail information without any important data and information.
The node risk probabilities of the two scenarios were calculated using the proposed attack graph assessment method. The method proposed in [8] was also used to calculate the node attack probabilities of the two scenarios. All the obtained attack probabilities of the non-initial condition nodes and original attack nodes are shown in Table 3.
The calculated results of the node attack probabilities
The above table shows the results of the node risk probability calculations for two application scenarios with the proposed method and the reference method. Since the results of the reference method in the two application scenarios are the same, only one set of results are shown in this paper.
From Table 3, it is obvious that the method proposed in Ref. [8] does not model the impact of environmental threat information and other factors on the attack probabilities. Thus, the calculated risk probabilities of each node in the two scenarios are the same. The proposed Bayesian attack graph retains the original characteristics of the previous attack graph, and further extends its semantics. The Bayesian attack graph can cover the impacts of the environmental threat information and other factors on the attack probabilities, so that the node attack probabilities can have corresponding changes according to these factors.
For example, the Web Server is only an ordinary web server that publishes commonsense and introductory information in Scenario 1. It does not contain valuable or important data. A crash or an intrusion for this Web Server will not have a significant impact on the enterprise. Meanwhile, the Web Server undertakes the main services of the network in Scenario 2. It is the main business asset of the enterprise, and a crash or invasion will result in a significant impact on the enterprise. Therefore, the probability of an attack on the Web Server in Scenario 2 is greater than that in Scenario 1 in the calculated results of the proposed method.
Another example is as follows. In scenario 1, the attack difficulty of database server2 and database Server1 is similar. However, because the information value and importance of Database Server 2 are greater than that of Database Server 1, Database Server 2 is more attractive to attackers. Therefore, the probability of attack for Database Server 2 is higher than for Database Server 1 in the calculated results of the proposed method.
According to the above analysis, it can be concluded that the proposed attack graph can consider the impact of environmental threat information, asset information, and other factors on security risk assessment. This makes it more suitable for the real situation of wireless sensor networks attacks, and the objectivity and accuracy of the assessment results are further improved.
In order to improve the accuracy of information security risk assessment for wireless sensor networks, this paper proposed an assessment approach using a Bayesian attack graph model. Compared with a traditional network risk assessment method, the proposed method can analyze the potential risks from every segment of the network through the analysis of the network configuration and vulnerabilities, so as to evaluate most of the risks present in the system. The results from the experimentation indicate that the proposed quantitative assessment method is more suitable for the assessment of the risk of wireless sensor network systems. The results are more objective and accurate.
Footnotes
Acknowledgments
This work is supported by the 2019 science and technology project of Guangxi Province, China (No. 2019AC20168) and the Special Funds of Applied Science and Technology Research and Development of Guangdong Province, China (Grant No. 2015B010128015).