
Abstract
Semi-supervised clustering technique partitions the unlabeled data based on prior knowledge of labeled data. Most of the semi-supervised clustering algorithms exist only for the clustering of complete data, i.e., the data sets with no missing features. In this paper, an effort has been made to check the effectiveness of semi-supervised clustering when applied to incomplete data sets. The novelty of this approach is that it considers the missing features along with available knowledge (labels) of the data set. The linear interpolation imputation technique initially imputes the missing features of the data set, thus completing the data set. A semi-supervised clustering is now employed on this complete data set, and missing features are regularly updated within the clustering process. In the proposed work, the labeled percentage range used is 30, 40, 50, and 60% of the total data. Data is further altered by arbitrarily eliminating certain features of its components, which makes the data incomplete with partial labeling. The proposed algorithm utilizes both labeled and unlabeled data, along with certain missing values in the data. The proposed algorithm is evaluated using three performance indices, namely the misclassification rate, random index metric, and error rate. Despite the additional missing features, the proposed algorithm has been successfully implemented on real data sets and showed better/competing results than well-known standard semi-supervised clustering methods.
Introduction
Clustering, an unsupervised learning technique, is used to group and relate the patterns in data sets. The patterns in the data sets are grouped according to some pre-defined similarity metrics. In general, clustering is a technique to partition the data set into groups of related data objects. Several algorithms have been proposed for data clustering and find applications in pattern recognition, image processing, medical sciences, information retrieval, and others.
Depending upon the knowledge of the group of data points, clustering can be classified as supervised and unsupervised clustering. In supervised clustering, the group in which data points lie is known in advance, whereas in unsupervised clustering, no such information is provided beforehand.
Real-world data sets are becoming large, and it becomes a time consuming, lengthy, and expensive task to get knowledge of labeled data points. Combining both supervised clustering and unsupervised clustering gives rise to semi-supervised clustering in which the data set is partially labeled. In semi-supervised clustering, labeled data points are used to partition the unlabeled points, which improves the accuracy of unsupervised clustering. Several semi-supervised fuzzy clustering methods (SSFCM) are proposed in the literature, which can be classified based on the modification of objective function or on modification of the clustering method. A lot of research has been done on SSFCM algorithms based on the modification of the objective function [4, 22]. Pedrycz [22] presented a semi-supervised clustering algorithm to introduce a penalty factor in the conventional objective function. Binary vector and scaling factors are further introduced to distinguish the labeled data and keep the semi-supervised and unsupervised part of the objective function balanced, respectively [5, 24]. Bensaid et al. [2] presented a semi-supervised clustering method with a modified objective function where the membership value of the data point is chosen as 1 for labeled data and 0 for unlabeled data. Zhang et al. [29] presented a semi-supervised kernel-based fuzzy c means by combining a semi-supervised clustering algorithm along with the kernel approach. All semi-supervised algorithms explored in the literature explicitly account for the complete data set.
Missing or unknown data with several samples containing missing features is another challenge. Such incomplete data occur in most application domains, including data mining, pattern recognition, image analysis, and environmental and medical sciences. Reasons for missing data may be numerous, including improper collection process of data sets, the missing response in the surveys, and high cost involved to get certain features. Dixon [7] and Jain and Dubes [9] explored empirical studies on incomplete data. Several techniques were proposed for the clustering of data with missing features. Incomplete-data problems are generally dealt with via imputation, i.e., missing features are filled by some specific values. Imputation techniques include filling of missing data with zeros, mean, and median and can be viewed as single imputation schemes [8, 16]. Toutenburg and Nittner [25] presented linear regression models for the incomplete categorical covariate. Zhang et al. [30] proposed the imputation of missing values with a genetic algorithm in fuzzy probabilistic c means algorithm. Hathaway and Bezdek [11] presented several clustering strategies for clustering of incomplete data. Jinhua Li et al. [19] developed K-means and K- median clustering methods for incomplete data. Dan Li et al. [18] utilized the nearest neighbor intervals to extend the fuzzy c means algorithm for incomplete data.
As most of the existing algorithms use complete data sets for a semi-supervised clustering algorithm, it is proposed to reformulate the semi-supervised algorithm for the clustering of incomplete data.
The proposed work addresses two issues that need to be articulated for the clustering of available data, i.e. how clustering is done when missing attributes are present in the dataset and how clustering is improved by utilizing the knowledge of a few labeled data samples.
The research paper is organized as: Section 2 sums up the different methods utilized for handling incomplete data in clustering, semi-supervised clustering, and kernel-based semi-supervised algorithms. Section 3 and Section 4 describes the proposed semi-supervised clustering algorithm for incomplete data and experimental results, respectively. Section 5 presents the conclusion drawn.
Background/related work
This section introduces various statistical and non-statistical techniques for the clustering of incomplete data. It then discusses fuzzy c means clustering and semi-supervised clustering algorithms.
Traditional techniques to handle incomplete data
Conventional clustering algorithms cannot analyze the data with missing values directly. The missing features must be imputed by some means. Data pre-processing and application of existing fuzzy clustering methods or modification of existing clustering methods are two main strategies for handling missing data. Data pre-processing is done by various statistical techniques, which include the case deletion method and imputation methods. There are four powerful techniques to handle missing data: deletion/removal strategy, imputation techniques, model-based techniques, and machine learning techniques.
Deletion/ removal strategy
The most common approach is the removal strategy, which removes the missing data from the dataset. However, the limitation of this approach is that it can be applied only when a small portion of data is incomplete [11].
Imputation techniques
Imputation is the most commonly used technique for missing data that simply alter the missing features with a specific value. Imputation techniques are classified as single imputation and multiple imputations [6]. A single imputation technique replaces the missing feature with a specific value calculated using various statistical methods. The simplest imputation method is mean imputation, where the missing features are substituted by the mean value of all the available features. This method introduces a bias in the datasets. This limitation of mean imputation can overcome by median imputation in which the existing values replace the missing feature. Nearest Neighbor [3] based imputation fills the missing feature with the nearest value in the neighborhood. This strategy is generally more precise yet computationally costly for large datasets. Interpolation is also an imputation technique used to approximate the missing value between two data points [17, 20]. Linear interpolation is the simplest form of interpolation among three interpolation techniques, i.e., Linear Interpolation, Quadratic Interpolation, and Cubic Interpolation. It imputes the missing values of incomplete data by considering linearity between two data points and computes the missing feature utilizing the straight-line condition. All three methods are found to be equally suitable for the estimation of missing attributes [20]. In the present work, the linear interpolation method is investigated for handling incomplete data in clustering.
Regression imputation is a data-driven model, which preserves the data by imputing the missing value with an estimate from available data. The missing features are replaced with the regression of the available features [25]. In linear regression for modeling n data points, the dependent variable y
i
is given as:
Where x i is an independent variable, β0 and β i are fixed parameters and ε i is termed as an error.
The multiple imputation approach offers different imputed values for each missing feature and estimates the missing features by suitably combining all imputed values [10]. Multiple imputation by chained equations (MICE) is commonly used to estimate missing features in incomplete data [26]. MICE utilizes regression techniques to approximate missing features.
Model-based technique models the probability density factor of incomplete data utilizing expectation maximization (EM) algorithm [14, 15]. EM is an iterative method used for estimating the missing value randomly to get the optimized result by repeating the process until convergence. This algorithm is relevant for data missing completely at random (MCAR) or missing at random (MAR) but not suitable for data not missing at random (MNAR).
Machine learning techniques
These techniques are non-imputation based techniques that modify the conventional fuzzy c means algorithm [11, 30]. In machine learning techniques, data is not pre-processed before the clustering and clustering process is modified in such a way that it can handle incomplete data in the clustering process itself.
Figure 1 describes the different techniques used for handling missing data in clustering.

Techniques to handle missing data in fuzzy clustering.
Fuzzy c-means clustering partitions a dataset Y = {y1, y2, …… . y
k
} into fuzzy clusters v = {v1, v2, …… . v
p
} by minimizing the objective function:
Where
k - samples in the data set,
v p - p th cluster centre
u ji - fuzzy partition vector
u
ji
∈ [0, 1] and justifies the condition
FCM is an unsupervised clustering technique where cluster centres and the distance metrics are calculated only when all features of each data sample are available. Various modifications are incorporated in conventional FCM to make it applicable for the clustering of data with missing features. Hathway and Bezdek [11] utilized the fuzzy c means algorithm to handle missing features in data by developing four new strategies. The first one is the whole data strategy (WDS), which omits all missing data features. This approach is applicable only when a small portion of data is incomplete. When the fraction of incomplete data sample is large, partial distance strategy (PDS) can be implemented in which partial distance function [7] is calculated using all available features for the clustering of incomplete data. In optimal control strategy (OCS), missing values are viewed as additional variables, and then better estimates are determined using some optimal control methods. The nearest prototype strategy (NPS) is an iterative method used to replace missing features with the nearest prototype.
The main idea behind the semi-supervised clustering algorithm is to improve the clustering performance with prior knowledge of labeled data. Semi-supervised clustering methods are based on modifying the clustering process [2] or modifying objective function [22]. This section presents a semi-supervised clustering algorithm (SSFCM1) based on the modification of the clustering process [2] and a semi-supervised clustering algorithm (SSFCM2) based on the modification of the objective function [22], where few data samples are labeled, and a large number of data samples are unlabeled. Data set Y is arranged as:
The labeled and unlabeled data are represented as follows:
Here labeled and unlabeled data are represented by superscript l and u, respectively, whereas the number of supervised and unsupervised data is n l and n u respectively.
Partition vector U is randomly initialized and is described as:
Typically, the value of
Initial cluster centres are calculated taking labeled data into account as follows:
Therefore, the membership
Where
Finally, cluster centres are updated as:
Pedrycz and Waletzky [22] developed a semi-supervised clustering algorithm (SSFCM2) based on the modification of the objective function is as follows:
Here, a binary vector g is introduced (g
i
= 0 if y
i
is unlabeled else g
i
= 1) to differentiate a labeled and unlabeled sample. The membership values of labeled data are represented in a matrix.
The scaling factor α keeps the balance between the labeled and unlabeled data. The detailed algorithm of SSFCM2 can be studied in [22].
Semi-supervised kernel-based fuzzy c-means is based on utilizing the kernel version of fuzzy c means in semi-supervised FCM where distance metric is kernel induced distance measure [28] and is as follows:
Here ϕ is a non-linear factor that map sy
k
from the input Y to a new space with high dimensions. The kernel function K (x, y) is defined as the inner product in a new space for (x, y) in input space Y as follows:
Several kernel functions are explored in the literature. In this work, Gaussian kernel function [27] is used for simplicity, which is given as:
Where parameter σ is given by
Where
Finally, the partition matrix for unlabeled data and cluster centre in SSKFCM [29] are updated as follows:
A semi-supervised clustering algorithm utilizes labeled as well as unlabeled data for clustering. In this proposed work, a semi-supervised FCM clustering algorithm [2] is extended for the clustering of incomplete data.
Initially, a complete data set Y which contains both labeled and unlabeled data samples is chosen. Therefore Y can be represented as a combination of labeled data Y
l
and unlabeled data Y
u
.
Here n l and n u are the number of labeled and unlabeled data points in the dataset Y.
Both labeled and unlabeled data points in Y may contain some missing features also. So Y
l
consists of labeled data with both missing and non-missing features i.e.
Where Y W corresponds to the whole data, and Y M to the missing data, in the given dataset
Similarly, Y
u
is taken as the combination of both unlabeled data points with missing features and unlabeled data points without missing features.
The missing features in both labeled and unlabeled data are initially filled by linear interpolation imputation technique. Linear interpolation imputation technique is used to handle missing data initially because this technique is fast and computationally efficient. Moreover, it can create artifacts when data points are sparse. If the point y2 contains a missing feature, then both points y1 and y3, which is the actual measurement taken prior to the point y2 and the actual measurement is taken after point y2 respectively, will be used to compute the value at y2. (y11, y12), (y21, y22) and (y31, y32) are the coordinates of points y1 and y2 respectively as shown in Fig. 2. The equation that computes the missing feature at y22 for point y2 is as follows:
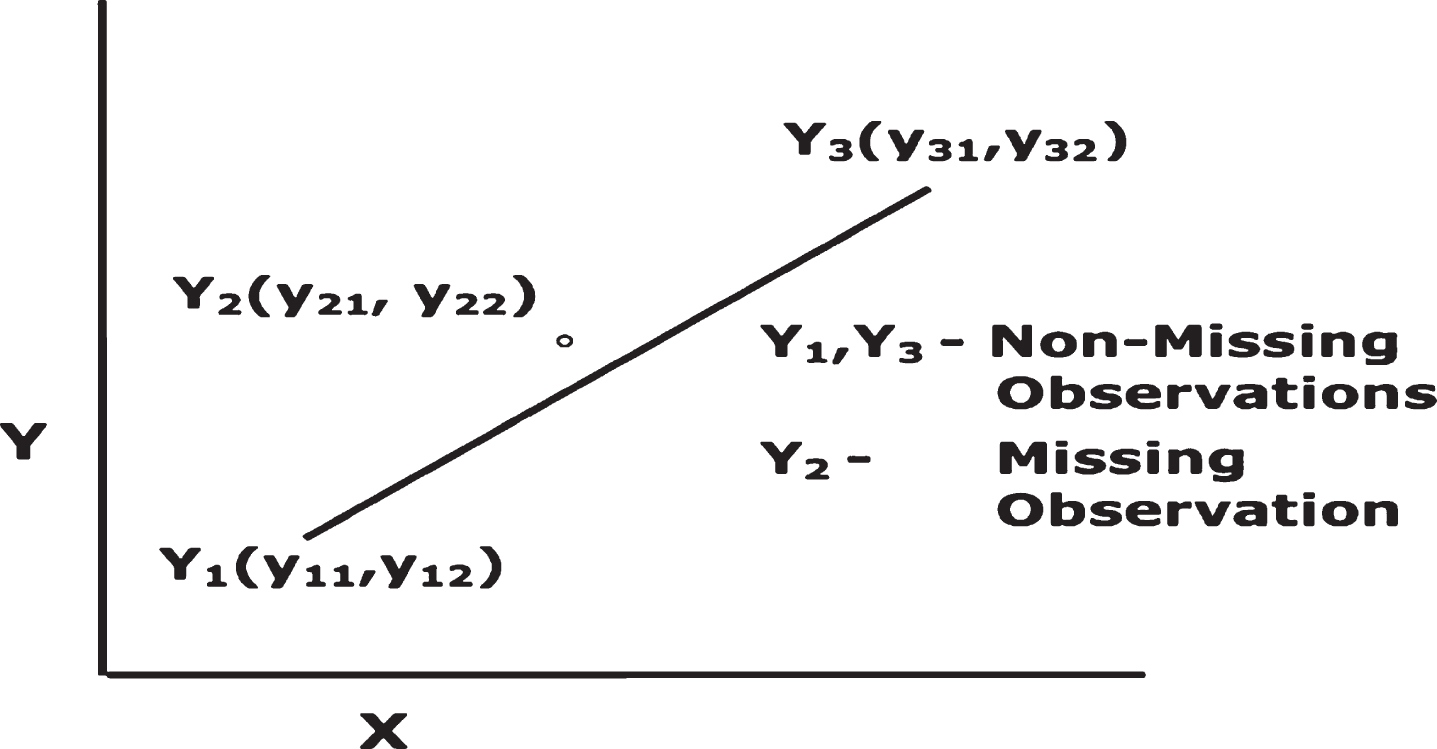
Linearity between missing and non-missing observations.
Partition vector U is initialized randomly and is described as:
Where
Cluster centres are initialized taking whole labeled data into account from U
l
as follows:
The membership grade
Where n um is taken as the number of unlabeled data points with features and n uw is taken as a number of unlabeled data points without missing features. Therefore n u = n um + n uw
Finally, the cluster centres and missing vectors
The above discussion is summarized in the following algorithm.
Input: Y-a d-dimensional incomplete dataset which contains both labeled data points and unlabeled data; p-number of classes, m > 1 is a fuzzification factor, ∈>0 is termination accuracy
Output: Cluster centre v and missing features of both labeled and unlabeled data i.e. The given data set is represented as
Initialize all missing features i.e. Initialize Fuzzy partition vector U randomly. Further, partition vector U is divided as
Initialize v applying standard FCM on whole labeled data using Equation (18). Repeat v1 = v Membership degree of labeled data is taken as 1, and a partition matrix of unlabeled data is separated from partition vector U and is updated using Equatios (19-20). Cluster centre v1 is updated using Equation (21)
Update all missing features i.e. Until ∥v1 - v∥ < ∈ then Stop else go to (5)
Figure 3 describe the methodology of the proposed work graphically.
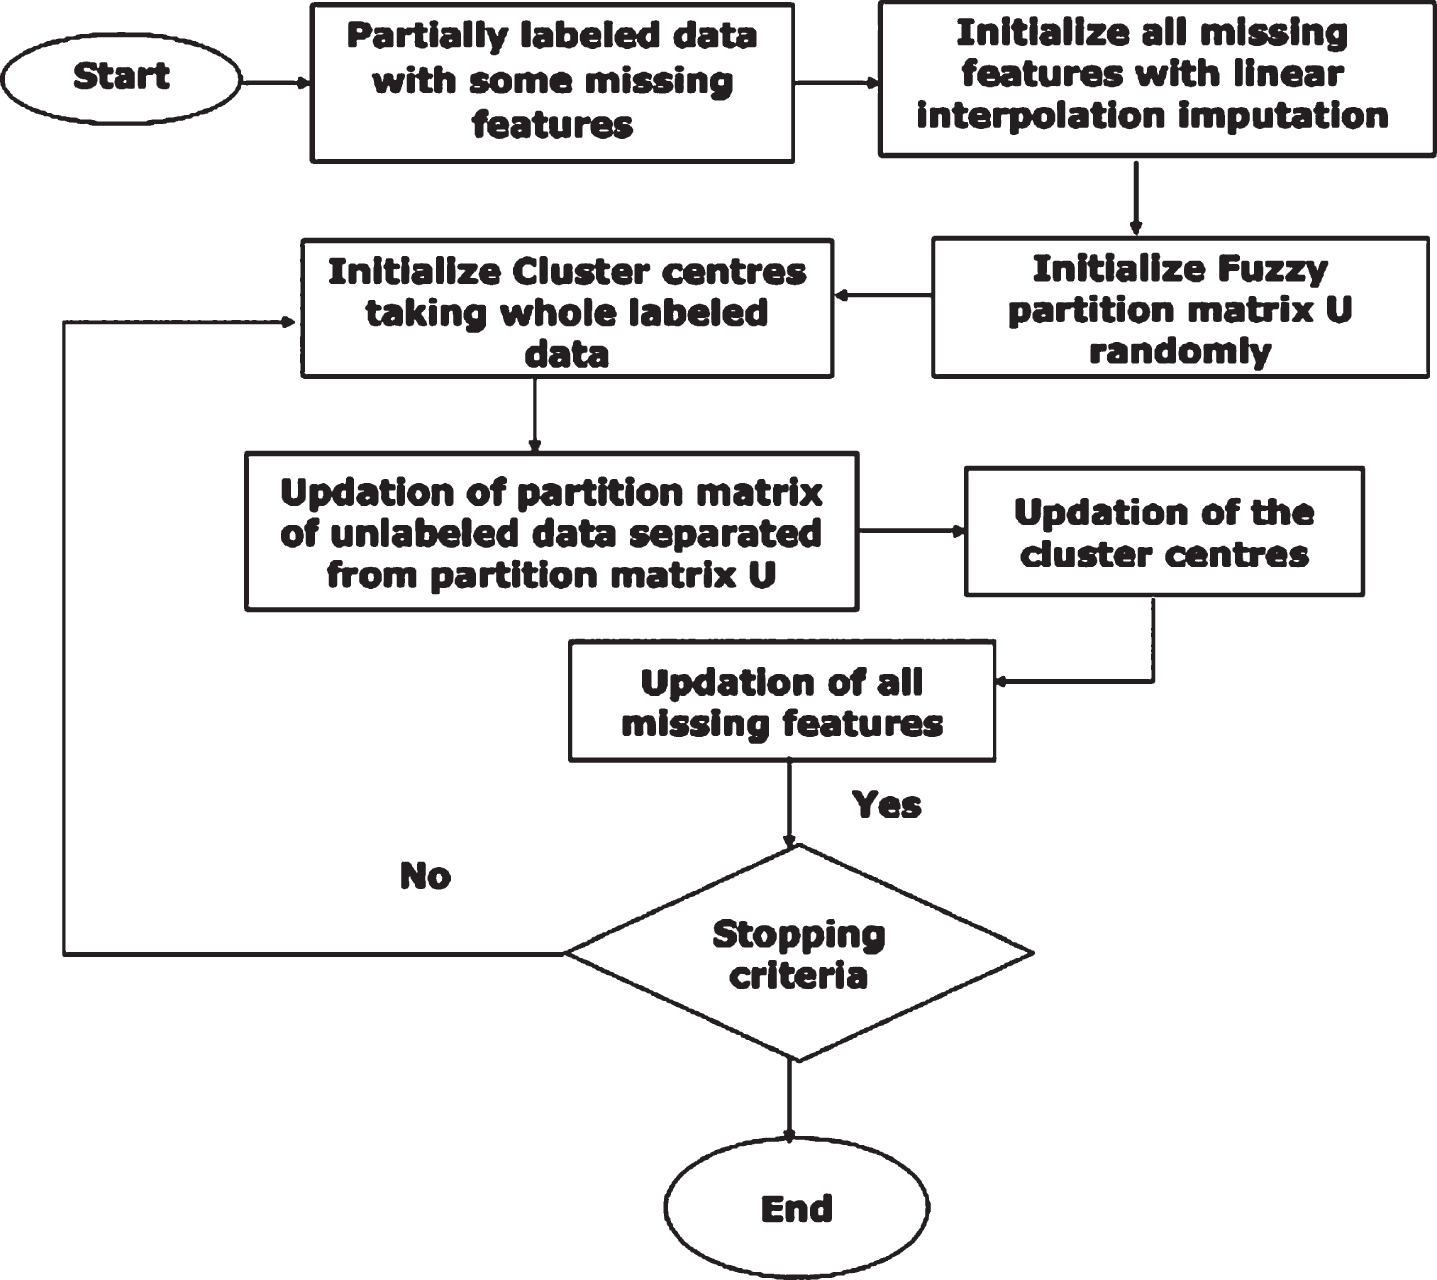
Algorithm of proposed work.
This section explains data sets, performance indices, and the methodology used to evaluate the proposed semi-supervised clustering for incomplete data. All the experiments are carried out in a MATLAB 2019a environment. The relevant parameters used in all experiments are: fuzzification factor m is set to be 2, stopping criterion ∈=10-5 and scaling factor α = 0.5.
Data sets
The proposed algorithm is tested on four real datasets, namely IRIS, WINE, SEED, and Wisconsin Breast Cancer of classification and pattern recognition problems from the UCI dataset Repository [1].
The IRIS data set comprises 150 samples of three species of iris flower with four different features. The SEED data set includes three sets of wheat seeds categorized into three different varieties, where each group consists of 70 samples.
WINE data set depicts the outcome of a chemical investigation of WINE grown in a specific area of Italy. It consists of 178 objects, and each object has 13 attributes found in each of the three classes of WINE data.
Wisconsin Breast Cancer data set is an incomplete real-world data set. The objective of this data is to identify benign or malignant classes. This data set contains 699 observations, with 16 missing attribute values.
Evaluation criterion
The accuracy of results for each algorithm is evaluated using three performance indices: misclassification rate [12], random index metric [13, 23], and error rate.
Misclassification rate
The misclassification rate [12] is the most widely recognized index used to determine the clustering algorithm’s effectiveness. It is defined as the sum of incorrectly assigned samples in each cluster. Let A is the number of incorrectly assigned data points in each cluster.
It is an external index used to validate the clustering algorithms by measuring the similarity index between different clustering algorithms. The 0 value of Rand index (RI) indicates that there ino similarity between two data clustering, whereas 1 indicates both data clustering algorithms agree perfectly.
Let U = {u1, u2 …… … u p } be the partition given by the proposed algorithm and V = {v1, v2 …… … v s } be the partition defined by the standard clustering algorithm. Then RI can be determined [23] as follows:
Where n
ij
represents the number of samples common in partition matrix U and V. n
i
gives the number of samples in U and n
s
represents the number of samples in V, and n is the number of total samples.
The error rate is the ratio of incorrectly assigned unlabeled data points to the total number of unlabeled samples in the data set. Let n is the number of unlabeled data points, and Nun is incorrectly assigned data points.
The proposed algorithm (SSFCM_ID) compares the effectiveness obtained by applying a semi-supervised clustering concept to incomplete datasets with semi-supervised FCM (SSFCM1 and SSFCM2) and semi-supervised kernel-based FCM (SSKFCM).
Standard semi-supervised FCM (SSFCM1 and SSFCM2) clustering algorithms and SSKFCM algorithms utilize both labeled and unlabeled data. Our proposed algorithm utilizes all available data, i.e., incomplete data, complete data, labeled and unlabeled data. Four different portions of labeling and six randomly selected missing data patterns are used for determining the accuracy of the proposed algorithm.
Initially, a data set with complete information is selected, and then a small proportion of data is made supervised randomly. It divides the data into two parts, i.e., unlabeled data and labeled data. The labeled percentage range used is 30, 40, 50, and 60% of the total data. Data is made incomplete by arbitrarily removing certain components of its features with partial labeling. Missing percentage ranges in the proposed work are 5, 10, 15, 20, 25, and 30% of the total data points in a given data set. The proposed algorithm utilizes both labeled and unlabeled data, along with incomplete data. The proposed algorithm assumes data are missing completely at random (MCAR) mechanism with the following constraints:
Each original element vector holds at least one feature. For example, given a three-dimensional data
Here the element vector y2 has at least one feature value |4| presents in the data. Each data point has at least one value present in the incomplete data set. For example, given three-dimensional data,
Here, the third component of sample y1 and y3 is missing, and only one component value |2| is present as the third component of data sample y2.
Table 1 describes the number of missing features with different missing rates in datasets.
Number of missing features with different missing rates in datasets
Number of missing features with different missing rates in datasets
In the proposed work, 20 independent trials are conducted for each set of missing and labeling data, and the same data sample created in every trial is utilized for all the calculations with the goal that the outcomes can be effectively examined and compared. Results are then calculated by taking the average of all independent trials. Experiments are performed on different data sets, and results are stated in Tables 2-5 for misclassification rate (Mis), Rand Index (RI), and error rate (Err). Results for IRIS and SEED data reported in Tables 2-3 show that when the fraction of missing data is between 5% –20%, the proposed approach outperforms SSFCM1, SSFCM2 and SSKFCM for all performance indices. As the
Performance of different algorithms on IRIS data
Performance of different algorithms on IRIS data
Performance of different algorithms on SEED data
Performance of different algorithms on WINE data
Performance of different algorithms on Wisconsin Breast Cancer Data set
percentage of labeling increases, the performance of all clustering algorithms improves. When the missing percentage is increased to 25%, the proposed approach results are comparable to the competing algorithms. It is further seen that as the missing rate is further increased to 30%, the results of the proposed approach are again comparable if not better than SSFCM1, SSFCM2 and SSKCM, thus indicating the robustness of the clustering algorithm in the presence of missing data.
Next, results in terms of misclassification rate, random index, and error rate for different patterns for missing and labeled data to the WINE data set are presented in Table 4. The performance of the proposed algorithm is better than SSKFCM but comparable to SSFCM1, SSFCM2 when the missing rate is less than 15%. But as the missing ratio increases more than 15%, the proposed algorithm does not give better results than the other techniques.
Comparisons are also made between SSFCM1, SSFCM2, SSKFCM, and the proposed SSFCM_ID for the WISCONSIN BREAST CANCER data set, which is an incomplete real-world data set, and results are reported in Table 5. This data set contains 699 observations, with 16 missing attribute values. SSFCM1, SSFCM2, and SSKFCM algorithms utilize only complete data; therefore, both the algorithms are implemented only on 683 data points, without considering 16 missing attributes, whereas our proposed algorithm SSFCM_ID performs at par if not better even when applied on 699 data points containing missing features. This analysis supports our claim that the proposed semi-supervised clustering algorithm can handle incomplete data efficiently.
Figure 4 presents the experimental results of different clustering algorithms in terms of the random index for different data sets. The proposed algorithm SSFCM_ID with different missing percentages: 5%, 10%, 15%, 20%, 25% and 30% is further represented as SSFCM-ID05%, SSFCM-ID10%, SSFCM-ID15%, SSFCM-ID20%, SSFCM-ID25% and SSFCM-ID 30% respectively. The random index increases for SSFCM1, SSFCM2, and SSKFCM algorithms as the percentage of labeled data increases. However, the random index obtained by the proposed algorithm, even with missing data, is better than other algorithms for IRIS, SEED, and Wisconsin cancer data. For WINE data, the performance of the proposed work is at par when compared with other algorithms. Hence, the proposed algorithm works on both missing and unlabeled data and is compatible with SSFCM1, SSFCM2, and SSKFCM.
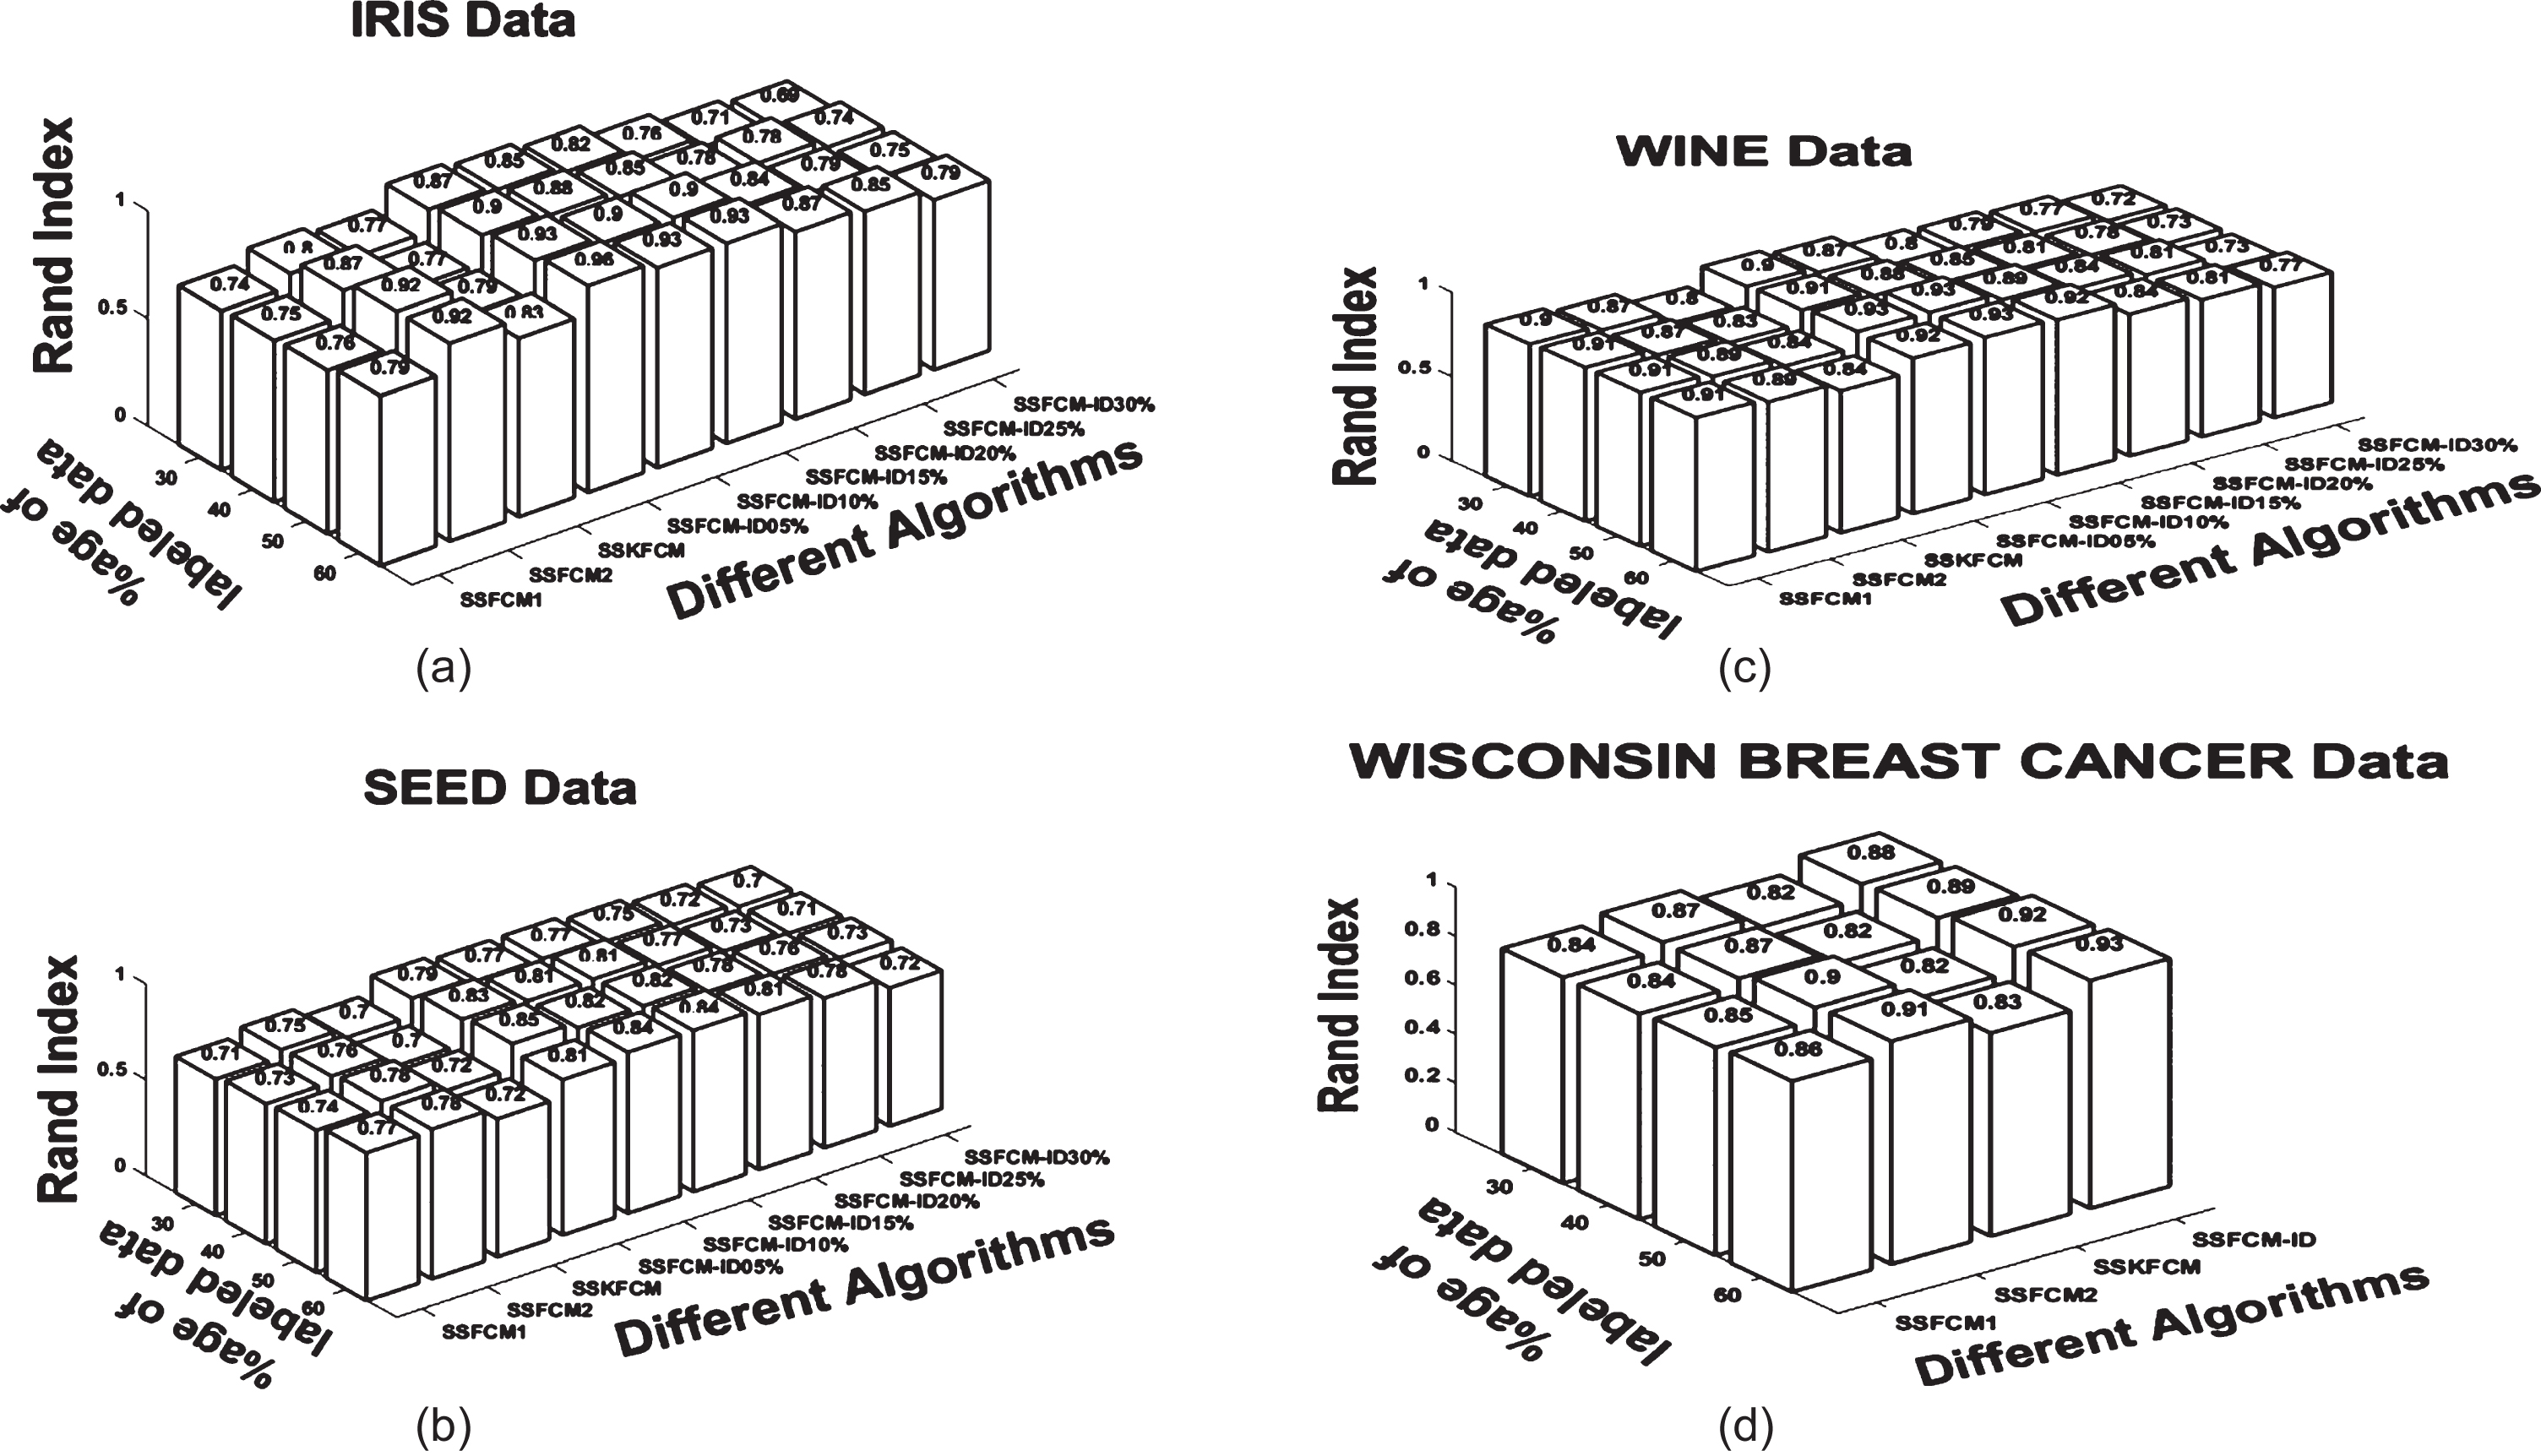
Experimental results for different algorithms in terms of Random Index for (a) IRIS Data, (b) SEED Data, (c) WINE Data (d) Wisconsin Breast Cancer Data.
This paper presents a new approach for a semi-supervised clustering algorithm for incomplete data (SSFCM_ID). The proposed work is motivated by considering how to reveal the inner data structure information of unlabeled data with clustering when missing features are present in data sets. The algorithm utilizes all the available data-complete and incomplete, as well as labeled and unlabeled. The importance of a linear interpolation imputation method to compute the missing values is discussed and demonstrated. Despite the additional missing features, the proposed semi-supervised algorithm has been successful on various real-life data sets. Different percentages of missing and labeling are considered to evaluate the performance of the proposed work. Experimental outcomes show that in comparison to SSFCM1, SSFCM2, and SSKFCM algorithms, the proposed algorithm performs better on IRIS and SEED data sets and gives comparable results with WINE and Wisconsin Breast Cancer data sets.