
Abstract
For estimation of the RUL (Remaining useful life) of Lithium ion battery we are required to do its health assessment using online facilities. For identifying the health of a battery its internal resistance and storage capacity plays the major role. However the estimation of both these parameters is not an easy job and requires lot of computational work to be done. So to overcome this constraint an easy alternate way is simulated in the paper through which we can estimate the RUL. For formation of a linear relationship between health index of the battery (HI) and its actual capacity used of power transformation method is done and later on to validate the result a comparison study is done with Pearson & Spearman methods. Transformed value of Health Index is used for developing a neural network. The results demonstrated in the paper shows the feasibility of the proposed technique resulting in great saving of time
Introduction
First In the upcoming era batteries are going to play a major role in meeting with new technologies. Today we are using batteries in almost every electronic and electrical device for example Electric vehicle, Mobile Phones, Satellite, Space Programmes, and Power Backups etc. if we look in to the types of the batteries we will find that there are plenty of types of batteries present around us. But among all of them Lithium Ion (Li) battery is the most popular one in almost every domain due to its properties such as: light in weight, less charging and more discharging time, output voltage high & most important environment friendly. NASA launched robot spacecraft to the Mars in the year 2006 was a failure due performance of its battery which got deteriorated due to continuous charging and discharging of the battery. The Dreamliner of Boing got fire on the board and was grounded till the better battery plan was adopted in the year 2013; it was all due to the failure of its Lithium ion battery. A report (2017) about Singapore suggested that fire instances in two wheelers rose to almost 350 % in the year 2017 as compared to the year 2016. If we look in to solar generation where battery plays a role of major component shares a cost of almost 30 % of the total set up. And there are many more domains or example through which we can Understand the importance of having an efficient, safe and economic battery. Hence to meet all the constraints mentioned above researcher are working hard to increase the capacity of batteries, improving its RUL time and proving a safer battery. By measuring the capacity and internal resistances of the battery we can very easily estimate the RUL for the battery but the measurement of these two parameters online is very difficult. This difficulty is because it is hard to measure the internal state of the battery using the sensors. Whereas if direct measurement is attempted it will be very costly thus making online estimation difficult and cost ineffective. Therefore the other non-intrusive approaches are gaining popularity among the researchers.
In this paper we have monitored the charge and discharge condition of the battery in order to obtain its HI index. Once extraction of HI index is done optimization is performed to have linear correlation among HI index and current health of battery. The transformed health index (HI) is used for determining actual health of battery than determining its current health. The entire paper has been divided in to four parts: where in part 2 we can understand the experimental setup and steps of the method. Part 3 focuses on the outcome of work and other possibilities. Part 4 is the conclusion of the work
Main key point of the study Different operating conditions of the batteries are included in the studies. Test included Rechargeable set of batteries. Box-Cox transformation applied for HI optimization also improved linearity between HI and battery capacity. RUL estimation will be done for three different cases.
Data for the study
Data collected from the NASA is taken for the study to calculate RUL for the battery. An 18650 test bed including commercial lithium ion battery which is rechargeable is considered for the study. The test bed will be having voltage measuring equipment’s, load which is easily programmable, environment safety chamber, sensing devices, DAS, PCI and EIS. For performing the experiment four different lithium ion battery were taken and studies were done at room temperature for their three situations: Charging course, Discharging course and measurement of their Impedance.
This continuous charging and discharging of the battery is stopped when it reaches its EOL criteria ie. 2Ahr to 1.4 Ahr. This data is recorded and is used for calculation of health index and RUL estimation using ANN estimation. The results were recorded and presented in Figure: A2.1.1 to A.2.1.5 for charging process and A.2.1.6 to A.2.1.10 for discharging period.
Suggested method outline
Given below in Fig. 1 is the complete outline of the proposed method for finding out HI, optimizing HI, and verifying HI and then at last RUL estimation using ANN model. Proposed method is applicable for online health monitoring of the battery which was not possible by measuring its internal resistances and its capacity. In this scheme the HI is extracted and then finally optimized for the data of NASA. Once the HI is evaluated using various parameters a correlation is developed for mapping it with the capacity of battery.
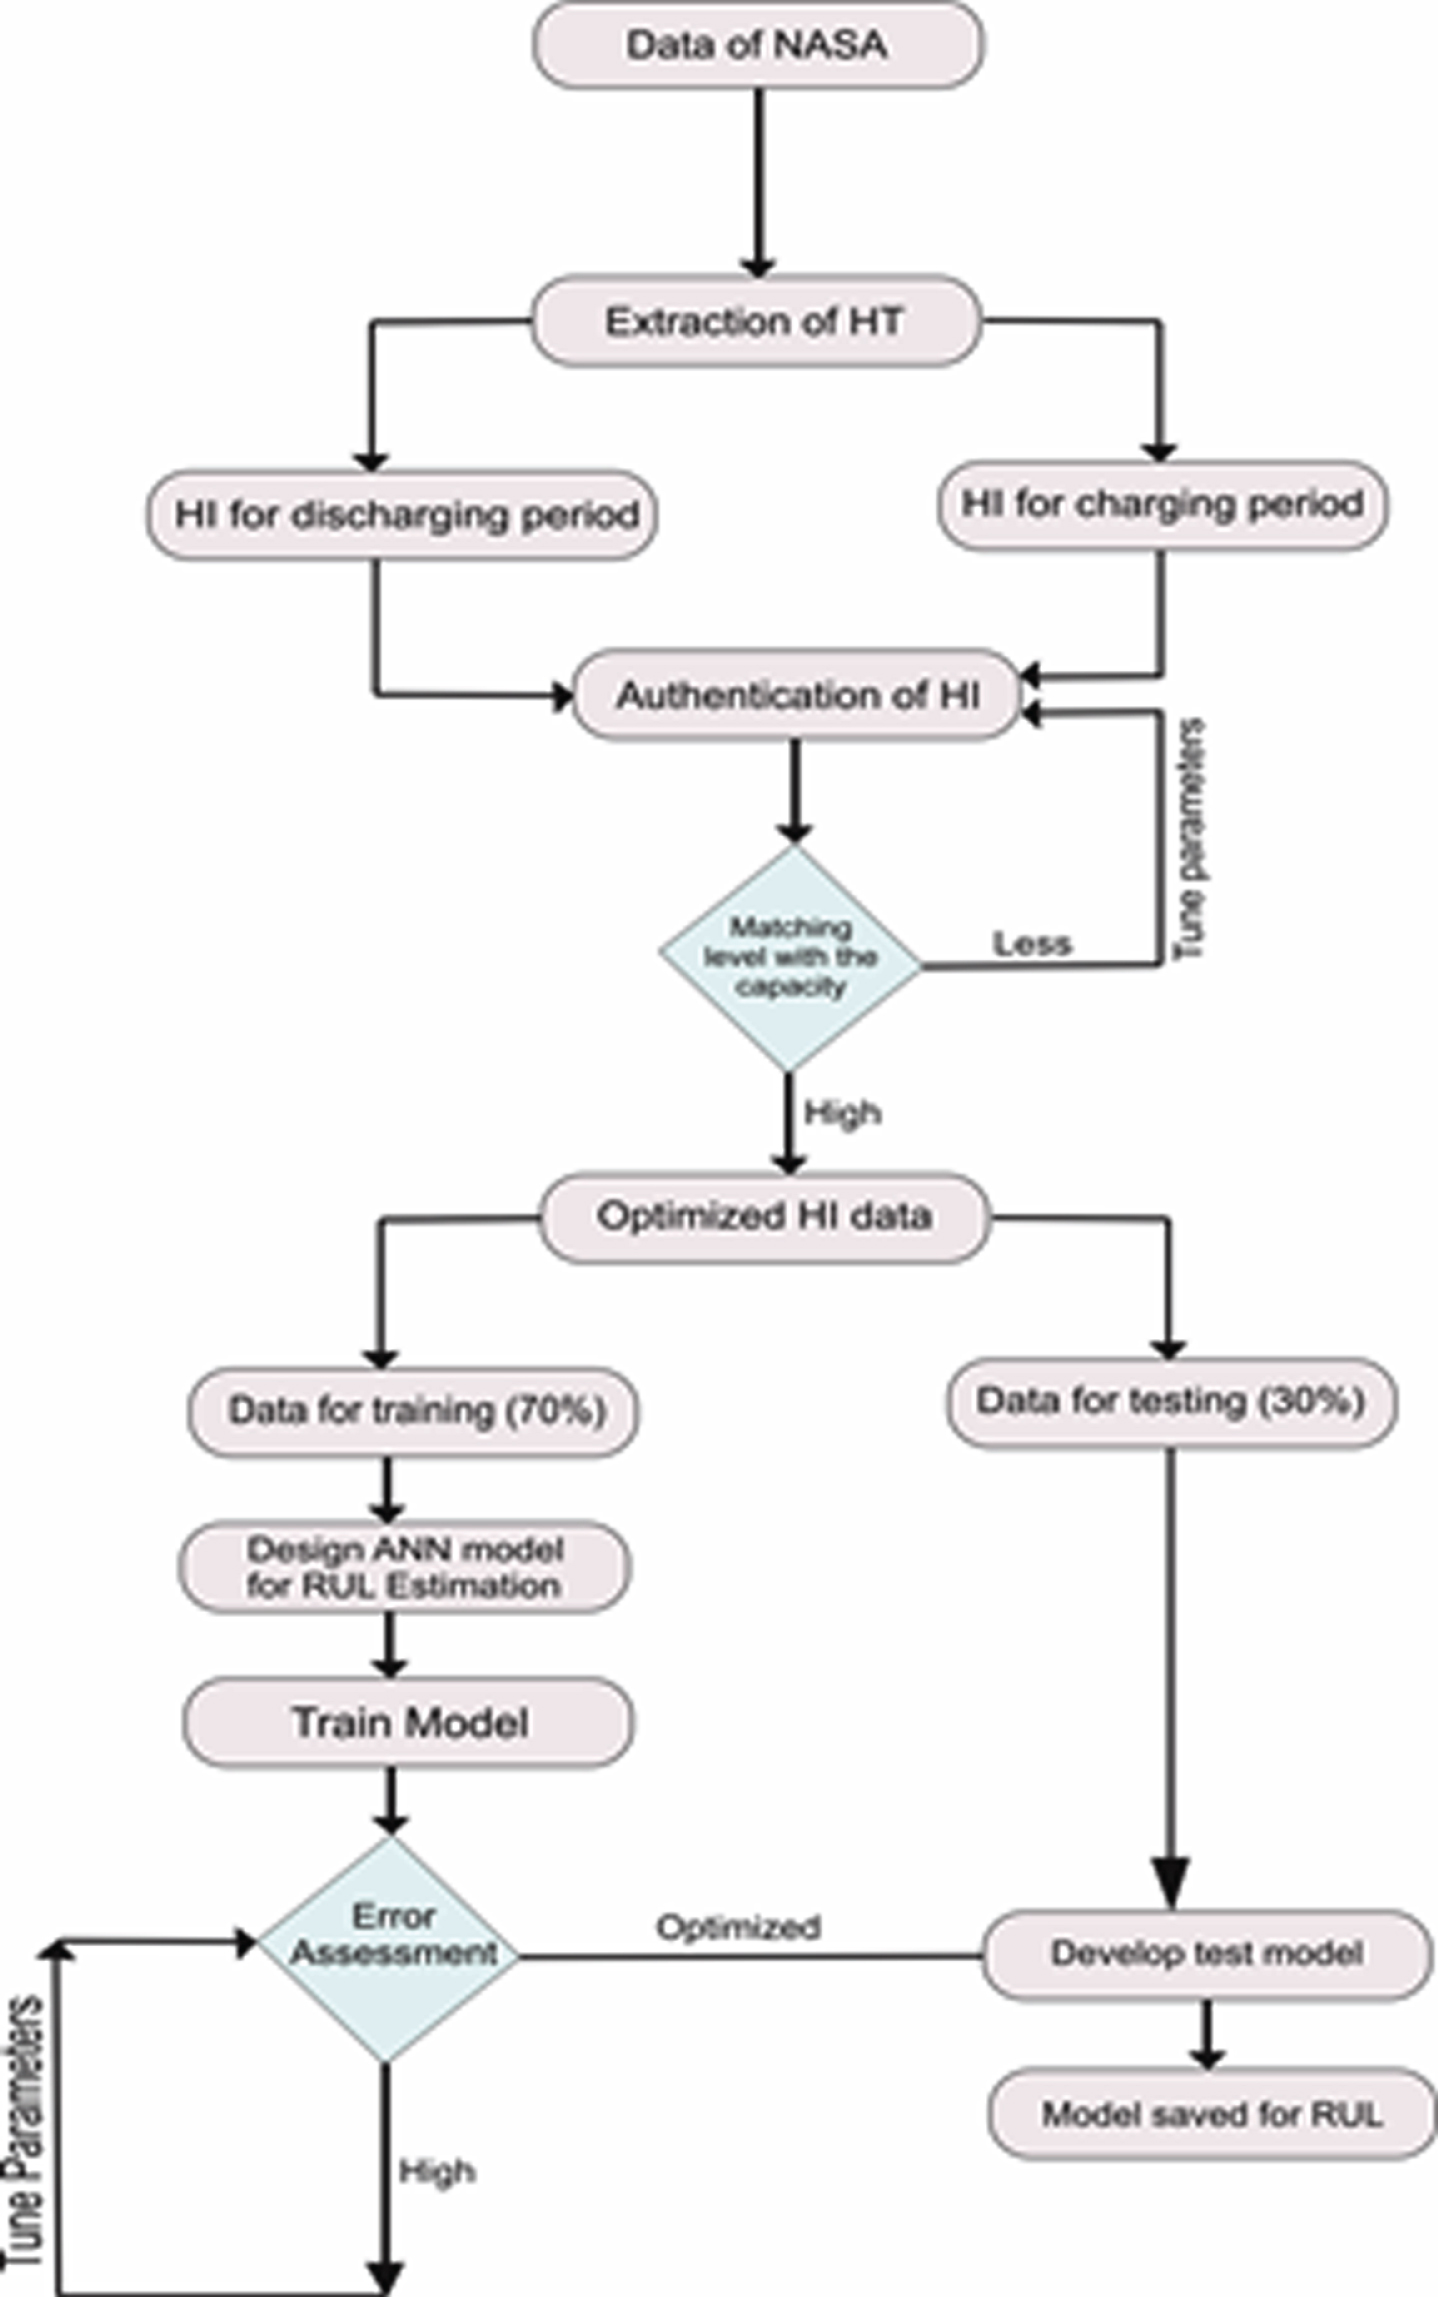
Flowchart for HI and RUL estimation.
2.1.1.1. HI Extraction. For health assessment of the batteries while on operation the parameters required for assessment should be easily availed. While battery is on line it is easy to monitor its temperature, time of operation, current and voltage for both charging and discharging duration. So for calculating HI index we need to club the data sheet for both charging and discharging condition. From the figure obtained (A.2.1.6) we can conclude that this curve is of declining in nature. The capacity of battery gets degraded as its discharging voltage decreases [7]. For charging and discharging condition the size of data set obtained is of different in size so we cannot directly use this data for calculation of HI index. This data needs to be processed for calculating the value of HI index. In order of resolving this issue for each cycle same points were chosen as sign for the battery health. It can be better understood from the equation 1 given below.
Here, T(i)DVmax=time corresponding to high voltage, T(i)DVmin=time corresponding to low voltage and i=number of cycle.
TI is calculated for total number of 168 cycles under condition of discharging and is formulated as Equation 2:
Using the above equation health index (HI) can be calculated for assessment of RUL of the battery.
2.1.1.2. HI optimization and parameter identification by Box-Cox transformation. For better correlation between vector obtained from equation 2 and the battery capacity the curve obtained needs to be enhanced. For the purpose of enhancement of the curve BOX-COX transformation (which is also a family member of power transformation) [8] is applied and the results obtained are confirmed by two methods: SCA (Spearman correlation analysis) and PCA (Pearson correlation analysis) [9].
Using BOX-COX transformation a normal distributed dataset can be transformed to a data set having approximate normal distribution.
Mathematically BOX-COX is represented by Equation 3 as:
The log in the above equation is natural value to the base e. Algorithm discussed above helps us in evaluating the value of λ using which in the above equation we can maximize the value of Log-Likelihood Function (LLF). We have used R software for implementing BOX-COX for achieving improved relation between health index and capacity of the battery. Spearman correlation analysis (SCA) and PCA (Pearson correlation analysis) are further applied for this purpose. Using PCA we can find value of linear dependence represented as: (r). The range of linear relationship between capacity of battery and TI changes in the range from +1 to –1 and significant of the range is given as:
r=1: Linearly Positive
r=0: no linear
r=–1: Linearly Negative
Where Pearson correlation coefficient (r) is represented as:
Here,
If one function is monotonic with respect to the other then range of SCA Spearman correlation analysis lies in between +1 or –1.
2.1.1.3. Performance Evaluating. Root mean squared (0 ⩽ % RMSE ⩽ 0.5) and degree of fitness (0 ⩽ R2 ⩽ 1). Equation 5 and Equation 6 mentioned below are used for calculating these two parameters.
2.2.2.1. RUL Prediction. For forecasting maintenance plan of a battery it is necessary to know its RUL. It is the time period of a battery in which it operates in a healthy manner where no restoration or replacement of the equipment in which it is used is required. Therefore if RUL is know one can plan the maintenance of the equipment in advance.
In general practice the RUL is estimated by model or data driven method. General data driven methods are similarity, survival and degradation model. Whereas data driven methods depends on parameters like: lifespan, failure histories and verge value of precise condition [10]. For performing this study battery 5 is used and 3 data type is used to investigation. The result of the study is shown clearly below in the Fig. 2.
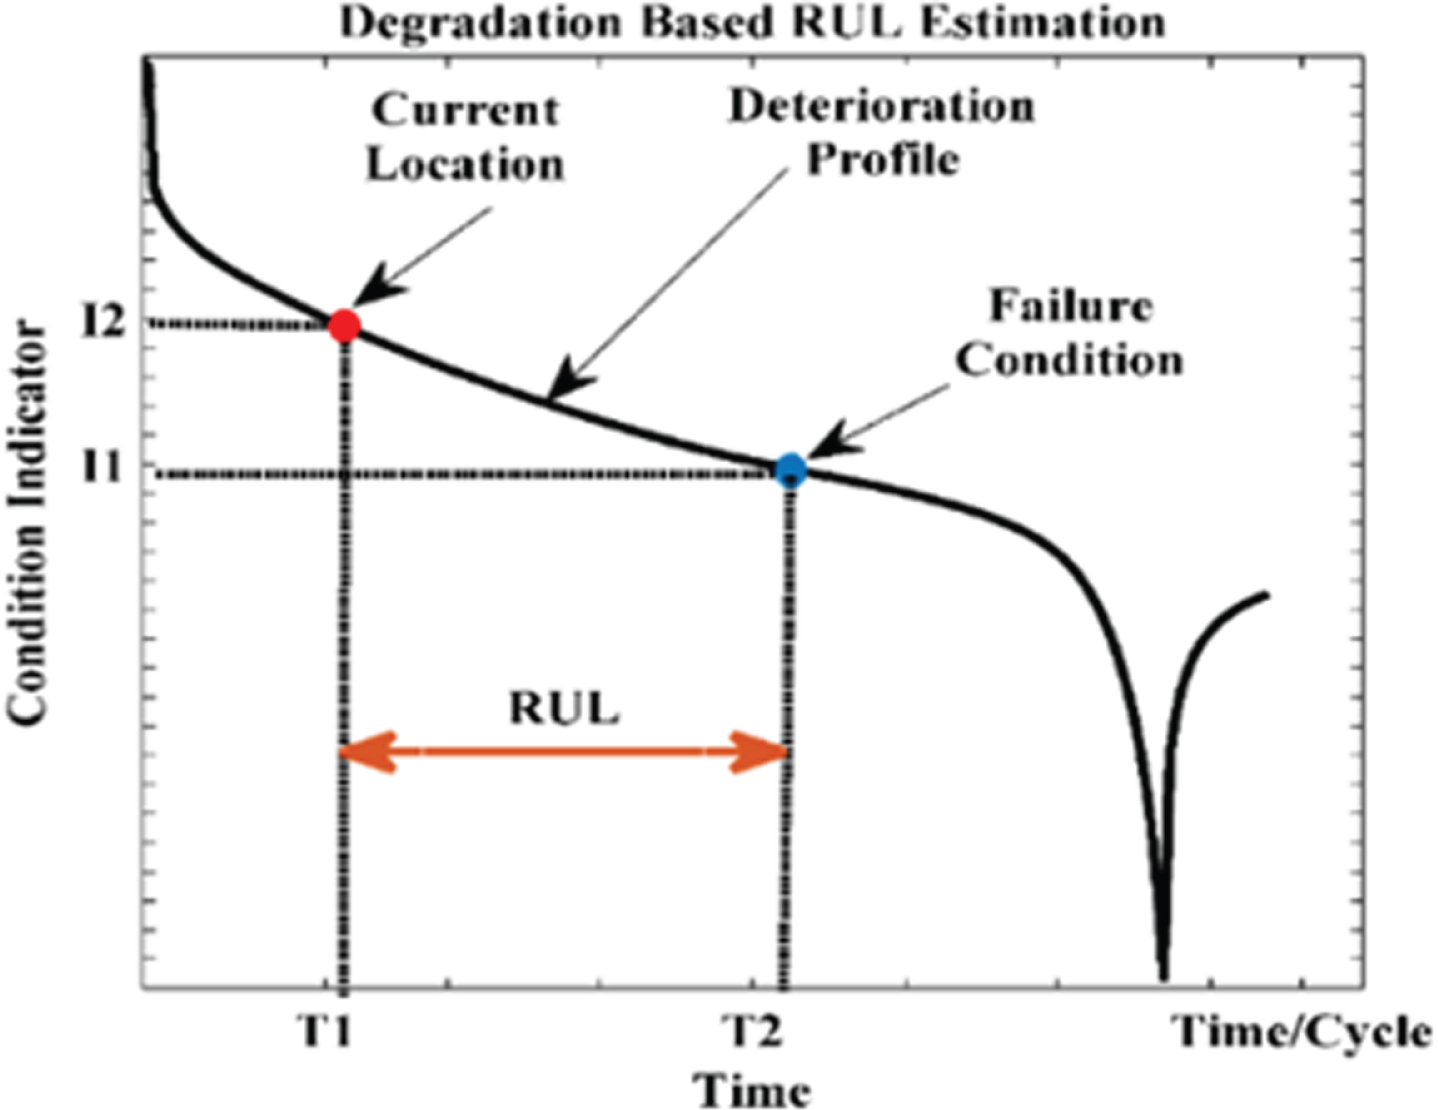
RUL assessment based on degradation.
2.2.2.2. ANN Modeling for RUL Estimation. As per the mathematical Equations 7 to 13 an ANN model having one hidden layer is designed. The weights are being defined as
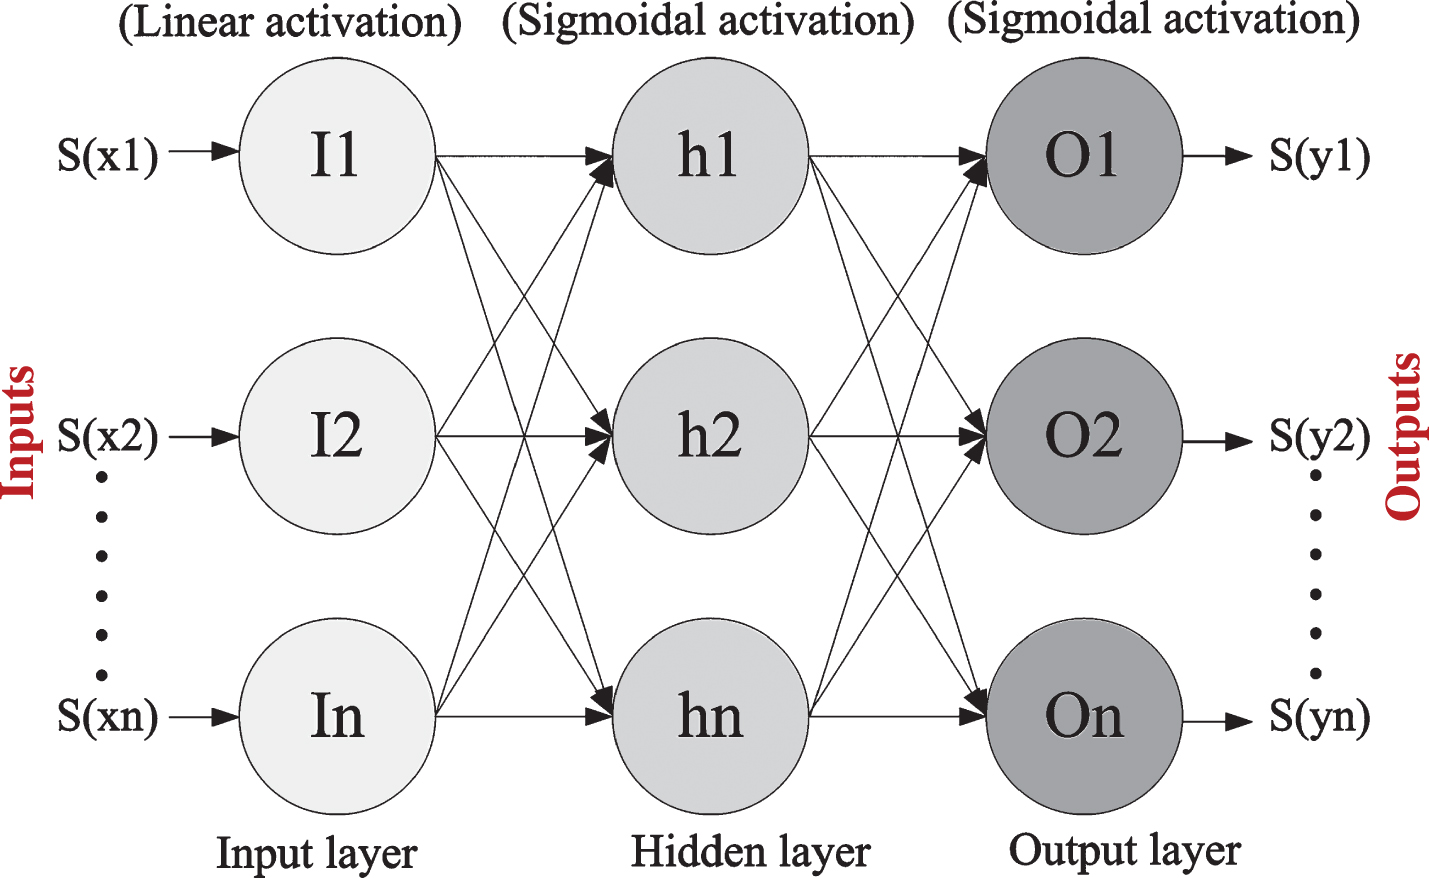
ANN Model for RUL Calculation [11].
For the Input Layer: ith neuron computation is given as:
For the hidden Layer: hth neuron computation is given as:
For the output Layer: The computation at the jth neuron is:
2.2.2.3. Analysis of RUL Performance. Based on the discharging date set values for battery 5 HI index is calculated. And for this value of dataset ANN-RUL model is formulated. Performance of this model is evaluated on the basis following errors: Absolute; Mean; Percent; Relative; and Normalized. Expression for every error is defined below from Equations below:
Abstraction and optimization of health index
HI Abstraction
It has been mentioned under section 2.2.1.1 that HI should be the variable that can be found out easily. For the purpose of this research TI Raw has been checked out in reference to Equation 1 and formulated in a distinct series as per Equation 2. The series that was obtained for TI Raw has been plotted for the 4 batteries that have been showcased in Fig. 4, the same has been compared with battery that has been shown in Fig. 5. Comparing both Fig. 4 & 5 it can be concluded that both curves have similarity. In order to validate the findings scatter plot in Fig. 6 shows close linear relationship between HI that has been extracted and the real capacity of battery. However there is further.
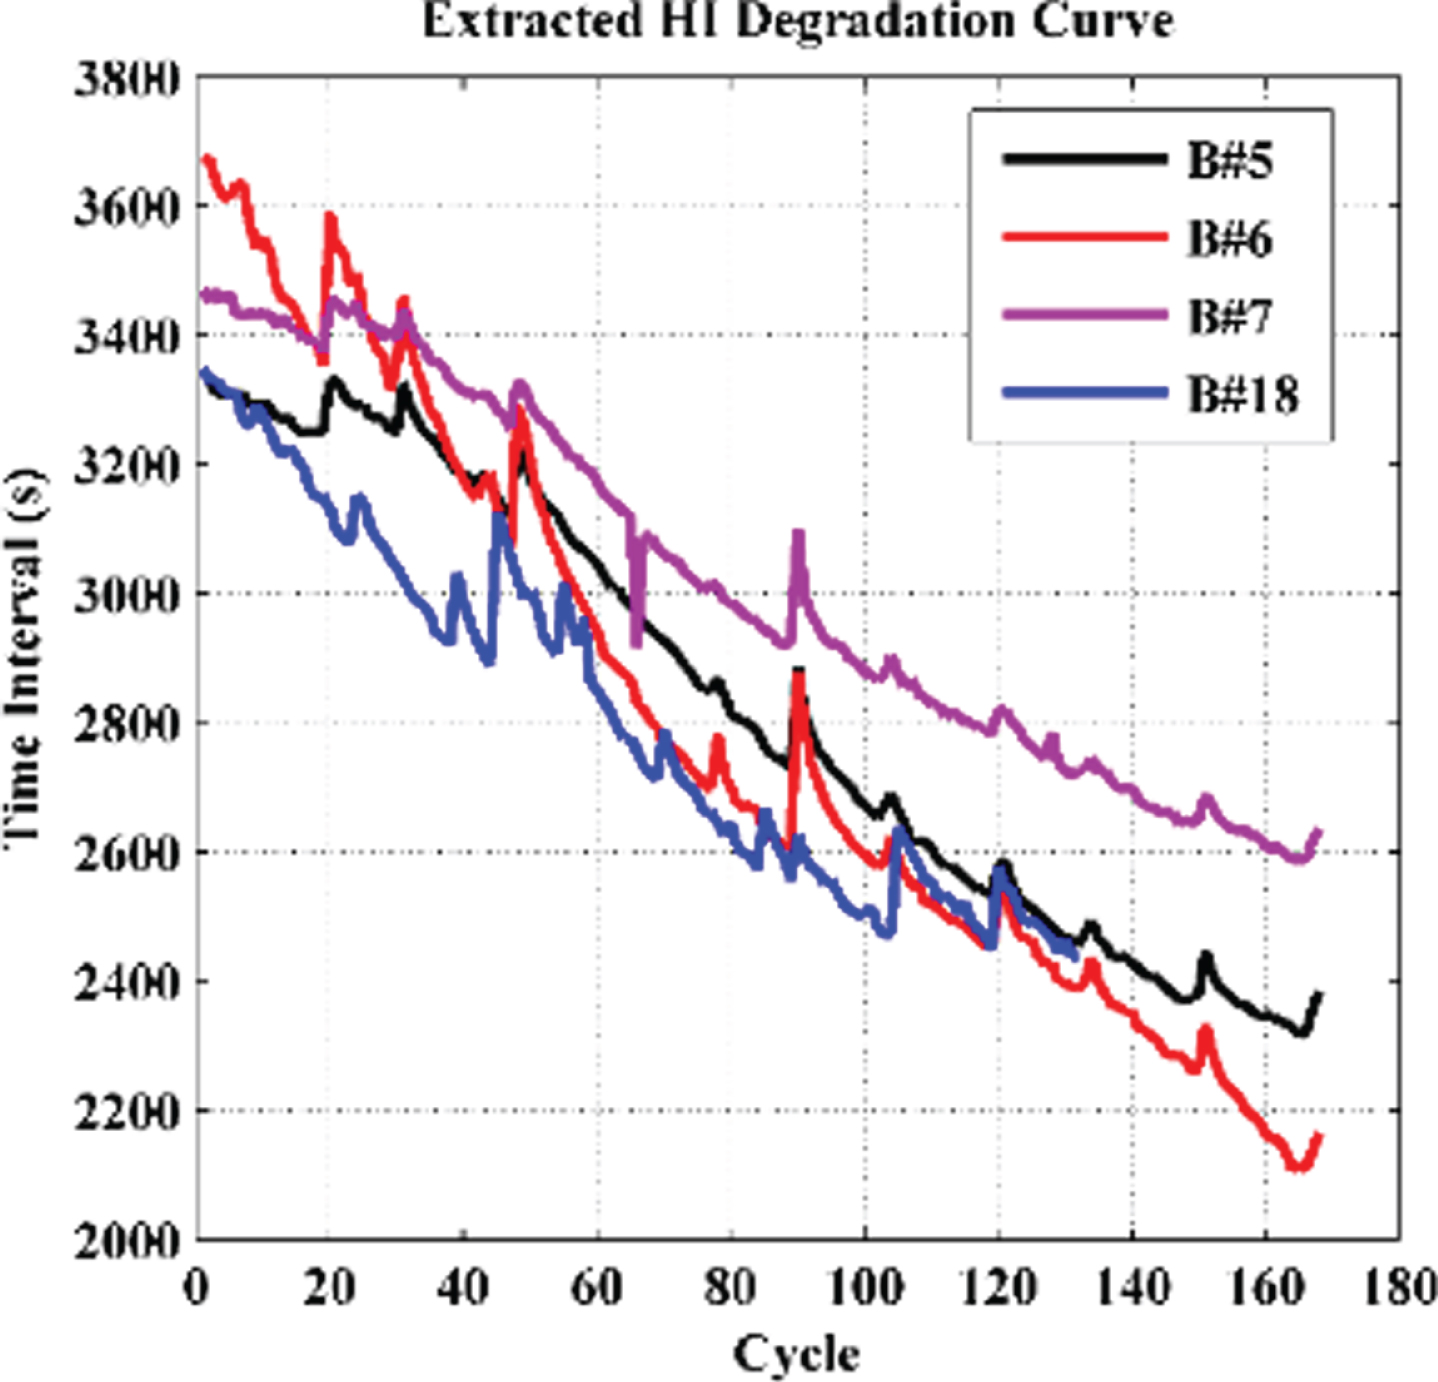
Extracted HI degradation curve.

Actual battery capacity curve.
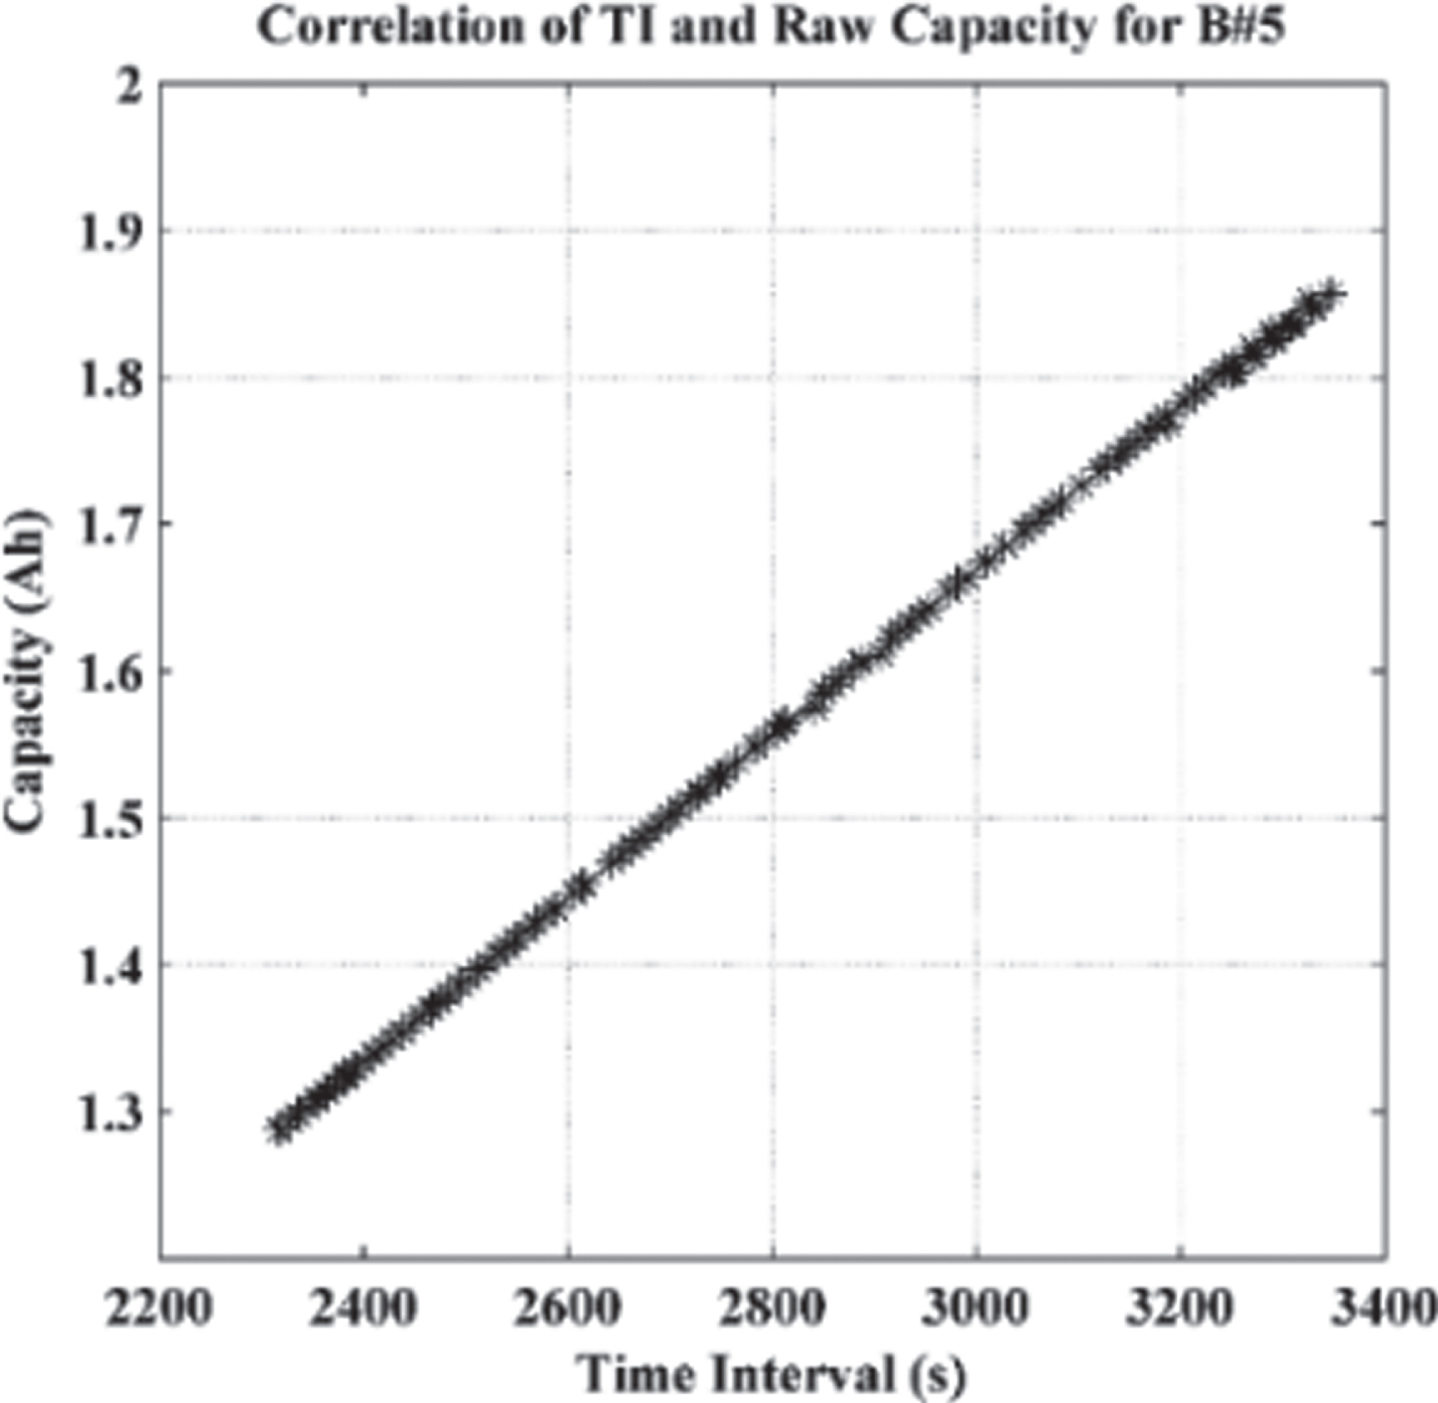
Scatter Plot between Extracted HI and Actual Capacity of Battery.
For the purpose of improving linearity between extracted TI Raw and real capacity of the battery (Ah),R software is used for applying BC transformation for the purpose of fining out the optimum value of λ. Here Lambda varies from a range of +5 to –5 through one stepping and log- likelihood has been plotted with a confidence interval of 95% as has been showcased in Fig. 7, the same has led to the conclusion that lambda=1.1248 has high performance. Thereafter distribute plot is replicated between optimal transformed HI and the actual performance of battery as displayed in Fig. 8, a better linear relationship has also been showcased in Fig. 6.
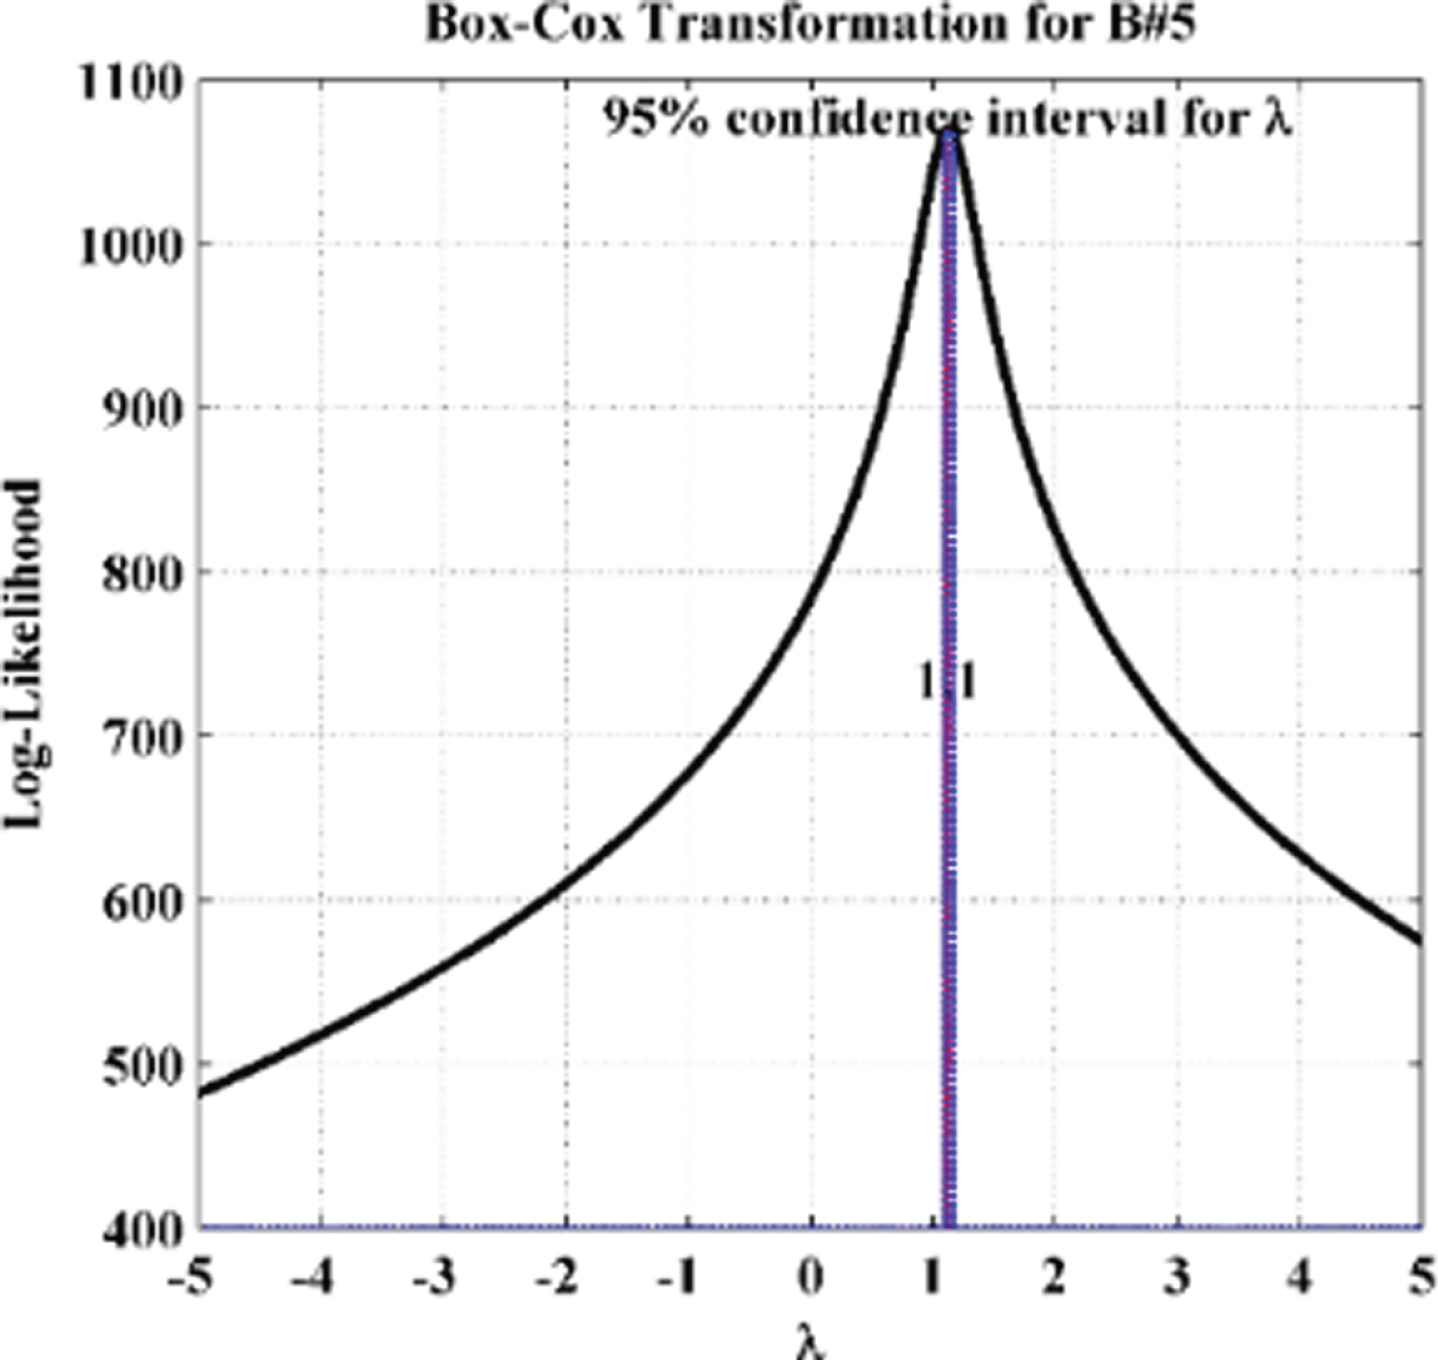
BC transformation for B#5.
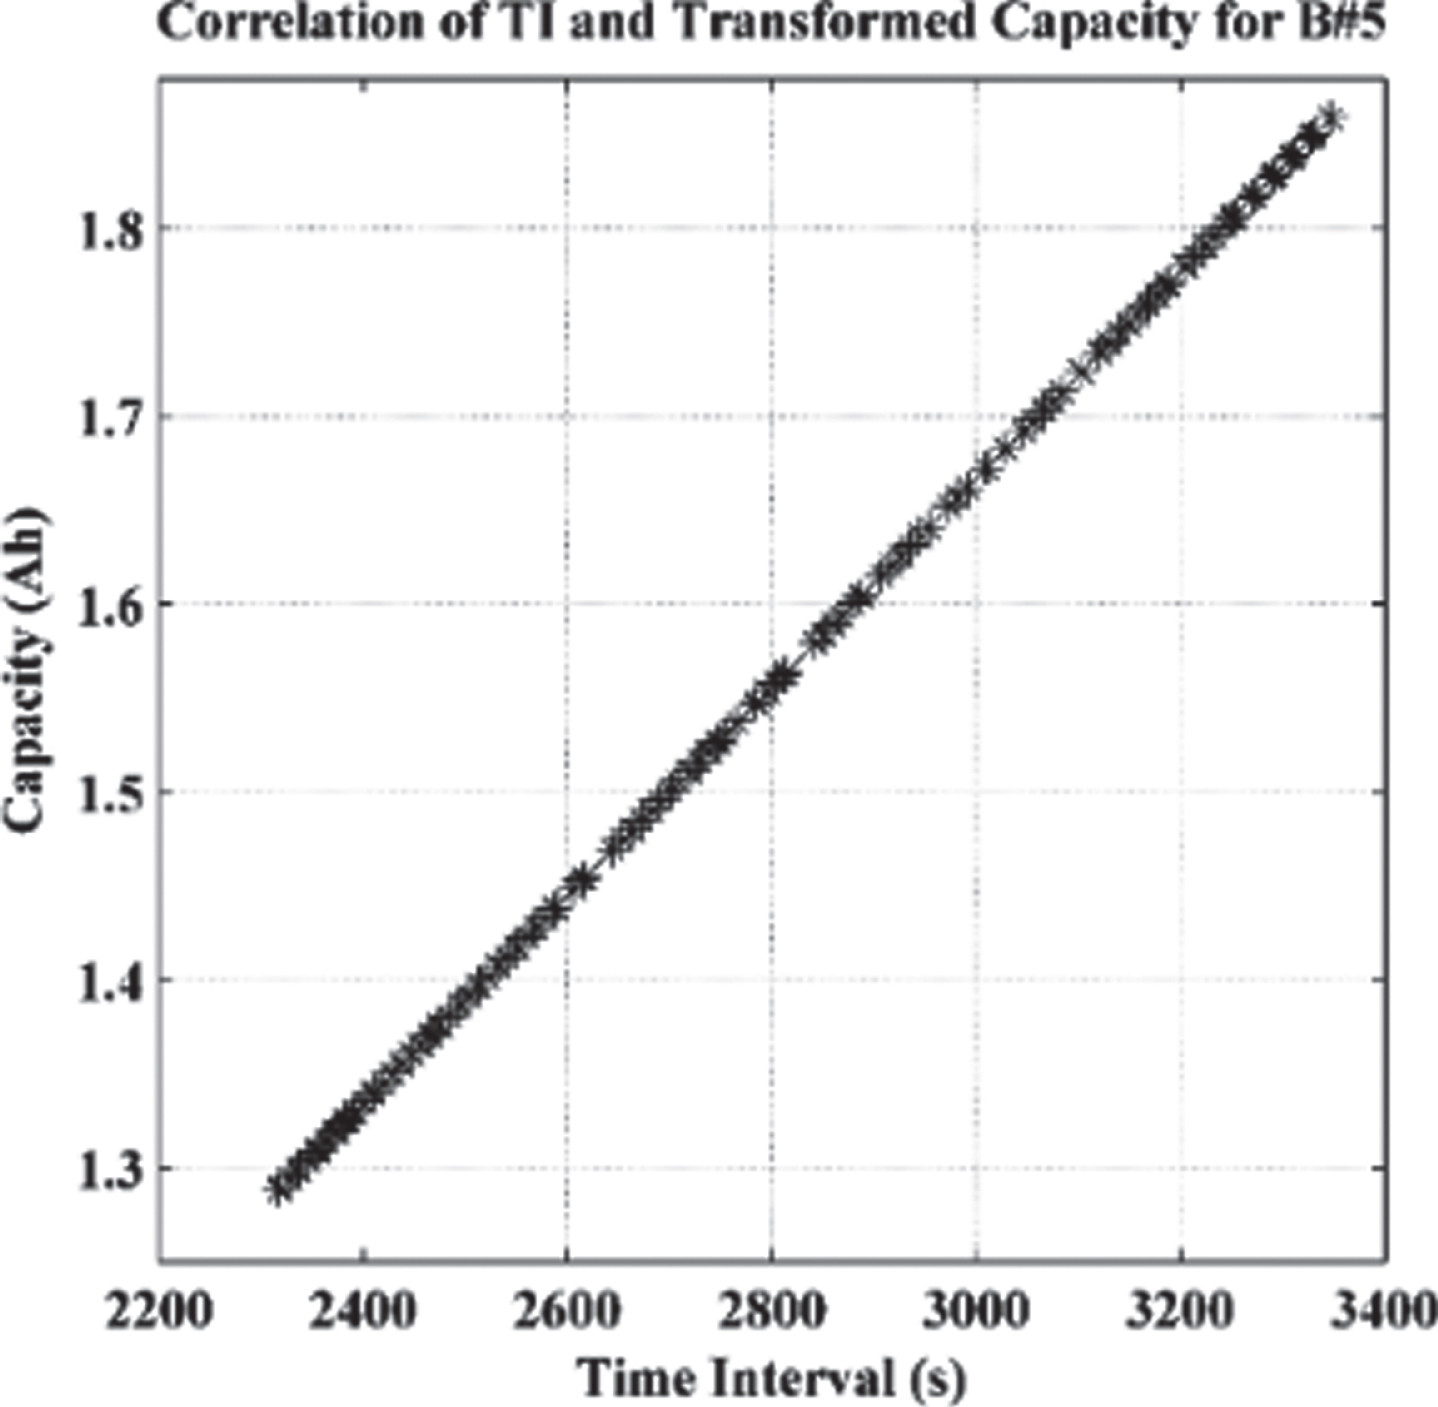
Correlation of TI and transformed Capacity.
In order to analyze substantial enhancement in transformed HI using the transformation of BC, SCA and PCA is found out and obtained results are tabulated and showcased in Table 1. Also in order to represent the cogency of results as showcased in Table 1, the PCA constant is evaluated for variation in lambda from +5 to –5 and the results of the same has been represented graphically in Fig. 9. Also from Fig. 9 it can be determined that PCA coefficient is greater at lambda=1.1248 which has led to confirmation of reliability of likelihood method. The highest PCA coefficient achieved in this analysis is 0.9999 which is nearer to 1, the same shows robust linear relationship between HI (health index) & Ah (Ampere Hours). Also SCA signifies relationship between converted HI & Ah that HI is canonical enough to replace Ah for finding out the degradation happened in battery. In order to verify the same further the association matrix between HI & Ah is showcased in Figure A.3.1.3.1 & Figure A.3.1.3.2 for before and after BC transformation.
Computable Correlation Illustration of BC Transformation
Computable Correlation Illustration of BC Transformation

PCA correlation coeffiecient with λ variation.
Once all authentication and computation is done the results are represented in Figure A.3.1.4.1. The results are represented for the battery 5, 6,7 and 18. Table 2 represents all the parameter for which performance of HI evaluated. All the evaluation is done for ideal value of lamda which was obtained by BC transformation. We concluded form Table 2 that for every batteries taken for the study it was found that R2 is very near to 1, which clearly indicates that capacity can compute the actual value Ah. Thus we can imitate degradation in real time using HI extraction.
Performance Evaluation of HI
Performance Evaluation of HI
Case Study#2: ANN-RUL model performance evaluation for B#5
Once the extracted HI is extracted ANN model is formed for calculation of RUL using the dataset collected from NASA. The entire process of evaluation of RUL is divided in to three cases. Each case is having its own importance and is explained below:
Case#1: In this case RUL is calculated for raw value of HI as its input and the output was the capacity of the battery. The purpose of carrying study of this case is to authenticate HI extracted data with the capacity of battery.
Case#2: In this case RUL is calculated by taking RAW data of HI as input and RUL evaluation from raw HI as input and modified HI data as output of the model.
Case#3: In this Case RUL is calculated for modified HI as input to the model and capacity of the battery as output to the model. Purpose of this study is to assess the resemblance of this evaluation from transformed HI as input and battery capacity as output to the model. This study is carried out to evaluate the resemblance of the mined HI framework while calculating RUL.
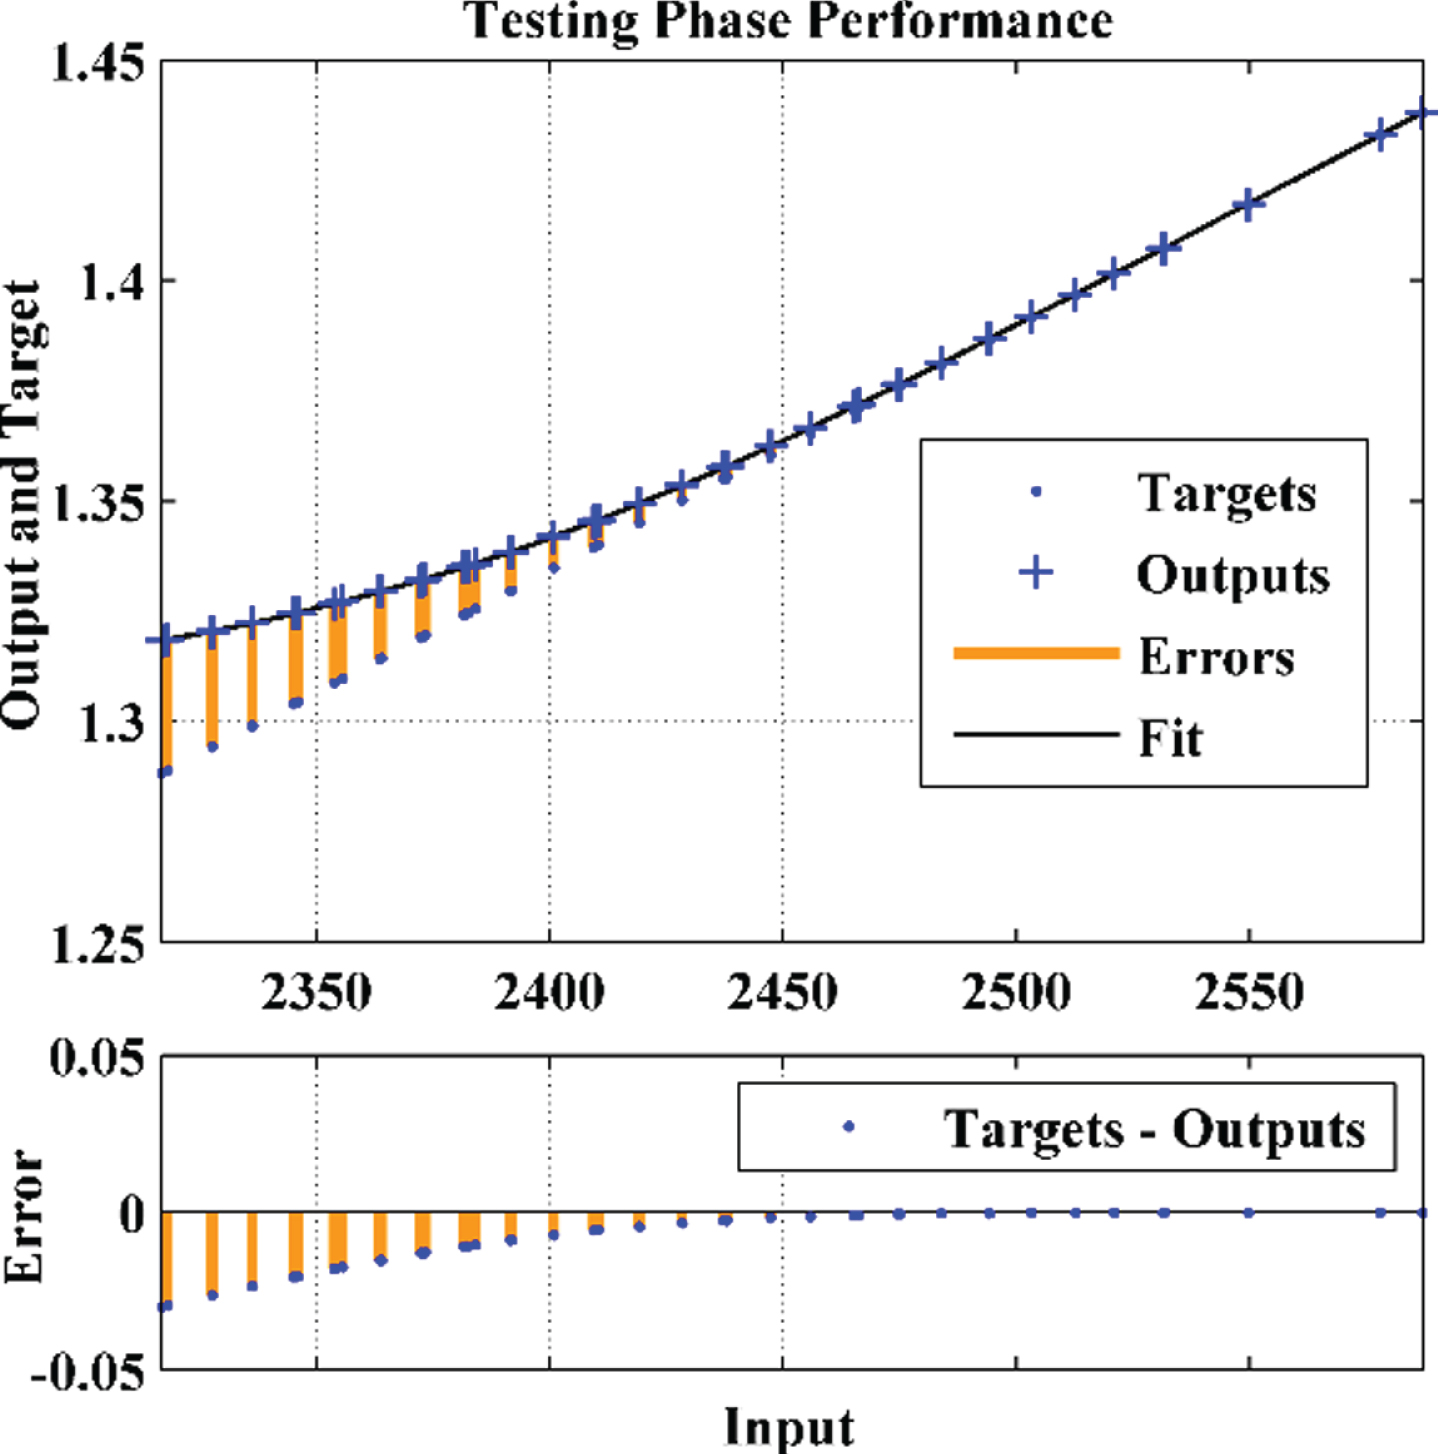
For all the three cases different ANN-RUL models are designed and were tested after good testing and exposure. Finally RUL was evaluated for all the cases beginning from cycles 20,42,122,198 and 274. All the cycles included in the studies are for battery number 5. For case 2 MATLAB results in the form of graphs drawn below: Figure 10 is the regression plot; Fig. 11 is the plot representing performance. Whereas for case 1 and 3, Fig. 12 represents the performance curve.
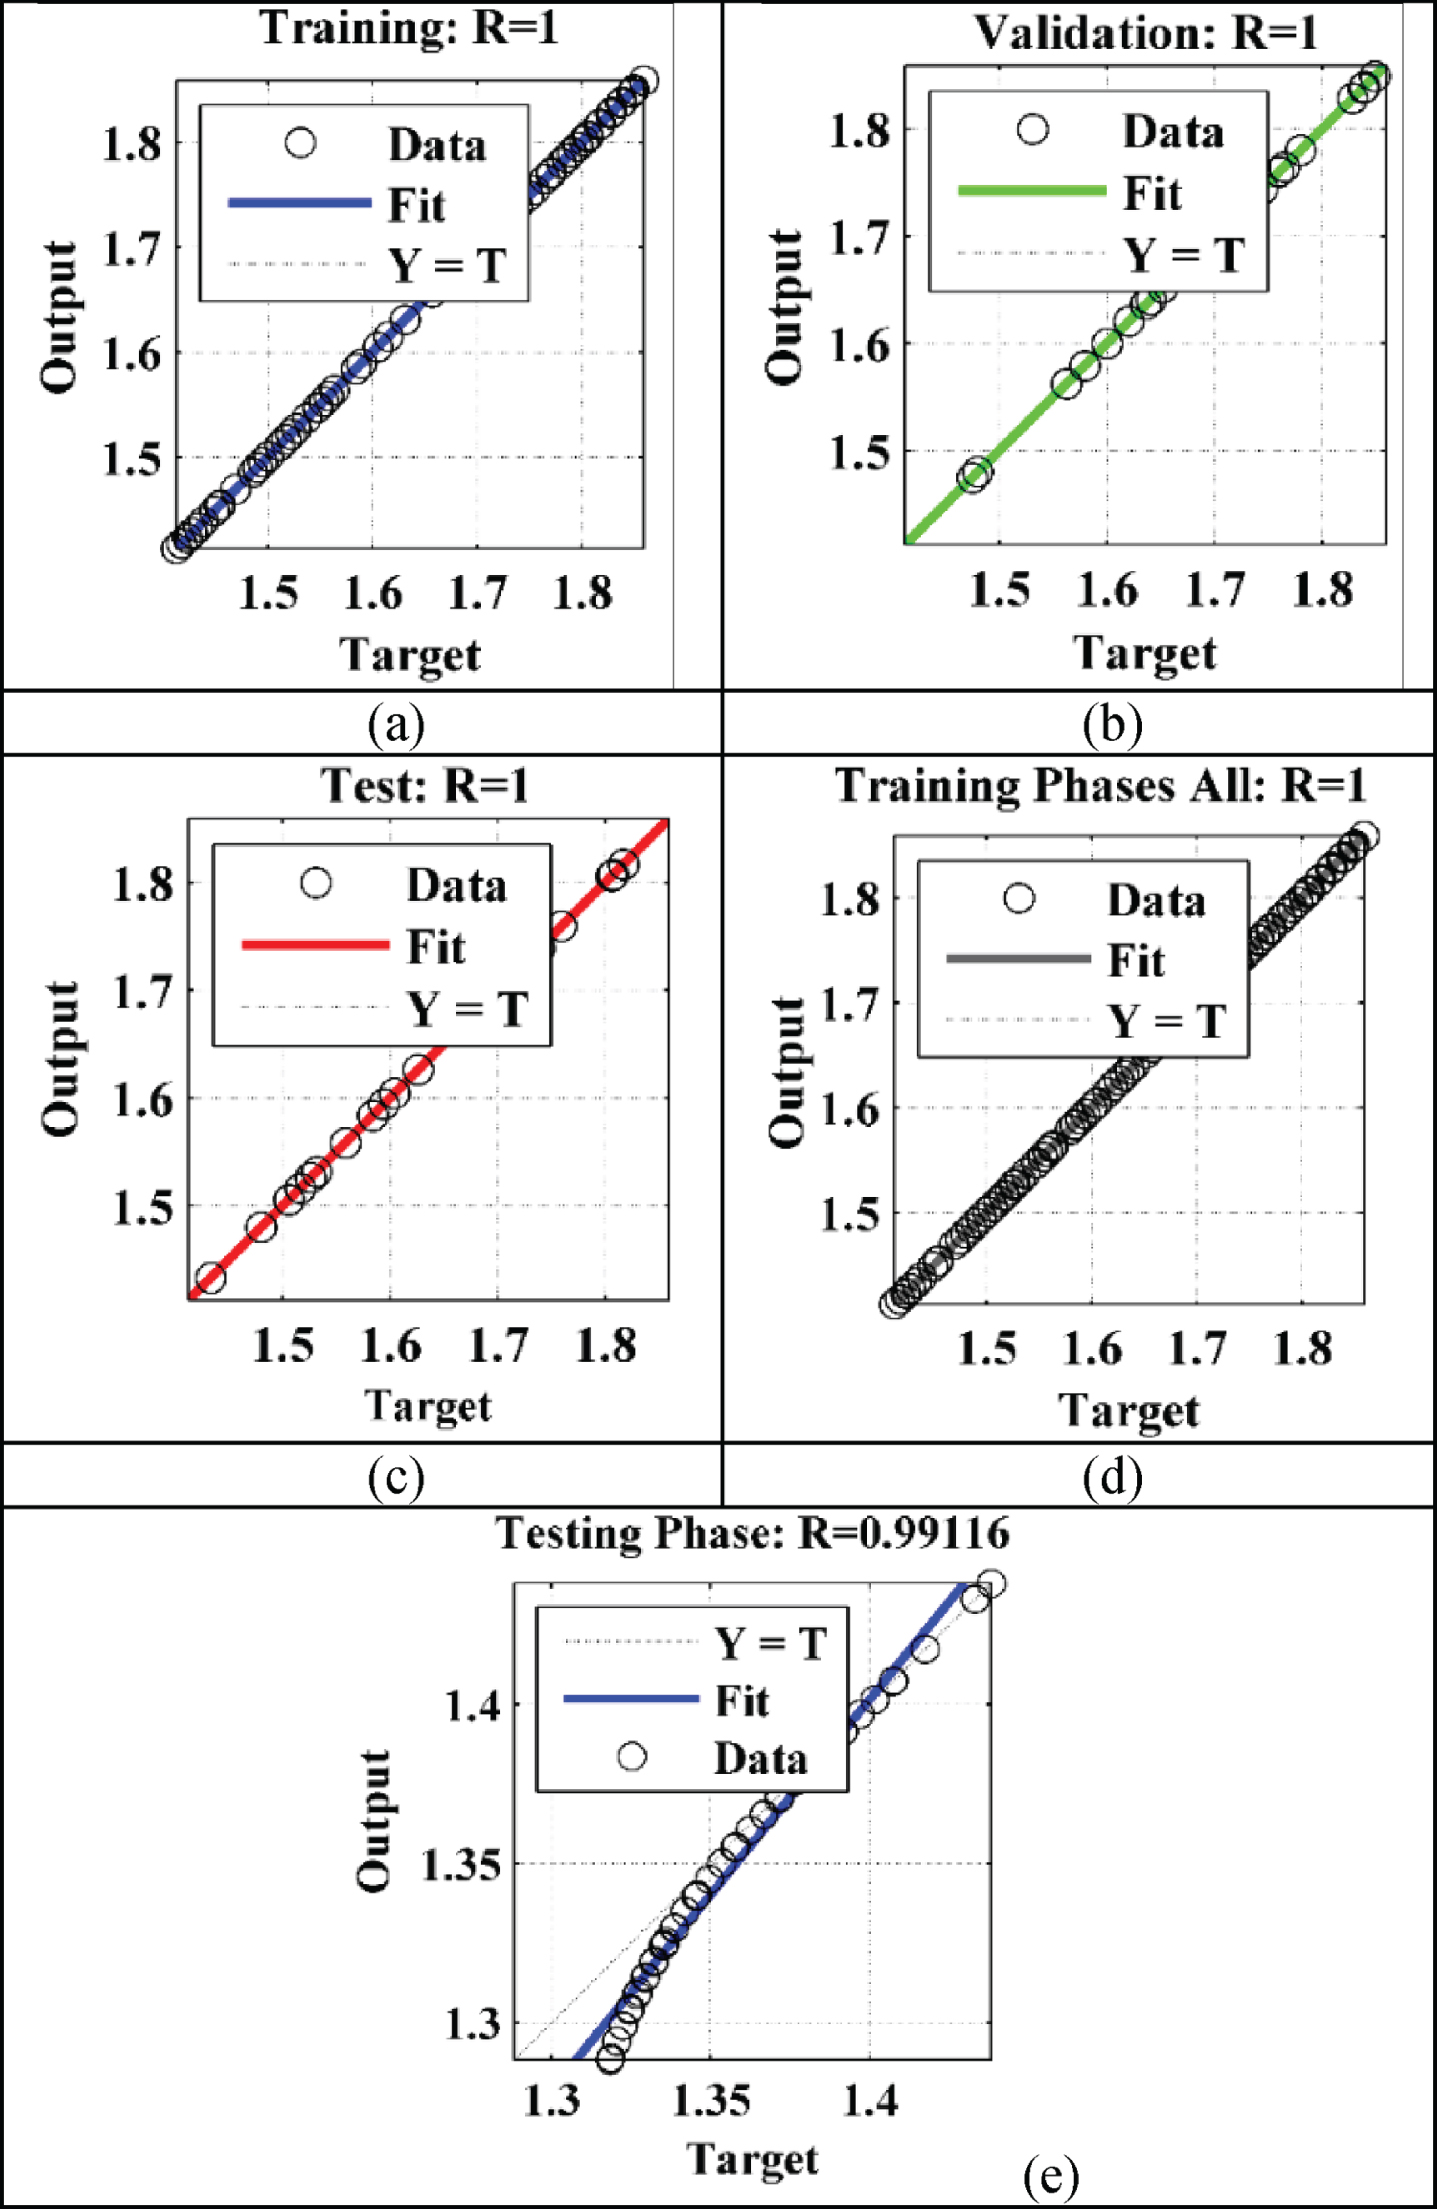
Case Study#2 plot representation for (a)-(d) From Left to right Training stage R and (e) Testing Stage R.
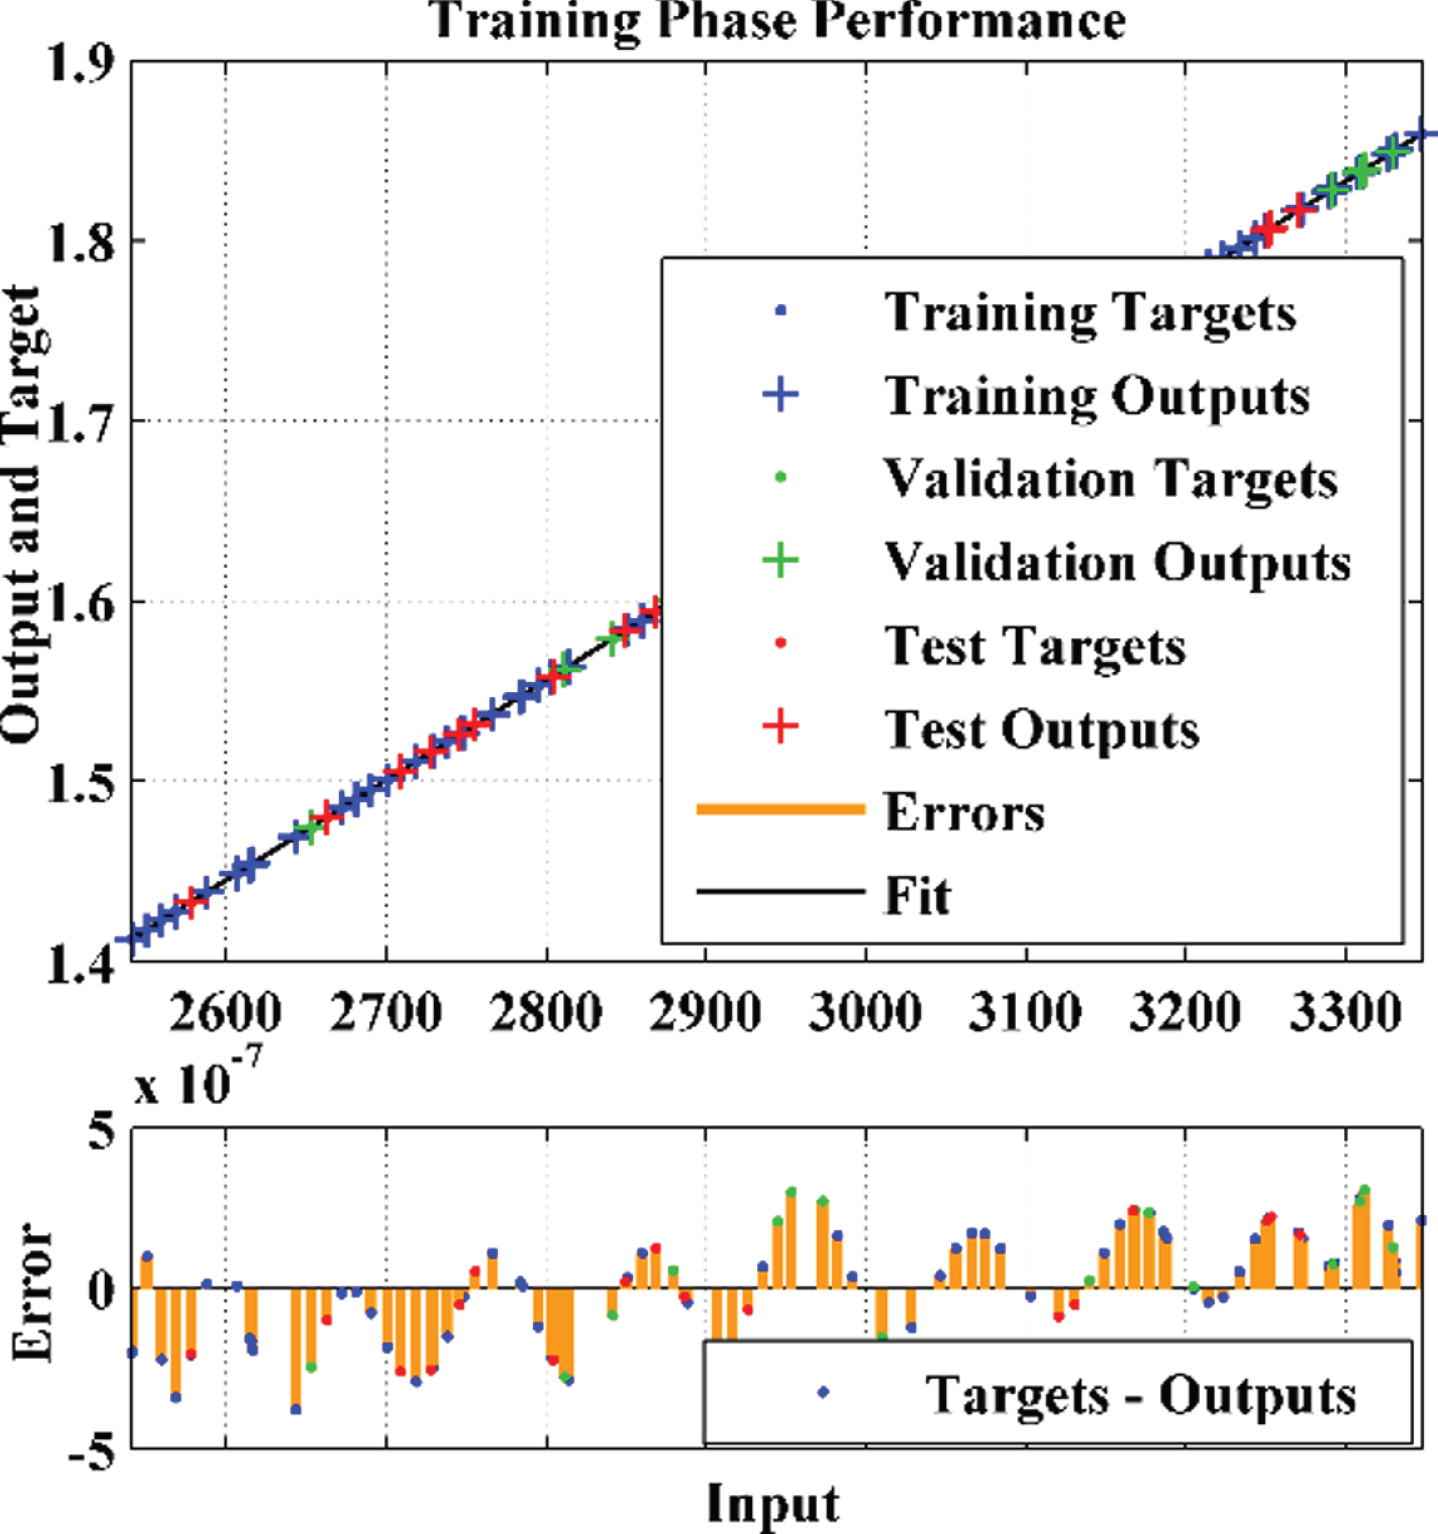
Case Study#2 ANN-RUL Model Performance during training.
Case study#2 ANN-RUL model performance during training phase.
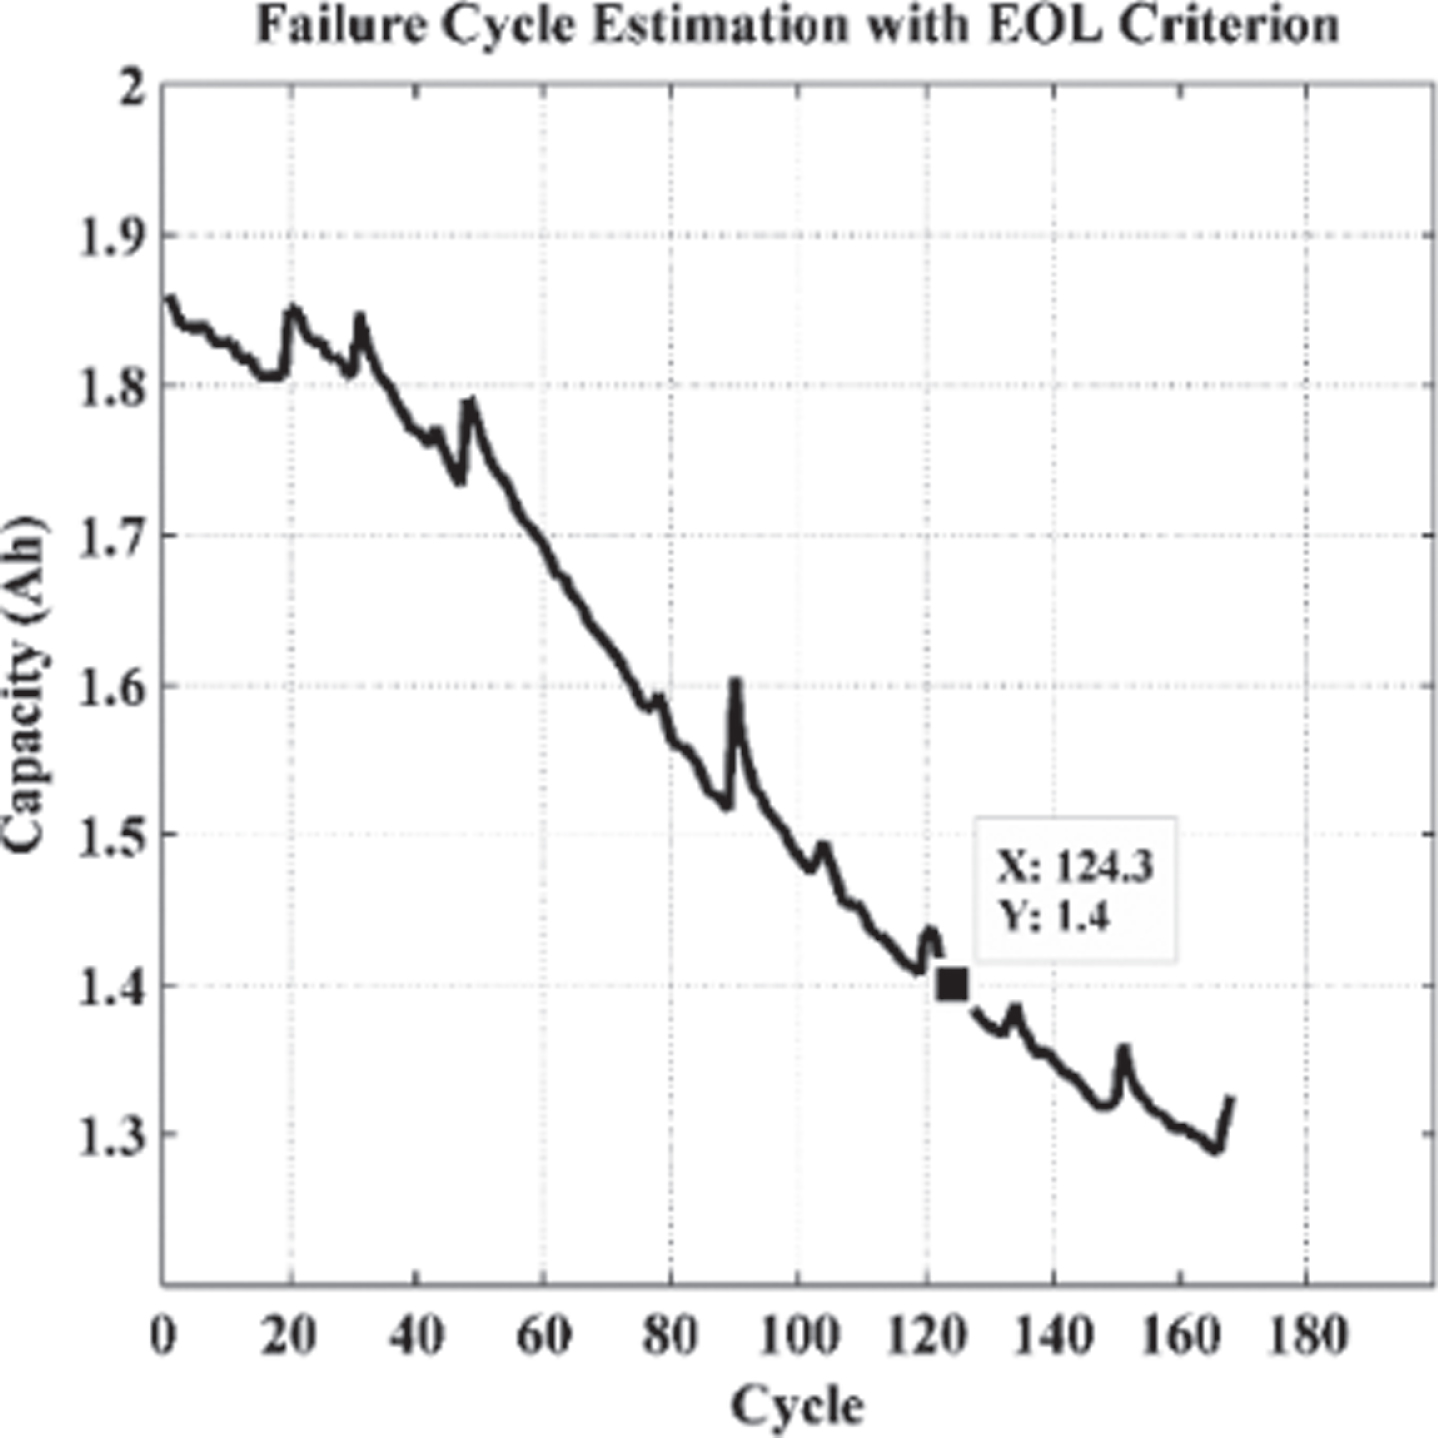
Failure cycle approximation with EOL standard.

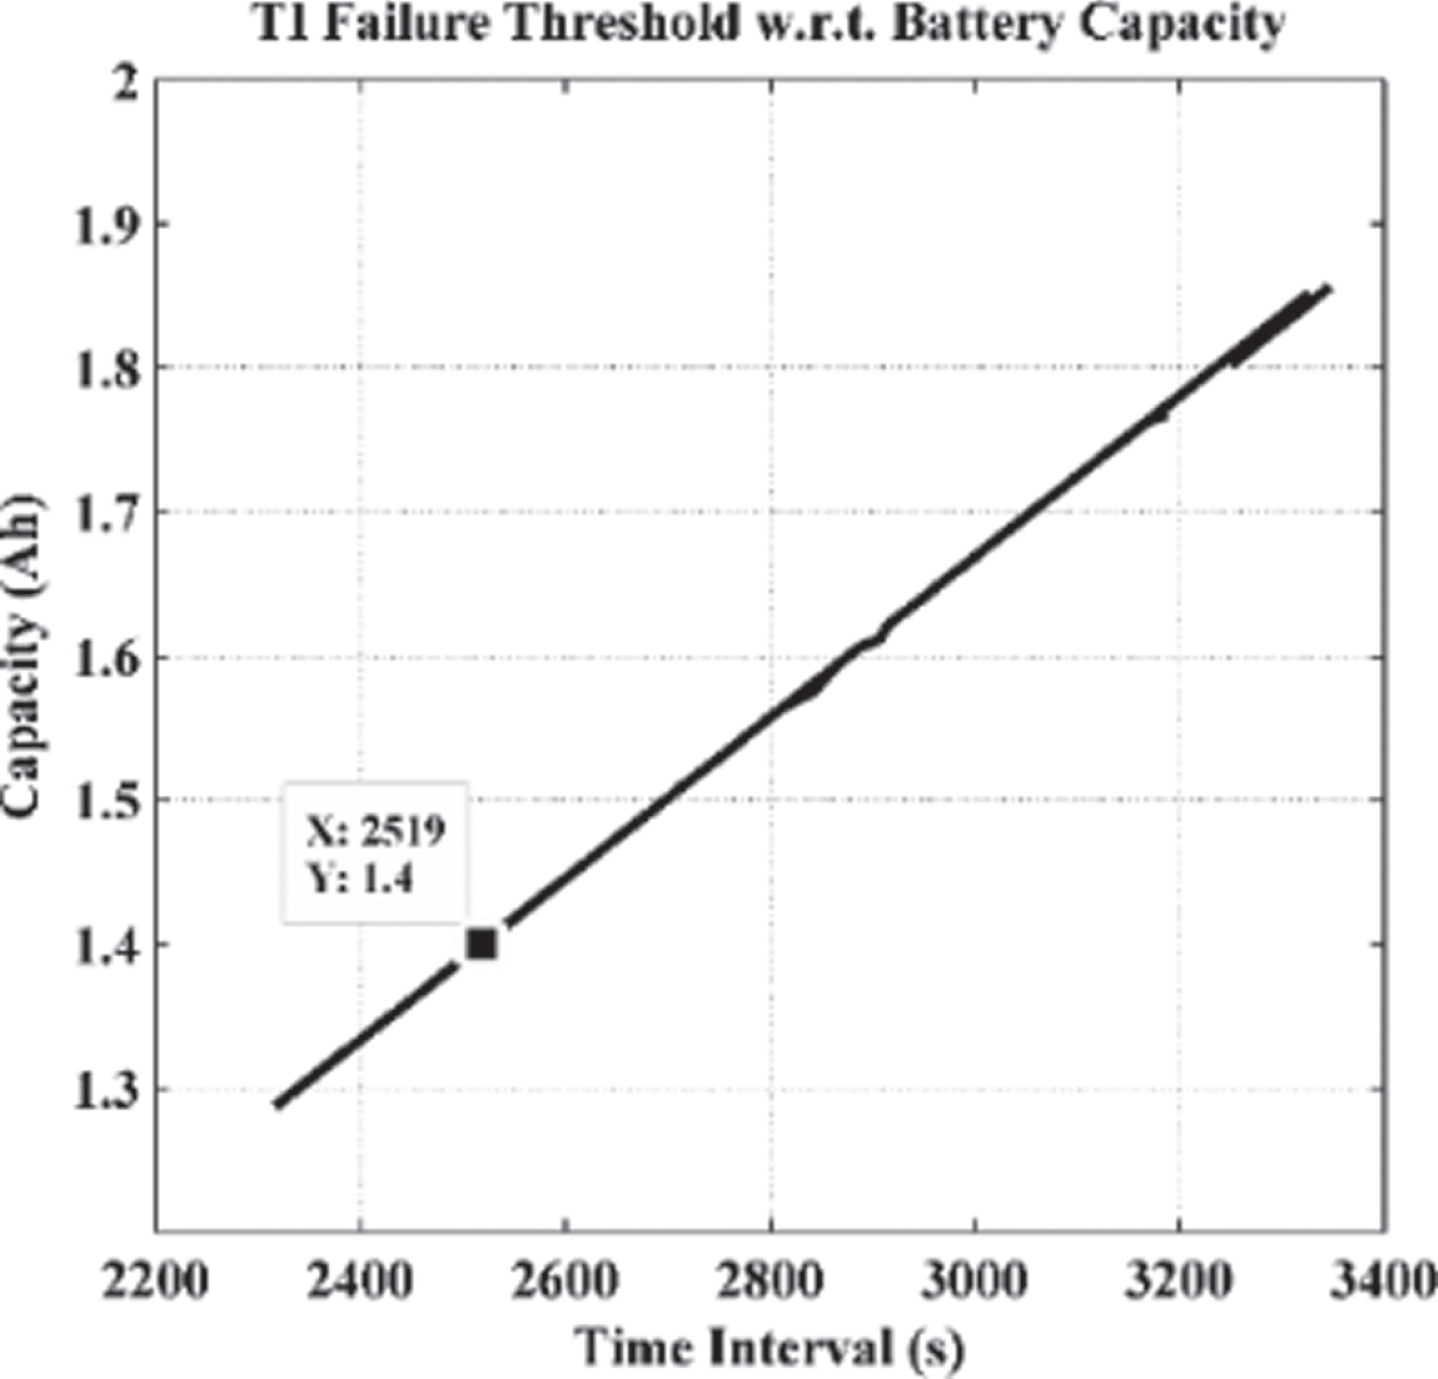
Estimation of failure cycle and threshold time.
Failure cycle approximation with EOL standard.

Predictable RUL representation.
This paper proposes a new HI formation and change approach for Li-ion battery health check-up. The same has been done with the help of transformation of power method also called as Box- Cox transformation; HI is formulated and optimized in order to increase the linear relationship between HI that has been extracted and the capacity of actual battery. R2 values which were found out to be near 1 have thereafter been liberalized by two different ways. Also ANN method has been used to find out indirect RUL evaluation with raw that has been extracted, increased and changed into HI. The result that has been found out in every case satisfies the effectiveness of the approach that has been used to conduct the research. From a future point of view the same approach will enhance other HI variables. Also the selection of one of the most important relevant input variables for RUL assessment needs to be further checked.