
Abstract
This paper proposed a hybrid intelligent approach based on empirical mode decomposition (EMD), autoregressive integrated moving average (ARIMA) and Monte Carlo simulation (MCS) methods for multi-step ahead medical tourism (MT) forecasting using explanatory input variables based on two decade real-time recorded database. In the proposed hybrid model, these variables are 1st extracted then medical tourism is forecasted to perform the long term as well as the short term goal and planning in the nation. The multi-step ahead medical tourism is forecasted recursively, by utilizing the 1st forecasted value as the input variable to generate the next forecasting value and this procedure is continued till third step ahead forecasted value. The proposed approach is firstly tested and validated by using international tourism arrival (ITA) dataset then proposed approach is implemented for forecasting of medical tourism arrival in nation. In order to validate the performance and accuracy of the proposed hybrid model, a comparative analysis is performed by using Monte Carlo method and the results are compared. Obtained results show that the proposed hybrid forecasting approach for medical tourism has outperforming characteristics.
Keywords
Introduction
In this 21st century World economy is growing in different ways where goods and services are being exchanged and the patients are travelling from one country to other country to get cost effective and high tech medical care. For this reason, it appears interesting to inquire into the components of customer-perceived value in the context of medical tourism. Generally, medical tourism is the practice of travelling to another country with the purpose of obtaining health care, including elective surgery, dental treatment, reproductive treatment, organ transplant and medical check-ups. It is not the same as “wellness tourism”, which involves visiting spas and undertaking homeopathic treatment and traditional therapies. There are several needs for medical tourism such as: 1) lack of availability of a particular facility in the home country, 2) health care in the home country too expensive, 3) health need or procedure not covered by health insurance in the home country, 4) desire to avoid long waiting in the hospitals, 6) privacy and confidentiality in a far off setting (for e.g. plastic or cosmetic surgery, fertility treatment, gender assignment procedures and drug rehabilitation), 7) lack of availability of a specific diagnostic manoeuvre in the home country, regardless of whether treatment is required; combining tourism with an elective procedure (e.g. in Israel, people can have medical treatment and also visit some of the holiest places in the world), 8) annual or routine medical check-up for healthy people, and 9) screening for specific diseases in cases of a family history [1].
The private sector is primarily responsible for the growth of the healthcare tourism. Although hospitals and intermediaries such as specialized travel organizations through their various marketing strategies have played a major role in promoting healthcare tourism, governments in South Asia, South-East and East Asia are increasingly contributing to the development of this industry. Hence, Asia emerges as the most potential medical tourism leaders in the world which may focus a forecasted USD 54.4 billion (in 2020) and USD 207.9 billion (in 2027) healthcare tourists travel industry from all over the world [2]. South Asian countries like Thailand, Singapore, Malaysia, the Philippines and India are at the forefront primarily due to availability of manpower both skilled and unskilled, lower healthcare infrastructure and treatment cost [3]. With the private sector in India investing heavily in medical tourism and providing low cost of medical care, India is emerging as the fastest growing segment in medical tourism. India ranks remarkable position for medical tourism in the world.
Therefore, forecasting for medical tourism plays an important role to make adequate planning in the nation and to capture the forecasted market value too. In this paper, a hybrid intelligent approach combining EMD, ARIMA and Monte Carlo models for multi-step ahead medical tourism forecasting in India, is presented.
This paper is organized into seven sections. Section-2 represents the information of study area and data collection. Proposed hybrid approach is presented in section-3, which includes the overview of EMD, ARIMA and Monte Carlo models. Section-4 represents the accuracy evaluation and performance analysis of the proposed approach is presented in section-5. Then implementation of proposed approach for forecasting is explained in section-6. Finally, section-7 represents the conclusions of the study.
Study area and data collection
As per the available reports by global health organization, the medical treatment cost in India is very cheap with high quality. According to survey, the saving of medical cost in India is rank 1 [2]. So, for this study Indian medical tourism forecasting problem is chosen.
For the presented study of foreign medical tourism arrival (FMTA), two different datasets have been collected and prepared at the nation level of India. Data#1 includes the monthly and Quarterly information of total foreign arrival (TFA) for different purposes in India since 1st January 2005 to 31st March 2020 and the Data#2 includes the monthly and Quarterly information of total foreign medical tourism arrival (FMTA) in India since 1st January 2009 to 31st March 2020 [4]. In this study, Data#1 is used to validate the proposed approach and the forecasting of the FMTA in India is evaluated by using Data#2. The detailed information of the both data has been given below: Data#1: total International Tourist Arrival (ITA). Data#2: International Medical Tourist Arrival (MTA).
The ITA and MTA data patterns have been represented in Figs. 1 and 3 respectively. The month wise quarterly distribution of ITA and MTA in India is represented in Figs. 2 and 4 respectively. Moreover, the statistical characteristics for recorded datasets are: 1) for ITA database - minimum = 225394, maximum = 1225672, Mean = 586264.28, StdDev = 220098.052 and Data Length = 180 months and 2) for MTA database - minimum = 6714, maximum = 72682, Mean = 23746.62, StdDev = 15174.74 and Data Length = 120 months.
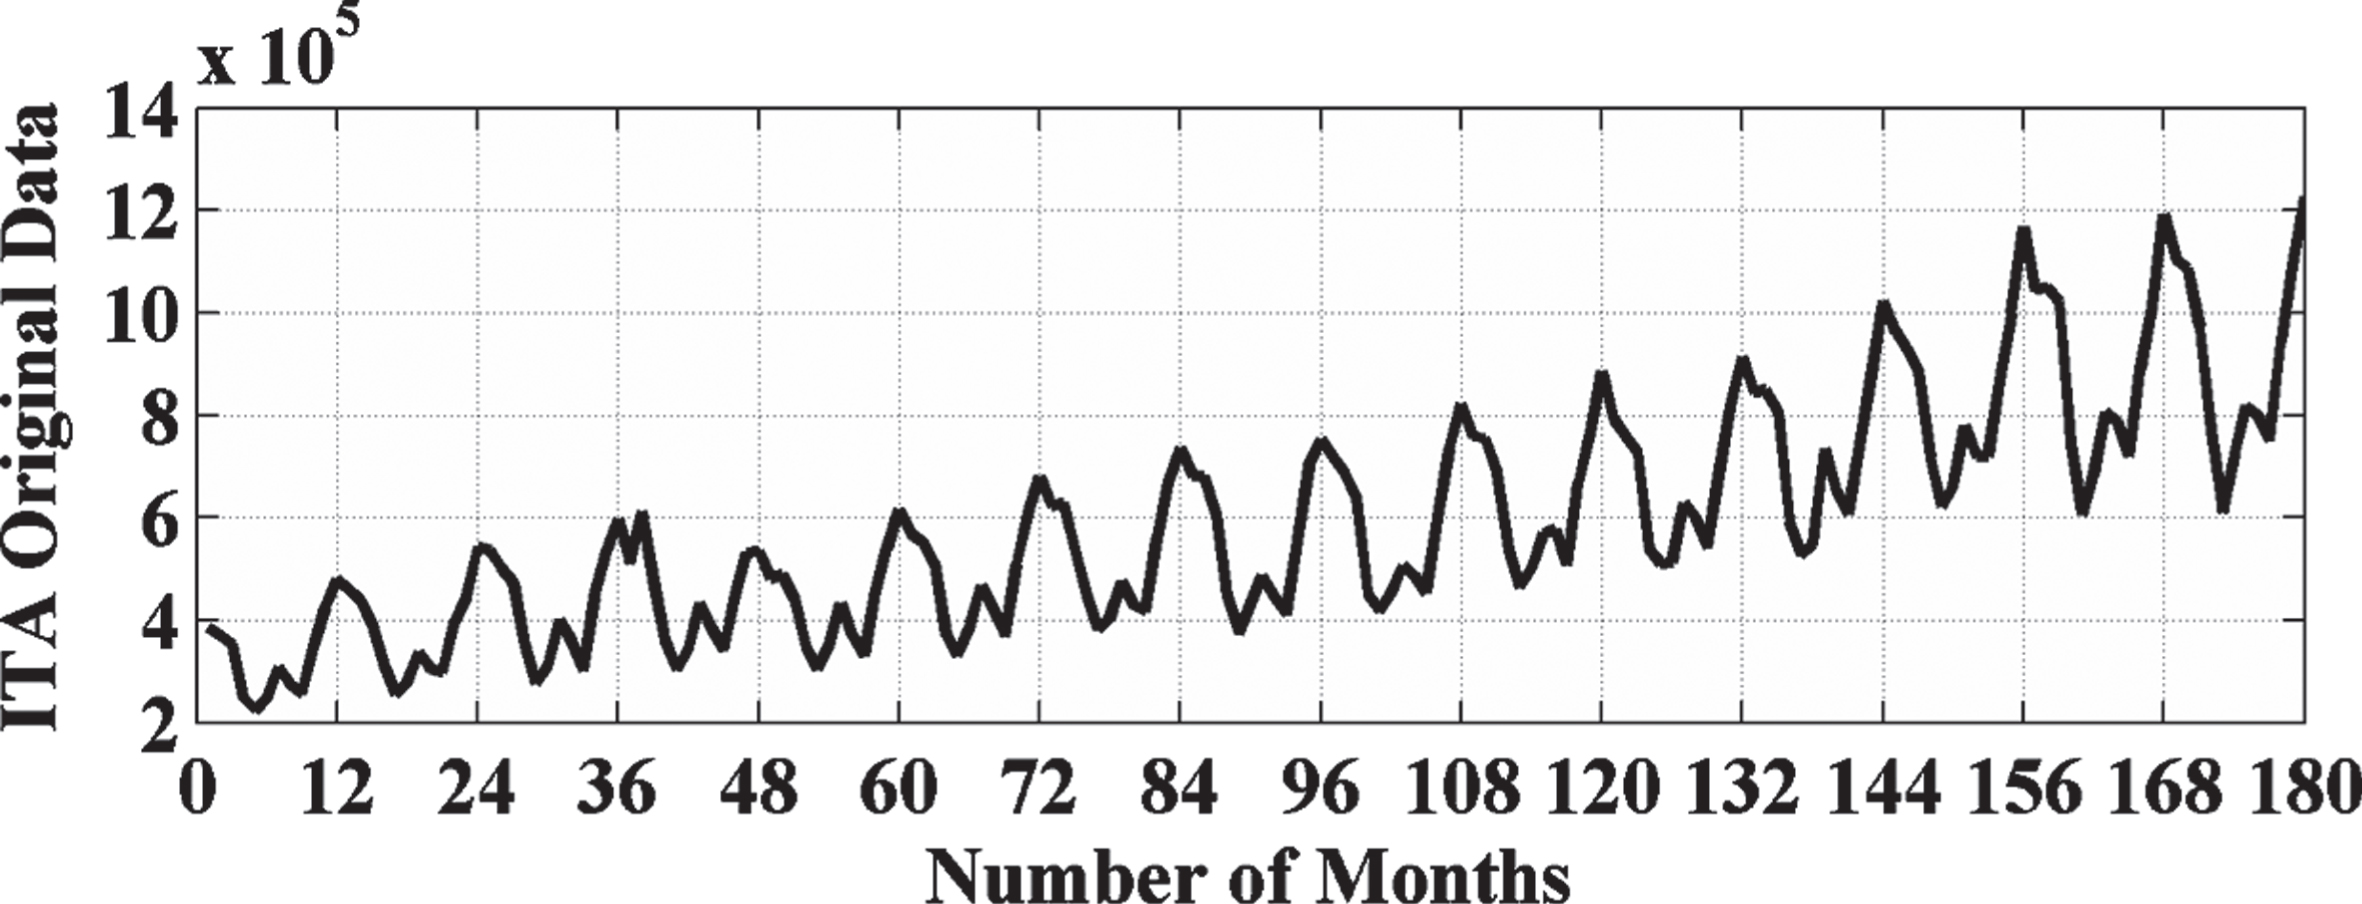
ITA pattern representation.
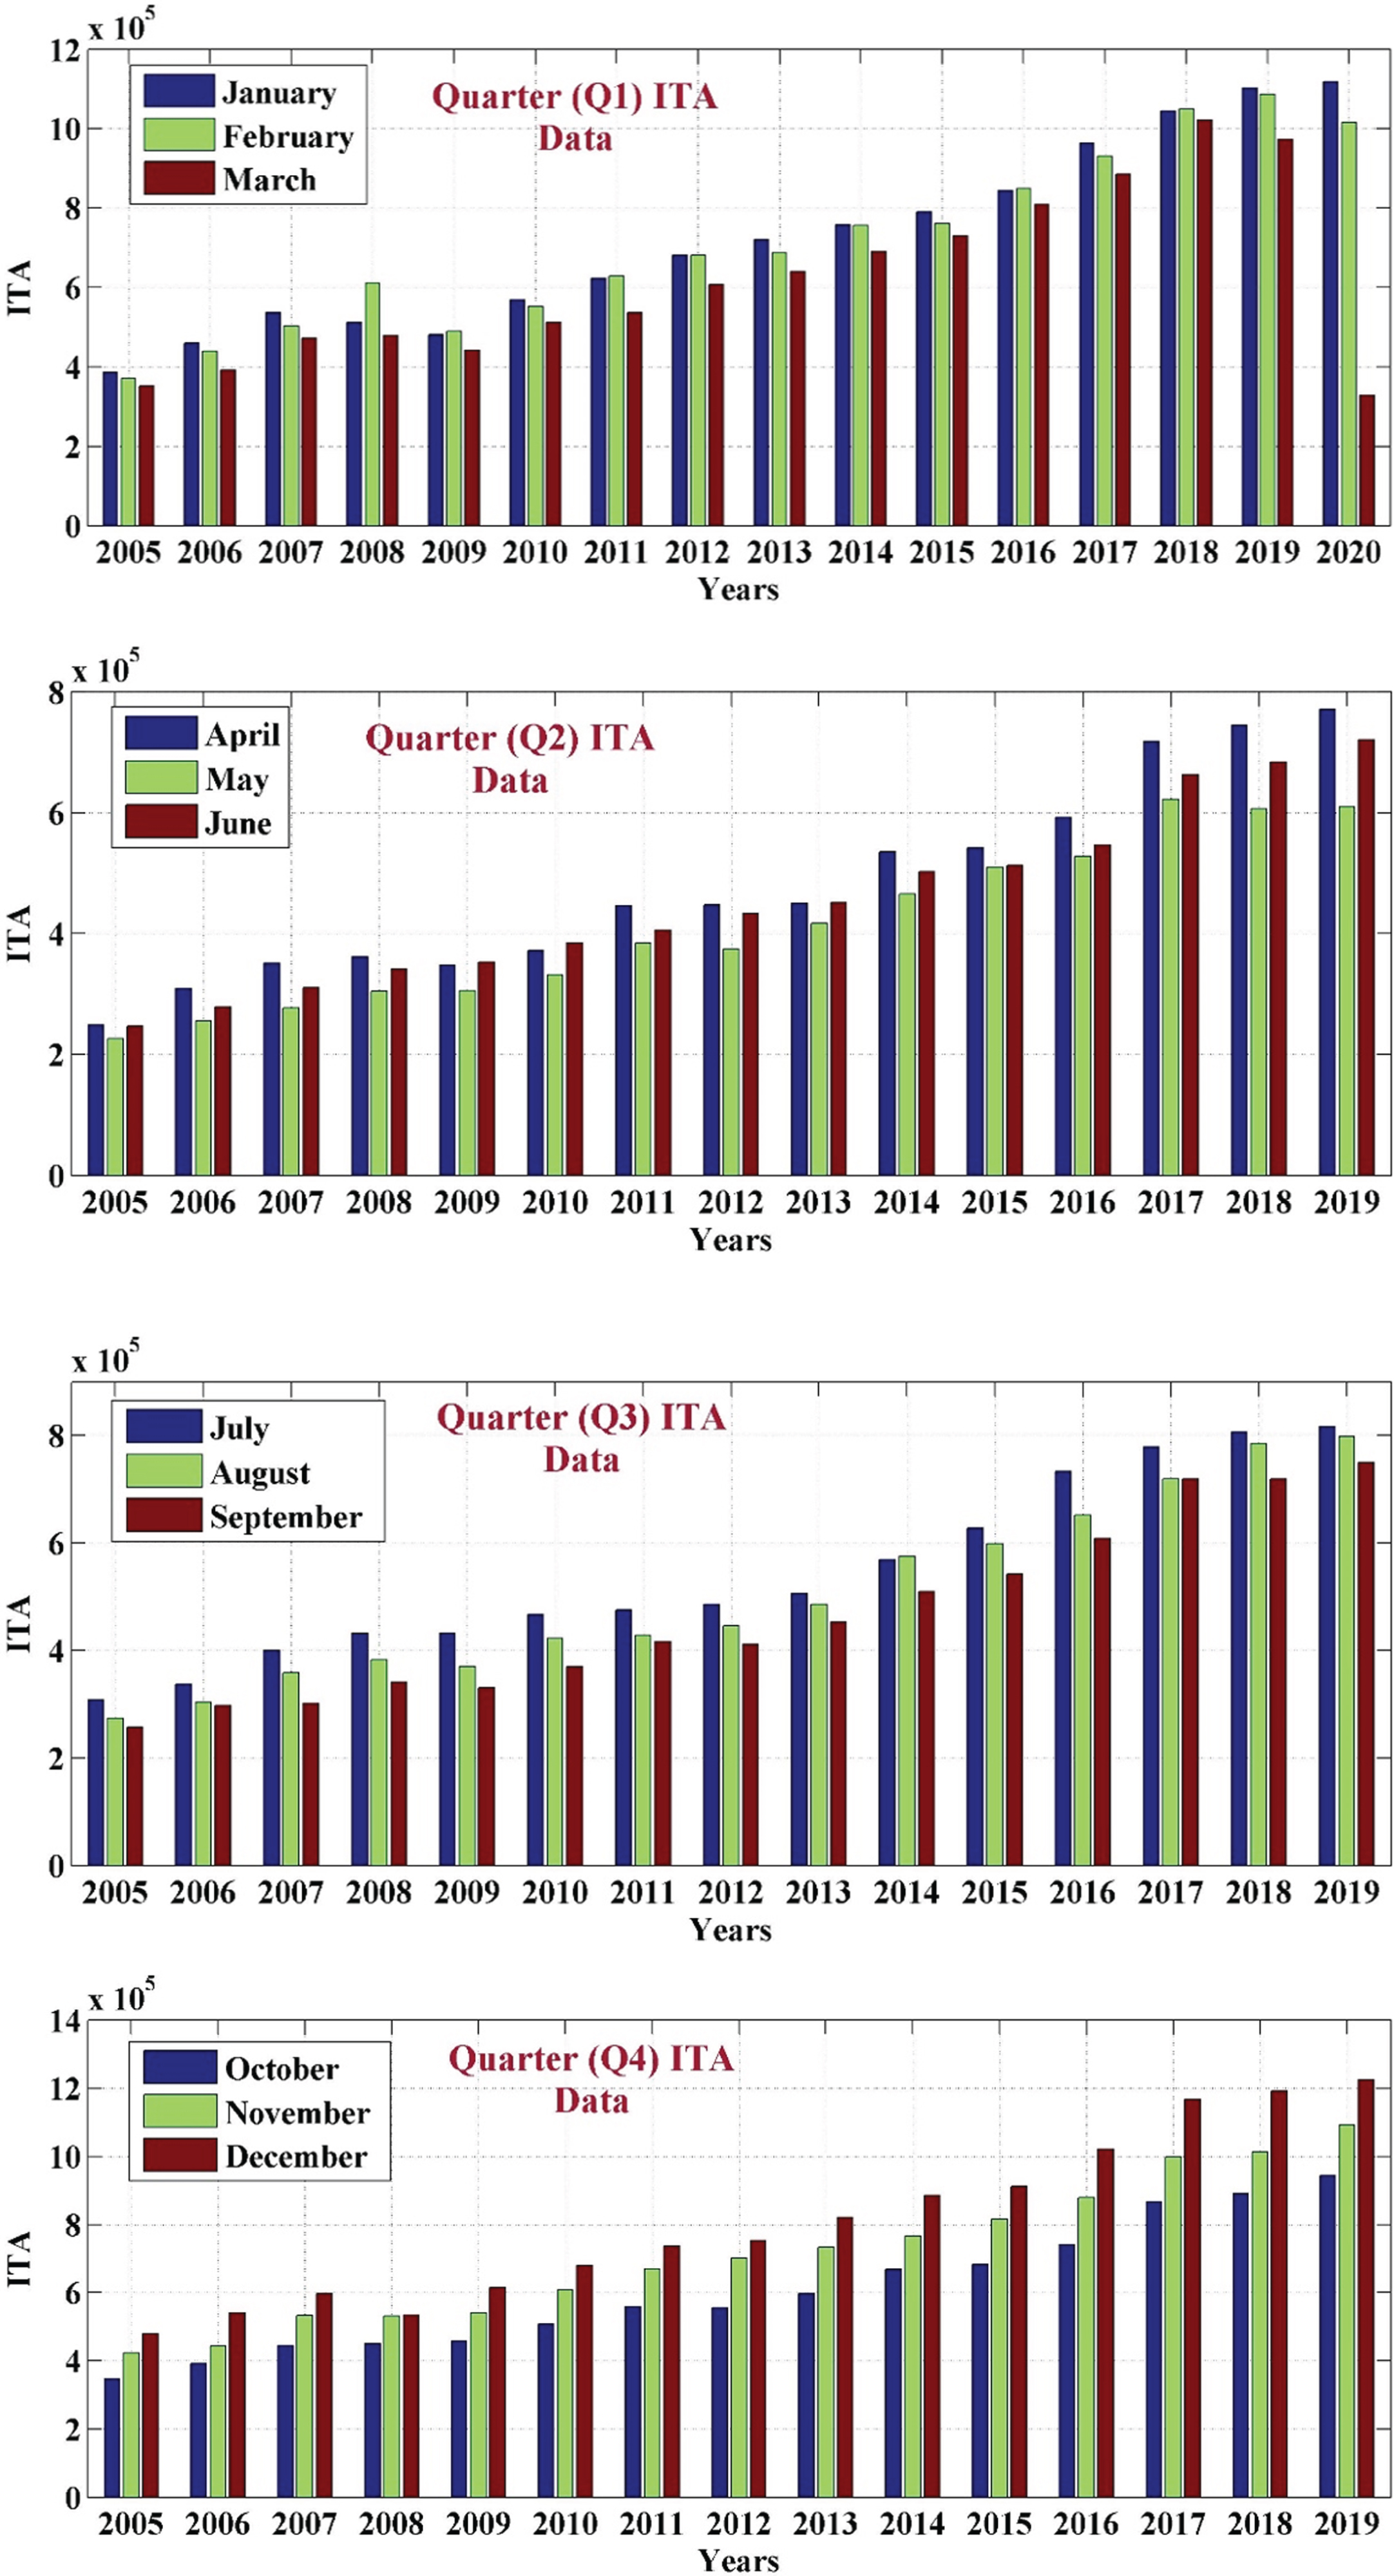
Quarterly ITA pattern representation.

MTA pattern representation.
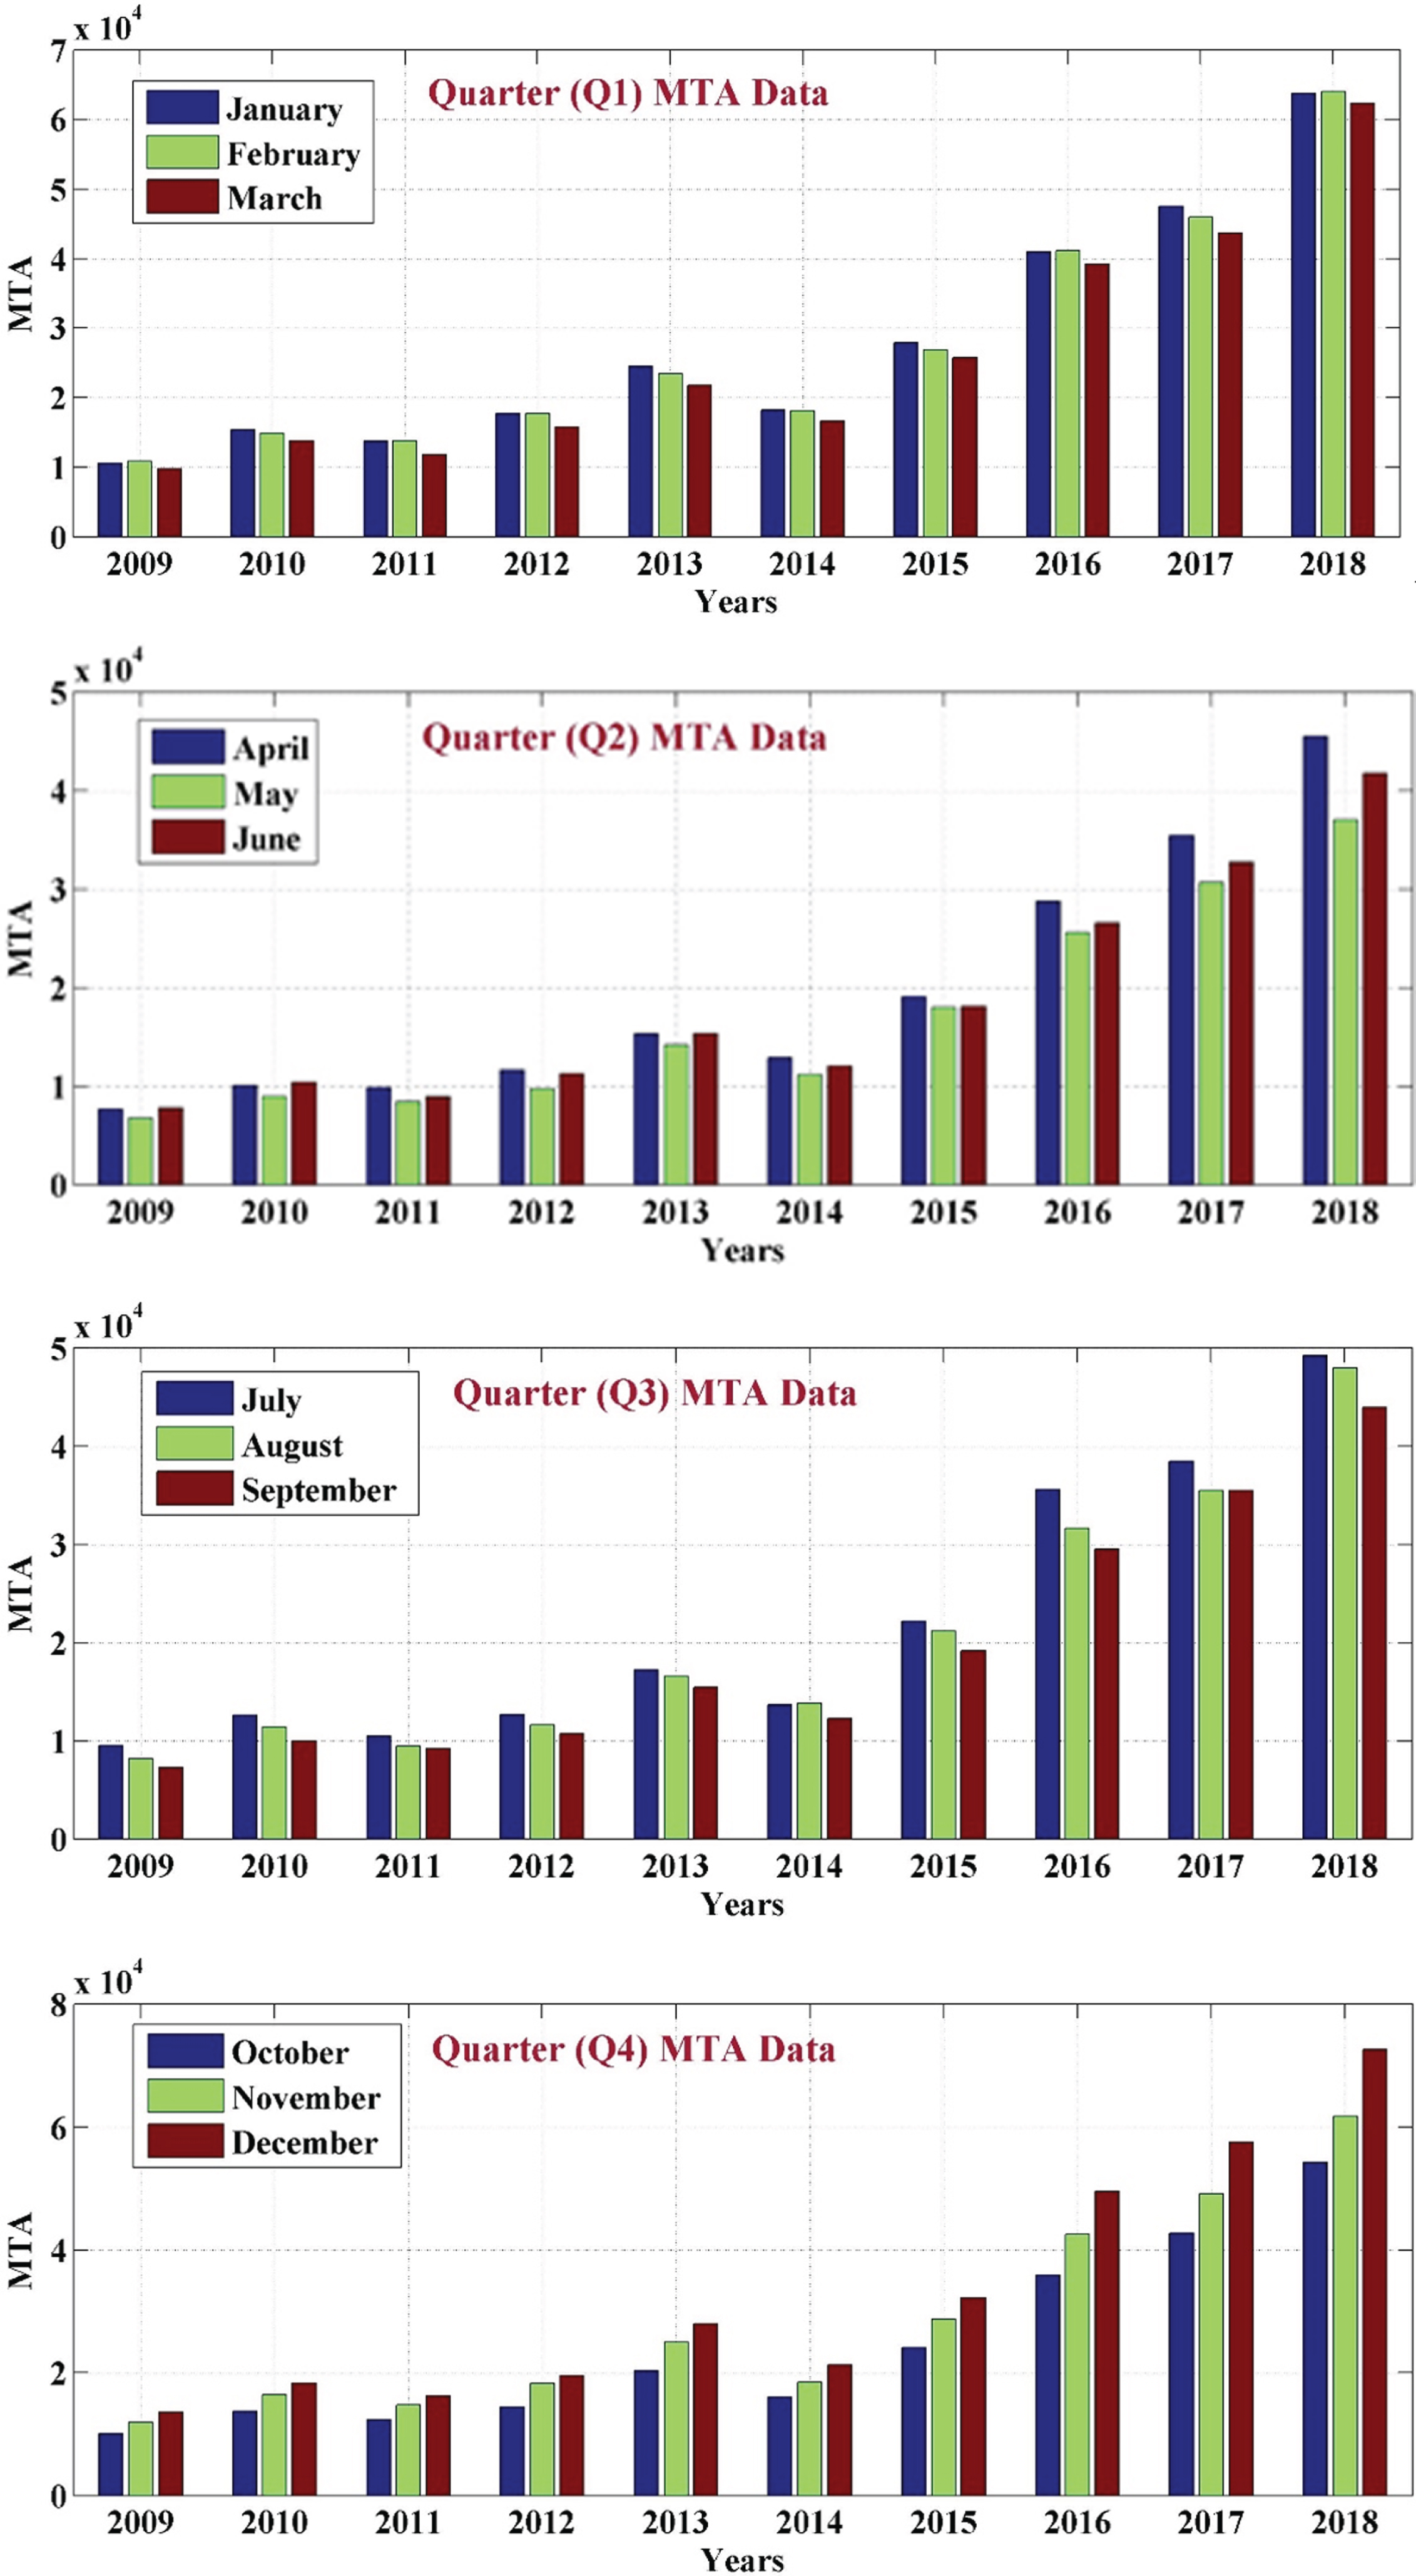
Quarterly MTA pattern representation.
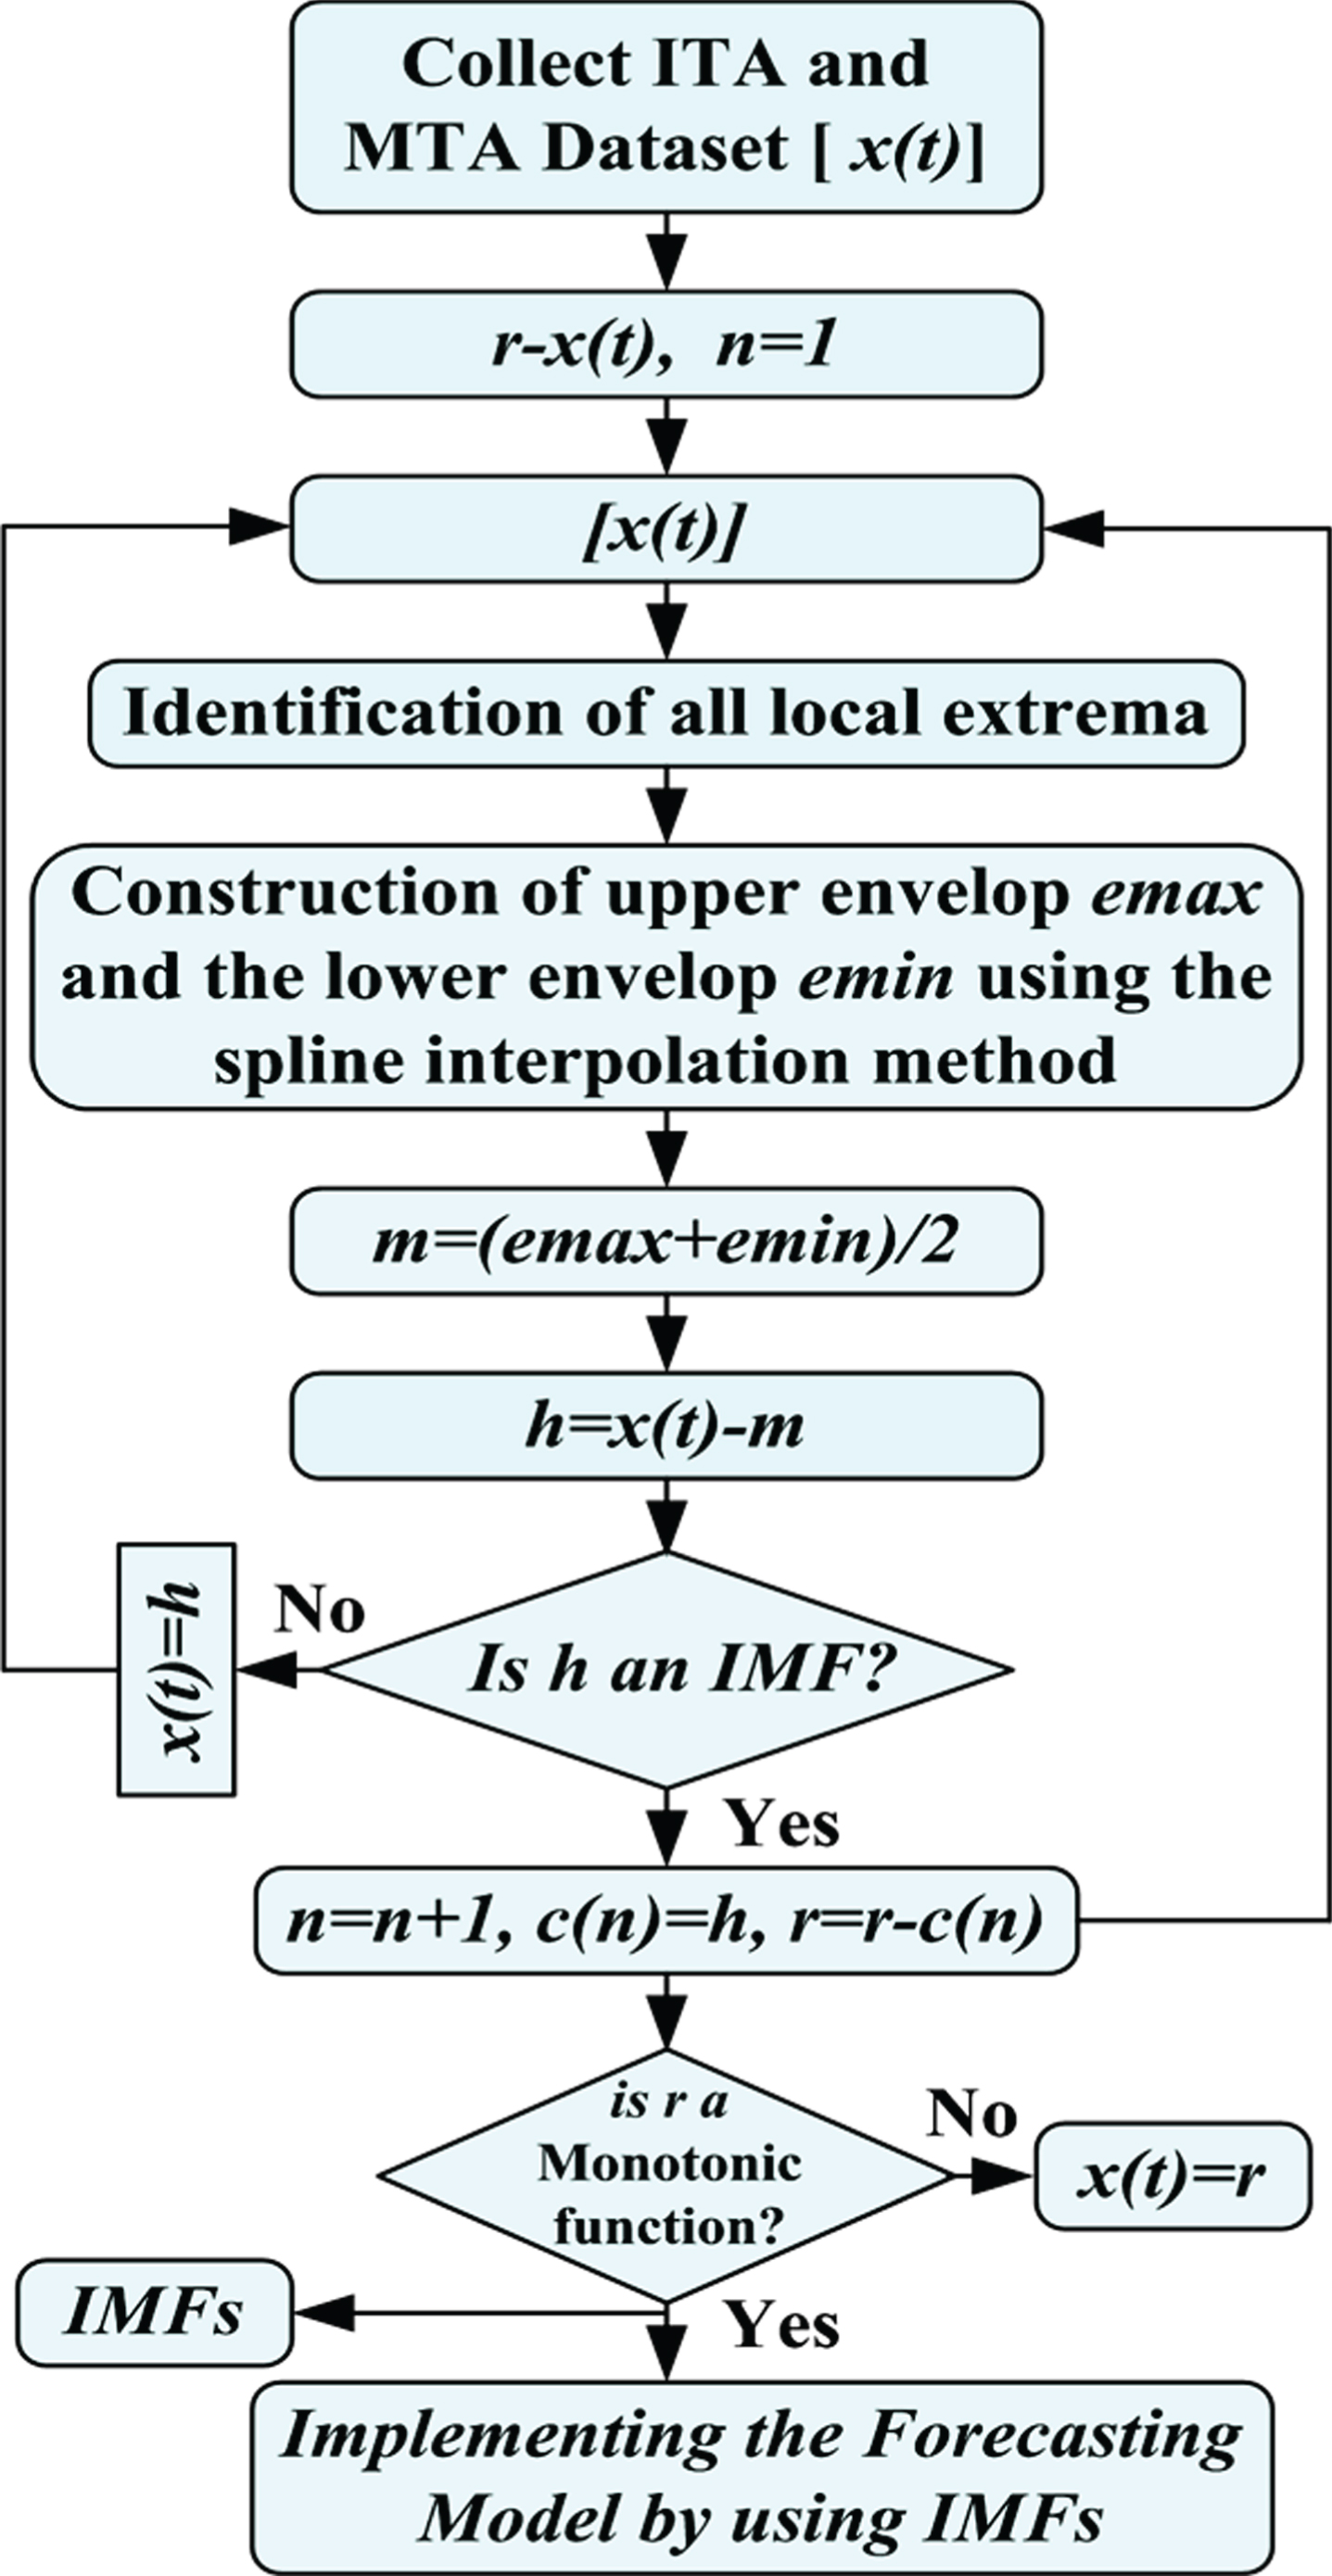
The main framework of the proposed approach is represented in Fig. 5 and it is the marriage of empirical mode decomposition (EMD), autoregressive integrated moving average (ARIMA), and Monto Carlo simulation (MCS) models arranged in a series, unified in a common platform. The main steps for the proposed medical tourism arrival (MTA) forecasting approach are as the follow. Firstly, a large database is generated with available historical records of ministry of tourism and external affairs of India. In this way, two different types of database have been prepared. Database#1 includes all international tourism arrival (ITA) in India and Database#2 includes only medical tourism arrival (MTA) in India for getting their medical treatment at cheaper cost. Then a correlation analysis is performed to manage the missing values and/or spikes (if any). Then, EMD model is implemented to extract the features from both type of dataset. These extracted features are used for the validation and forecasting model. Then different ARIMA and MCS models have been design. The performance of these models evaluated and validated by using ITA database, then MTA database based medical tourism in India is forecasted. Total twenty eight hybrid models have been developed and validated by using ITA database. After verification of acceptable performance of each model, MTA has been forecasted by using same developed hybrid models.
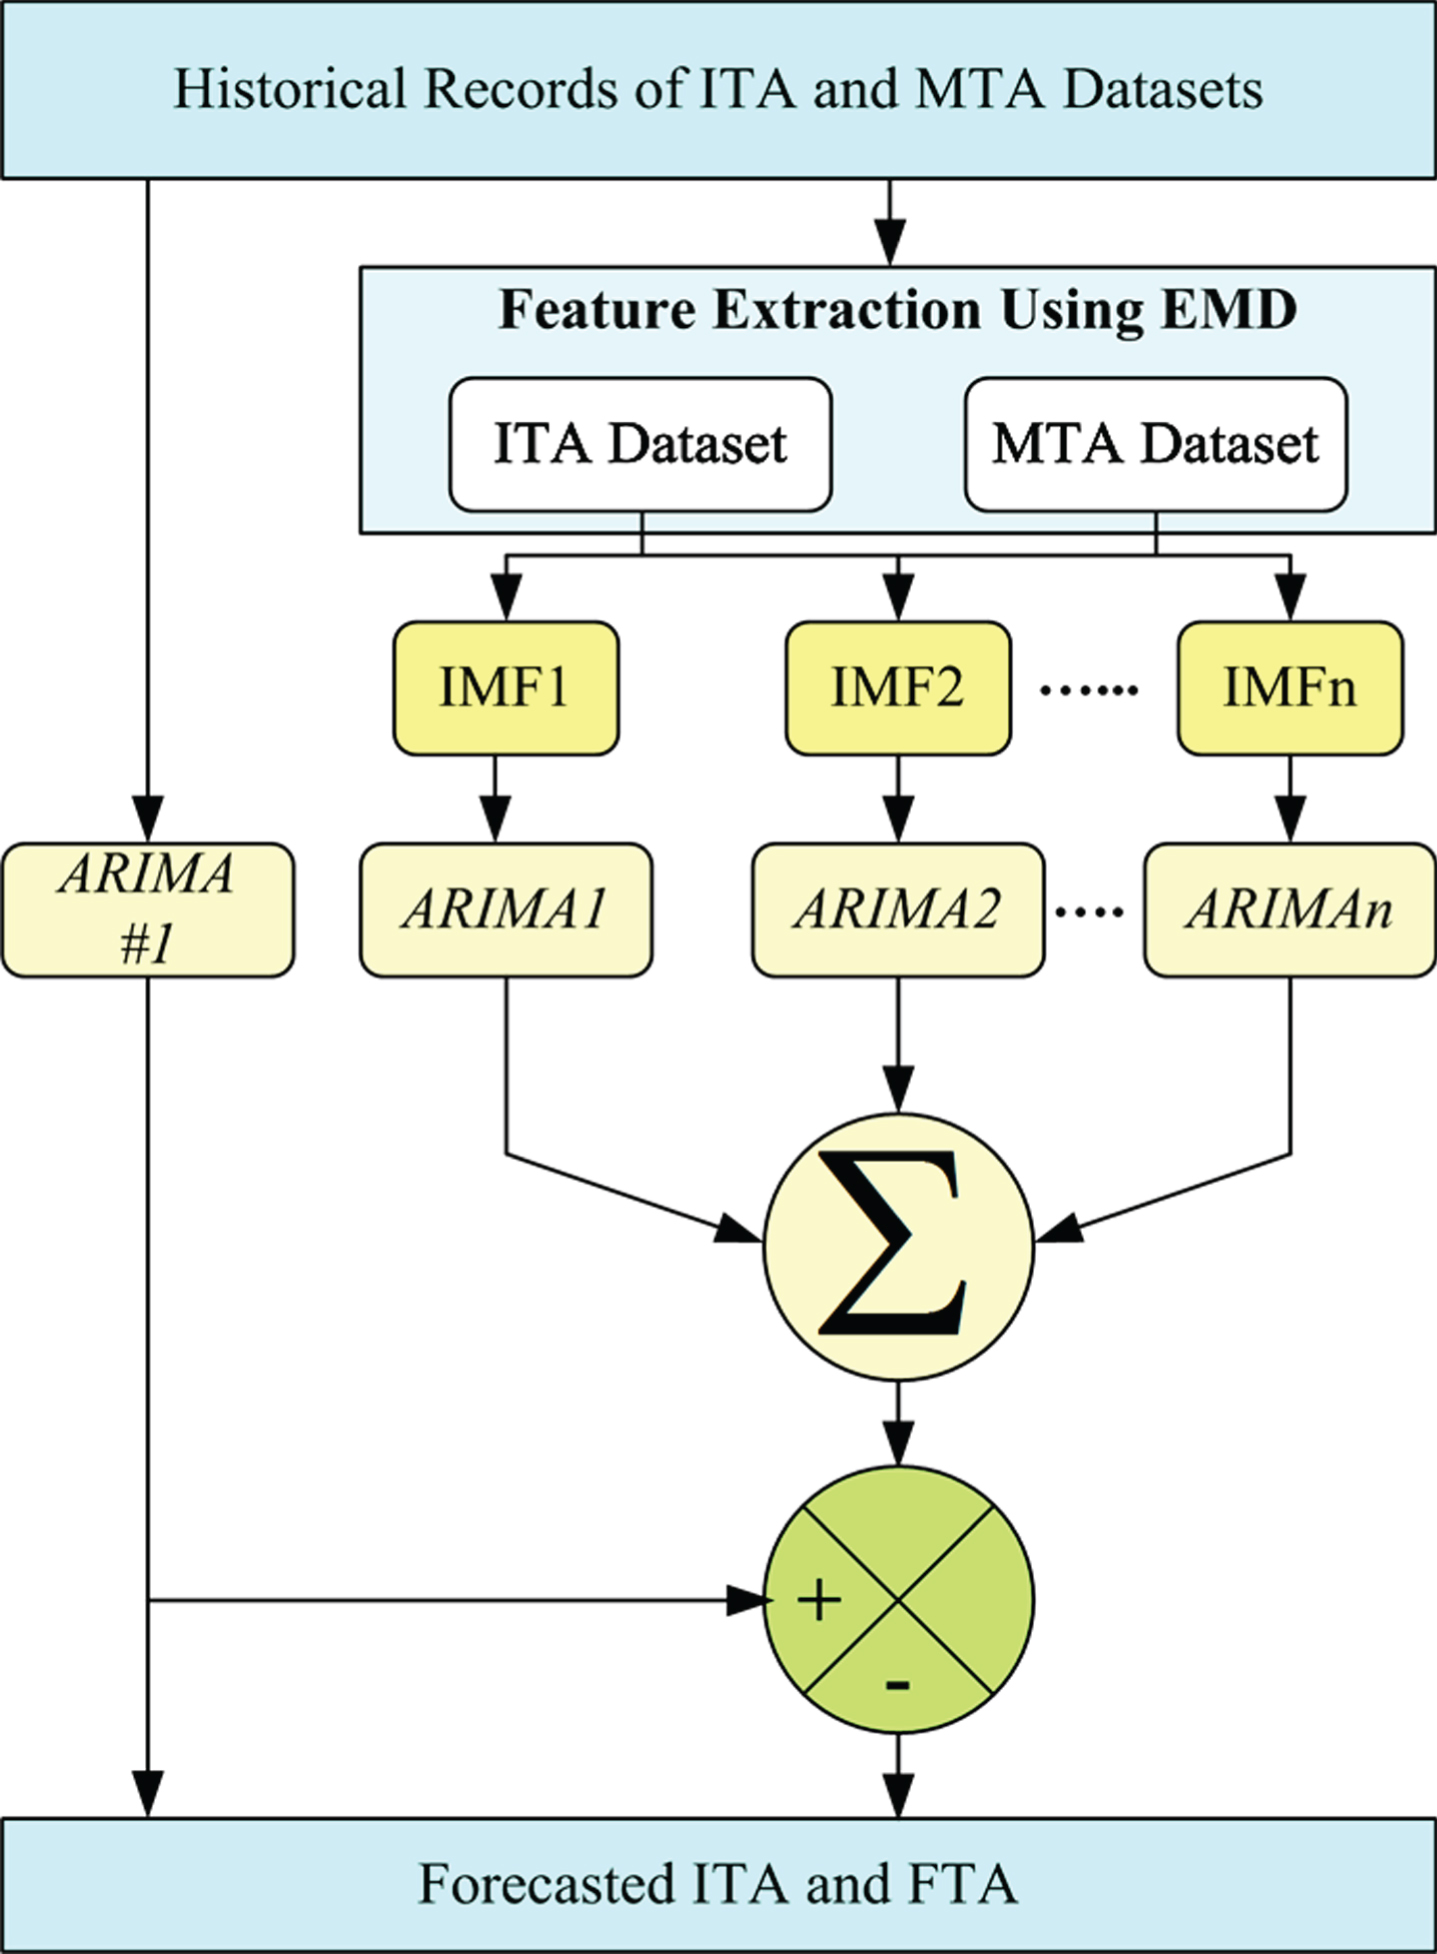
Proposed Approach Flowchart.
Multi-step ahead MTA forecasting is performed to make proposed hybrid model more globalized.
The complete structure of EMD model implementation for generating the intrinsic mode functions (IMFs) is shown in Fig. 6 [5–10]. The EMD is a type of intelligent feature extraction method, which can extract the feature in time-frequency domain. The generated IMFs for ITA and MTA database are represented in Figs. 7 and 8 respectively.
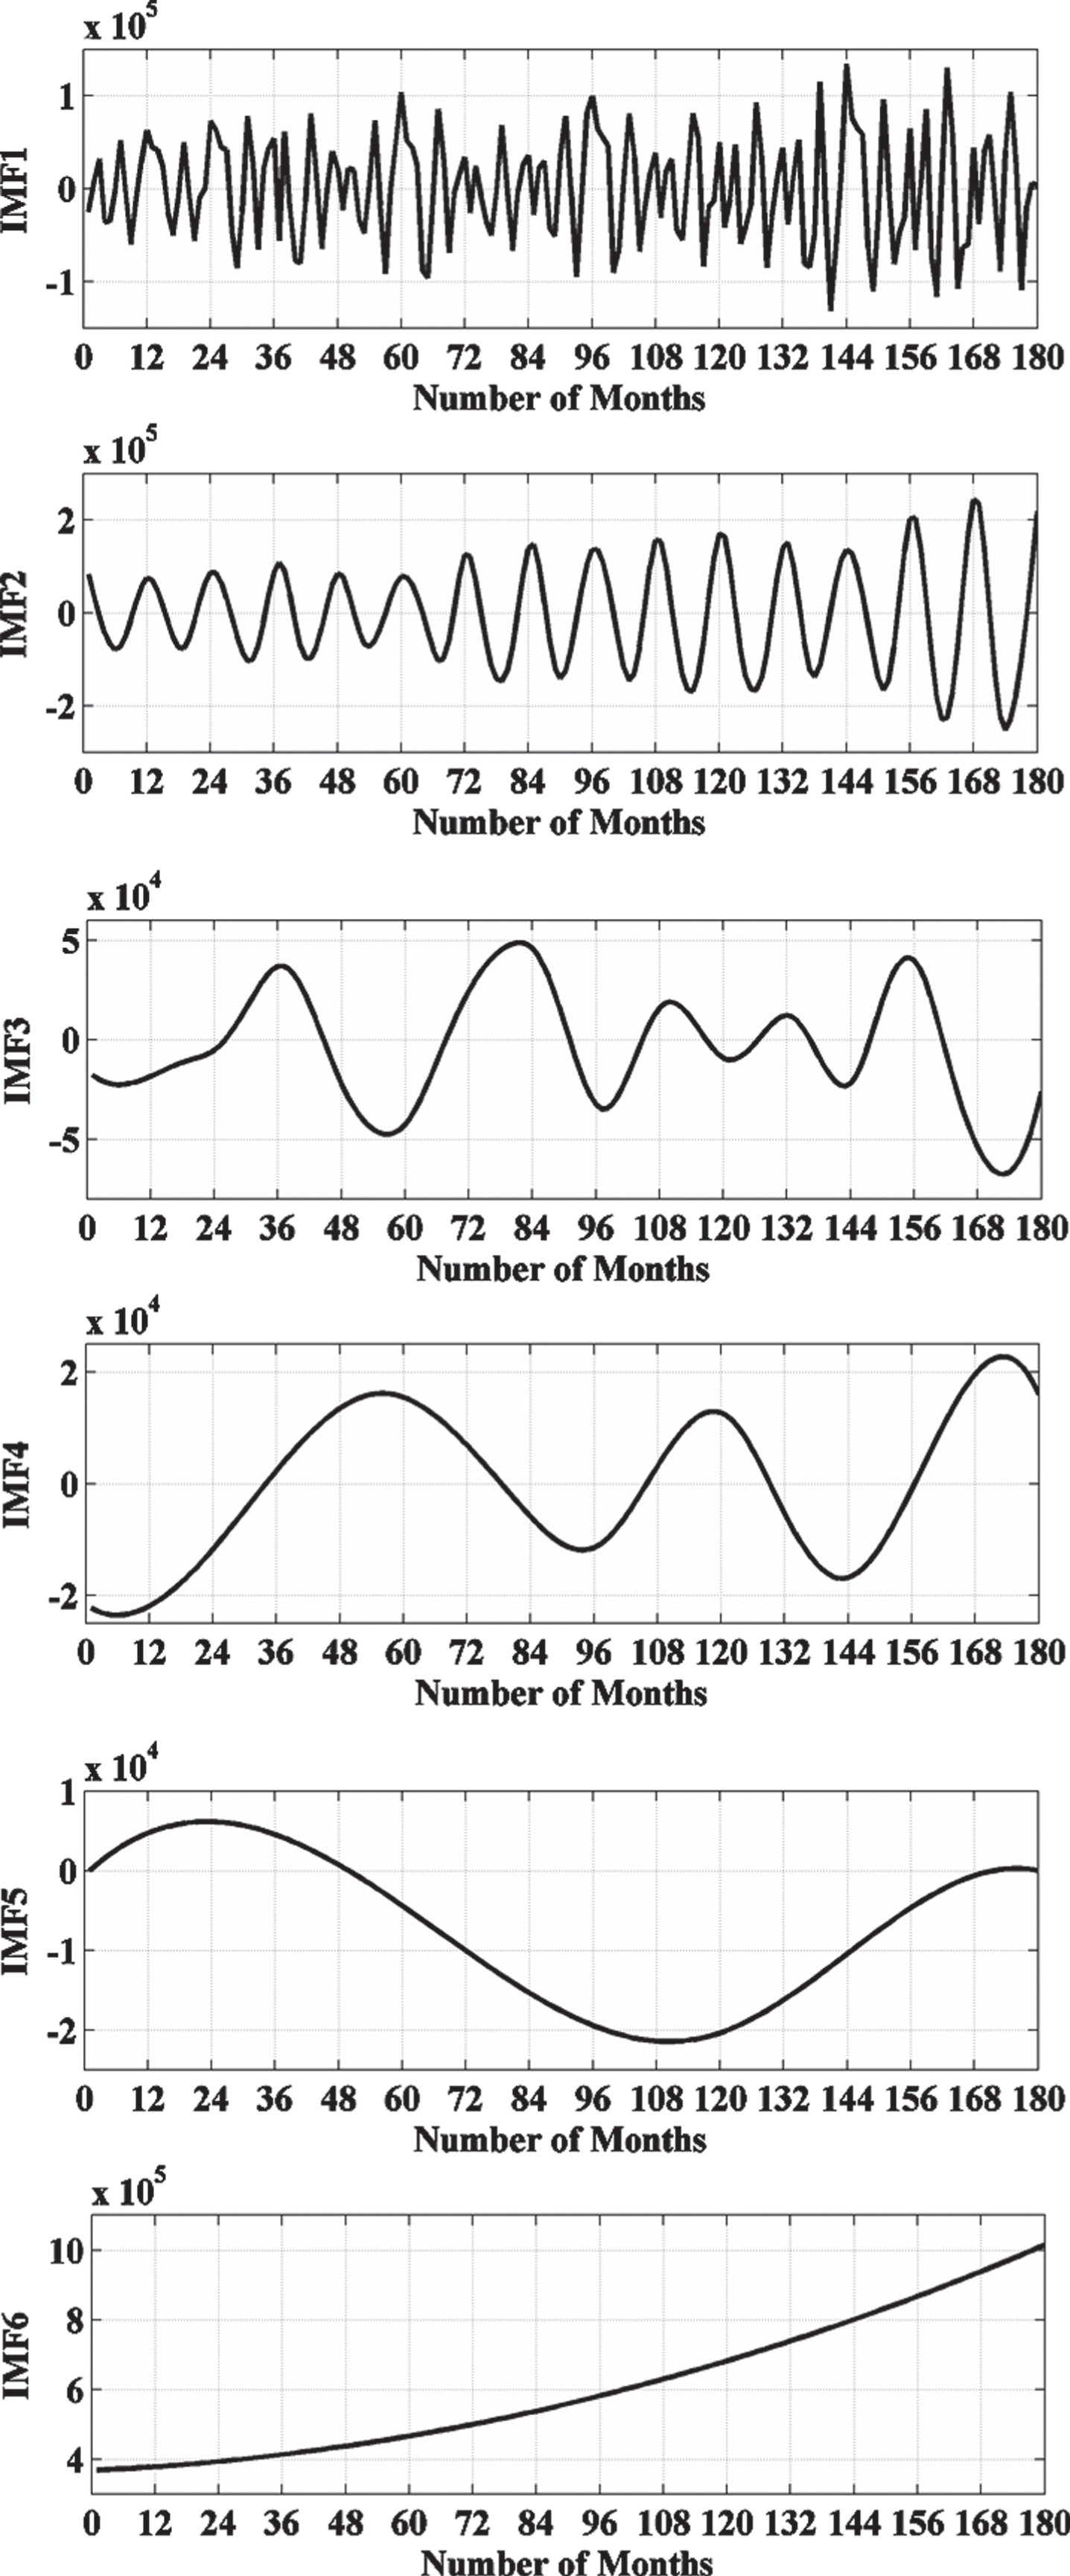
Generated IMFs from ITA Datasets.
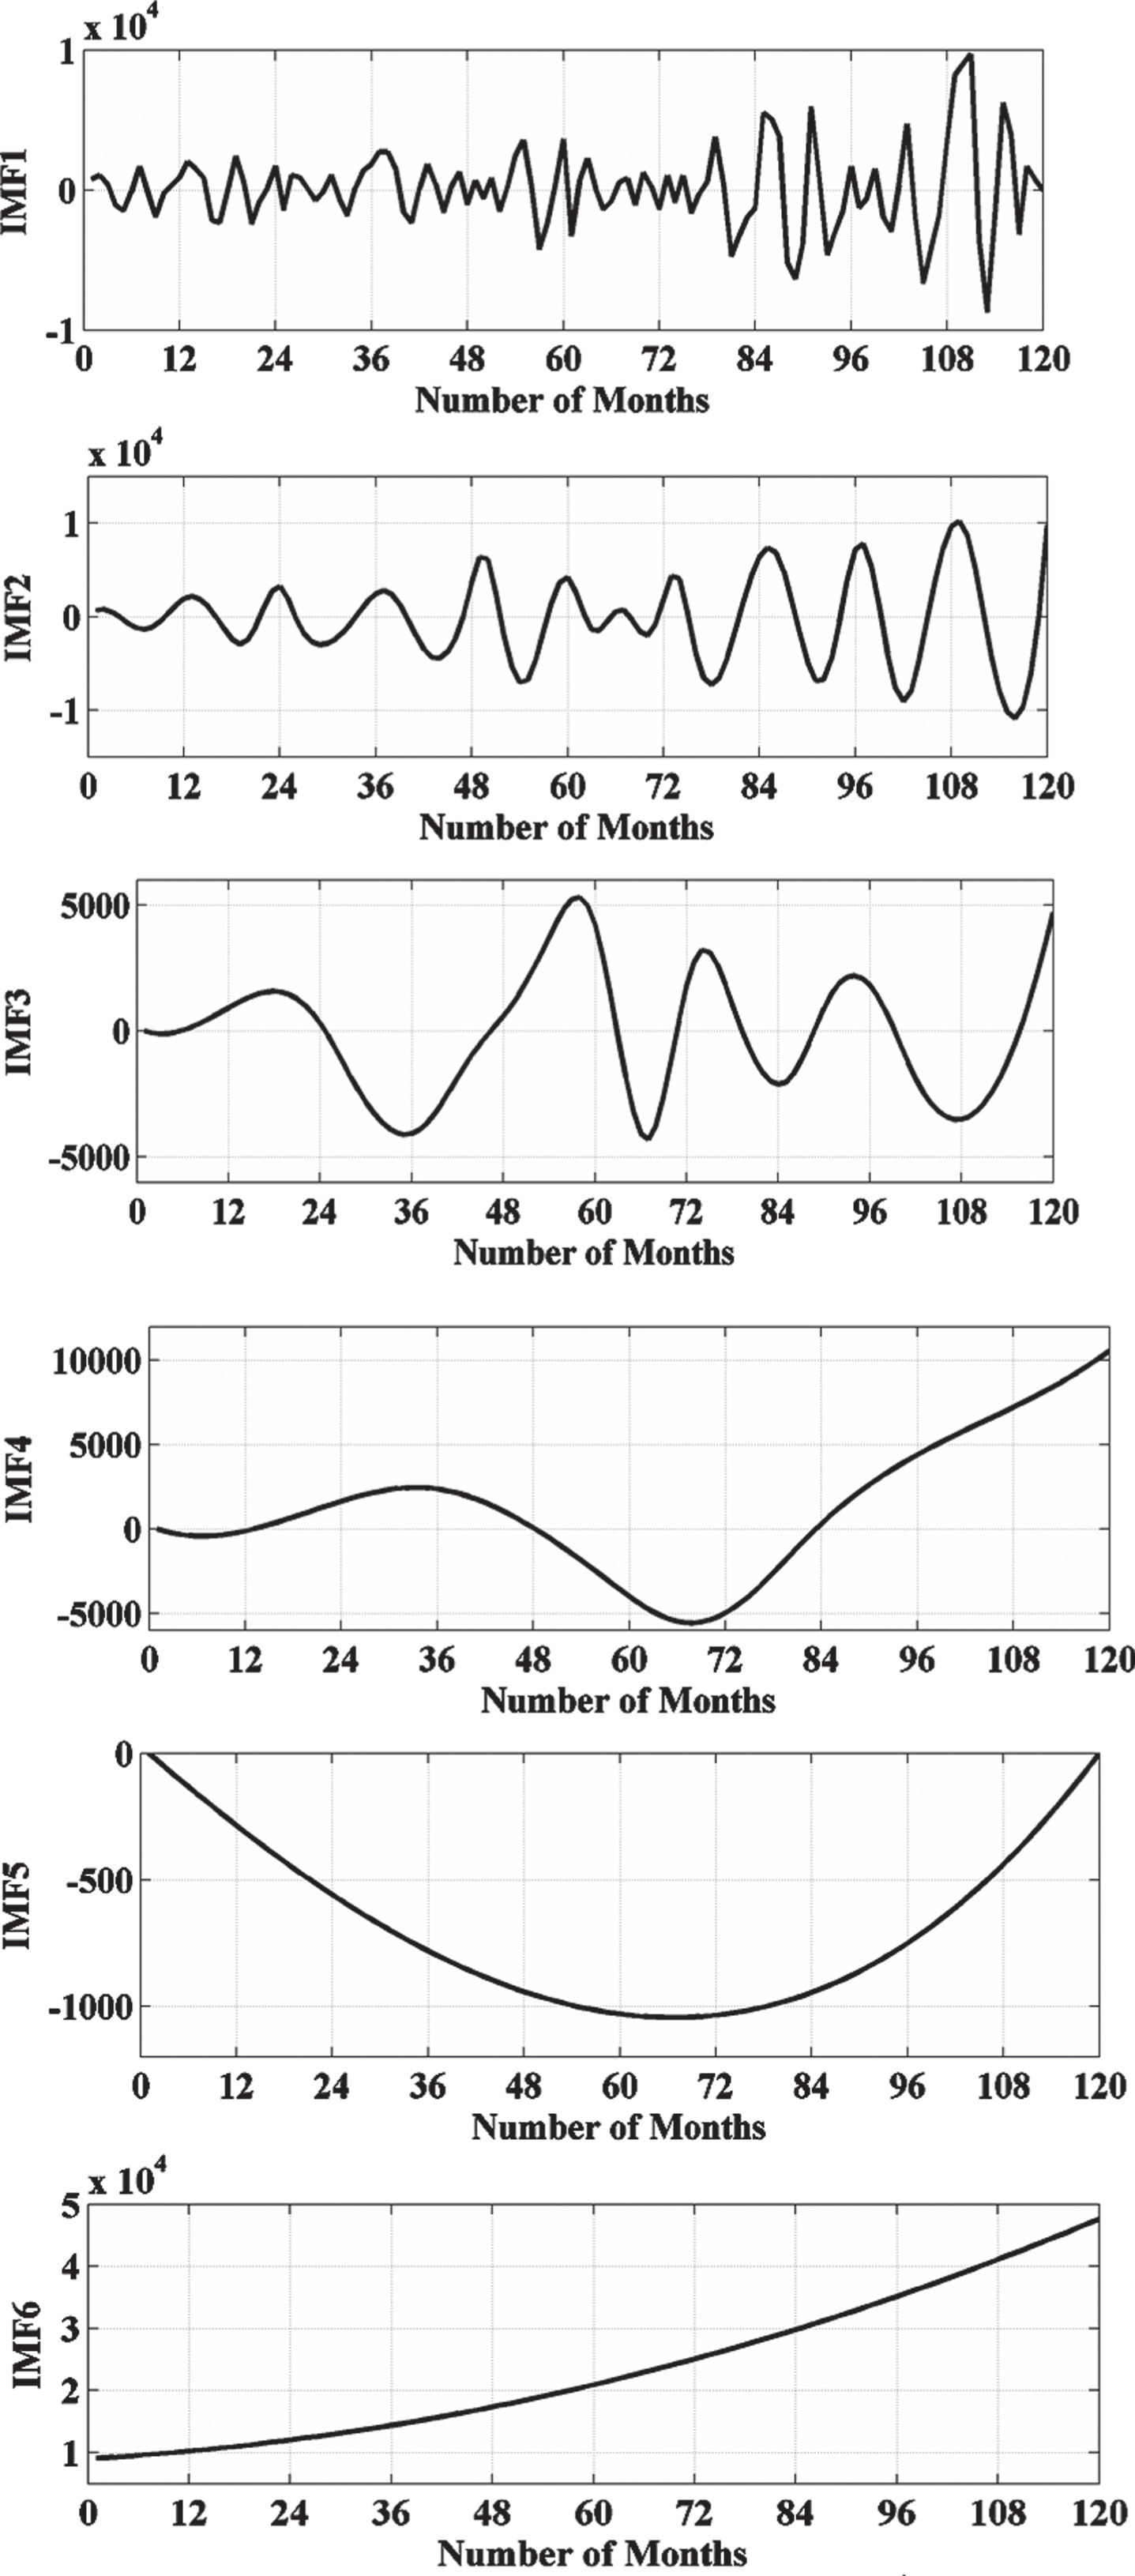
Generated IMFs from MTA Datasets.
The ARIMA model creates the non-stationary series which is integrated of order D. The ARIMA(p,D,q) model can be developed for a dataset when a series of non-stationary data can model as a stationary by ARMA(p,q) process and D times being differenced. Where, p-order of Auto-Regressive (AR) model, q-order of Moving Average (MA) model and D-Integrative part. For more detail, reader may refer [11]. The ARIMA(p,D,q) can be modeled mathematically as:
Where, Δ D y t = Dth differenced time series, ∈ t = uncontrolled process
In the time series forecasting/ analysis, the lag operator (L) or backshift operator (B) operates on an element of a time series to generate the previous data element. So, in L-operator, the ARIMA can be modelled as:
Where, φ* (L) = unstable AR operator
The Monte Carlo simulation (MCS) is a process of creating random, independent variables from a specific probabilistic model (PM). The main applications of MCS are forecasting, demonstration, and estimation of the future events/results.
To evaluate the MCS of conditional mean models as [12]:
Step 1: specify the presample data or utilized default data
Step 2: create an uncorrelated innovation series (M) from specified innovation series (y)
Step 3: create responses by applying the specified AR and MA polynomial operators.
Step 4: evaluate the MCS error - Estimate the probability of the future event as
MCS error can be reduced by increasing the number of realizations. So, there is another research for selecting the optimal number of realizations.
Minimum mean square error (MMSE) in forecast is a type of evaluator, which can minimize the mean square error (MSE). For the detailed information reader may refer [13–17]. Here, MMSE is evaluated for each model and it is utilized for the validation purpose of Monte Carlo based forecasting, which is represented in for of a comparative analysis and on-step ahead validation of each model.
Proposed model performance verification using ITA dataset
The performance analysis of the proposed approach is analyzed and validated by using ITA dataset. The performance of the proposed approached is analyzed into two categories for multi-steps ahead forecasting. These multi-step ahead forecasting of ITA are: 1) Zero-Step Ahead (ZSA) Forecasting, 2) One-Step Ahead (OSA) Forecasting, 3) Two-Step Ahead (TSA) Forecasting, and 4) Three-Step Ahead (TrSA) Forecasting. These multi-step ahead forecasting have been analyzed into two different categories. These two categories are based on input variables, used in the proposed approach as an input parameters. These two categories are: 1) Performance analysis category#1 and 2) Performance analysis category#2.
Performance analysis category#1: The performance analysis is evaluated with the help of raw ITA dataset. This analysis is based on without IMFs of EMD based analysis. In this category, four forecasting models have been developed and validated with the help of 180 months ITA dataset.
Performance analysis category#2: The performance analysis is evaluated with the help of extracted features (i.e., IMFs of EMD) from raw ITA dataset. This analysis is based on with IMFs of EMD. In this category, twenty-four forecasting models have been developed and validated with the help of 180 months ITA dataset.
The obtained results for validation performance of the proposed approach under both categories (i.e., with and without EMD) have been represented in Table 1. Under EMD based analysis, six hybrid models have been developed and analyzed for each multi-step ahead forecasting. According to proposed approach one hybrid model is required for one IMF based analysis. So each multi-step ahead forecasting has 6-different IMFs as shown in section 3.
IFA forecasting validation
IFA forecasting validation
Moreover, the performance validation for each developed mode has been given in a tabular form in the Table 2 and Tables 3–6 for without EMD and with EMD based analysis respectively.
Forecasting models performance analysis without EMD
ZSA model performance analysis with EMD
OSA model performance analysis with EMD
TSA model performance analysis with EMD
TrSA model performance analysis with EMD
Table 2 shows the model validation performance analysis for all four multi-step ahead forecasting (i.e., ZSA, OSA, TSA and TrSA). The performance evaluators (i.e., MA, SMA and variance) have been evaluated for each model.
Forecasting verification with EMD
With EMD, Table 3–6 show the model validation performance analysis for all four multi-step ahead forecasting (i.e., ZSA, OSA, TSA and TrSA). The performance evaluators (i.e., MA, SMA and variance) have been evaluated for each model for each IMF of EMD.
In order to develop all these models for future prospective in the MTA forecasting, the evaluated parameters can be used. After detailed analysis in section 5, it is concluded that proposed approach can be used for MTA forecasting in India, which is represented in subsequence sections.
MTA forecasting using proposed model
In this section, MTA forecasting using validated hybrid model is presented. MTA forecasting is performed here into two categories, similar to section 5 (i.e., forecasting without EMD and with EMD). Moreover, with and without EMD based MTA forecasting is performed into multi-step ahead forecasting (i.e., ZSA, OSA, TSA and TrSA). The comparative results for each case have been represented in Table 7.
MFA forecasting validation
MFA forecasting validation
Moreover, the performance validation for each developed mode has been given in a graphical form in the Figs. 9-22, Figs. 23-36, Figs. 37-50 and Figs. 51-64 for ZSA, OSA, TSA and TrSA forecasting respectively. These analysis have also been performed into two categories as well, which are represented in Figs. 9-10, Figs. 23-24, Figs. 37-38, and Figs. 51-52 for without EMD and in Figs. 11–22, Figs. 25-36, Figs. 39-50, and Figs. 53-64 for with EMD.
ZSA based forecasted result without EMD.
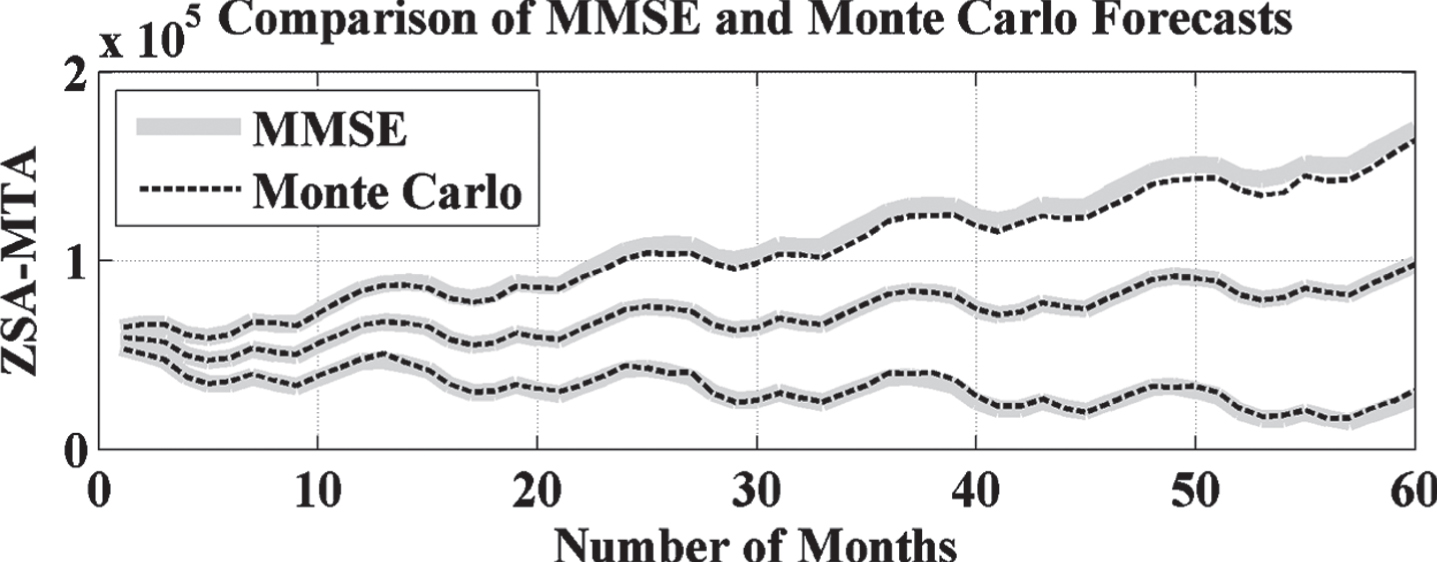
ZSA based forecasted result comparison with Monte Carlo without EMD.
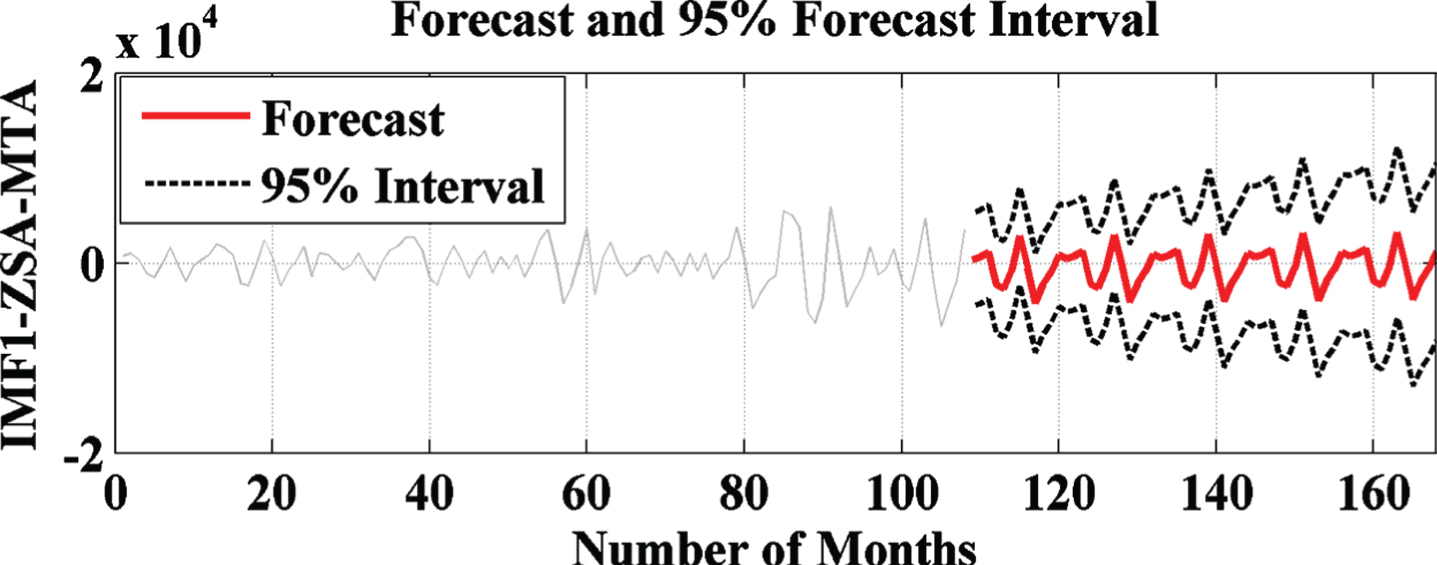
ZSA based forecasted result with IMF1 of EMD.
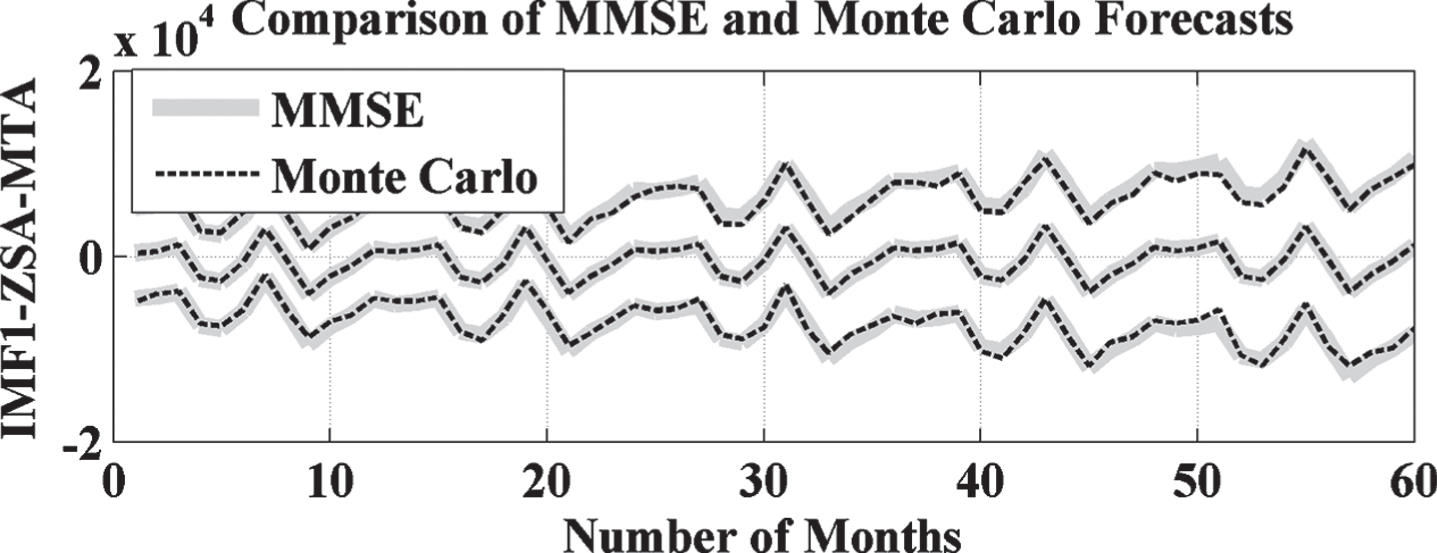
ZSA forecasted result comparison with Monte Carlo with IMF1 of EMD.
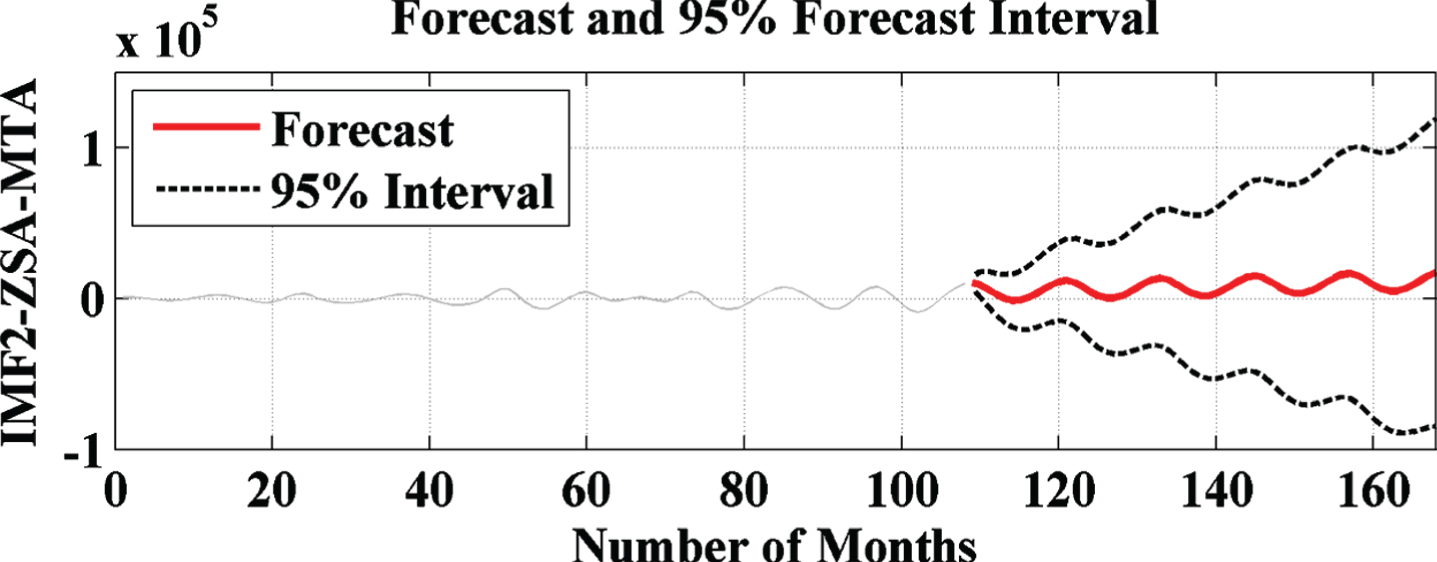
ZSA based forecasted result with IMF2 of EMD.

ZSA forecasted result comparison with Monte Carlo with IMF2 of EMD.
ZSA based forecasted result with IMF3 of EMD.
ZSA forecasted result comparison with Monte Carlo with IMF3 of EMD.
ZSA based forecasted result with IMF4 of EMD.
ZSA forecasted result comparison with Monte Carlo with IMF4 of EMD.

ZSA based forecasted result with IMF5 of EMD.
ZSA forecasted result comparison with Monte Carlo with IMF5 of EMD.
ZSA based forecasted result with IMF6 of EMD.
ZSA forecasted result comparison with Monte Carlo with IMF6 of EMD.
OSA based forecasted result without EMD.
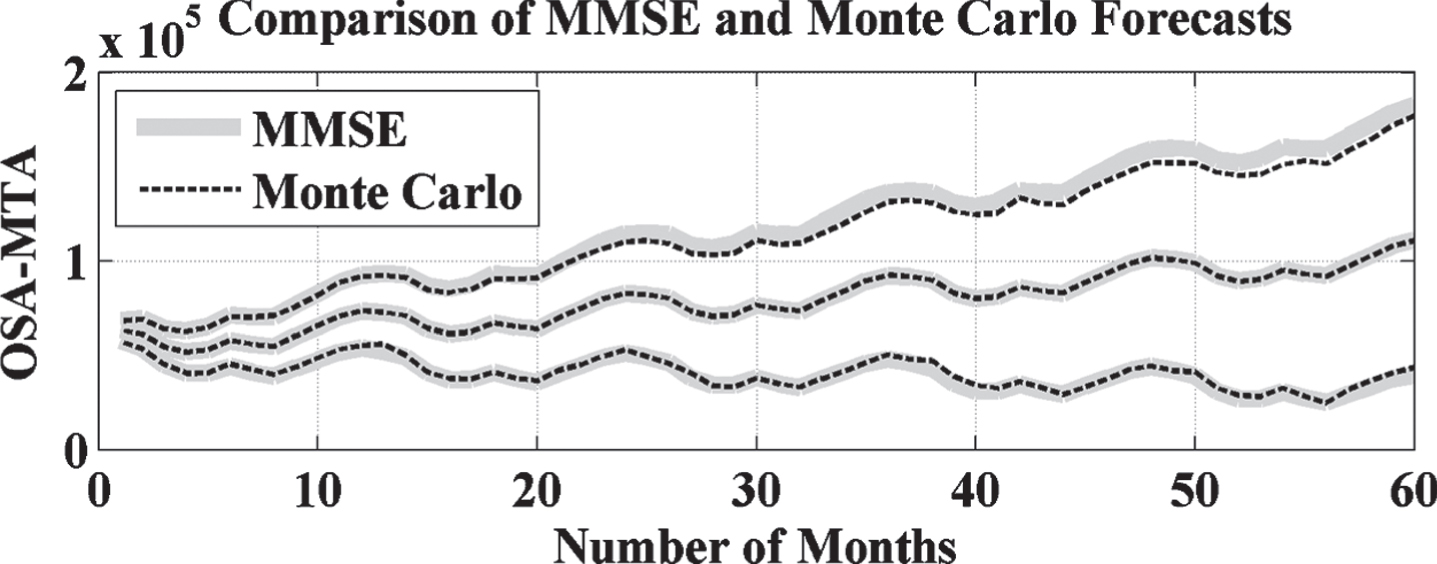
OSA based forecasted result comparison with Monte Carlo without EMD.
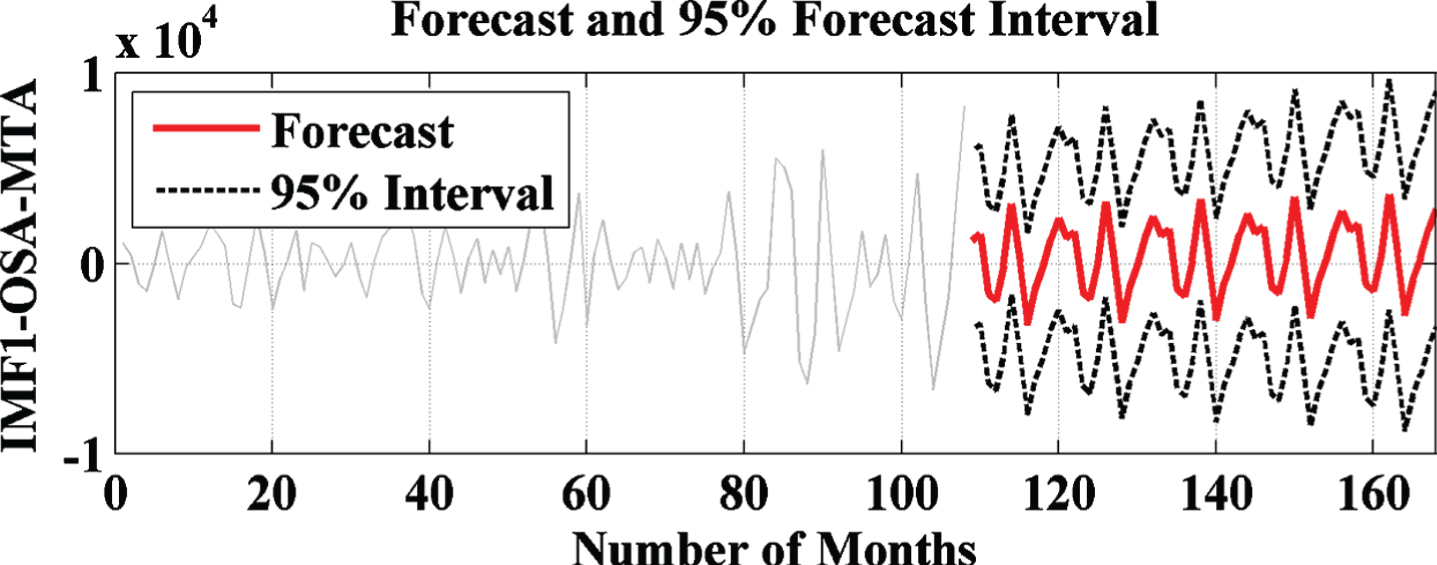
OSA based forecasted result with IMF1 of EMD.
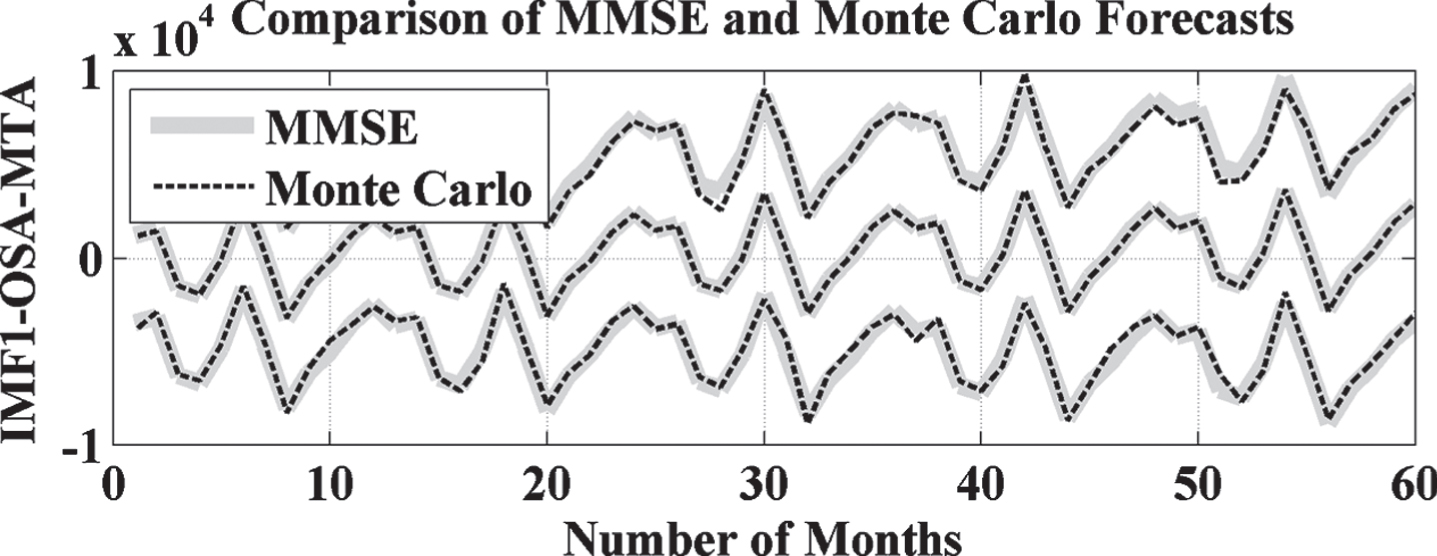
OSA forecasted result comparison with Monte Carlo with IMF1 of EMD.
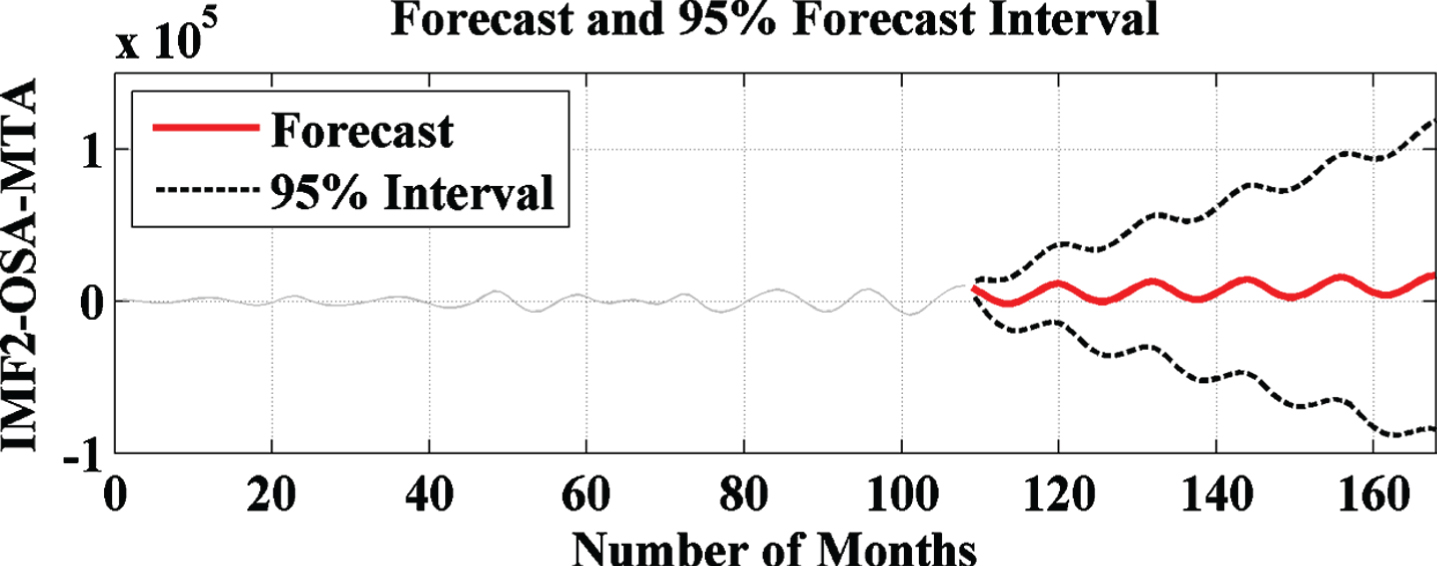
OSA based forecasted result with IMF2 of EMD.

OSA forecasted result comparison with Monte Carlo with IMF2 of EMD.
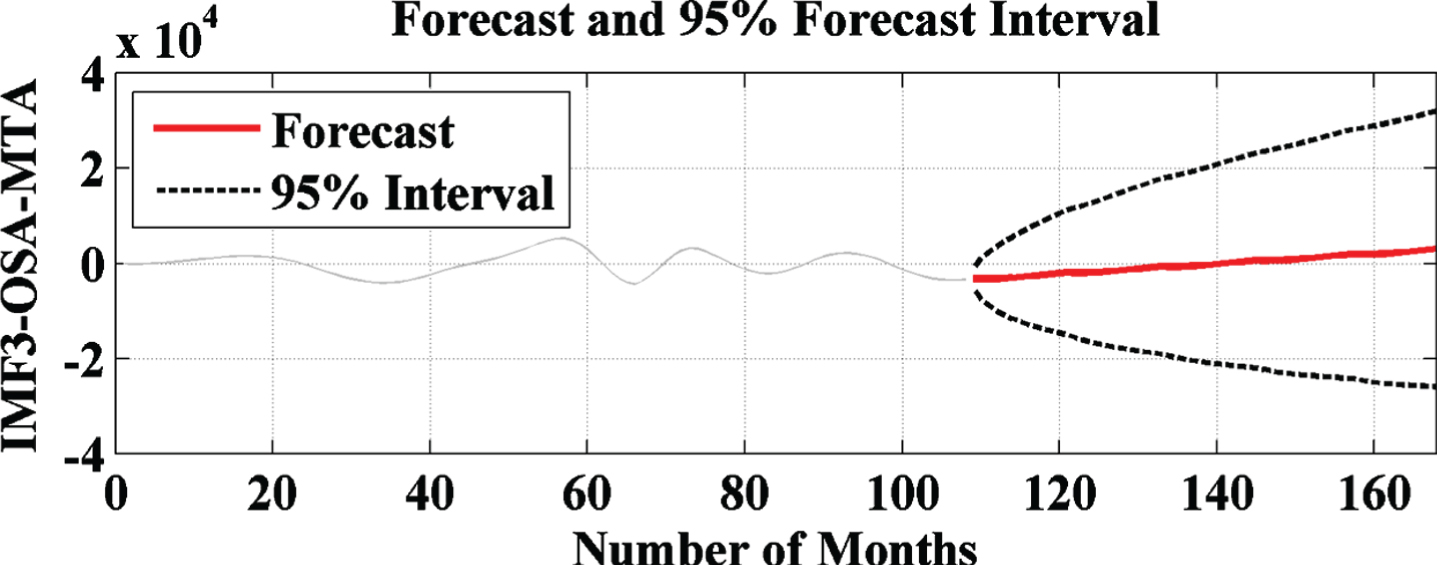
OSA based forecasted result with IMF3 of EMD.
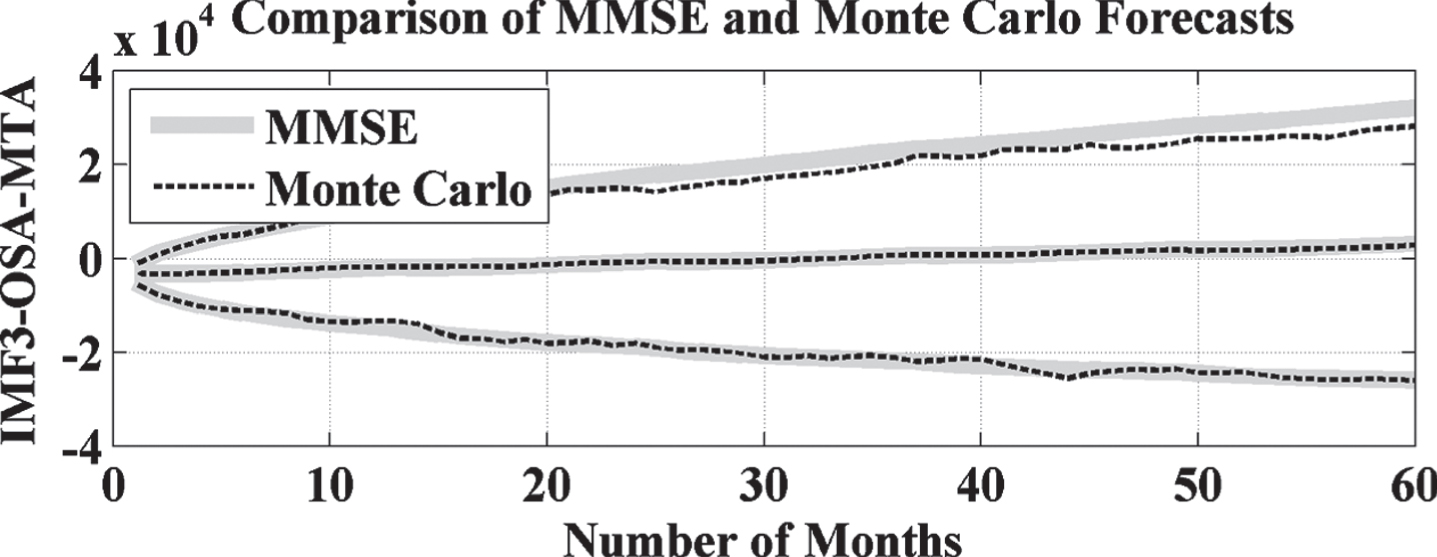
OSA forecasted result comparison with Monte Carlo with IMF3 of EMD.
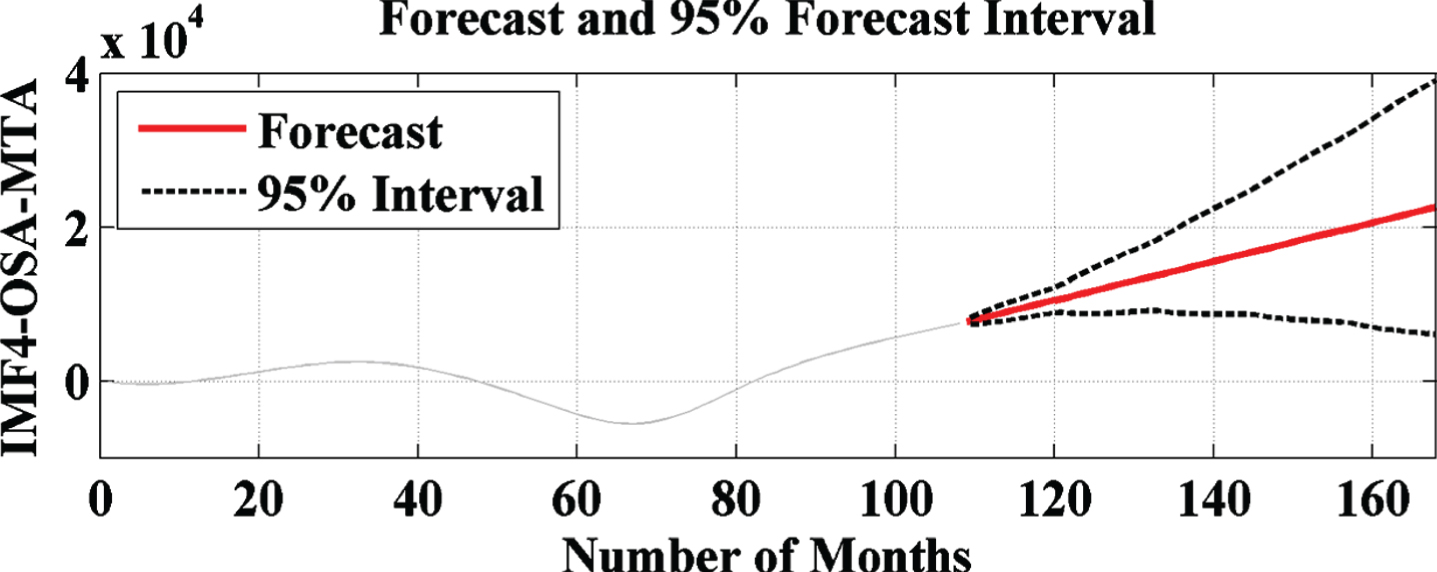
OSA based forecasted result with IMF4 of EMD.

OSA forecasted result comparison with Monte Carlo with IMF4 of EMD.
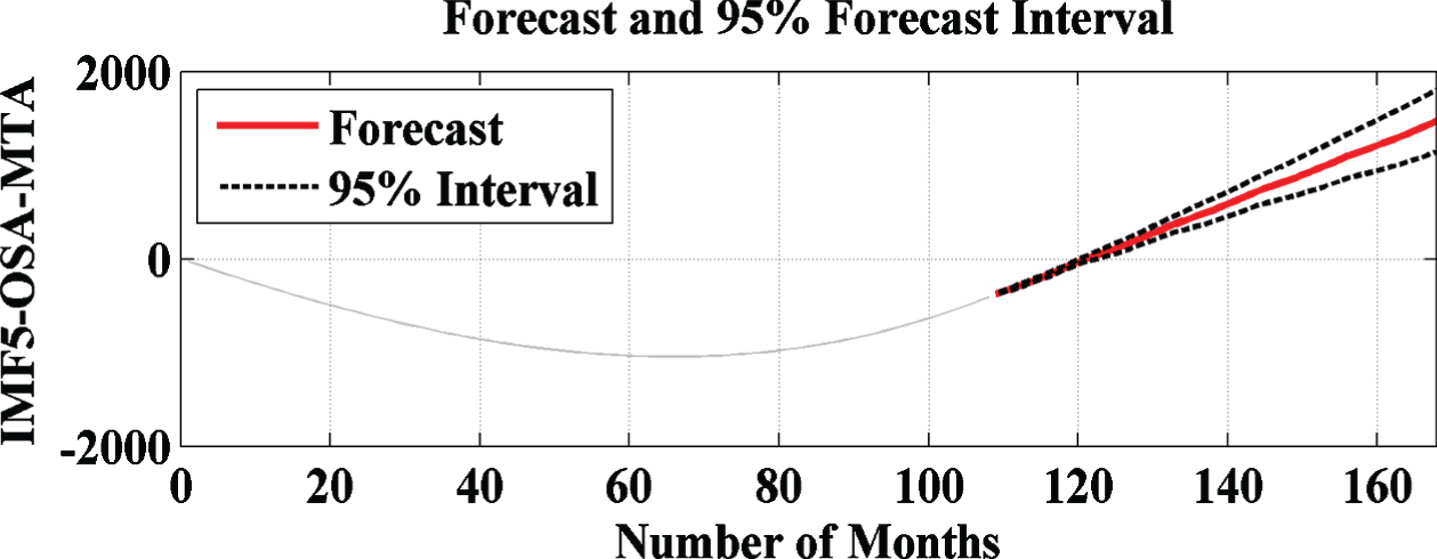
OSA based forecasted result with IMF5 of EMD.
OSA forecasted result comparison with Monte Carlo with IMF5 of EMD.

OSA based forecasted result with IMF6 of EMD.

OSA forecasted result comparison with Monte Carlo with IMF6 of EMD.

TSA based forecasted result without EMD.
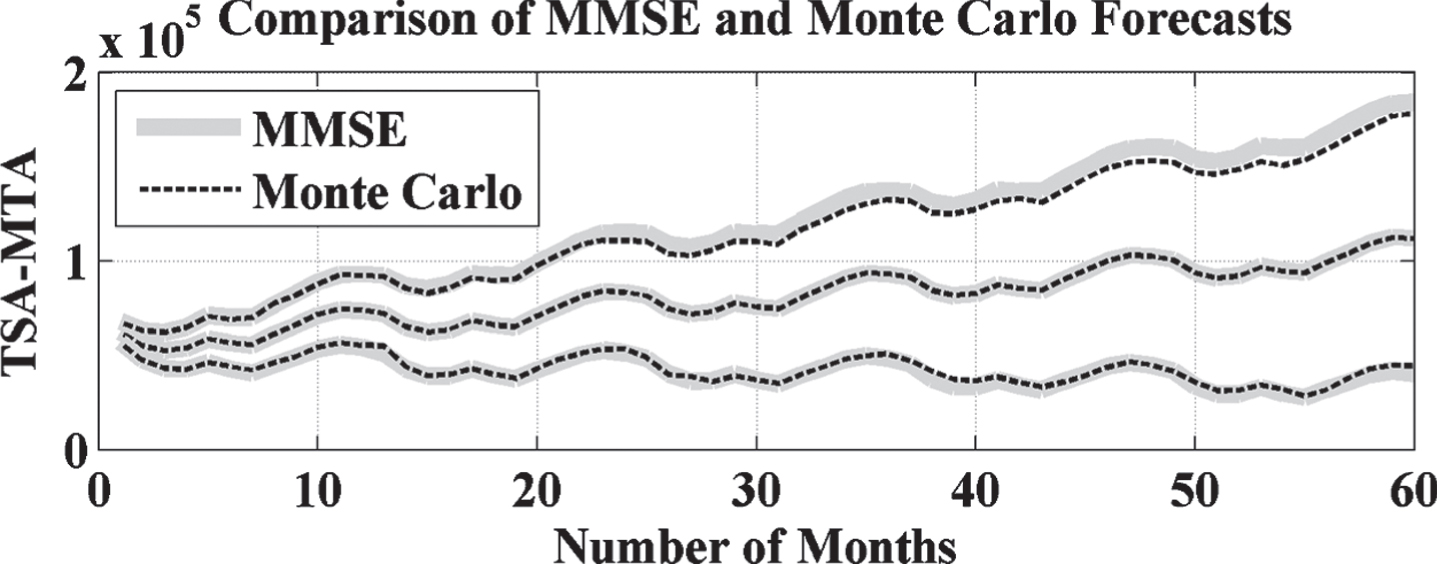
TSA based forecasted result comparison with Monte Carlo without EMD.
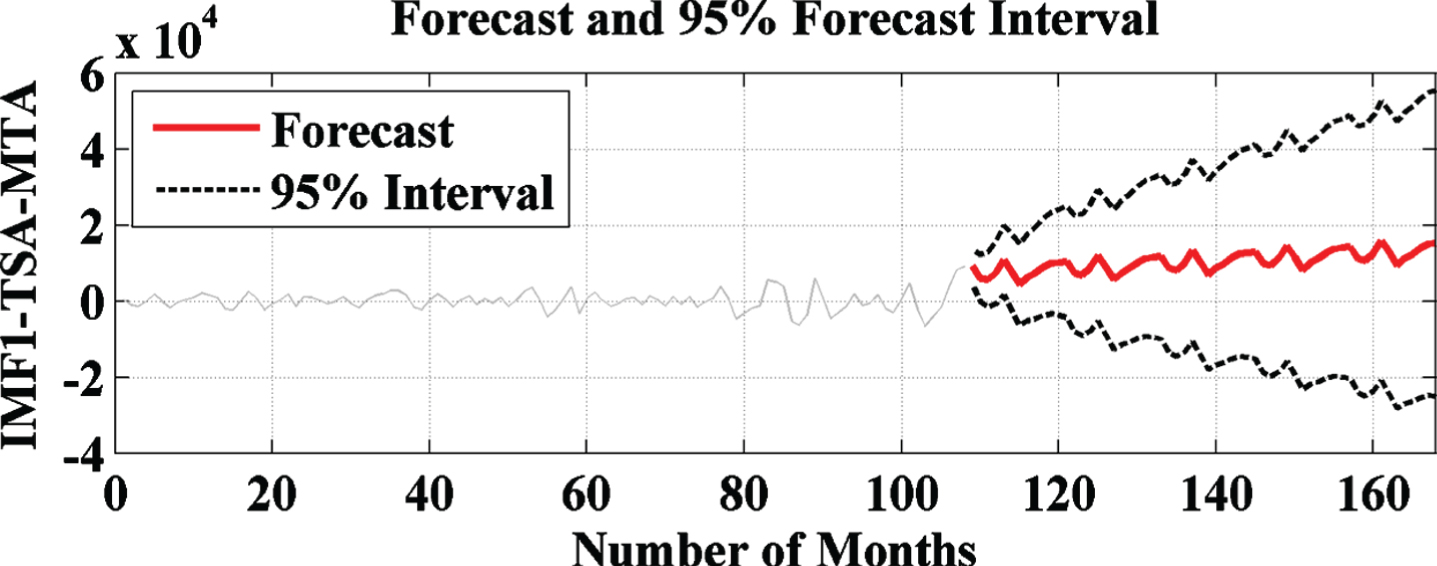
TSA based forecasted result with IMF1 of EMD.
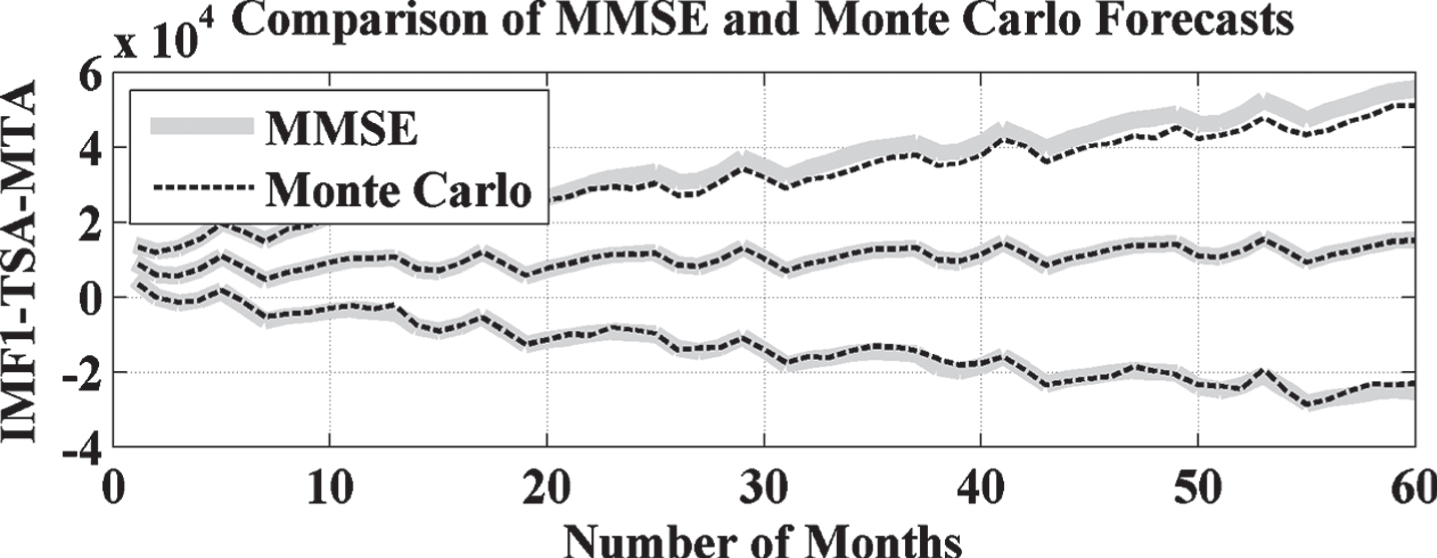
TSA forecasted result comparison with Monte Carlo with IMF1 of EMD.
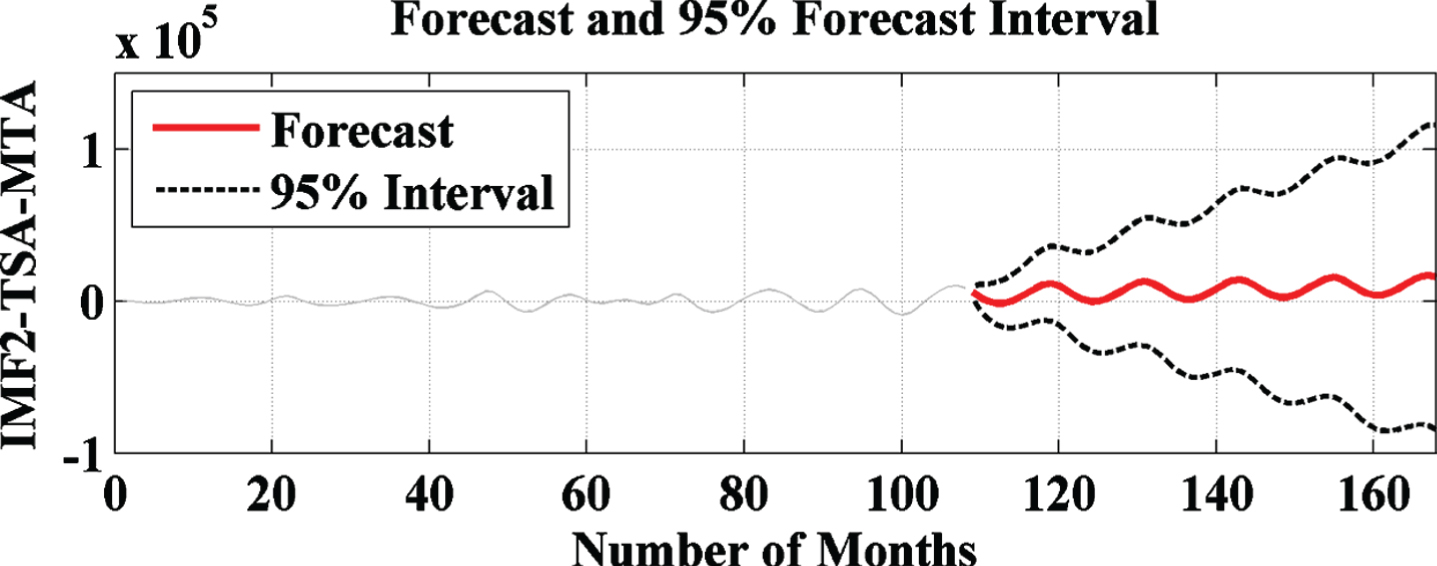
TSA based forecasted result with IMF2 of EMD.
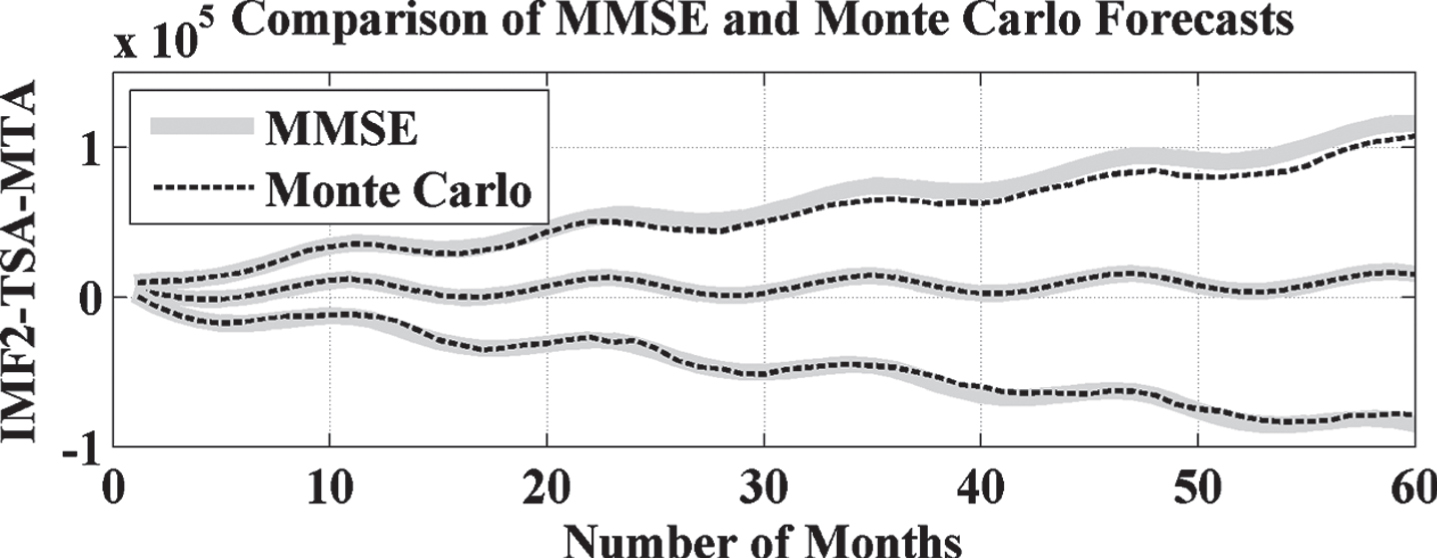
TSA forecasted result comparison with Monte Carlo with IMF2 of EMD.

TSA based forecasted result with IMF3 of EMD.

TSA forecasted result comparison with Monte Carlo with IMF3 of EMD.

TSA based forecasted result with IMF4 of EMD.

TSA forecasted result comparison with Monte Carlo with IMF4 of EMD.
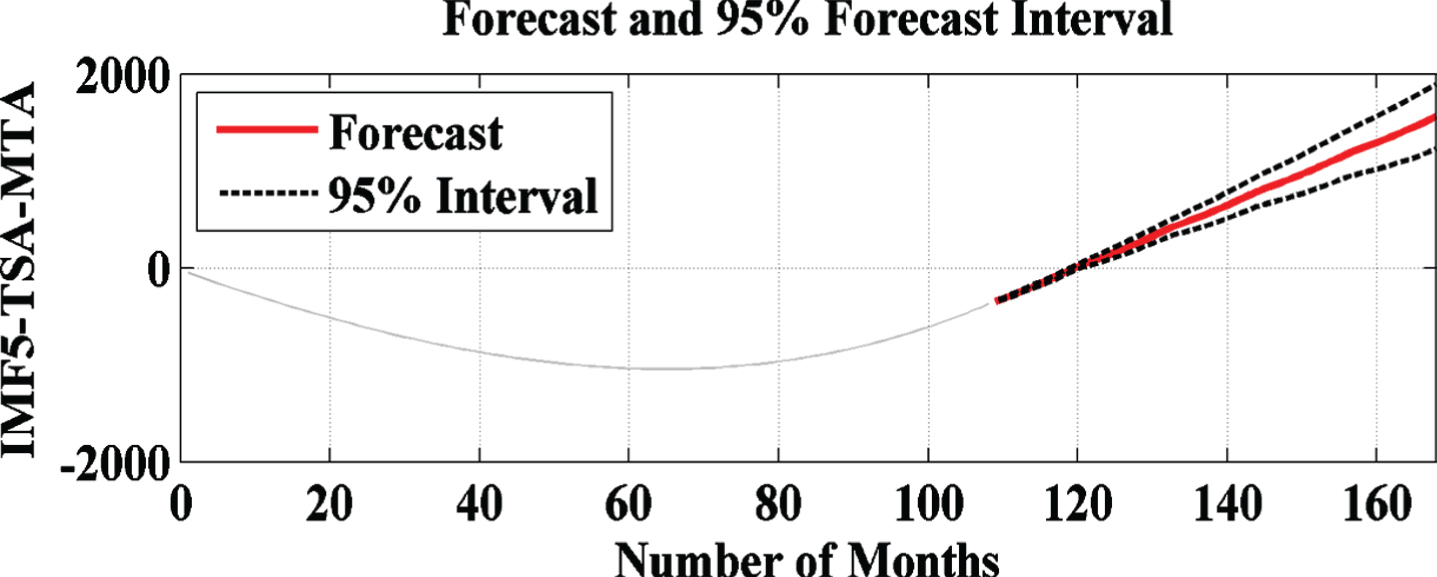
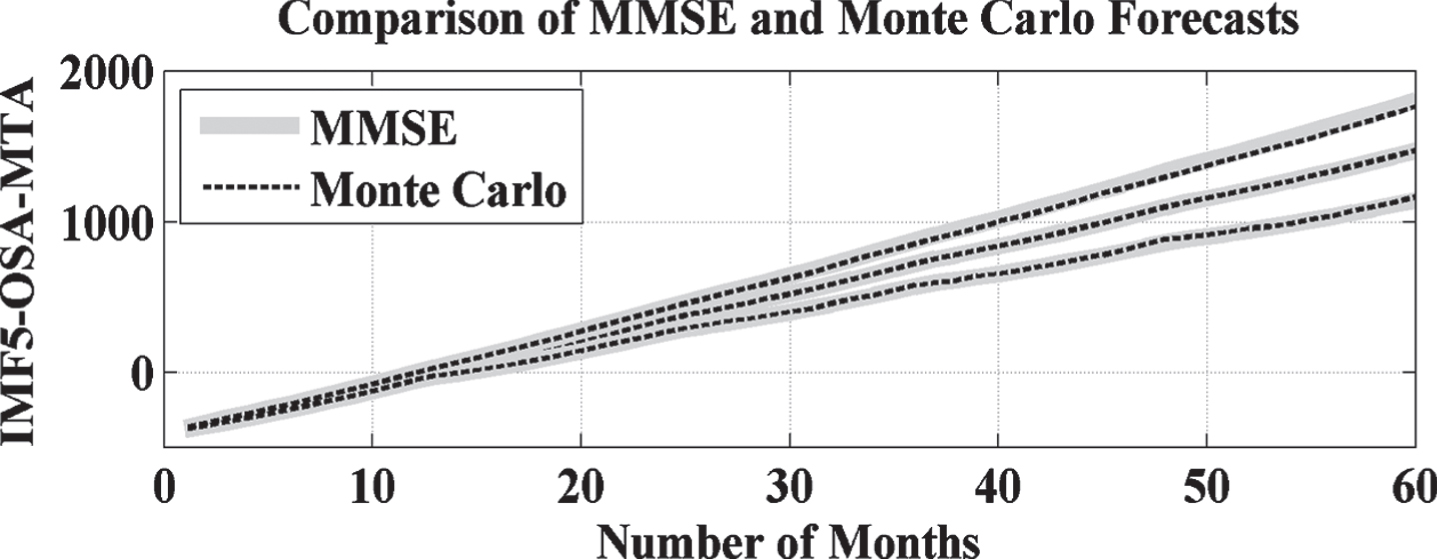
TSA based forecasted result with IMF5 of EMD.

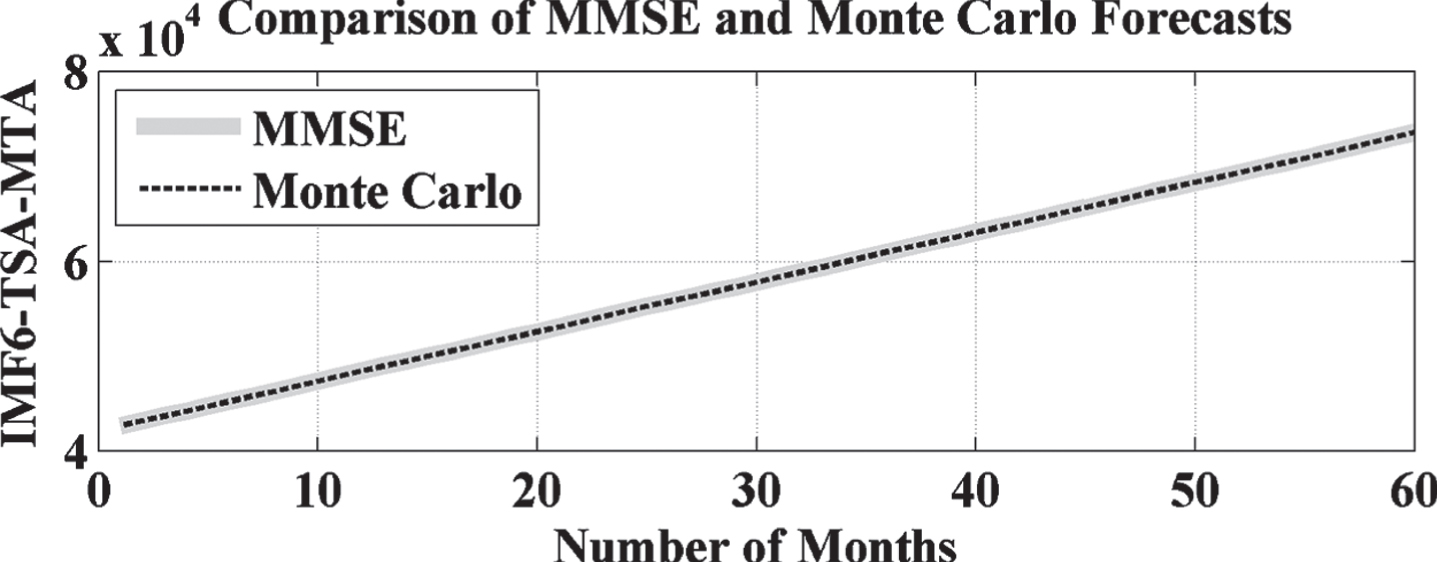
TSA forecasted result comparison with Monte Carlo with IMF5 of EMD.

TSA based forecasted result with IMF6 of EMD.
TSA forecasted result comparison with Monte Carlo with IMF6 of EMD.
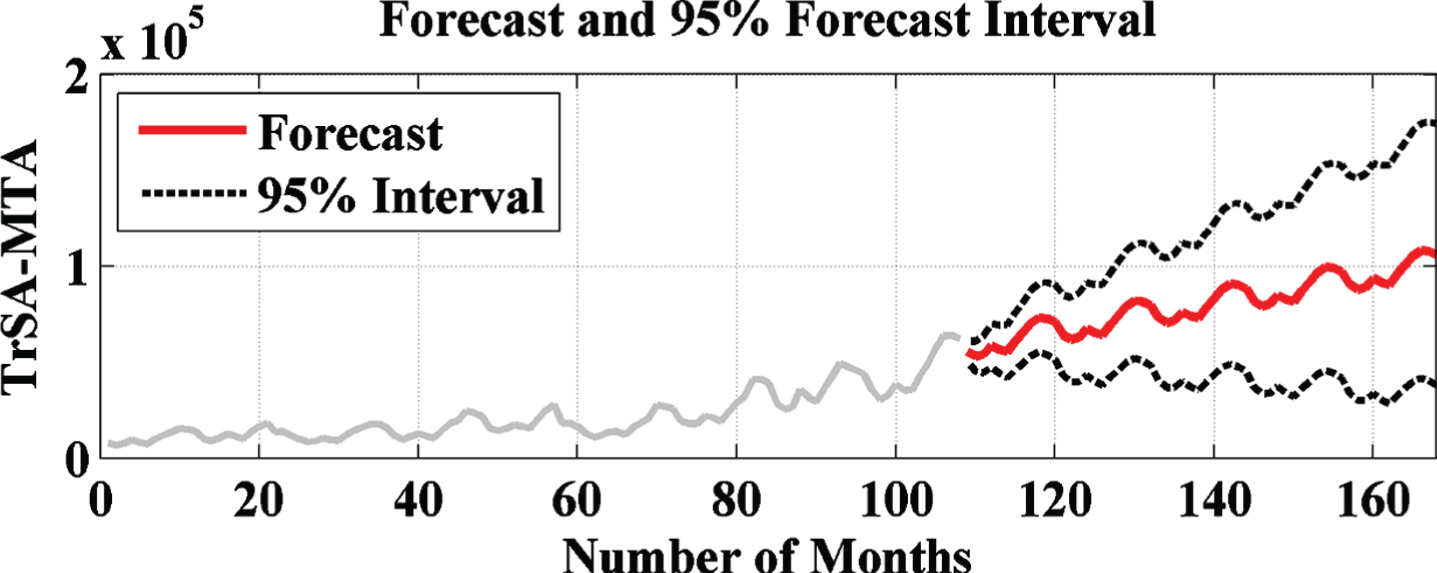
TrSA based forecasted result without EMD.
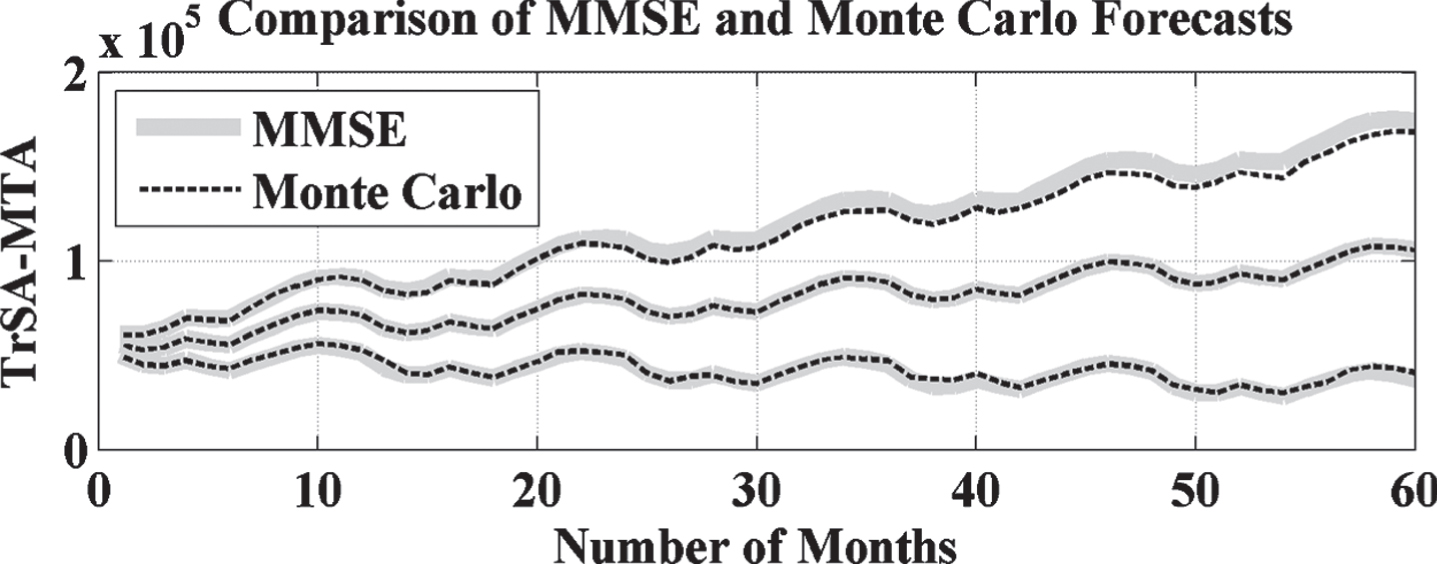
TrSA based forecasted result comparison with Monte Carlo without EMD.
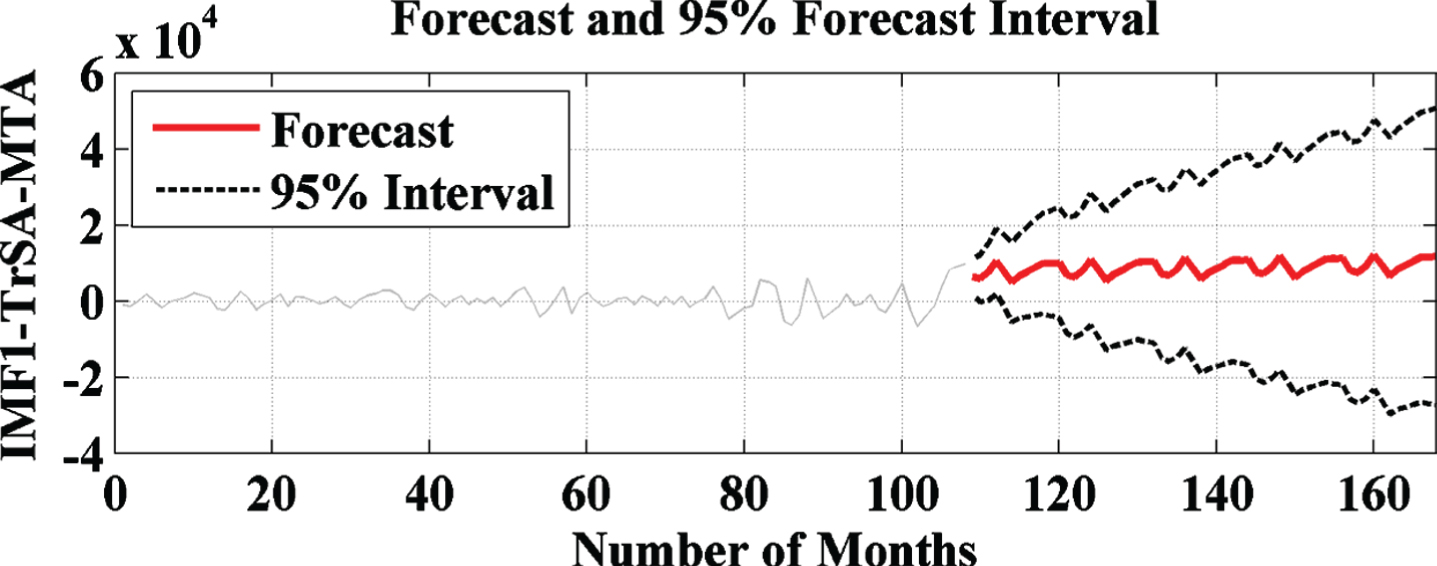
TrSA based forecasted result with IMF1 of EMD.
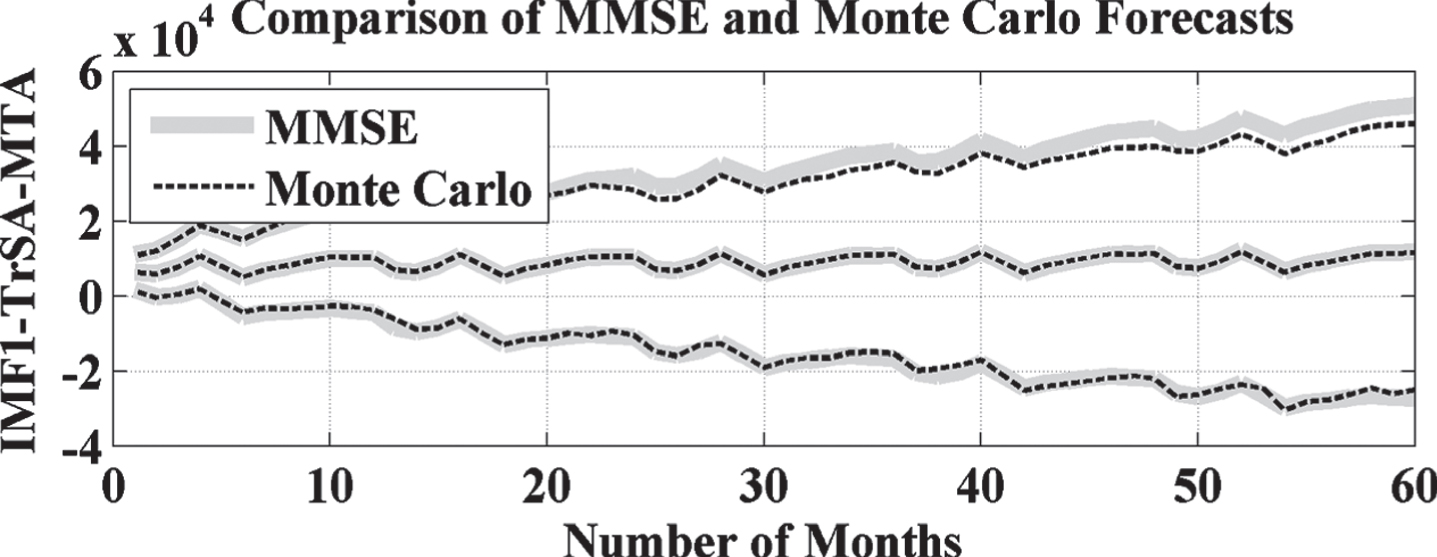
TrSA forecasted result comparison with Monte Carlo with IMF1 of EMD.

TrSA based forecasted result with IMF2 of EMD.
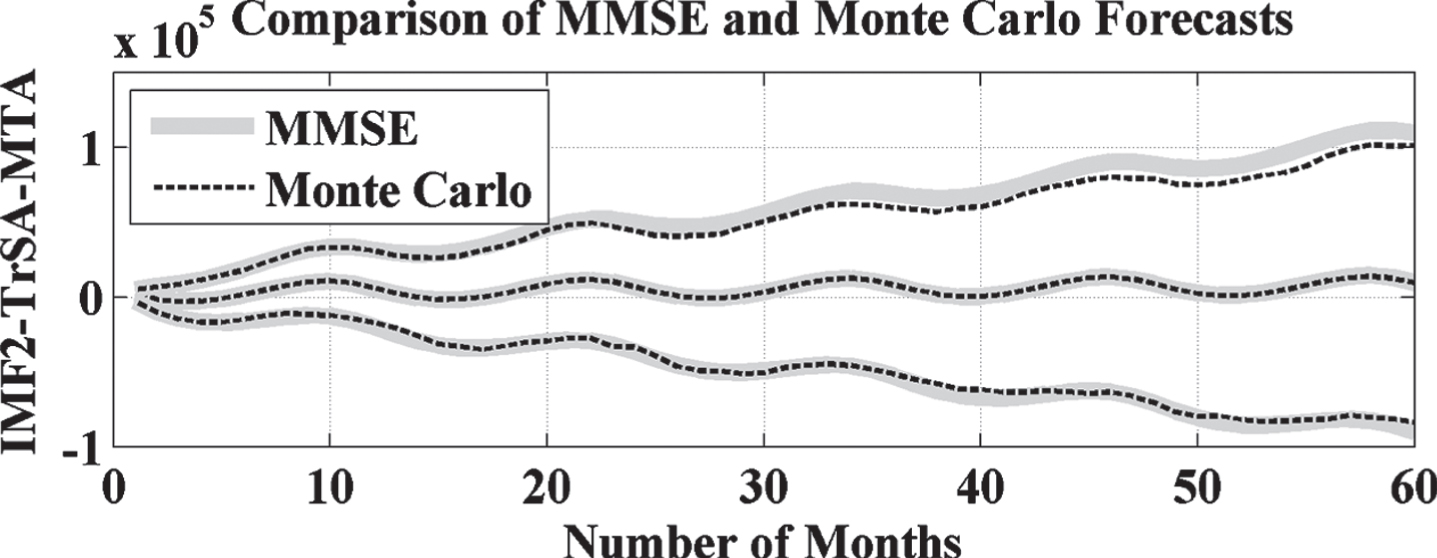
TrSA forecasted result comparison with Monte Carlo with IMF2 of EMD.

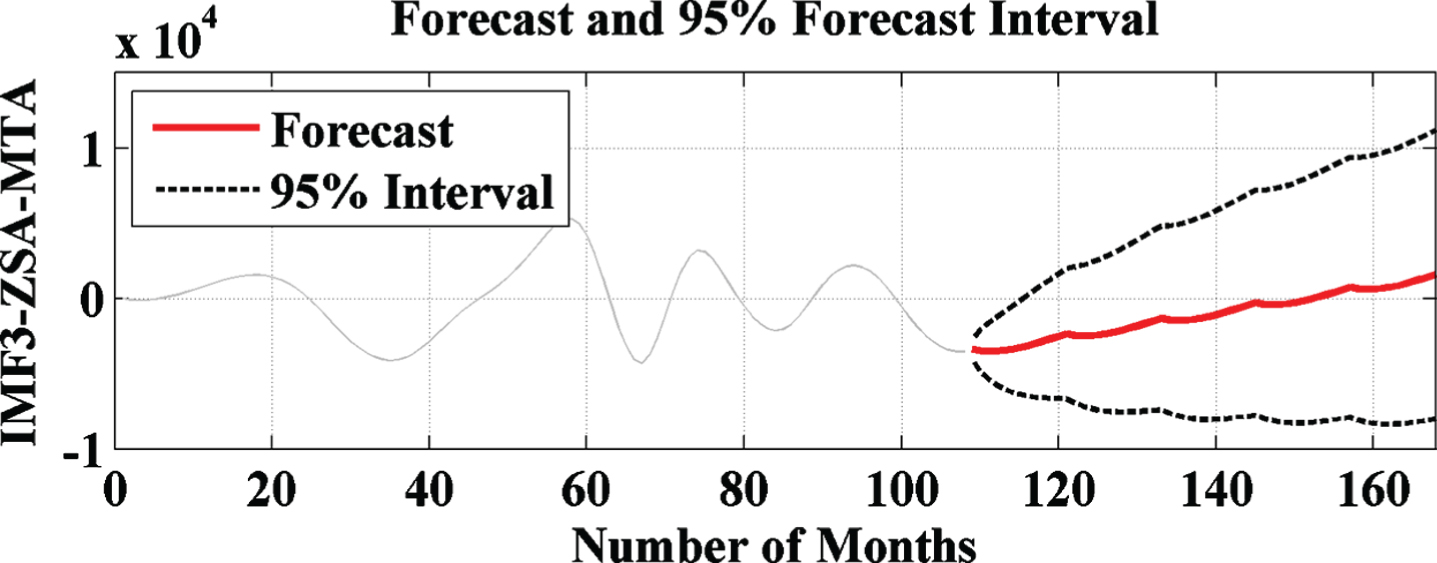
TrSA based forecasted result with IMF3 of EMD.
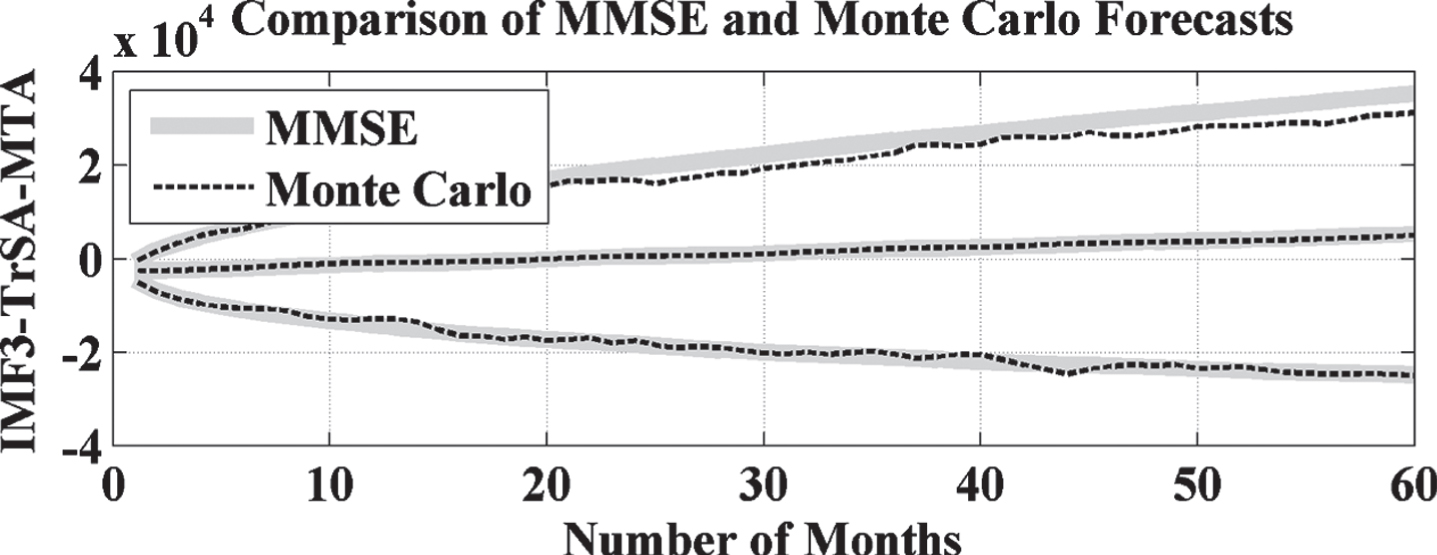
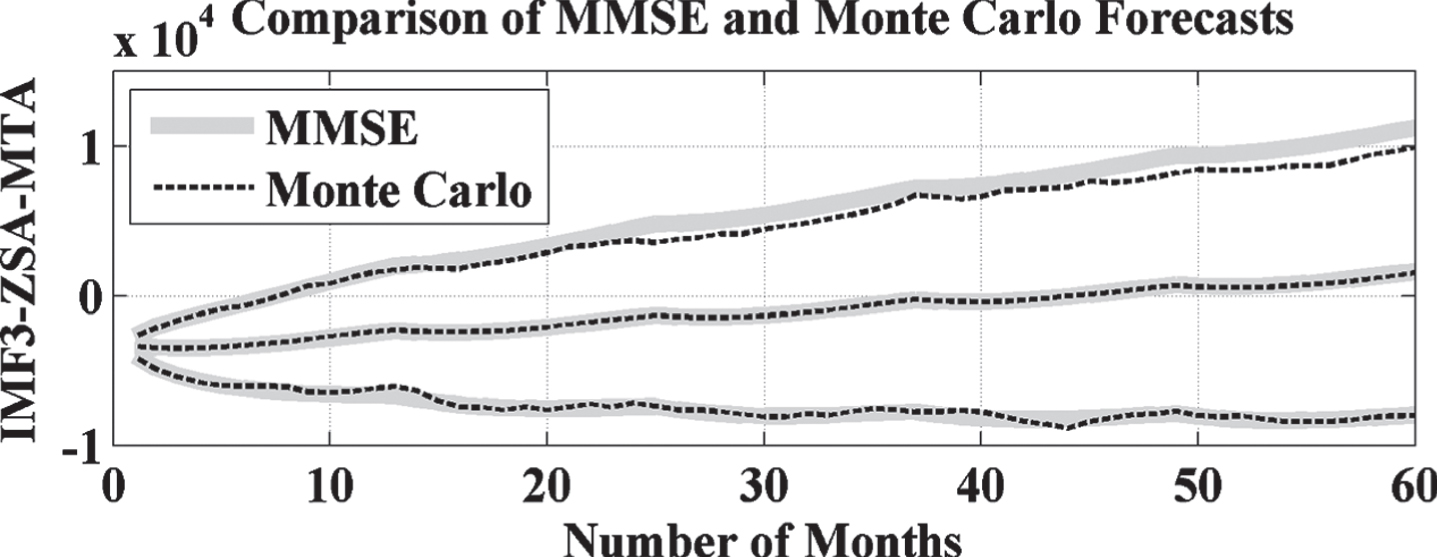
TrSA forecasted result comparison with Monte Carlo with IMF3 of EMD.

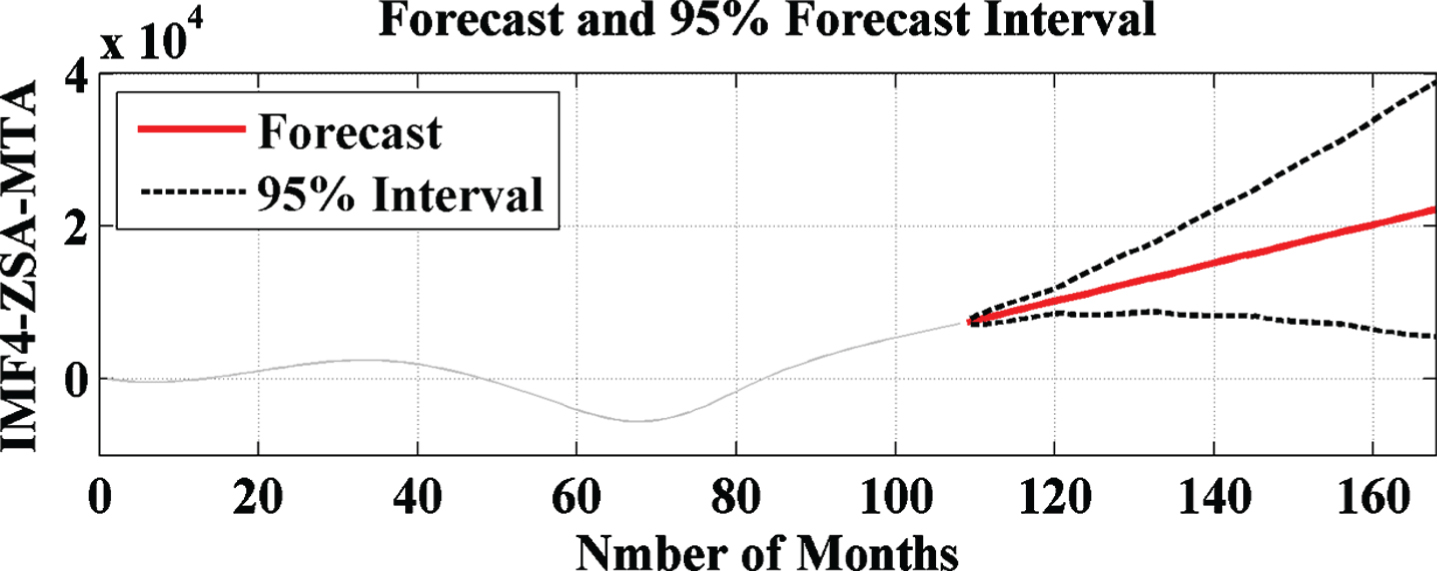
TrSA based forecasted result with IMF4 of EMD.

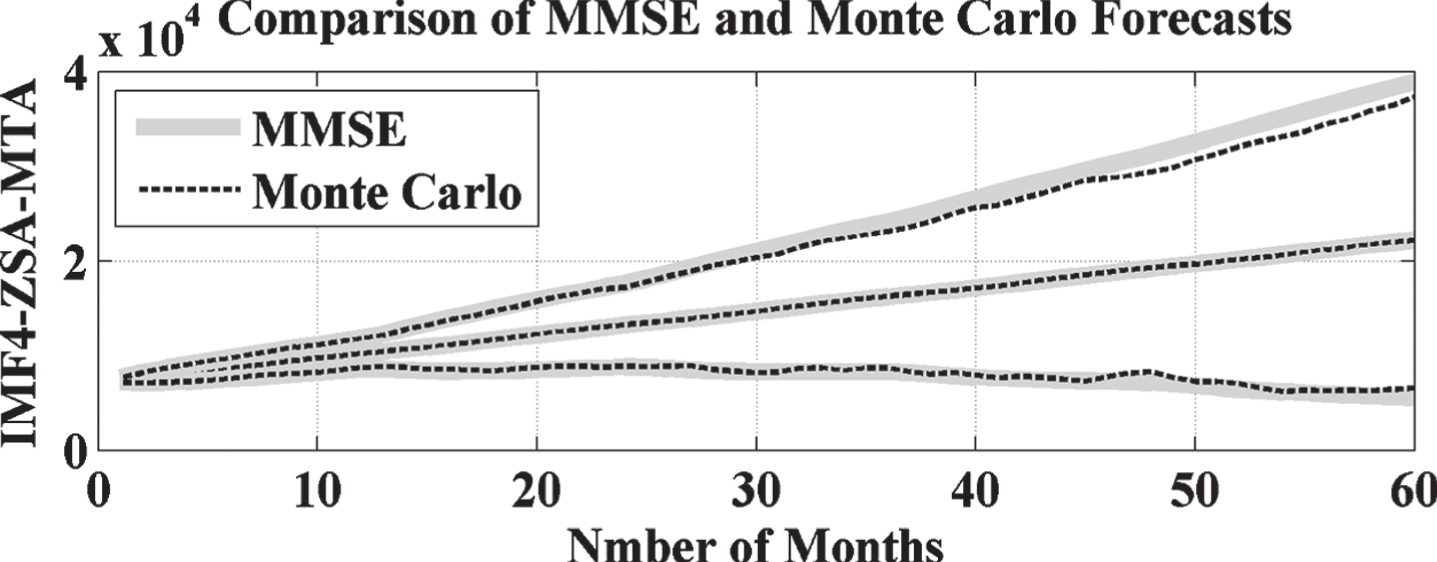
TrSA forecasted result comparison with Monte Carlo with IMF4 of EMD.
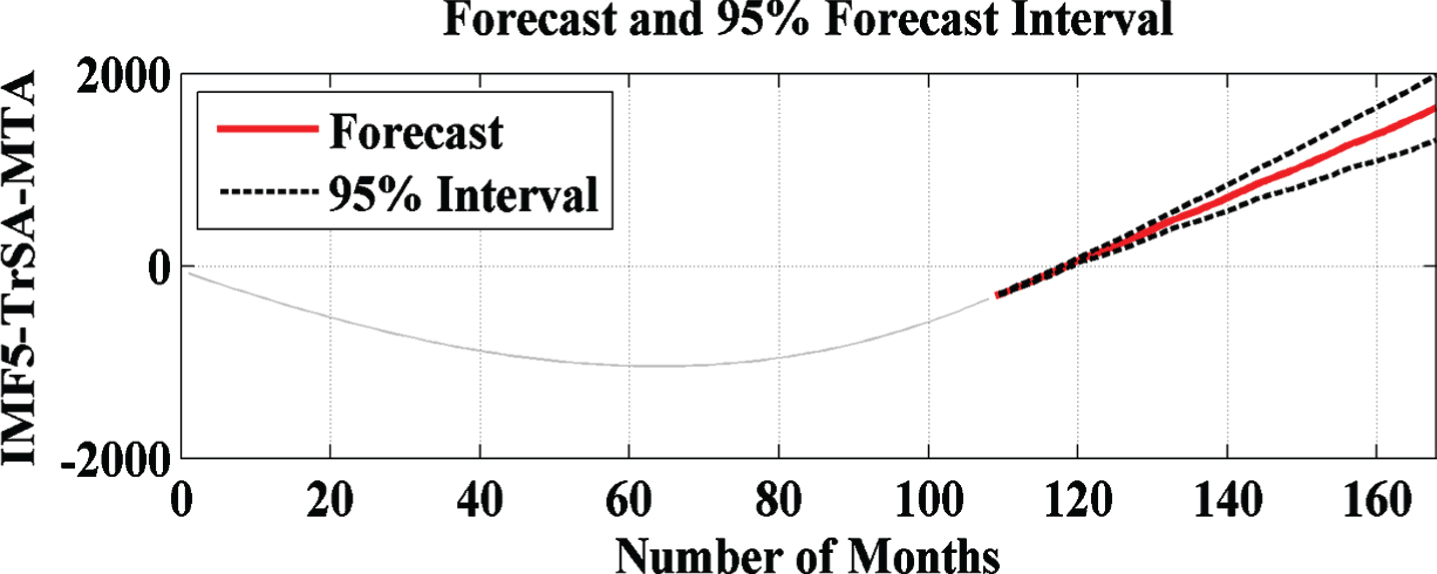
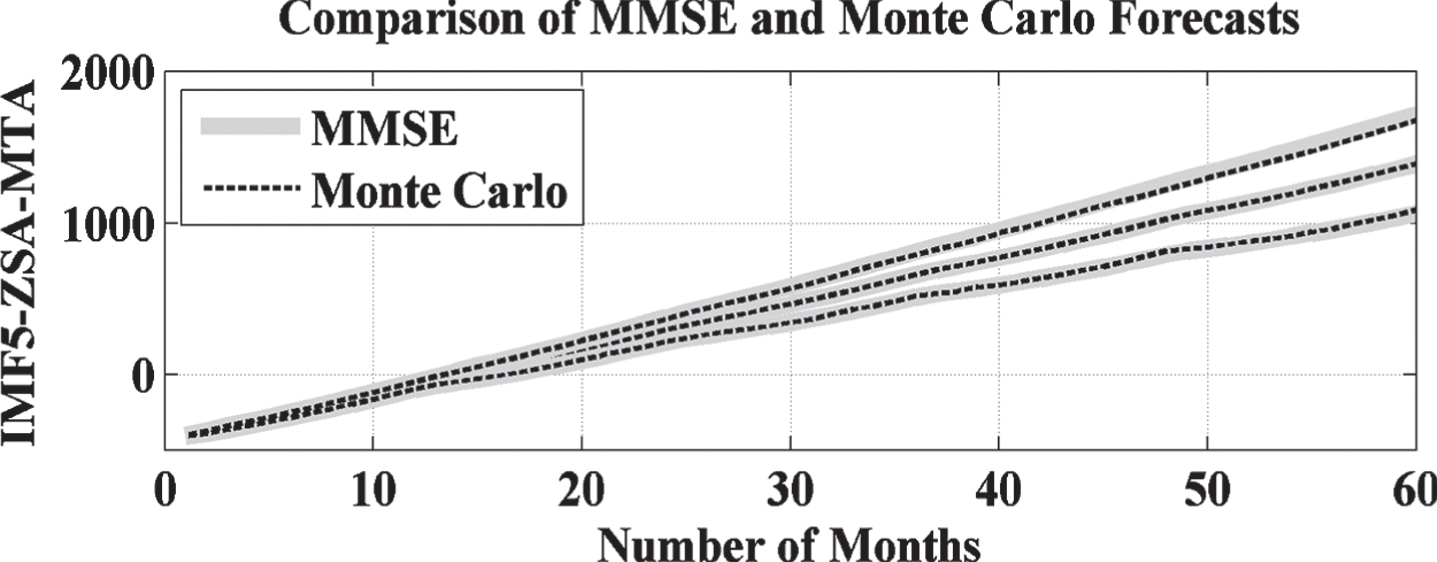
TrSA based forecasted result with IMF5 of EMD.
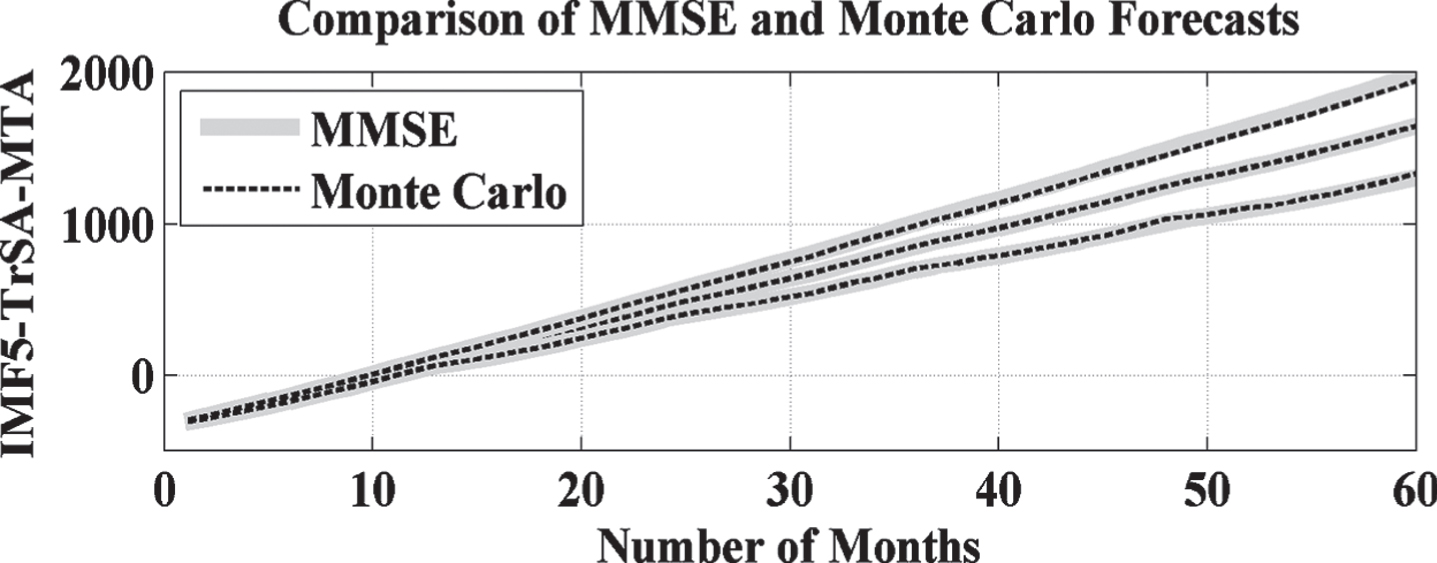
TrSA forecasted result comparison with Monte Carlo with IMF5 of EMD.

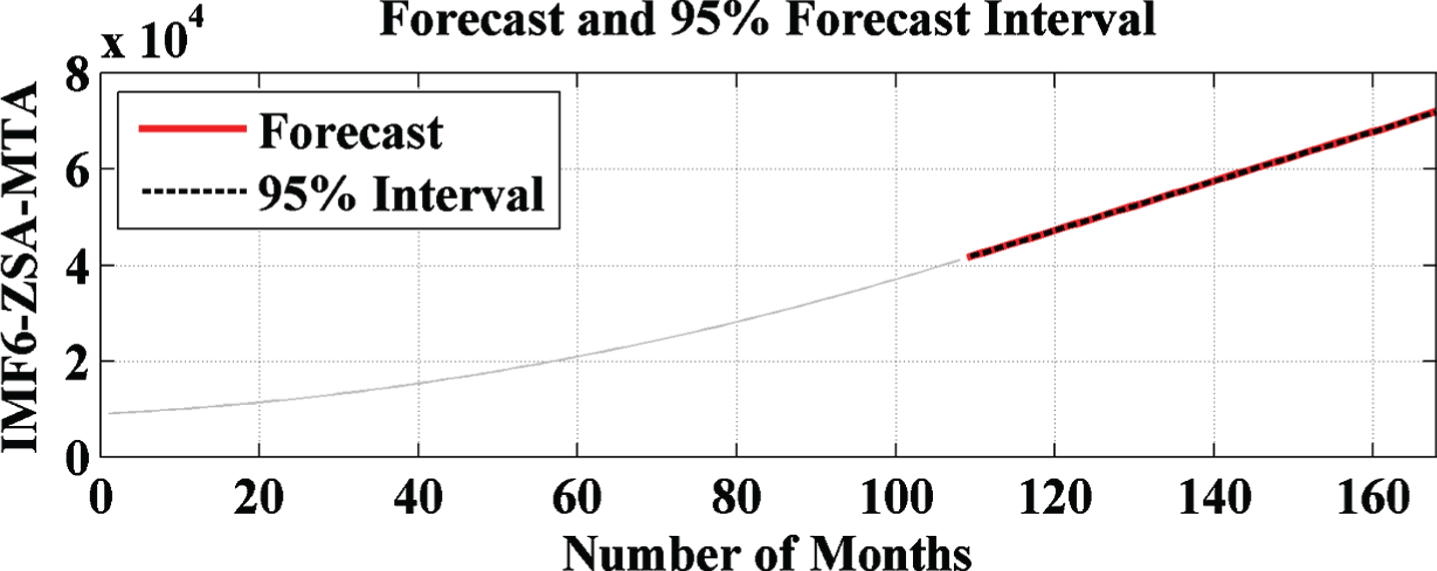
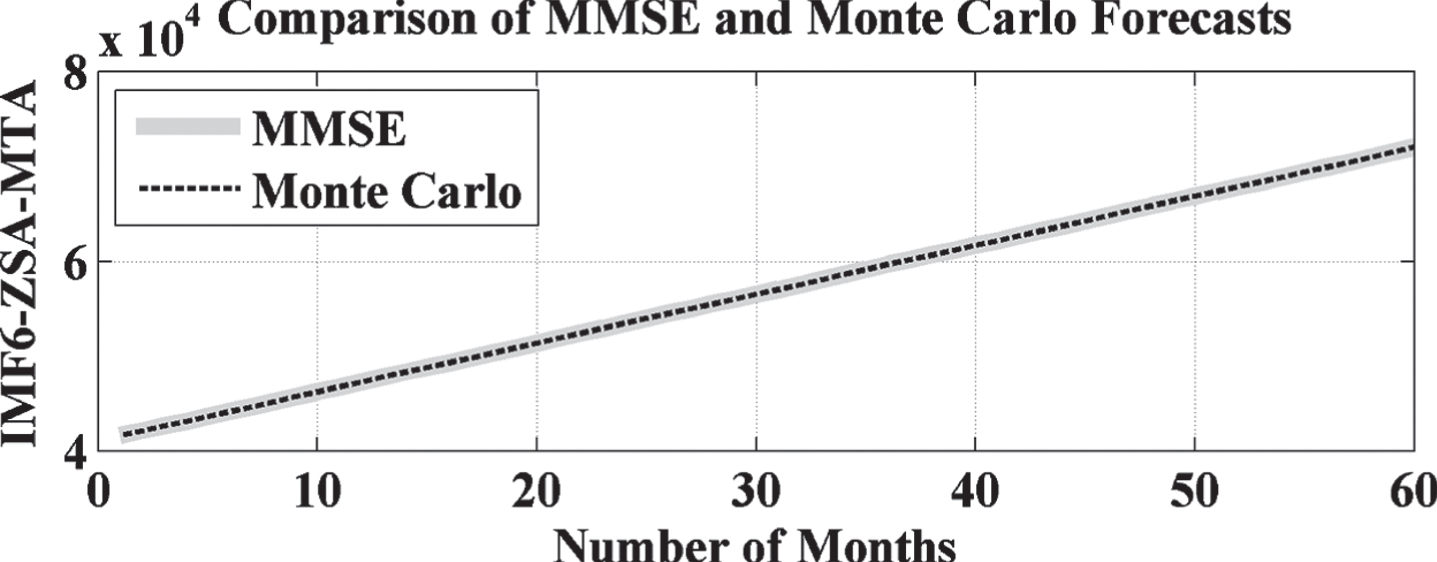
TrSA based forecasted result with IMF6 of EMD.
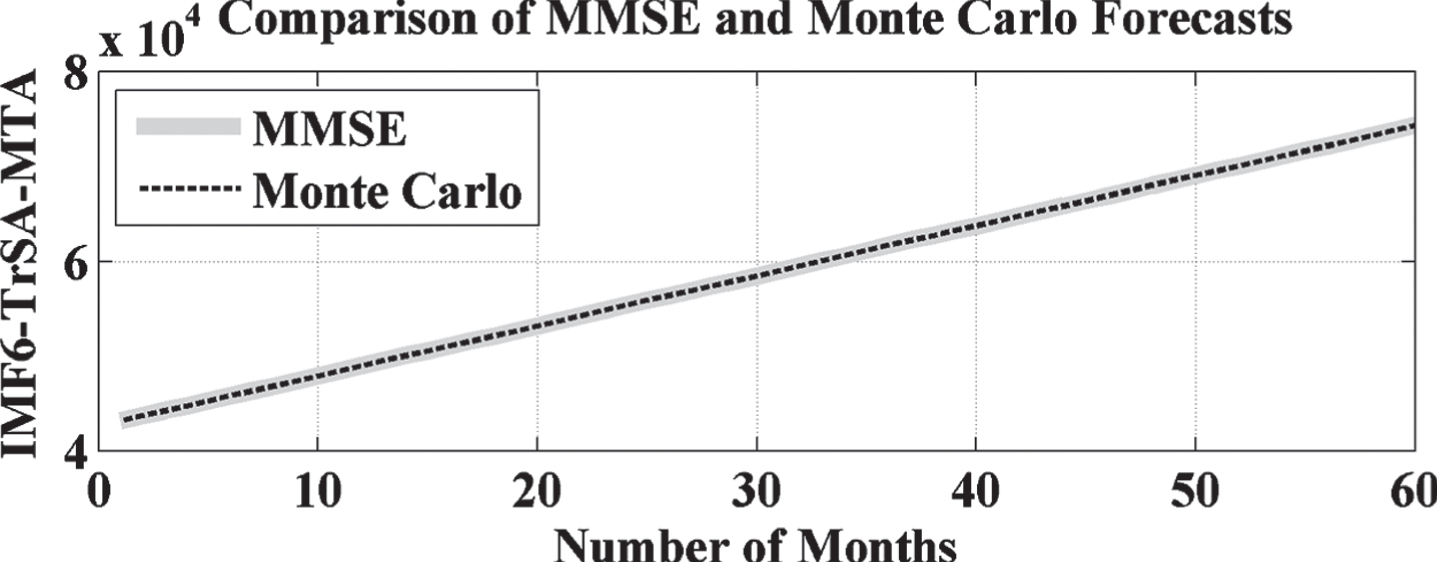
TrSA forecasted result comparison with Monte Carlo with IMF6 of EMD.
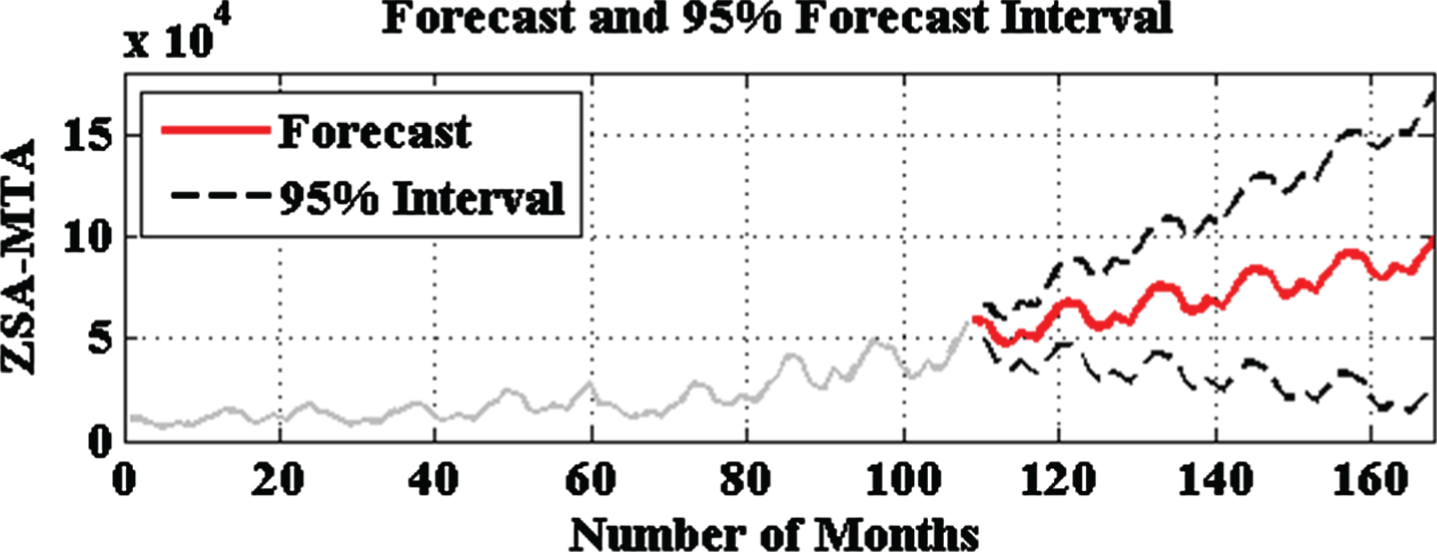
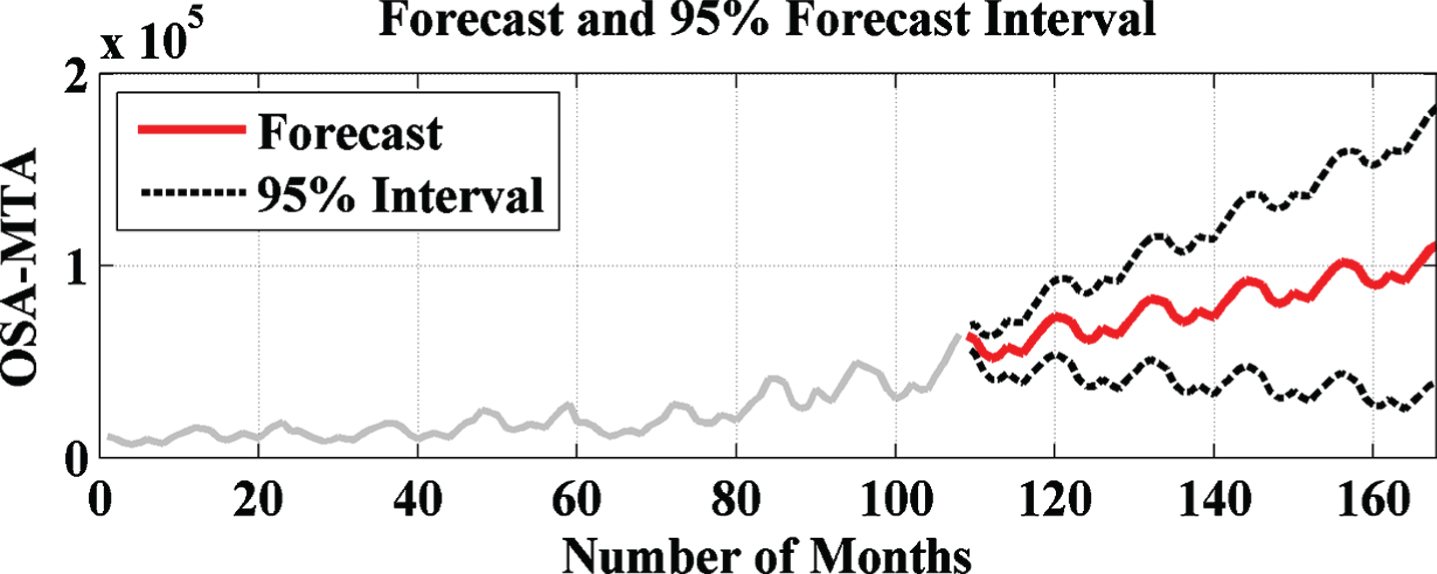
Here, two different types of MTA forecasting graph have been represented. First graph shows the forecasted data in red coloured line with respect to two black coloured line which are the representation of 95% confidence of interval. In this study, all obtained forecasted results are within 95% confidence of interval, which shows the high acceptability level of the proposed approach for MTA forecasting. Second diagram shows the comparative analysis between MMSE and obtained results from Monte Carlo simulation method. This representation shows that correlation between MMSE and Monte Carlo method is very high for all analyzed cases, which are shown in subsequence section for each case study.
The ZSA MTA forecasting without and with EMD is represented in section 6.1.1 and 6.1.2 respectively.
ZSA forecasting without EMD
ZSA forecasting with EMD
One-Step Ahead MTA Forecasting
The OSA MTA forecasting without and with EMD is represented in section 6.2.1 and 6.2.2 respectively.
OSA forecasting without EMD
OSA forecasting with EMD
Two-Step Ahead MTA Forecasting
The TSA MTA forecasting without and with EMD is represented in section 6.3.1 and 6.3.2 respectively.
TSA forecasting without EMD
TSA forecasting with EMD
Three-Step ahead MTA forecasting
The TrSA MTA forecasting without and with EMD is represented in section 6.4.1 and 6.4.2 respectively.
TrSA forecasting without EMD
TrSA forecasting with EMD
After analyzing section 6.1 to section 6.4, it is concluded that developed 28 models (4 models for without EMD and 24 models for with EMD based MTA forecasting) have very high correlation between forecasted and recorded dataset, which can be seen easily in red coloured line of each case. Moreover, obtained results have high confidence of interval and which is validated by the correlation between MMSE and Monte Carlo method for each model.
Conclusions
In this study, a hybrid intelligent approach for multi-step ahead medical tourism forecasting based on EMD, ARIMA and MCS models is proposed. The presented hybrid model unifies the advantages of EMD, ARIMA and MCS models, which are capable to learn both linear as well as nonlinear behavior of the problem or system. The explanatory features are first extracted, and then utilized to forecast the medical tourism with respect to future planning. The multi-step ahead prediction is executed step-by-step manner, utilizing predicted variables 0-step ahead (1 to 1 mapping), 1-step ahead (1 month), 2-step ahead (2-months) and 3-step ahead (3 months) forecasting. The hybrid approach is implemented utilizing real recorded data from whole nation of India. The performance demonstration of the proposed hybrid model is furnished and a comparative analysis has been performed. The obtained results represent the acceptability level of the proposed hybrid intelligent model outperforms.
Footnotes
Acknowledgments
“The authors extend their appreciation to the Faculty of Business and Management, Universiti Sultan Zainal Abidin (UniSZA) Malaysia for providing necessary facilities to this research work"
“The authors extend their appreciation to the Intelligent Prognostic Private Limited, India for providing necessary financial support to this research work”