
Abstract
It is quite alarming that the increase of glaucoma is due to the lack of awareness of the disease and the cost for glaucoma screening. The primary eye care centers need to include a comprehensive glaucoma screening and include machine learning models to elaborate it as decision support system. The proposed system considers the state of art of eye gaze features to understand cognitive processing, direction and restriction of visual field. There is no significant difference in global and local ratio and skewness value of fixation duration and saccade amplitude, which suggest that there is no difference in cognitive processing. The significance value of saccadic extent along vertical axis, Horizontal Vertical ratio (HV ratio), convex hull area and saccadic direction show that there is restriction in vertical visual field. The statistical measures (p < 0.05) and Spearman correlation coefficient with class label validate the results. The proposed system compared the performance of seven classifiers: Naïve Bayes classifier, linear and kernel Support Vector classifiers, decision tree classifier, Adaboost, random forest and eXtreme Gradient Boosting (XGBoost) classifier. The discrimination of eye gaze features of glaucoma and normal is efficiently done by XGBoost with accuracy 1.0. The decision support system is cost-effective and portable.
Introduction
Glaucoma is a class of diseases that indicates irrevocable and continuous damage to the optic nerve. The aqueous outflow system of the eye is compromised, thereby leading imbalance in aqueous production and drainage. This results in increased intraocular pressure and damages the optic nerve. The central vision may be clear, but a scotoma (blind spot) will appear in the peripheral vision. Most patients have no early symptoms or feel pain and hence the disease goes unnoticed at the initial stages. If one eye is affected by this disease, the person may not feel any change in performing the day-to-day activities i.e. the Quality of Life (QoL) [1]. Glaucoma patients have low mean scores in social HRQoL (Health-Related Quality of Life) questionnaires than other eye diseases such as cataract, refractive errors [2]. According to the statistics by the Glaucoma Society of India, 11.2 million people in India are affected by the disease and account for 12.3% of total blindness in the country, of age 40 years and older [3]. One-fifth of the glaucoma burden is in India and the sad part is more than 90 percent of cases of glaucoma remain undiagnosed in contrast to 40–60 % in developed countries [4]. Regular examination and screening of glaucoma is necessary to find out glaucoma at an initial stage. Even though there are many eye hospitals in urban India, primary eye care centers for diagnosing such complex diseases are not established. Recently, India has provided the eye health pyramid from tertiary, secondary, and primary vision centers to improve access to eye health care facilities [5].
In primary eye care centers, an ophthalmic technician or optometrist performs regular eye examinations such as testing vision, pupil function, and refraction tests in patients. The secondary eye care centers, specialists do surgical interventions and glaucoma services. In tertiary eye care centers, super specialists do handle complex cases, perform surgeries and rehabilitation. Regular glaucoma check-ups in the hospital setup include structural glaucoma test –Tonometry, Ophthalmoscopy, Gonioscopy, Pachymetry, Optical Coherence Tomography (OCT), and functional glaucoma test –Perimetry. Clinicians combine both types of glaucoma tests to diagnose the disease. However, there is always an area of doubt that requires re-confirmation by repeated tests. For performing all these tests, a lot of technical knowledge and co-operation of participants is necessary. In the rural part of India, primary eye care centers do not have a screening test for glaucoma due to the cost of machines, technical skill required for technicians, and work environment for placing machines and the whole system. In India, there is a huge shortage of specialists with less than one for one lakh people. A feasible solution is necessary for performing glaucoma screening in primary eye care centers.
Related work
Eye tracking helps healthcare professionals to better understand eye movements and defects in the field of vision (visual field), and develop a means to diagnose abnormalities or ocular diseases in clinical situations. It is important to take attention to Quality of Life (QoL) in terms of the emotional as well as a psychological condition of patients in addition to their physical health. The binocular visual field loss will affect the QoL of patients as the disease worsens [6]. Individuals with glaucoma compensate for visual field (VF) loss compared to age-matched visually healthy participants by doing more saccades/sec in the search experiment with photographs of everyday scenes [7]. Wiecek et al. [8] reported that the search performance is influenced by the saccade direction. In Smith et al. [9, 10] study, some participants show compensatory behavior by making more saccades per sec to perform well in visual search. Crabb et al. [11] have identified the signature of vision loss by understanding the saccade map of glaucomatous patients. Since the level of attention, personality and health are always confounding factors, Afsaw et al. [12] have investigated eye movement patterns between the affected eye and less affected eye and understood that the affected eye makes more revisits with saccades and reduced fixation distribution than the less affected eye. Tatham et al. [13] have shown that glaucoma patients show lower and less accurate saccades while performing visual perimetry.
In the past works, there is a limitation of an automated model that discriminates glaucoma from normal people and most of the works are done using high-end eye trackers. Some works are done in fundus or eye images using machine learning models, but the machine learning model for the visual field is limited. Acharaya et al. [14] have proposed a decision support system using Gabor feature extraction from fundus images. Principal components are ranked using a space algorithm and then fed to supervised classifiers. A transfer learning-based CNN approach is applied on fundus images to compute features and random forest method is applied to combine those features [15].
The proposed work created a cost-effective intelligent based decision support system that could assist health care professionals in primary eye care centers to understand visual field loss by analyzing the restriction and direction of the visual field and excluding deficits in cognitive processing. The system calculates comprehensive eye gaze measures of glaucoma for early diagnosis. The visual field loss (scotoma) is identified by displaying a visual exploration task that includes natural scene images such as social images, non-social scenes, and background scenes, which matches their day-to-day life. The proposed work is different in terms of recruitment of participants which include glaucoma deficit with different severity levels - mild, moderate, and severe in each eye.
Materials and methods
Participants
The proposed work analyzes different oculomotor parameters to understand how they engage in a particular task over time. The study is carried on participants diagnosed with glaucoma by the standard test (clinical evaluation, visual field test, imaging techniques) and the same number of age-related controls. The study is conducted on adults with an age group of 36–60 years and no constraint on gender. All participants underwent visual acuity assessment, comprehensive clinical evaluation, and perimetry with 24–2 program using Humphrey Field Analyzer (HFA). Glaucoma Hemifield Test (GHT) on the perimetry provides the label of ‘outside normal limits’ for glaucoma participants. The glaucoma is diagnosed as mild, moderate, and severe based on the Visual Field Index (VFI) [16].
Apparatus
The overview of the experimental setup is shown in Fig. 1. The experimenter or person who is conducting eye tracking experiment asks the participants to binocularly view twenty free-viewing Indian-based images displayed for 4 secs and each image is intervened with a central dot displayed for 1 sec to get the attention to the center of the screen. The distance of the participant from the monitor is maintained for 60 cm. A non-invasive eye tracker Eyetribe 30 Hz with accuracy 0.5° and spatial resolution 0.1° is attached to the screen. It uses infrared illumination to capture the eye movements of the participants when viewing the stimulus on the computer screen. Before starting the experiment, 9-point calibration is run to get Pupil-Corneal Reflex (PCR) of participants and if required, recalibration is done to get the pupil position correctly. The images are selected from the CAT2000 benchmark dataset (selected Indian-based images) and from Bing Images which are displayed on a laptop.
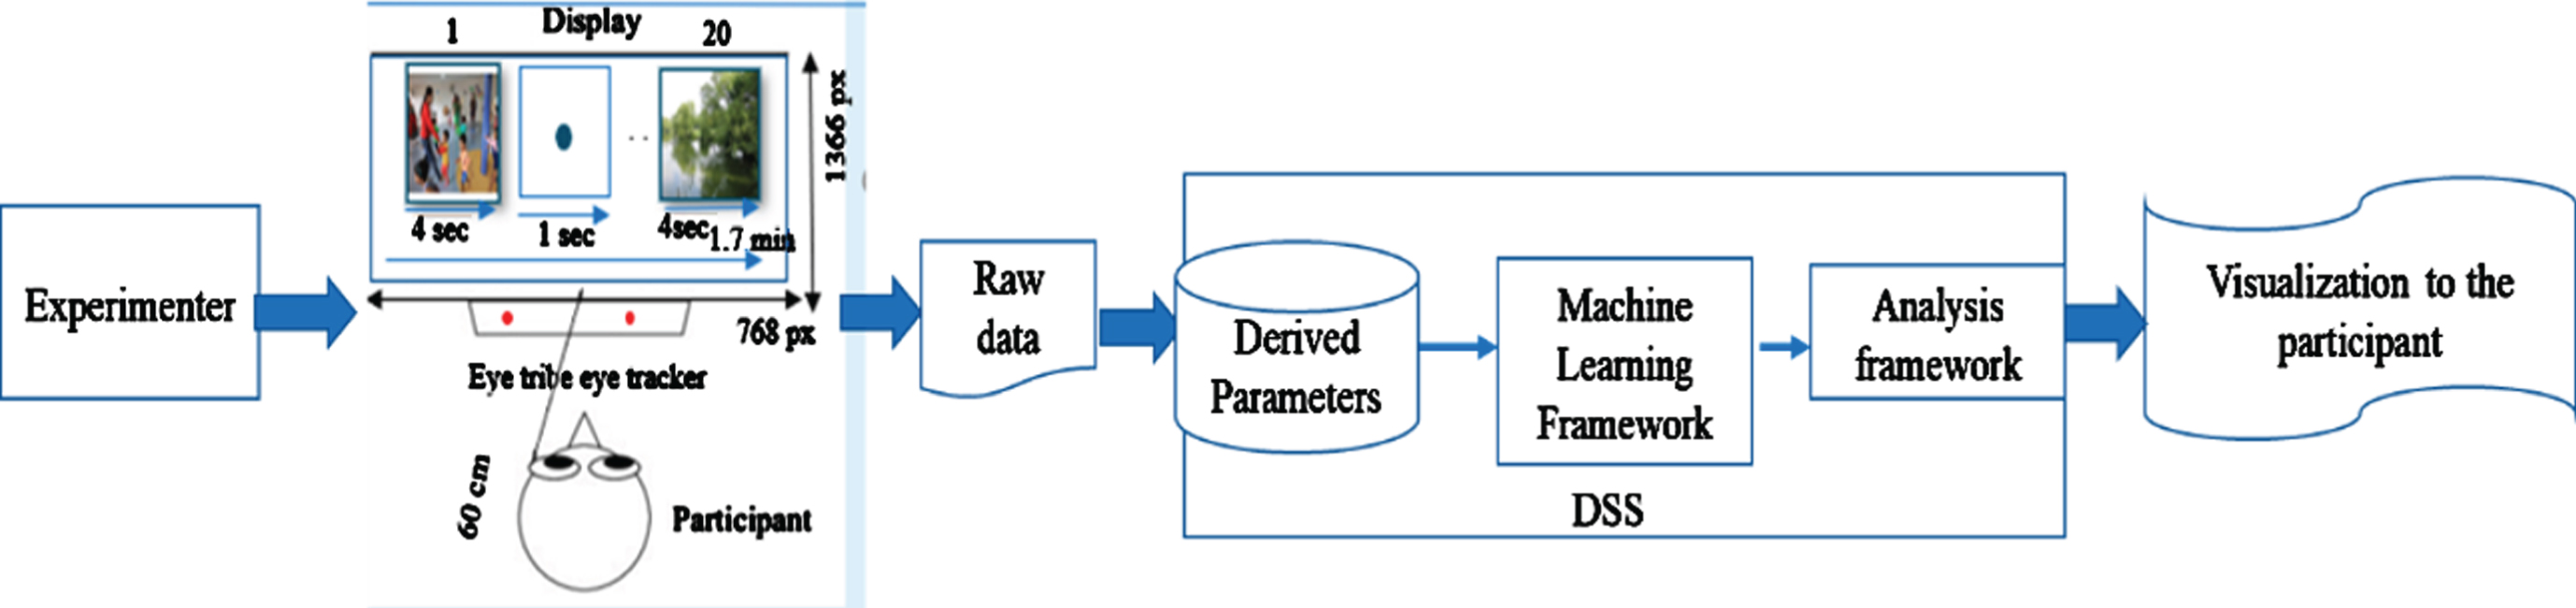
Overview of the proposed system.
The task is to freely view the images that include natural scene images, bus stop, market, traffic signal that are color and gray-scale images and displayed 1366X768 to the size of the screen. Some images are inverted and random noise is applied to get attention from participants. At the end of the experiment, the eye tracker will provide raw data. The customized program is written in Python3, which calculates comprehensive derived parameters from raw data. These parameters are fed to the Decision Support System (DSS), which is established using open-source software Anaconda3 (64 bit) written in Python3 language. The program is written using advanced libraries such as Seaborn and Sckitlearn. DSS includes machine learning models which include probabilistic classifier, linear and nonlinear classifier, tree-based classifier, and ensemble methods. The analysis framework compares the accuracy of different models. The underlying framework discriminates eye gaze features related to cognitive processing, direction, and restriction of the visual field and generates an average fixation map, convex hull map, and visualization to the participants. No report is generated from the system as it does not compare with any clinical measures. The customized software can be installed on any computer in the primary eye care centers.
Basic Eye Parameters
The open-source software OGAMA 5.0 [17, 18] that is installed on the laptop estimates basic eye gaze parameters from eye gaze samples.
The basic eye gaze parameters include fixations and saccades. Fixation is a cluster of eye gaze samples that are still in the position of the screen at a certain point of time. Saccades are the movement of the eye that moves from one fixation to another fixation.
Derived eye parameters
The derived parameters are estimated using the customized software. The following are the parameters:
Fixation Count (FC) is calculated as the number of fixations done by the participant while viewing a stimulus [19]. Participants with visual field defects show a higher number of FC than normal participants to compensate for their vision defects. Saccade Count (SC) is calculated as the number of saccades made by the participant while viewing a stimulus. Sometimes the participant needs to make revisits (Revisit count) on already visited areas to understand the semantic importance of the stimulus. Saccadic rate is calculated as the number of saccades made by the participant per second, and it is also known as eye movement rate. Saccade Amplitude (SA) is the distance travelled by a saccade or magnitude of the saccade. Fixation Duration (FD) is the duration taken by the eye to be still in a particular area. While viewing the stimulus, participants show a smaller number of fixations and a higher number of saccade amplitude to understand visual information and later fixation duration will be increased and saccade amplitude will get reduced to understand the semantics of the stimulus. Generally, the visual field is longer horizontally than vertically. Global/Local ratio (G/L ratio) indicates the number of saccades greater than the amplitude threshold divided by the number of saccades smaller than the amplitude threshold. It shows the difference between global scanning and detailed inspection. Saccade Velocity is the eye movement speed. It is calculated by SA divided by saccade duration. Scanpath Length is calculated by adding saccade amplitudes in a scan path. If a participant has FC same as that of normal participants and scan path is distinguishable from those group, then this refers that the participant has the restriction in their visual field. Scanpath Direction is the direction of the first fixation to the last fixation while viewing the stimulus. Saccadic Direction is the direction of saccades and generally while viewing scenes, participants show horizontal orientation and the dominance of horizontal and vertical saccades can be inspected using Horizontal and Vertical Ratio (HV-ratio). Saccadic extent along X-axis and Y-axis is the range or distance between minimum and maximum fixation of all trials in an area. The X-axis and Y-axis refer to the horizontal and vertical meridians. It is calculated using Equation (1) and (2).
Convex Hull Area refers to the polygonal space that covers all fixation of a participant across all trials. It shows the shape of the scanpath done by a participant across all trials. Scanpath is a graph that contains fixations as vertices and saccades as edges between vertices. Skewness refers to the intensity of asymmetry of a variable. Skewness value in the distribution of saccadic amplitude and fixation duration refers to whether the participant takes the higher or lower number of fixation duration or saccadic amplitude while looking at the semantics of stimulus or doing a particular task.
Based on the recent works, saccade amplitude, fixation duration, skewness in its distribution, fixation count, saccade count, global and local processing ratio (G/L ratio) and saccade velocity refers to cognitive processing. Convex hull area and saccadic extent refer to the scanpath shape and the distribution of fixation in the visual field. The direction of the spanning of the fixation can be understood from the saccadic direction, scanpath direction, and horizontal and vertical ratio. Suppose there is a constriction in the visual field, revisits saccades, scanpath length together with fixation count have to be observed.
The proposed work has used seven classification algorithms to find the best algorithm. A classifier that discriminates eye gaze parameters of normal and glaucoma participants is necessary to understand the restriction of the visual field at early stages. The classifier is fed with 16 eye gaze features and output with the target ‘class’ label. The classifiers applied in the study are: Gaussian Naïve Bayes classifier is a supervised method that works based on Naïve Bayes theorem, and is assumed that the real dataset is in the normal distribution. It is fed with certain independent features and assigns a probability for a certain outcome. Linear Support Vector Classifier (SVC) is based on the linear function that discriminates data. Kernel Support Vector Classifier, Kernel SVC or kSVC is based on radial basis function or a hyperplane that discriminates the data. Decision Tree classifier is a supervised machine learning model that discriminates the data into a tree-structure based on a certain parameter. Random Forest classifier is multiple decision trees which are generated and mode or average of the output of the trees are the results of a random tree. Adaboost classifier which is a lazy learner becomes a super learner by taking the output of many weak classifiers. This is an ensemble method. XGBoost (eXtreme Gradient Boost) classifier is an ensemble decision tree, but it combines both ranking and classification based on sub-classifiers.
Eye gaze features are in different data ranges and may be correlated to their derived features, it is very difficult to decide which feature is less important and which feature has to decorrelate. So, in real-world data, we need to expect minimal feature engineering [20]. In medical data, it is very difficult to perform dimensionality reduction, because of the prominence of features in doubt and we expect good accuracy of any model in this domain.
Results and analysis
The participants were selected during their regular glaucoma screening. They have a visual field report from HFA perimetry, in which a copy is maintained by the experimenter. Thirty-three participants were recruited, among them, twelve were glaucoma participants, sixteen were normal participants, four were glaucoma suspects, and one data loss. Glaucoma suspects were not included in the study. The mean (standard deviation) age of the normal group is 47.3(11.3) and that of the glaucoma group is 49.5(11.12). HFA perimetry test was repeated if the results were not reliable. The participants were asked to do calibration of eye tracking followed by viewing twenty images displayed for 4 secs each and was intervened by a central dot. After the pilot study, it is understood that four seconds is sufficient trial time, otherwise all participants’ have repeated visits in the image and they show pseudo attention in viewing the image.
The fixation and saccades are estimated from the gaze samples by OGAMA software and the comprehensive derived eye gaze parameters are calculated using the customized software. Since the parameters are not symmetric distribution, the median value is calculated over the trials. Spearman correlation coefficient between eye gaze measures and diagnosis (class label 0 for Normal group and class label 1 for Glaucoma group) greater than 0.50 and the p-value of<0.05 is considered as significant (see Table 1).
Mean and standard deviation (in parenthesis) and p-value of eye gaze measures with diagnosis (class)
Mean and standard deviation (in parenthesis) and p-value of eye gaze measures with diagnosis (class)
The violin plot of selected features is shown in Fig. 2. The median values are shown in the dotted lines which are apart in normal (label 0) and glaucoma group (label 1).

Violin plot of significant features with class 0 (normal) and class 1 (glaucoma).
When analyzing saccadic direction, scan path direction, and HV ratio of glaucoma patients, the saccade amplitudes are horizontal in nature as compared to normal people. The p-value of saccadic extent is statistically different (negatively correlated) along the vertical direction (up or down) and there is no much difference in saccadic extent along the horizontal direction (left or right). This shows that glaucoma patients have constriction in the visual field along the vertical direction. The constriction of the visual field creates a heavier workload for glaucoma patients that affects their quality of life.
The distribution of fixation is calculated using the convex hull area which is shown in Fig. 3 and Fig. 4.
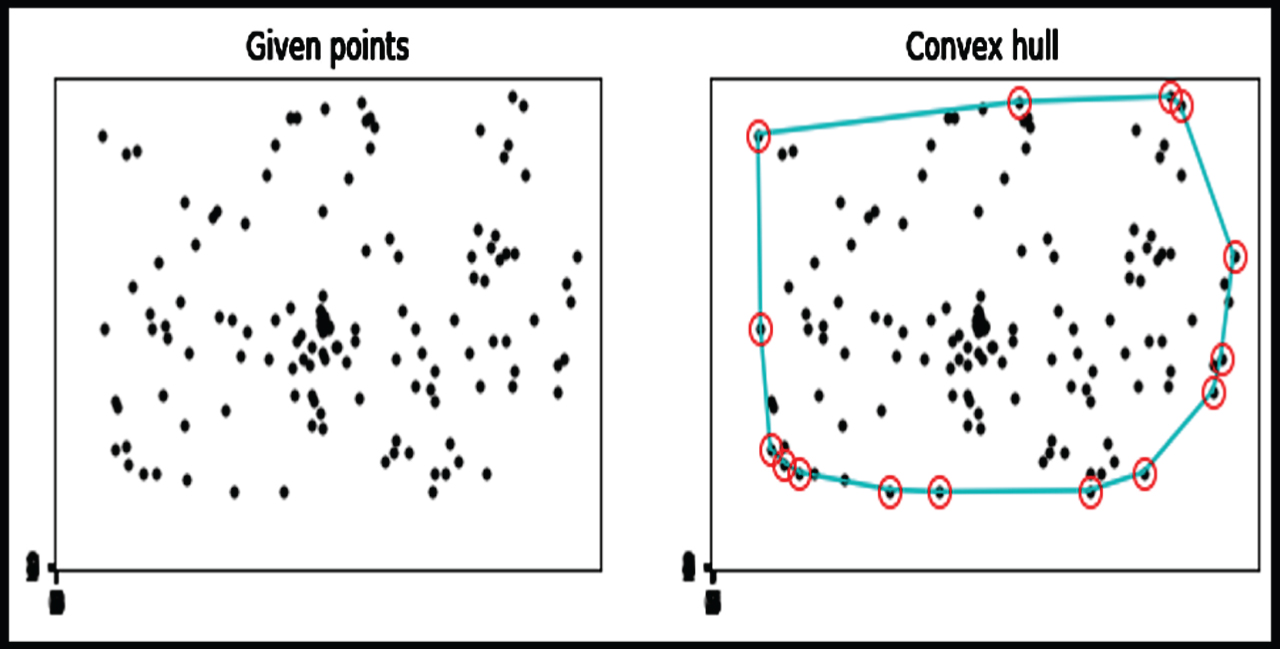
The first image shows the fixation points of the normal participant (Sub_1) in overall trials. The second image is the corresponding convex hull area.
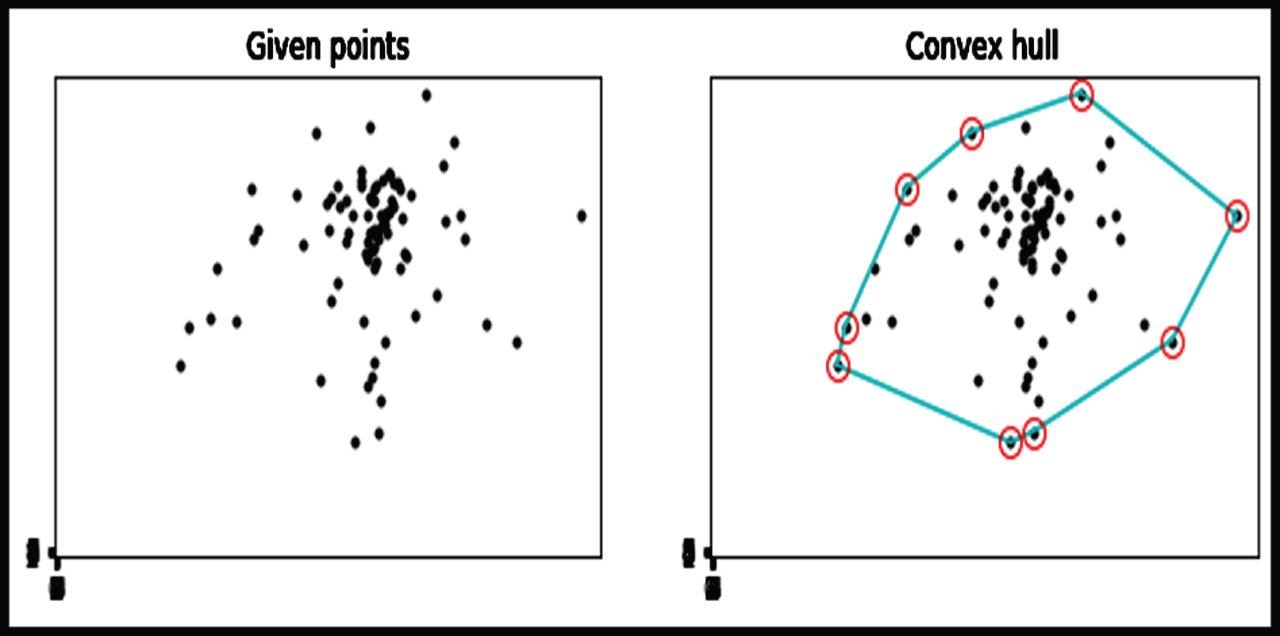
The first image shows the fixation points of the glaucoma participant (Sub_9) in overall trials. The second image is the corresponding convex hull area.
The glaucoma participants spend more time on a certain portion of their visual field whereas normal participants spend time looking all over the image. The area of the convex hull represents the scanpath shape. This is similar for other participants also. This shows that the glaucoma group has a lesser distribution of pixels than the normal group.
The restriction of the visual field can be also be understood from the scan path length along with fixation count. The fixation count of glaucoma and normal are not significantly different (0.29), but the scan path length is shorter for glaucoma patients and its significance value is 0.002.
Generally in scene perception, initially fixation duration (FD) will be lower and saccade amplitude (SA) is higher for global processing and later for understanding salient features of the scene, fixation duration will be higher and saccade amplitude will be lower. Figure 5 is an example of viewing the background scene. The time distribution is divided into 1-2, 2-3,3-4-time bins of seconds, and 0-1-time bin is excluded since initial fixation will be normally at the center of the monitor.
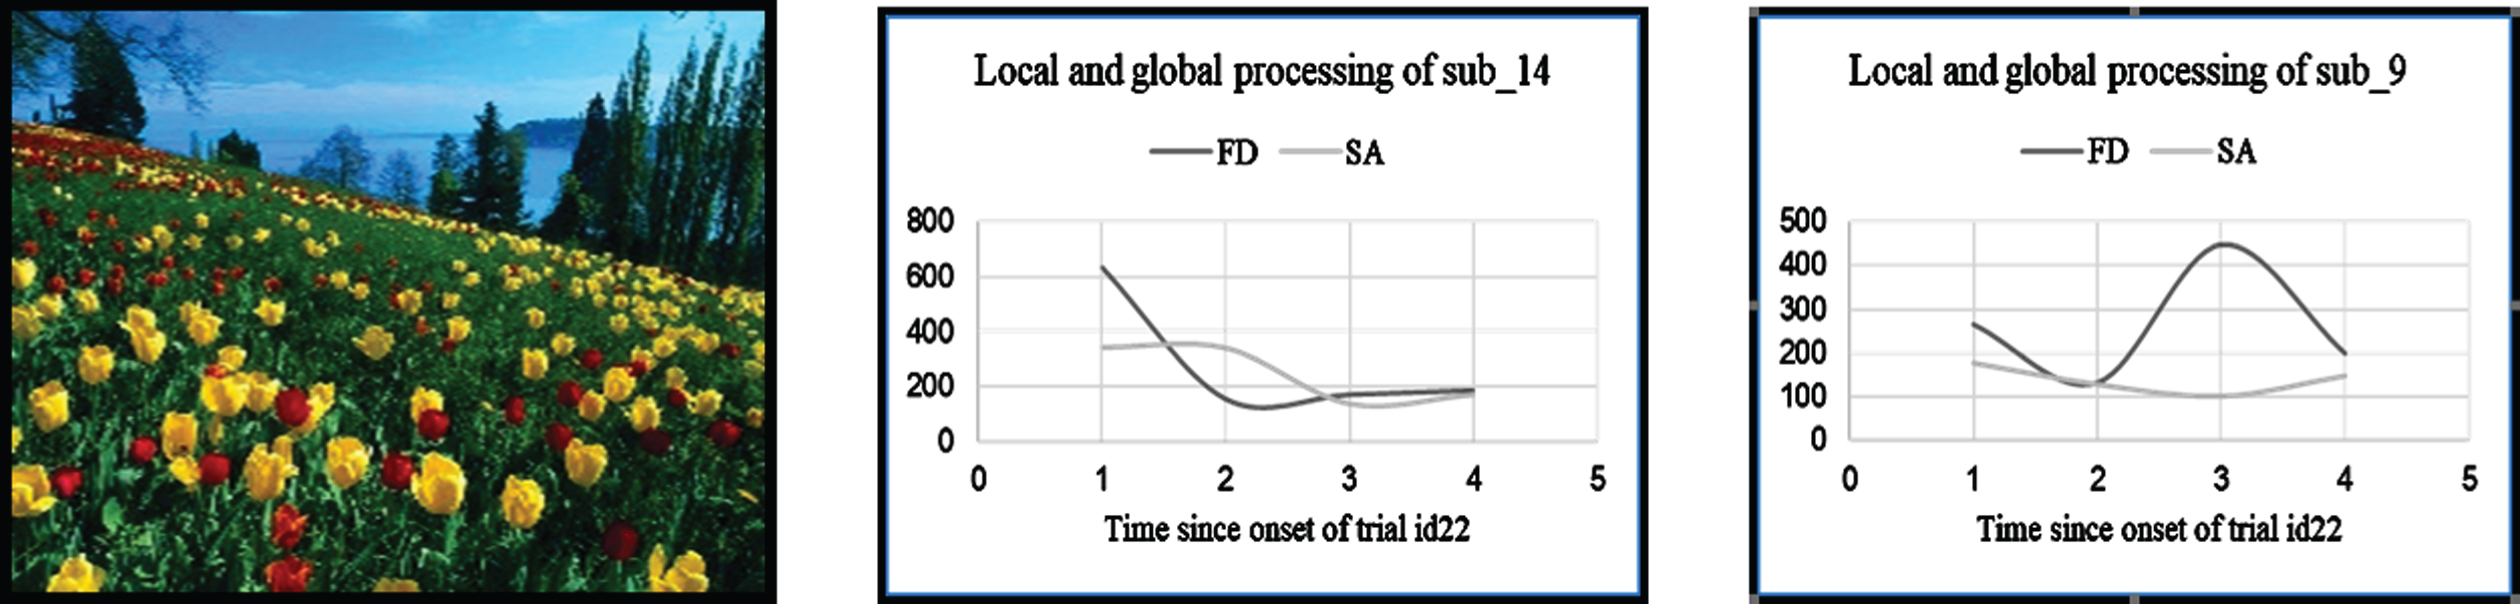
The plot of fixation duration and saccadic amplitude over bins of time in secs. First image is the image (trial id 22) displayed in the screen for 4 secs. Second image is the example results of normal participant (sub_14). Third image is the example results of glaucoma participant (sub_9).
While inspecting global and local ratio (g/l ratio), gaze orientation and further local processing of glaucoma participants are same as that of normal participants. The skewness of SA and FD are calculated separately as in Equation (3).
Skewness value is computed as
The heat map of the normal participant (sub_14) and glaucoma participant (sub_18) is shown in Fig. 6. The framework also generates an average fixation map by calculating the average of fixation maps of each participant. Figure 7 shows the average fixation map of 12 participants in each group.
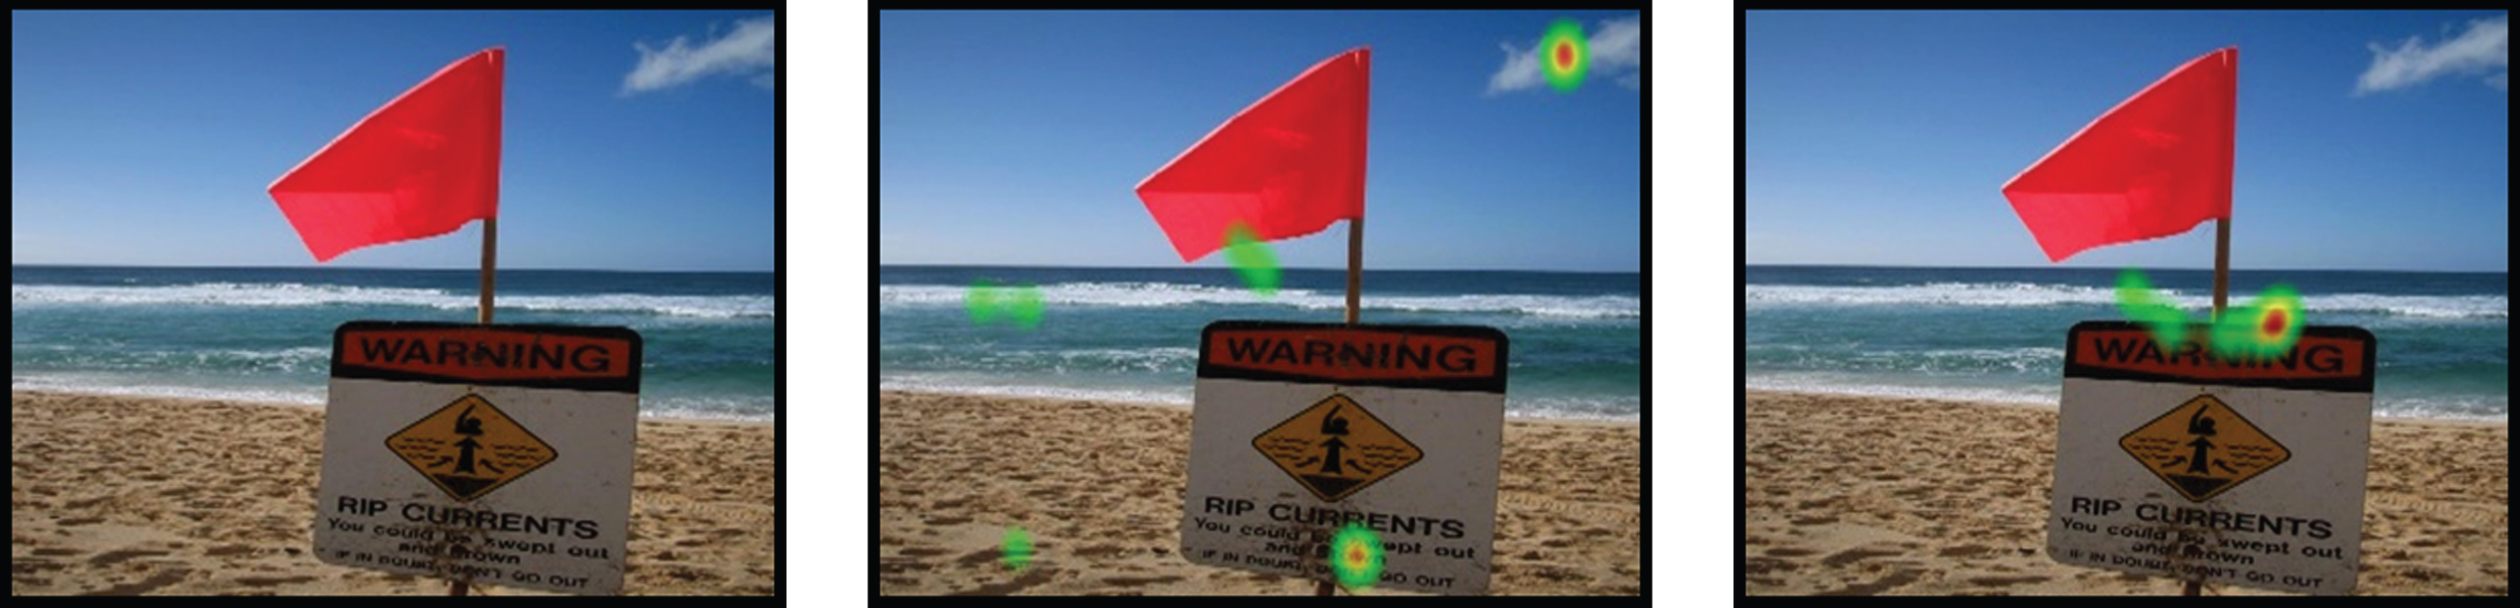
First image is the original image and second image is the heat map of normal patient (sub_14) and third image is the heat map of glaucoma patient (sub_18).
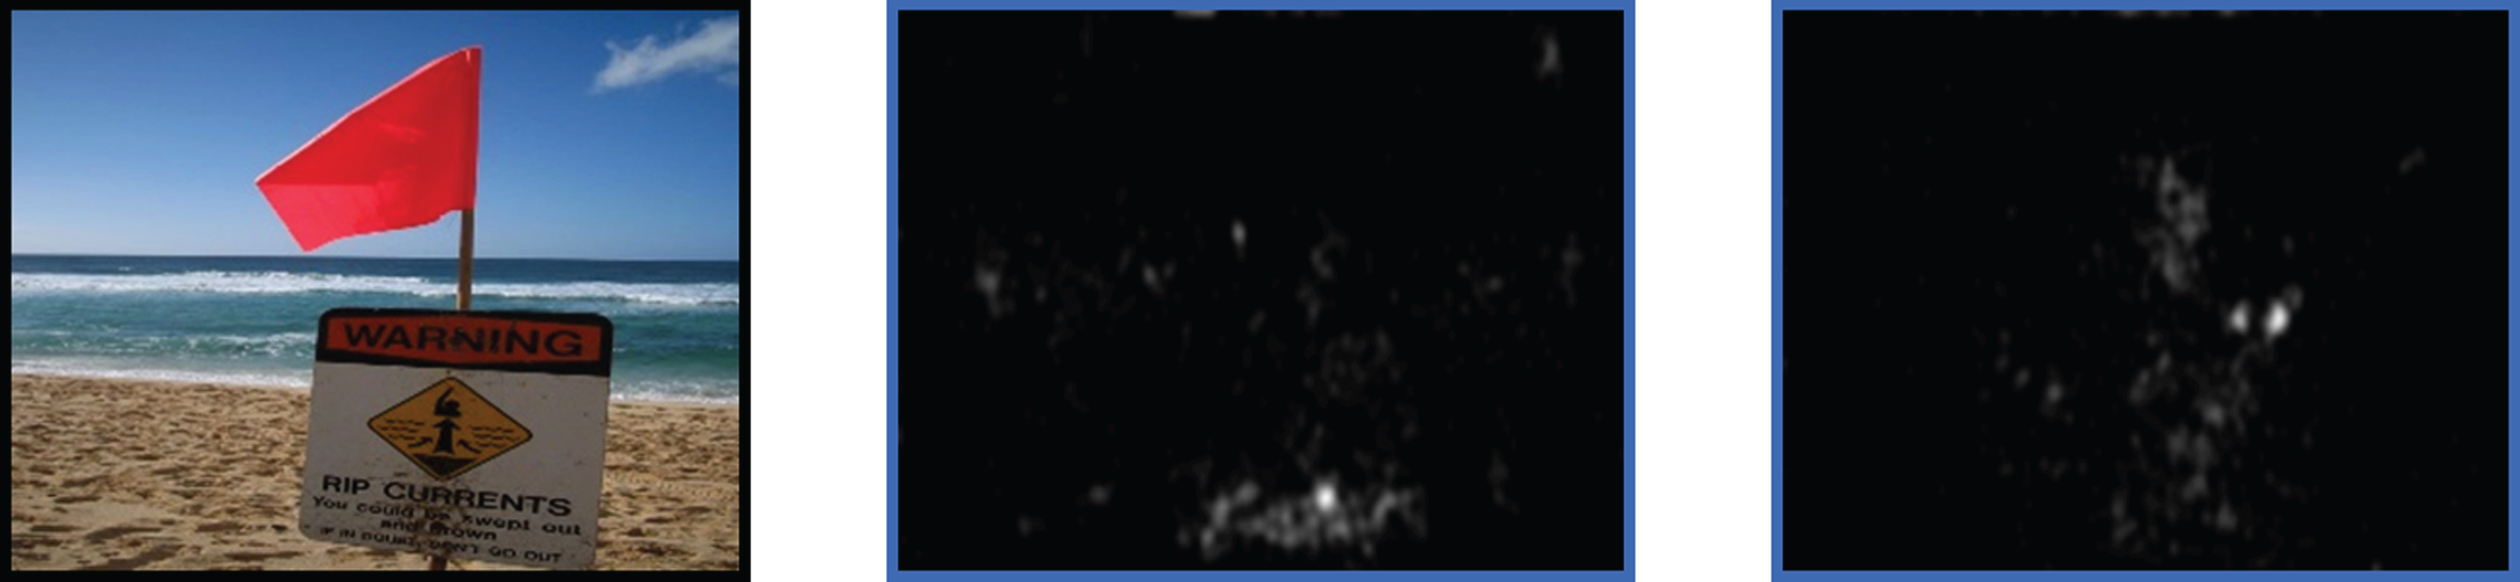
First image is the original image. Second image is the average fixation map of normal participants and third image is the average fixation map of glaucoma participants.
A fixation map is generated by applying the Gaussian kernel over each fixation location of the participant with kernel size 2° (foveal attention) [21]. The Gaussian distribution is calculated as Equation (4).
There is a significant difference in saccade rate (saccades/sec) (p = 0.02) between normal and glaucoma, but no significant difference in saccade velocity. These findings suggest that there is a difference in eye movement rate since the saccade velocity of the glaucoma group is less than the normal group, but there is no significant difference between glaucoma and normal in case of revisit count. This can be because of the restriction of visual field and limitation of eye movement rate; glaucoma patients are not making larger revisits than normal.
The performance measures of 7 classifiers that are fed with 16 features are evaluated (see Table 2). The dataset is given a random train, test, and validation subsets of 70-20-10% of data.
Classification accuracy of different classifiers
The dataset is not linearly correlated with the number of features. In a dataset, the set of features cannot be as independent of each other and the Gaussian distribution of data cannot be assumed. Hence the classification accuracy is 0.66. SVC classifier discriminates into two classes and applying the linear function and radial basis function, the accuracy is increased to 0.83 in both cases. Adaboost classifier is an ensemble method that is good for many medical applications [20]. The dataset does not have the same number of samples in both cases; hence accuracy shows 0.83. Random forest classifier follows the bagging method since the dataset has more correlated features. This method will decorrelate in different subtrees, with the ‘entropy’ criterion and ten iterations. The accuracy of the random forest is 0.83.
We have not applied feature engineering, since each feature gives an interpretation. Certain combinations of features are necessary to understand cognitive processing, direction, and restriction of the visual field and so the dataset is complex. In such cases, XGBoost can handle non-linear relationships of data
and perform feature selection automatically. We apply XGBoost Classifier, which has L1 and L2 regularization that can optimize the classification and avoids overfitting. XGBoost is portable and faster than other algorithms and can handle complex datasets. The accuracy of the classifier is 1.0 and hence the proposed system uses this ensemble method in the decision support system.
The proposed system considers the state-of-art of eye gaze measures that checks cognitive processing, constriction, and direction of the visual field with less amount of time and effort. This helps to understand whether participants have restriction in the visual field and advise them to check for glaucoma screening in the secondary level of hospitals in the hierarchical model of eye care delivery. This system can be used as an early screening test for healthcare personnel in primary eye centers. It is very comfortable, low cost, and accurate in the decision-making of normal or restriction in the visual field by ruling out cognitive processing. The information-based decision support system is very portable as it is created in open-source software.
The proposed system can include more eye gaze data for training. The participants’ eye gaze data can be compared with visual field report parameters or structural analysis reports to perform clinical validation.