
Abstract
In the last decade, there have been extensive reports of world health organization (WHO) on breast cancer. About 2.1 million women are affected every year and it is the second most leading cause of cancer death in women. Initial detection and diagnosis of cancer appreciably increase the chance of saving lives and reduce treatment costs. In this paper, we perform a survey of the techniques utilized in breast cancer detection and diagnosis in image processing, machine learning (ML), and deep learning (DL). We also proposed a novel computer-vision based cost-effective method for breast cancer detection and diagnosis. Along with the detection and diagnosis of breast cancer, our proposed method is capable of finding the exact position of the abnormality present in the breast that will help in breast-conserving surgery or partial mastectomy. The proposed method is the simplest and cost-effective approach that has produced highly accurate and useful outcomes when compared with the existing approach.
Introduction
“Breast cancer is the second most leading cause of cancer death in women [1]”. “Breast cancer is a group of diseases in which cells in breast tissue change and divide uncontrolled, typically resulting in a lump or mass (Breast Cancer Facts - National Breast Cancer Foundation n.d.)”. From the last five years, the survival rate of breast cancer patients is about 60% in India compared to 90% in the United States. [3]. A long way from reality as recent advancements have significantly improved patients’ endurance contrasted with possibly 2 –3 decades ago. It is easily treated and typically has no symptoms when the tumor is small, so screening is necessary for early recognition. The painless lump is the most common physical sign. The BC increases the risk of other diseases like osteoporosis, progeria, and Werner syndrome, which causes bone loss, fracture, hair loss, and abnormality in the skin.
According to the Surveillance, Epidemiology, and End Results (SEER) summary staging system, breast cancer is divided into seven categories, as shown in Fig. 1 and there generally has four stages, namely Stages 0 &1, Stages 2 (II) & Stage 2A (IIA), Stage 3(III) A, B, &C and Stage 4 (IV) [2]. Also, there are six types of cancer indicating abnormalities present in the breast, namely CALC (calcification), CIRC (circumcised masses), SPIC (speculated masses), MISC (other ill-defined masses), ARCH (architectural distortion), and ASYM (asymmetry) as shown in Fig. 2. Accordingly, there is no prevention technique for breast cancer; however, early detection can significantly improve the result. So, it is better to screen cancer leading abnormalities mammogram images from the normal. Then, detect the position of abnormalities present in the mammogram images.
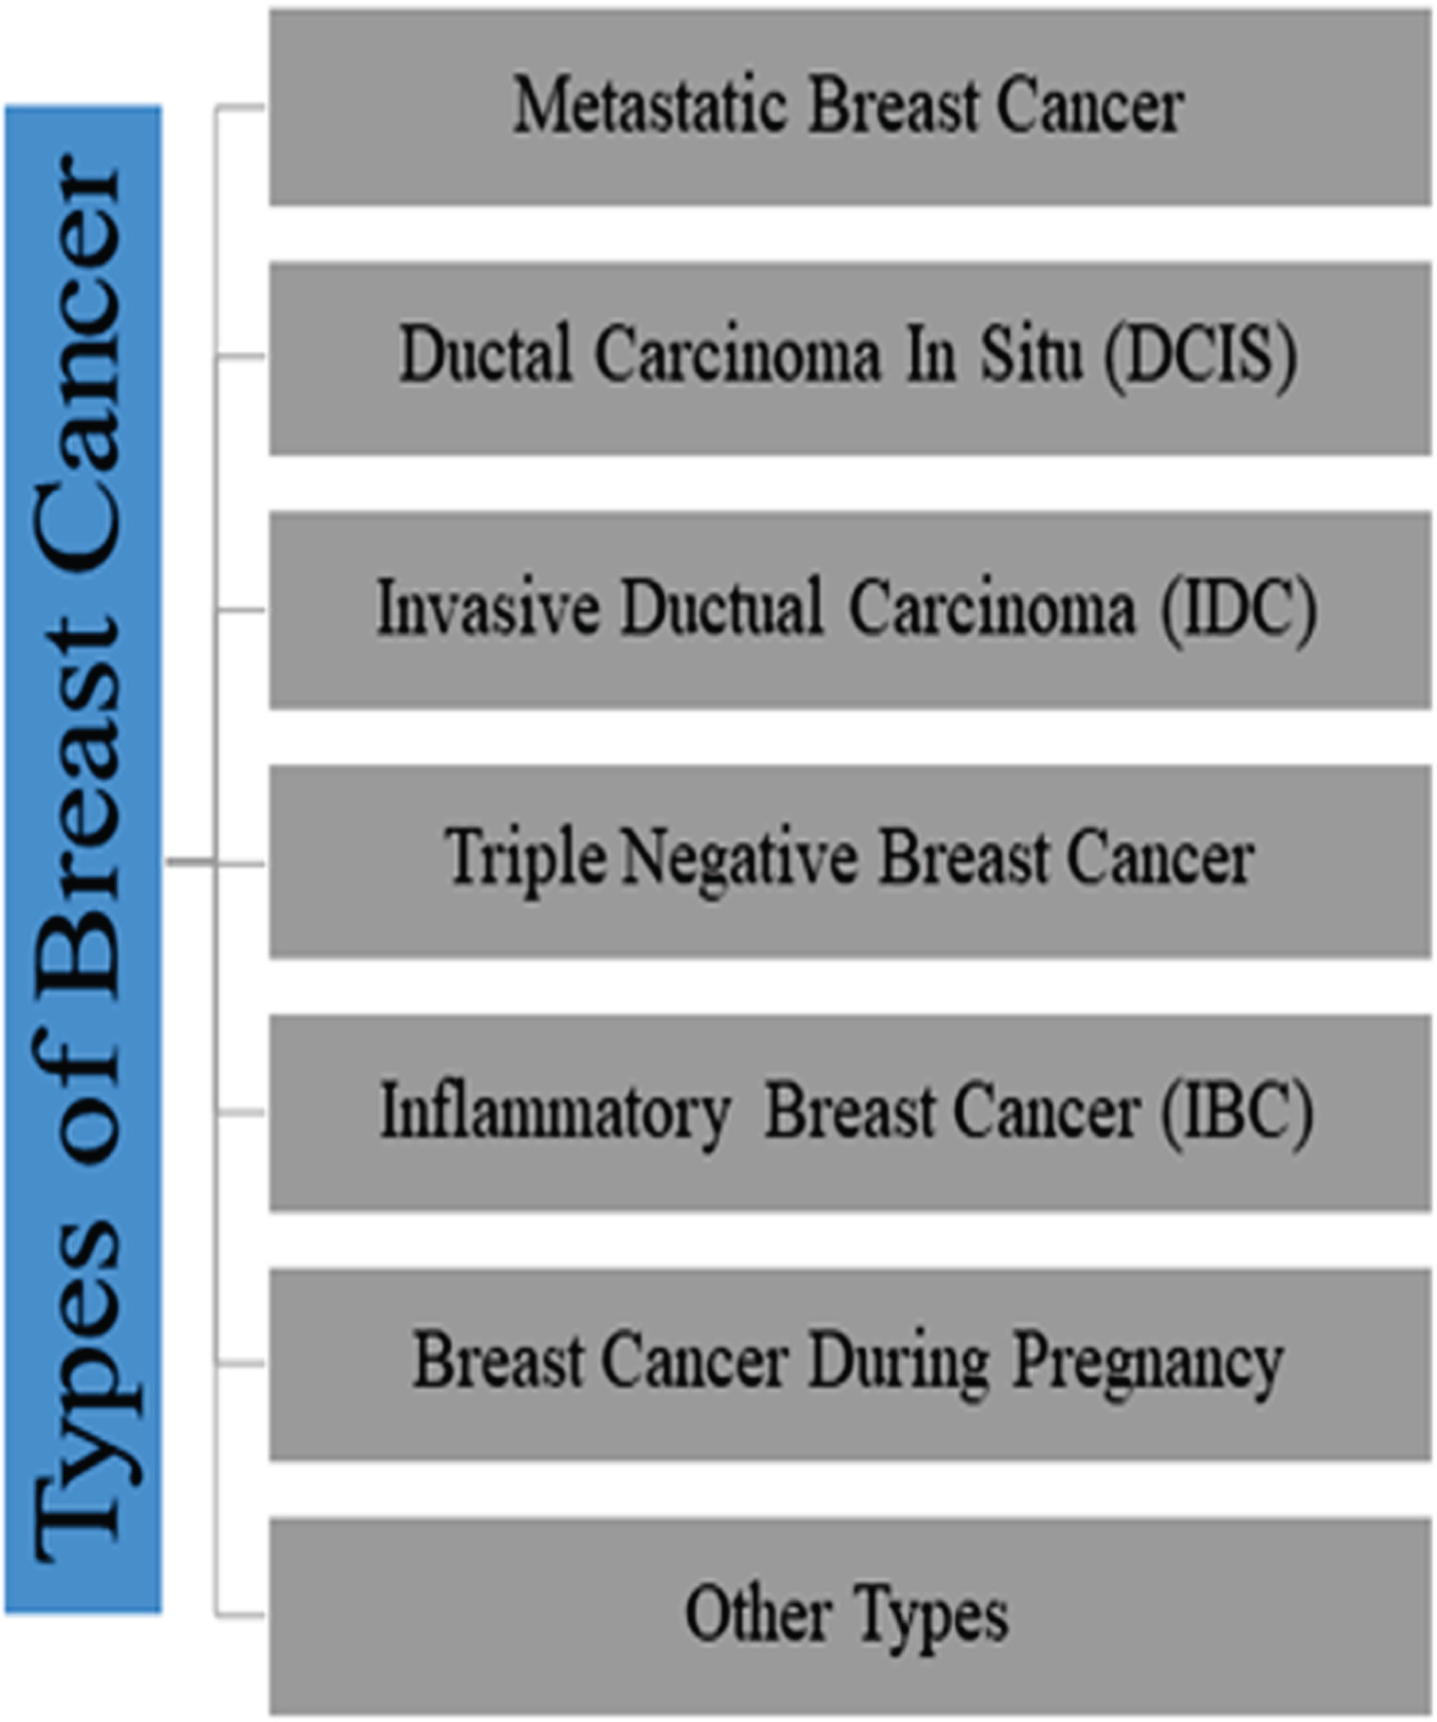
Different types of breast cancer.
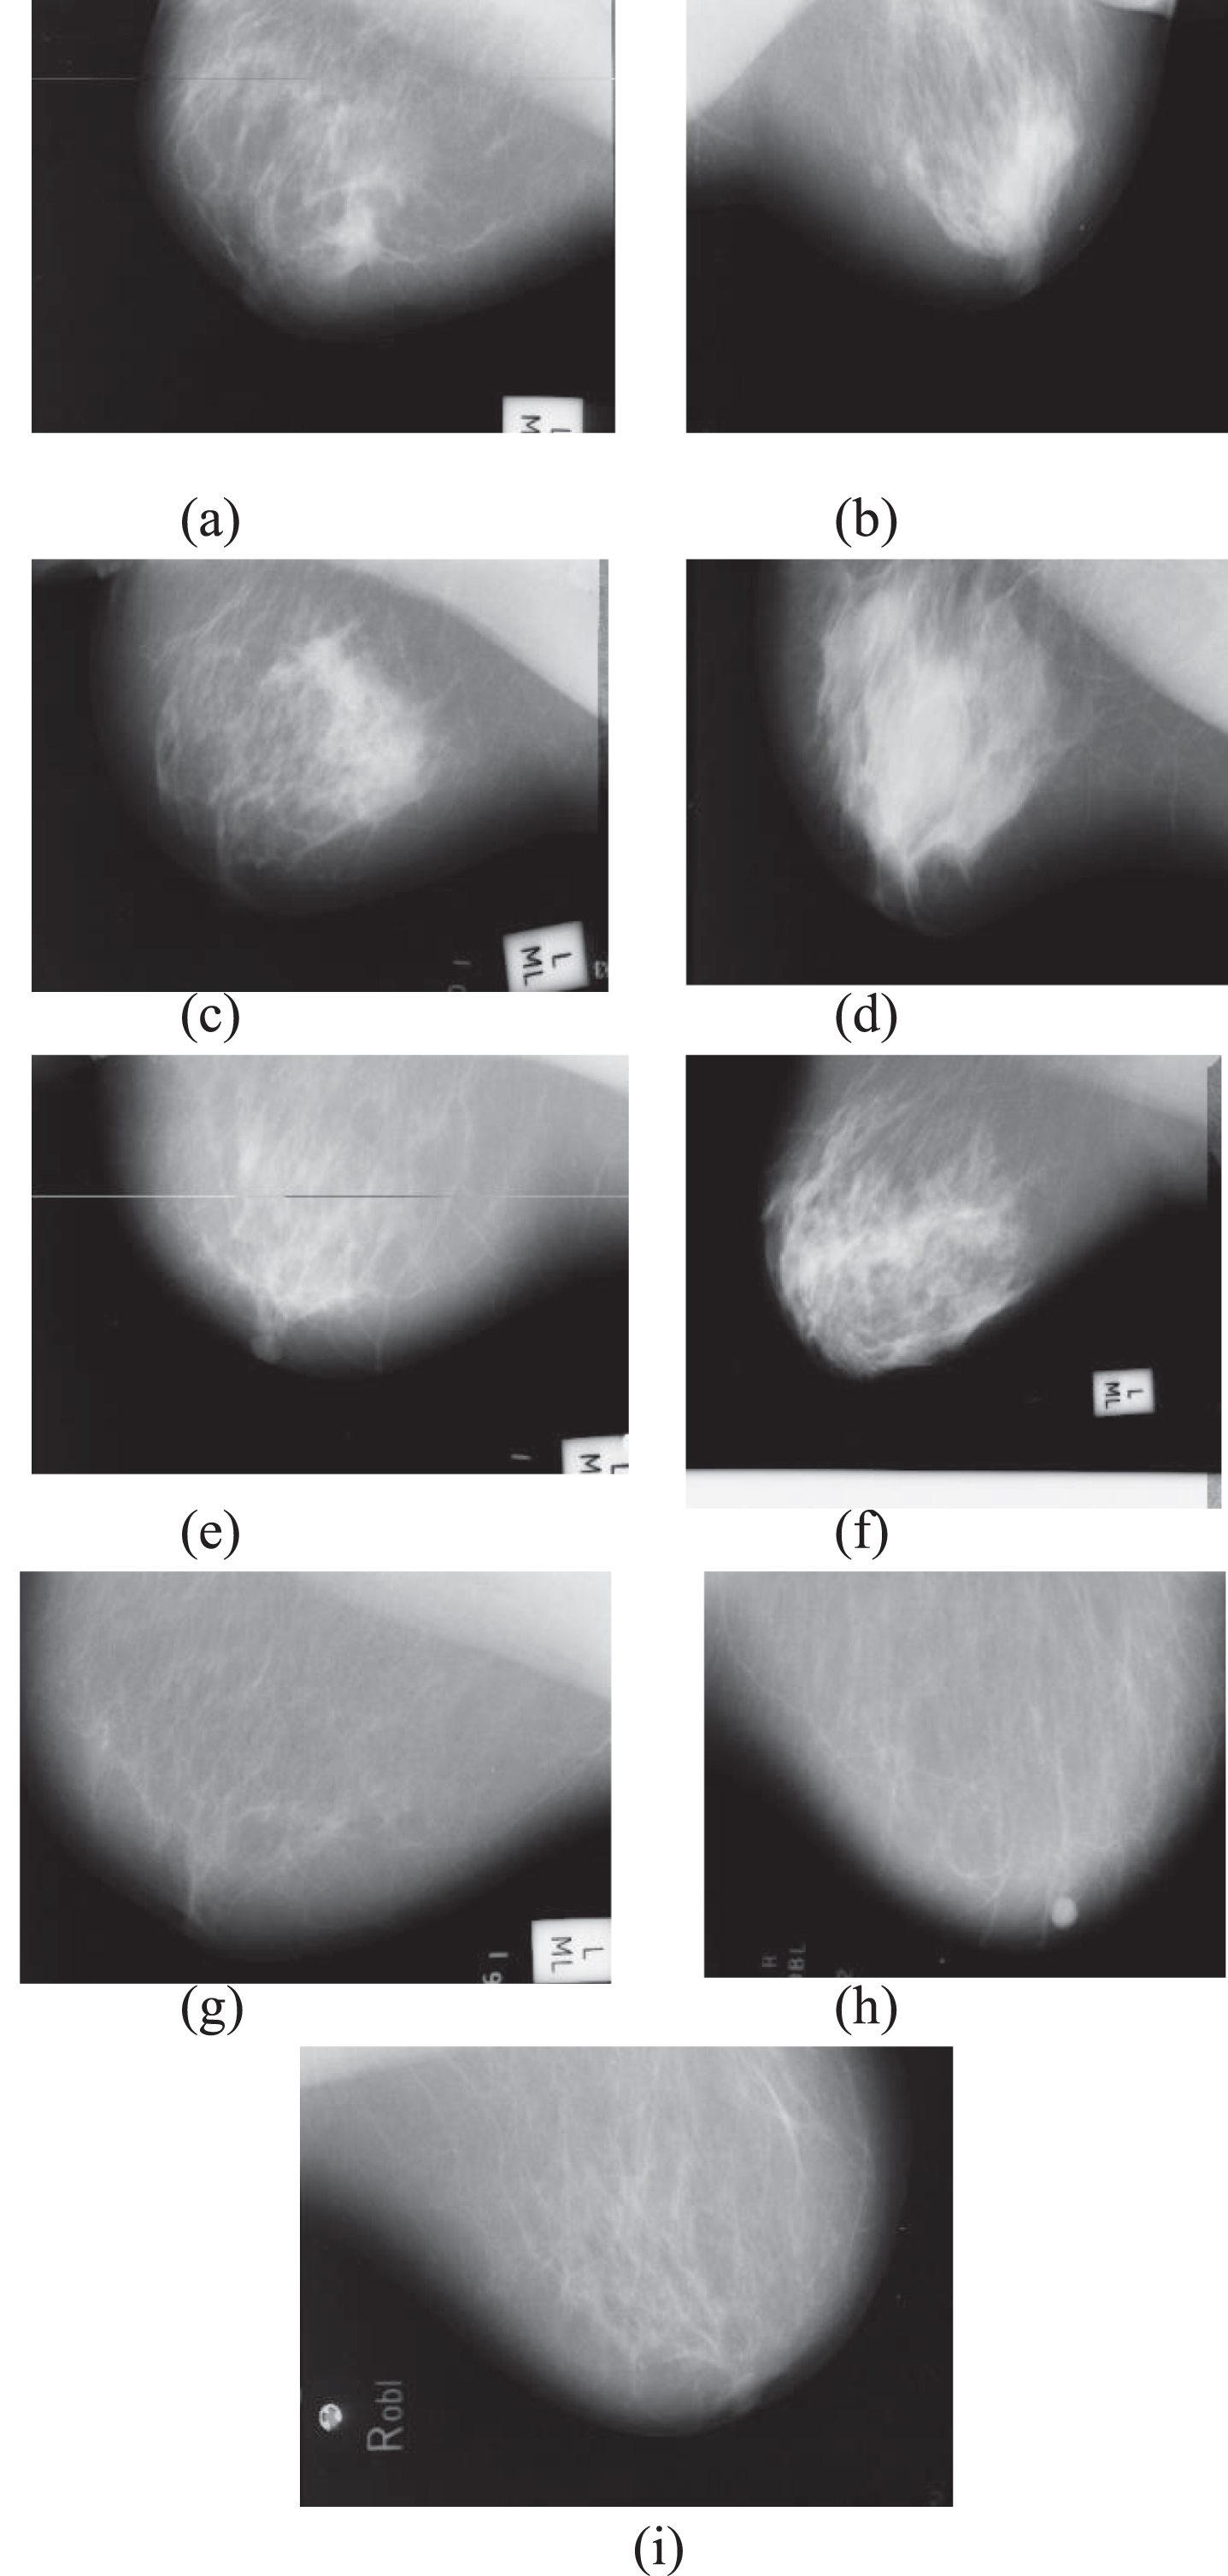
Types of cancer indicating abnormalities and normal mammogram images (a) ARCH (b) ASYM (c) CALC (d) CIRC (e) MISC (f) SPIC (g) normal (h) normal (i) normal.
The major contribution of this research article includes the following points: We have reviewed almost 70 papers that deal with BC detection and diagnosis. Analysis of the previous methodology, along with its advantages and limitations, are made. The proposed method is a novel computer-vision based and does not require high computing performance systems with expensive hardware, making the system cost-effective. Using the HOG and SVM features, we screen the mammogram images that contain the abnormality, which indicates the BC. Along with the detection and diagnosis of breast cancer, our proposed method can detect the exact position of the abnormality present in the breast, which coincides with the used dataset, i.e., the MIAS database. It will also help in breast-conserving surgery or partial mastectomy. The effectiveness of the proposed methodology and model is demonstrated via figures.
The rest of the article is organized as follows: Section 2 presents the existing techniques and literature survey. The proposed methodology is discussed in Section 3. Section 4 is allocated for the results and discussions. Finally, we conclude the work by highlighting the proposed system’s achieved results and effectiveness in Section 5.
This section described and analyzed the different applications of image processing, machine learning, deep learning, clinically significant, and other biological interpretable features applied for breast cancer detection and diagnosis. Based on the clinically substantial and anatomical interpretable features, (Kumar, Srivastava, and Srivastava [4] had suggested a method for detection and classification of BC by considering the underlying tissues (epithelial, connective, nervous, and muscular) from the microscopic 1000 random microscopic biopsy images with the support of K- nearest neighboring. To improve breast cancer classification, Ting, Tan, and Sim [5] had considered a CNN. The CNNI-BCC was classified into three groups, namely healthy, malignant, and benign patients with high accuracy of 90.50%. For predicting breast cancer risk, Id et al. [6] had used a machine learning model and personal health information, namely, “Breast Cancer Risk Prediction Tool” (BCRAT). The PLCO dataset used for experimenting was collected from the National Cancer Institute.
Again image processing and machine learning were considered by Adel et al. [7] for BC diagnosis. A Support vector machine (SVM) was used to classify the combined elastogram and B- mode images. The classification accuracy for the SVM with radial basis function (RBF) kernel was about 94.12 %. Hasan et al. [8] had presented a model based on CNN for breast mass detection to minimize the overheads of manual analysis. The datasets used for the experiments were collected from different local hospitals. The performance of the proposed model was AUC-ROC (92.2%), detection accuracy (91.86%), and sensitivity (94.67%). By adopting the different local quinary patterns along with neighborhood topologies, Rampun et al. [9] had proposed a methodology for breast density classification with competitive results up to 86.13% and 82.02% accuracy for 322 and 206 mammograms collected from the MIAS database. Sadhukhan, Upadhyay, and Chakraborty [10] had defined a framework based on image processing and machine learning for the BC diagnosis with the support of SVM and KNN. The efficiency of the result obtained in the study was relatively high, i.e., 97.489%. Kadam, Jadhav, and Vijayakumar [11] had used ensemble learning, especially based on features of the stacked sparse autoencoders and softmax regression, by deploying the SSAE-SM model with promising results as 98.60% accuracy. Vaka, Soni, and K [12] had present the new technique called Deep Neural Network with Support Value (DNNS) to detect BC with high accuracy of 97.21 % along with the precision of 97.9%. Shrivastava and Bharti [1] had suggested a methodology for breast tumor detection and classification by utilizing the concept of density on different datasets, including RIDER, MIAS, and DDSM. The result was quite effective and promising, even better than the existing cutting-edge techniques, i.e., 94.4%.
In the last few year a vast number of research works have been reported on different method for detection and diagnosis of breast cancer using modern technologies such as these approaches include, image processing [2–4], deep learning [5–9] with shear- wave elastography [10], Deep hybrid features [11–13], Electromagnetism-like algorithm [14], Deep belief network [15], SSAE model [16], Fuzzy c-Means (FCM) [17], Decision trees [18–21], Random forest [19], Artificial neural network (ANN) [22–24], Spatial diversity [25], Probabilistic neural network [26], Radial basis function neural network (RBFNN)[27], kernel-based methods, Fuzzy Gaussian mixture model (FGMM) [28], fuzzy classifiers [29], clustering algorithms [30], evolutionary computations [31] (e.g. Genetic algorithm [32–34], simulated annealing [35]), R-CNN Classifier [36, 37], Bidirectional Recurrent Neural Networks (HA-BiRNN) [38], Transfer Learning [39–41], Wavelet neural network [42], SVM Classifier [43–46], AdaBoost learning [47], Semi-supervised algorithm [48], Blustering Mining [49], DNNS [50], Deep CNN [51–59], DCNN with misclassification reduction algorithm [60].
The survey above shows that all existing methods, as tabulated in Table 1, are not cost-effective and have performance issues. Also, from the study of our best knowledge, no technique can classify and determine the exact position of the abnormality present in the breast until now. The manuscript mainly focused on the precise position detection of the various abnormality present in the breast utilizing the mammographic database [61] for the image analysis. So, breast-conserving surgery or partial mastectomy can be carried out. Further, this can impressively reduce the expenses of the treatment.
Comparative analysis of the most popular methods for breast cancer detection and diagnosis
Comparative analysis of the most popular methods for breast cancer detection and diagnosis
For early diagnosis of breast cancer, it is required to screen the abnormal mammogram images and then detect the position of cancer indicating abnormalities. For this, we made two groups to all mammogram images, i.e., normal and abnormal. The abnormal includes all six cancer indicating abnormal mammogram images. The proposed approach as a block diagram is depicted in Fig. 3. The methodology comprises two phases. In the first phase, it screens the abnormal breast from the normal one. For this, 113 abnormal images and 209 normal images are used. The HOG features of both kinds of images are extracted and fed to SVM for classification. In the second phase, the abnormal breasts are considered for image analysis to detect the position of presence of abnormal tissue. The exploration study was actualized utilizing the MATLAB 2019a. All the applications were run on a laptop, i.e., HP Pavilion Core i5 5th Generation.

Flow chart for the proposed approach.
For experimentation, we have used images of the mammography database version 1.21. According to the Mammographic Image Analysis Society (J Suckling et al. 1994), there are six different cancer types: CALC, ASYM, CIRC, SPIC, MISC, and ARCH.
Breast and muscle extraction
The Breast region is cropped for extracting the clear sight of breast and muscle and labeled as “Getting the Breast and Muscle”. After that, we deleted the black corners to select the muscle by using the ‘bwselect’ function, converting it into B&W, and removed. Also, we remove the muscle part too for getting a breast image only for the analysis.
Filtering out noise
For getting the fine and clear image of the breast only for proper analysis, we filter out the noise, i.e., noise spectra and additive noise, by using a wiener filter concerning the window size and SNR of 3 x 3 and 02. Respectively. Along with filtering out the noise from the image, the Wiener filter is also utilized for the evacuation of obscure images due to linear motion or unfocussed optics.
AHE
An image contrast enhancement algorithm called Adaptive Histogram Equalization (AHE) is being utilized to overcome the limitations in the standard histogram equalization. The contrast limited AHE (CLAHE) to reduce noise by partially reducing the standard histogram equalization. Here we used the CLAHE. Also, HOG features are extracted from the CLAHE passed image.
SVM
After extracting the HOG features, SVM is deployed, which is a supervised machine learning model. It is used to classify the normal and abnormal parts, as shown in the flow chart depicted in Fig. 3.
Determine the large Blob
As the normal and abnormality classification is done, the abnormal once again goes through the process, including threshold, Adaptive histogram equalization for determining the large Blob as shown in Fig. 3.
Exact position determination
Finally, after the extraction of the large Blob, the exact position of the affected area from breast cancer is determined by deploying the blue colored bounding box. Hence, the exact location is detected of the various abnormality present in the breast.
Results and discussions
Here in this article, we proposed a novel computer-vision based cost-effective method for breast cancer detection and diagnosis. The Mammographic database used for the experiment consists of 322 images, and about 99.64% of accuracy achieved to screen abnormal mammogram images from the normal. The exact position of the abnormality present in the mammogram images is determined, which is useful for the BC diagnosis.
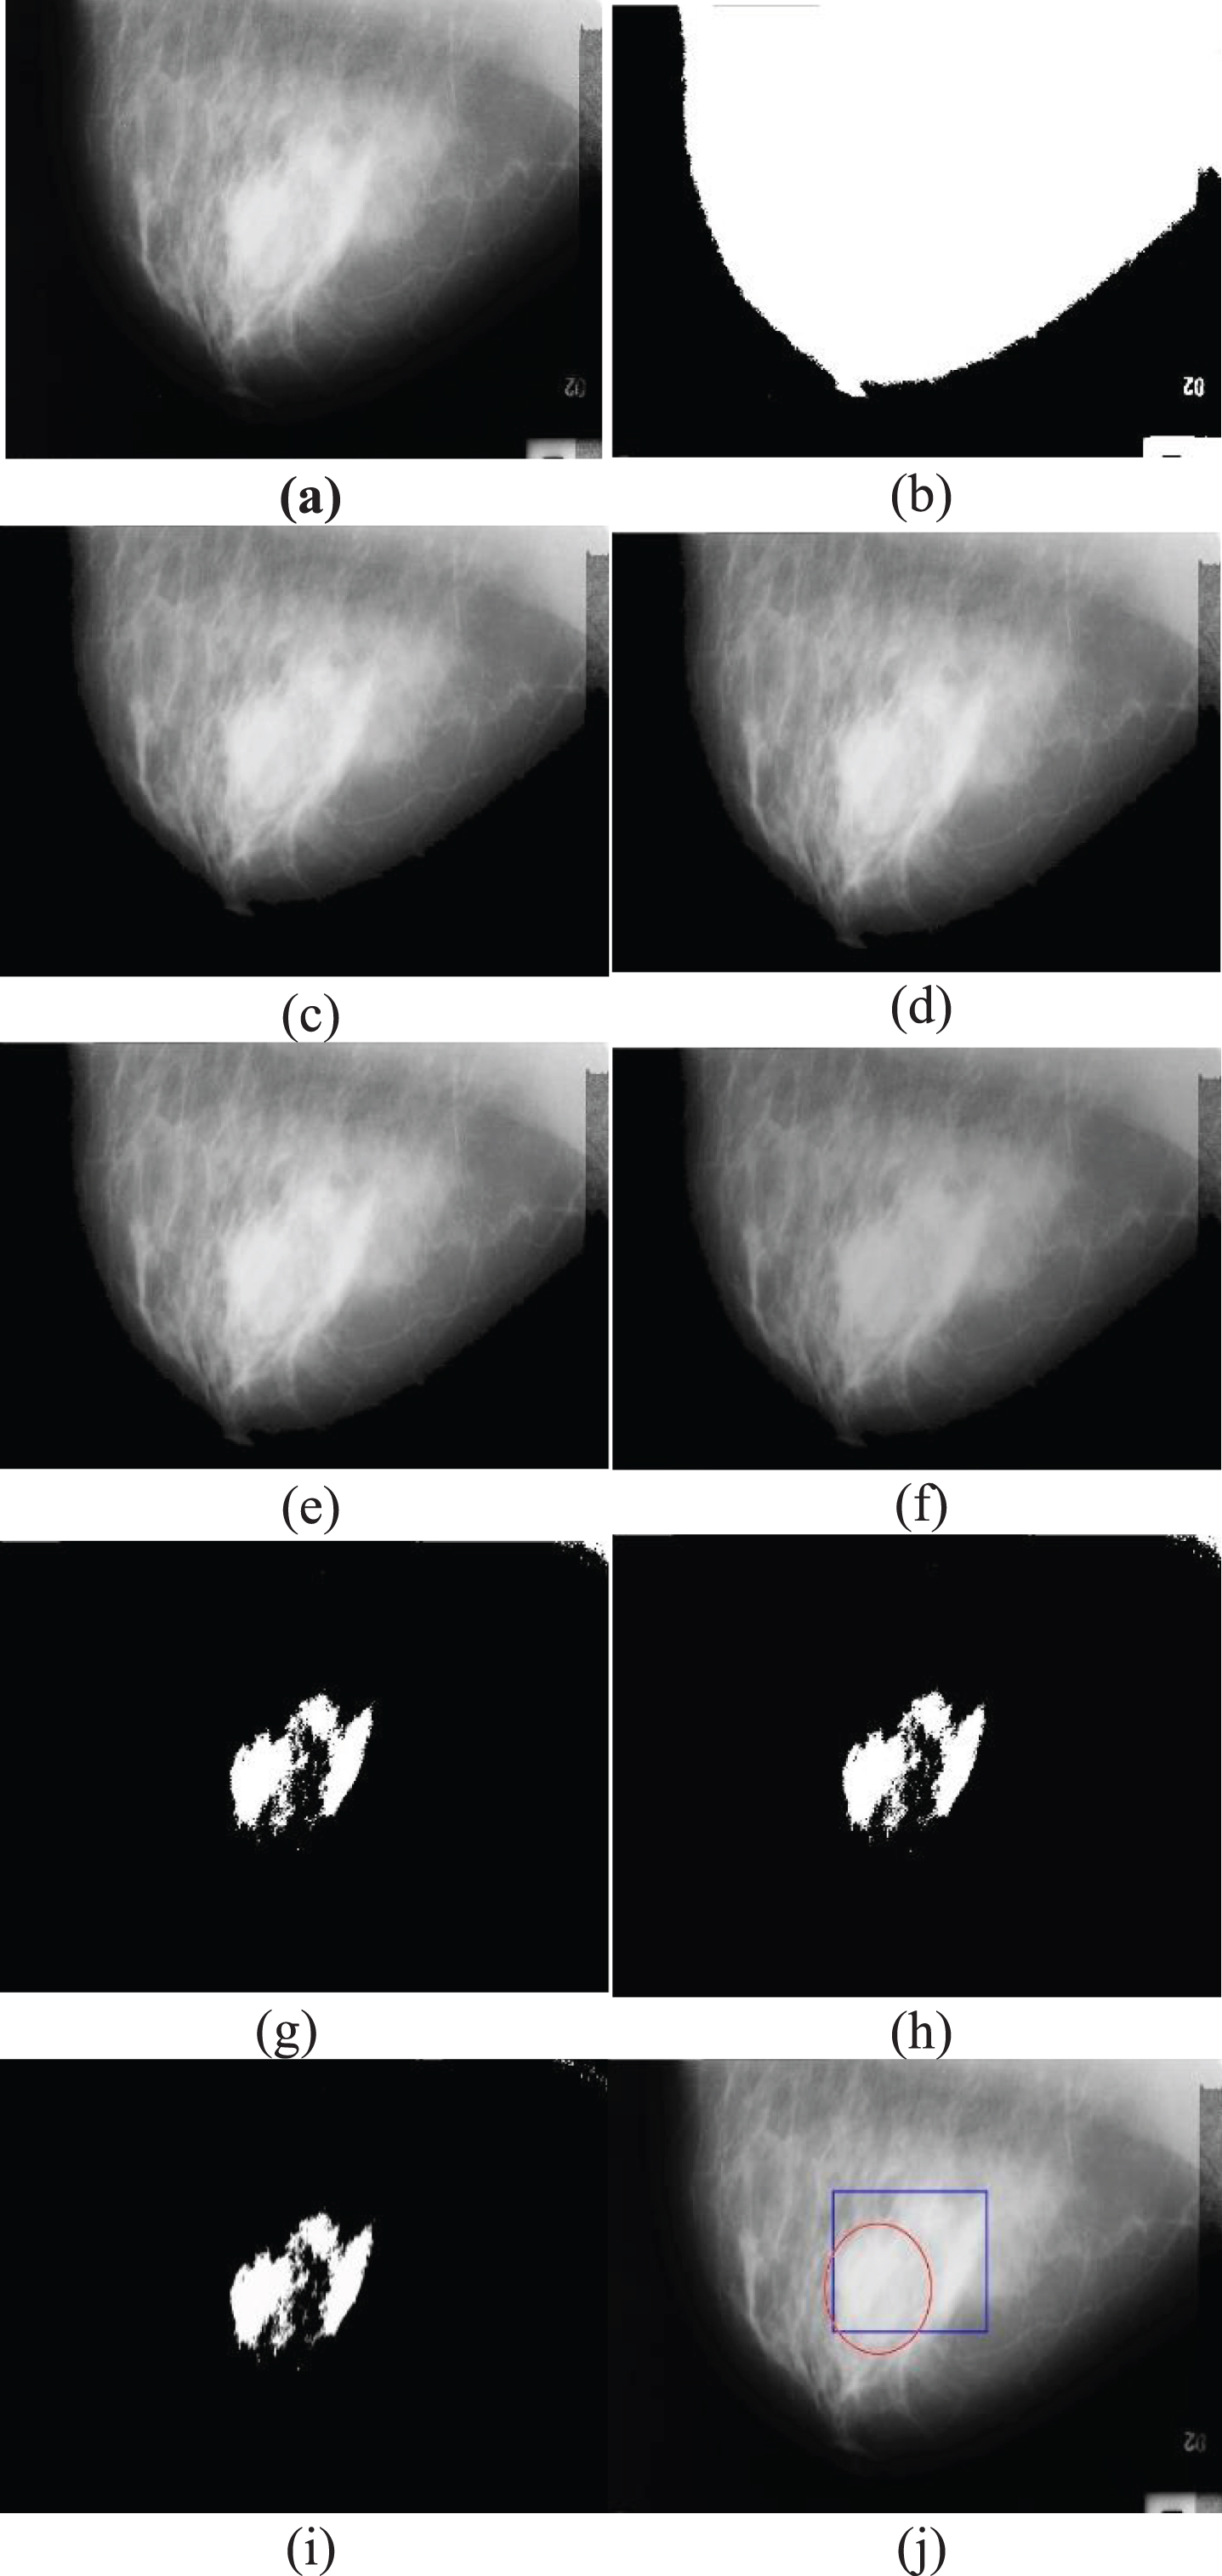
Figures 4, 5 and Fig. 6 illustrate the process of detection of the position of abnormality. The red circle is the position of abnormality provided by the radiology specialist, and the blue rectangle is the position of abnormality detected by our proposed method. For our observation, all images available in the MIAS version 1.21 database of ASYM, CIRC, and ARCH are considered. The proposed methodology successfully detects the position of abnormality in mammogram images. The adapted method in the state-of-art achieved satisfactory outcomes is based on a deep learning approach for BC diagnosis. Deep Learning requires a lot of hardware. Some train simple deep learning models for days on their laptops (typically without GPUs), which leads to an impression that Deep Learning requires big systems to execute. Again, the deep learning models are resource-intensive and time-consuming, as a huge number of matrix multiplications are necessary for the training phase. The training time is possibly reduced with the use of GPU but expensive. Another way, instead of buying an expensive GPU, we can leverage GPUs on-demand with a cloud-hosting company where they demand a minimum of US$0.25 per hour. In contrast, our proposed system was competent enough with the state-of-art without any high-cost GPU, which made the system cost-effective.

Processed outputs to detect position of architectural abnormality (a) original image (b) binarize image (c) region of breast and muscle (d) background removed image (e)removed the muscles (f) background removed (g) filtered output (h) clear boarder (i) extract large blob (j) position of abnormality detected.

Processed outputs to detect position of asymmetry abnormality (a) original image (b) binarize image (c) region of breast and muscle (d) back-ground removed image (e)removed the muscles (f) background removed (g) filtered output (h) clear boarder (i) extract large blob (j) position of abnormality detected.
Results for circumscribed masses abnormality (a) original image (b) binarize image (c) region of breast and muscle (d) back-ground removed image (e) removed the muscles (f) background removed (g) filtered output (h) clear boarder (i) extract large blob (j) position of abnormality detected.
The proposed method is the simplest and cost-effective as the early screening, accurate prediction, and diagnosis of Breast Cancers are essential. In the early prediction of breast cancer, the computer-aided intelligent and automated medical decision support stems based on machine learning and soft computing play crucial roles. This paper presents a robust and sound classifier using the HOG feature and SVM to screen the abnormal breast mammogram images with an accuracy of 99.64%. Further, the abnormalities position is detected successfully. In addition, the proposed system does not require any training process and expensive hardware. Further, the lucrative performance of the system without any high-cost GPU made the system cost-effective.