
Abstract
Voice processing has proven to be an eminent way of recognizing the various emotions of the people. The objective of this research is to identify the presence of Autism Spectrum Disorder (ASD) and to analyze the emotions of autistic children through their voices. The presented automated voice-based system can detect and classify seven basic emotions (anger, disgust, neutral, happiness, calmness, fear and sadness) expressed by children through source parameters associated with their voices. Various prime voice features such as Mel-frequency Cepstral Coefficients (MFCC) and Spectrogram are extracted and utilized to train a Multi-layer Perceptron (MLP) Classifier to identify possible emotions exhibited by the children thereby assessing their behavioral state. This proposed work therefore helps in the examination of emotions in autistic children that can be used to assess the kind of training and care required to enhance their lifestyle.
Introduction
The recognition of emotions from voice is one of the thought-provoking tasks in the domain of voice processing. There are two classes of features namely time domain and frequency domain features which depict the variation of emotions associated with the voice. The features of voice such as pitch, energy rate, jitter, shimmer, short-time energy, short-time zero crossing, Mel spectrum features contribute to the distinction of emotions which varies from person to person.
The neurodevelopmental disorders of the humans can be best reflected through their voices. Thus analyzing the voice, their disparities in modulation, and recognizing the variations of emotions collectively contribute to the identification of such disorders.
Autism Spectrum Disorder (ASD) is one such complex neurodevelopment disorder that involves considerable challenges in communication and social interaction. The children with ASD find difficulty in relating themselves with the people around them. The symptoms of autism for some children may emerge during initial childhood period and some children behave normally until toddlerhood but gradually develop signs of autism. This aspect of ASD leads to confusion and misunderstanding among the people in rural areas in differentiating ASD children from toddlers which may prevent those children from getting proper training and guidance to face their future. Thus training of the children with autism relies on the identification of autism in children, analysis of level of autism persisting in the children, and finally the coaching of those children that aids in improving their lifestyle.
The discrepancy in the voice of autistic children from that of the normal children can be realized in the delay in the babbling and non-synchronization of vocal patterns found in the infants during their first year of age [12]. The variation of emotions in children with ASD differs from that of the Typically Developing (TD) children in the stipulated period. The pattern of variation from one emotion to another emotion in typically developing children and autistic children in a time-variant event-driven environment is studied and analyzed. This assists in identifying and discriminating the autistic children from the non-autistic children. These emotional disparities in autistic children vary according to the level of autism prevailing in the children [22]. With the dawn of various machine learning algorithms [10], emotion recognition through voice [8] acts as a screening tool for autism. Thus this paper focuses on examining the features of voice signals and analyzing the emotional variations of autistic children and normal toddlers using Artificial Neural Network (ANN) algorithm.
The paper is structured in such a way that Section 2 explains the literature review related to the work mentioned in the paper. Section 3 depicts the methodology of the implemented work. Section 4 portrays the results and the insights attained from the experimental analysis and Section 5 concludes the paper.
State of Art
Besides identifying the presence of autism in children, it is also essential to recognize the emotions in those children to analyze the behavior. The emotional variations could be better diagnosed with the various features concerned with the voice. The features differs from male to female, children to adults, more precisely these features vary from one person to person. Quite a few researchers have contributed to this emotion recognition process which is seldom protracted to the identification of autism through voice.
Abhijit et al. [1]., proposed the phenomenon of identifying the emotions in ASD through the acoustic features. This system incorporates features such as frequency variants, Linear Prediction Cepstrum Coefficients (LPCC) to understand the emotions in ASD and normal children which has been used as a mechanism to detect autism. The KNN (k-nearest neighbor) algorithm is employed to perform the classification process of ASD and normal children. Boaz et al. [2]., proposed a perception system for recognizing emotions in ASD children based on the prosodic content of their voice and suggested that the stimuli of High Functioning ASD shall be improved with the integration of identified emotions along with lexical and prosody content. Daniel et al. [18] employed the prosodic content of the speech such as intensity, duration and pitch to assess the role of pitch in better identification of ASD in people. Yasufumi et al. [19] suggest that the ability to understand the emotions through prosodic content of the speech develops a little early in typically developed children than ASD children.
The phenomenon of identifying the emotions through features such as pitch variations [5] also plays a major role in the analyzing the social cognition of autistic children. This paper suggests that distinguishing basic vocal pitch directly links to emotion recognition in ASD children and suggests that analyzing the low-level sensory features of voice contributes to the identification of autism. Cheol et al. [4] add to the research of emotion recognition in autism through vocal stereotyping through which the behavioral patterns of the ASD children can be analyzed. The findings from [16] acclaim that the processing mechanism of emotions through voice by ASD differs from that of the TD children. This likewise recommends that emotion recognition through voice helps to better understand the social communication capability of autistic children.
M.C.Kirana et al. [3] proposed a different way of analyzing the emotions in ASD children by examining the intensity of the voice of the concerned child. The authors revolved around four emotions such as happy, sad, afraid and angry which are recognized with the levels of the intensity computed using the Fast Fourier Transform. This research suggests that the lower intensity of sound results in positive emotions such as happy and higher intensity of sound corresponds to negative emotions such as sad.
There exists noteworthy research in emotion recognition using MFCC features [6] associated with the voice. Using these features in the process of recognizing the emotions such as sadness, happiness, anger, disgust, fear, surprise [10] is considered to be effective in clearly classifying the emotions in normal children and autistic children. These emotions are explored in a deeper sense to realize the variation of emotions in autistic and non-autistic children.
The phenomenon of emotion recognition in ASD children through voice has made significant progress in the field of research with the blend of voice processing [7] and machine learning algorithms [11]. Utterance classifier using a neural network [9] was proposed by analyzing the emotions to better understand the response factor of autistic children and normal children. Chin kim et al. [24] suggested that these MFCC features contribute to the better realization of emotions using machine learning algorithms. Deshmukh et al., [14] commend that machine learning based voice analysis provides a better clarity in identifying the emotions in ASD children. However, to improve the accuracy of classification, better feature extraction and feature analysis need to be encompassed. Thus analyzing these features and their variations in a time variant environment lead to behavioral analysis and identification of autism in children.
Methodology
As the voice of humans effectively depicts the basic emotions through pitch, modulation and tone, recognizing the emotions through voice [20] has proven to be an eminent process. But the process of identifying the emotions is quite difficult as the emotions are independent and their interpretation is also challenging. Though it is a difficult process, recognition of emotions from voice has found its inevitable role in many applications. Hence this process can be used for recognizing the existence of ASD and analyzing their emotions.
Moreover, the emotions of children vary dynamically in a particular time frame, analyzing their emotions through voice helps us to understand the stability of their behavior [16]. Though autistic children do not express their emotion as typically developing children [4], this process would act as a screening method to differentiate ASD children from normal children.
The recognition of emotion through voice in autistic children commences with the pre-processing of voice, followed by the extraction of features from voice, classifying and analyzing the emotions through the various features associated with the voice. The model depicting the flow of the entire work is given in Fig. 1. The implementation model of the proposed work involves four steps which are described as follows: Pre-processing of Dataset: The dataset is converted into a suitable form for extraction of required features. Extraction of Features: This process involves the extraction of audio features such as energy, pitch and other features from voice. Training of Model: This step consists of training the model to predict the emotions from the extracted features. Testing of Model: This step validates the developed model and calculates the accuracy of the model.
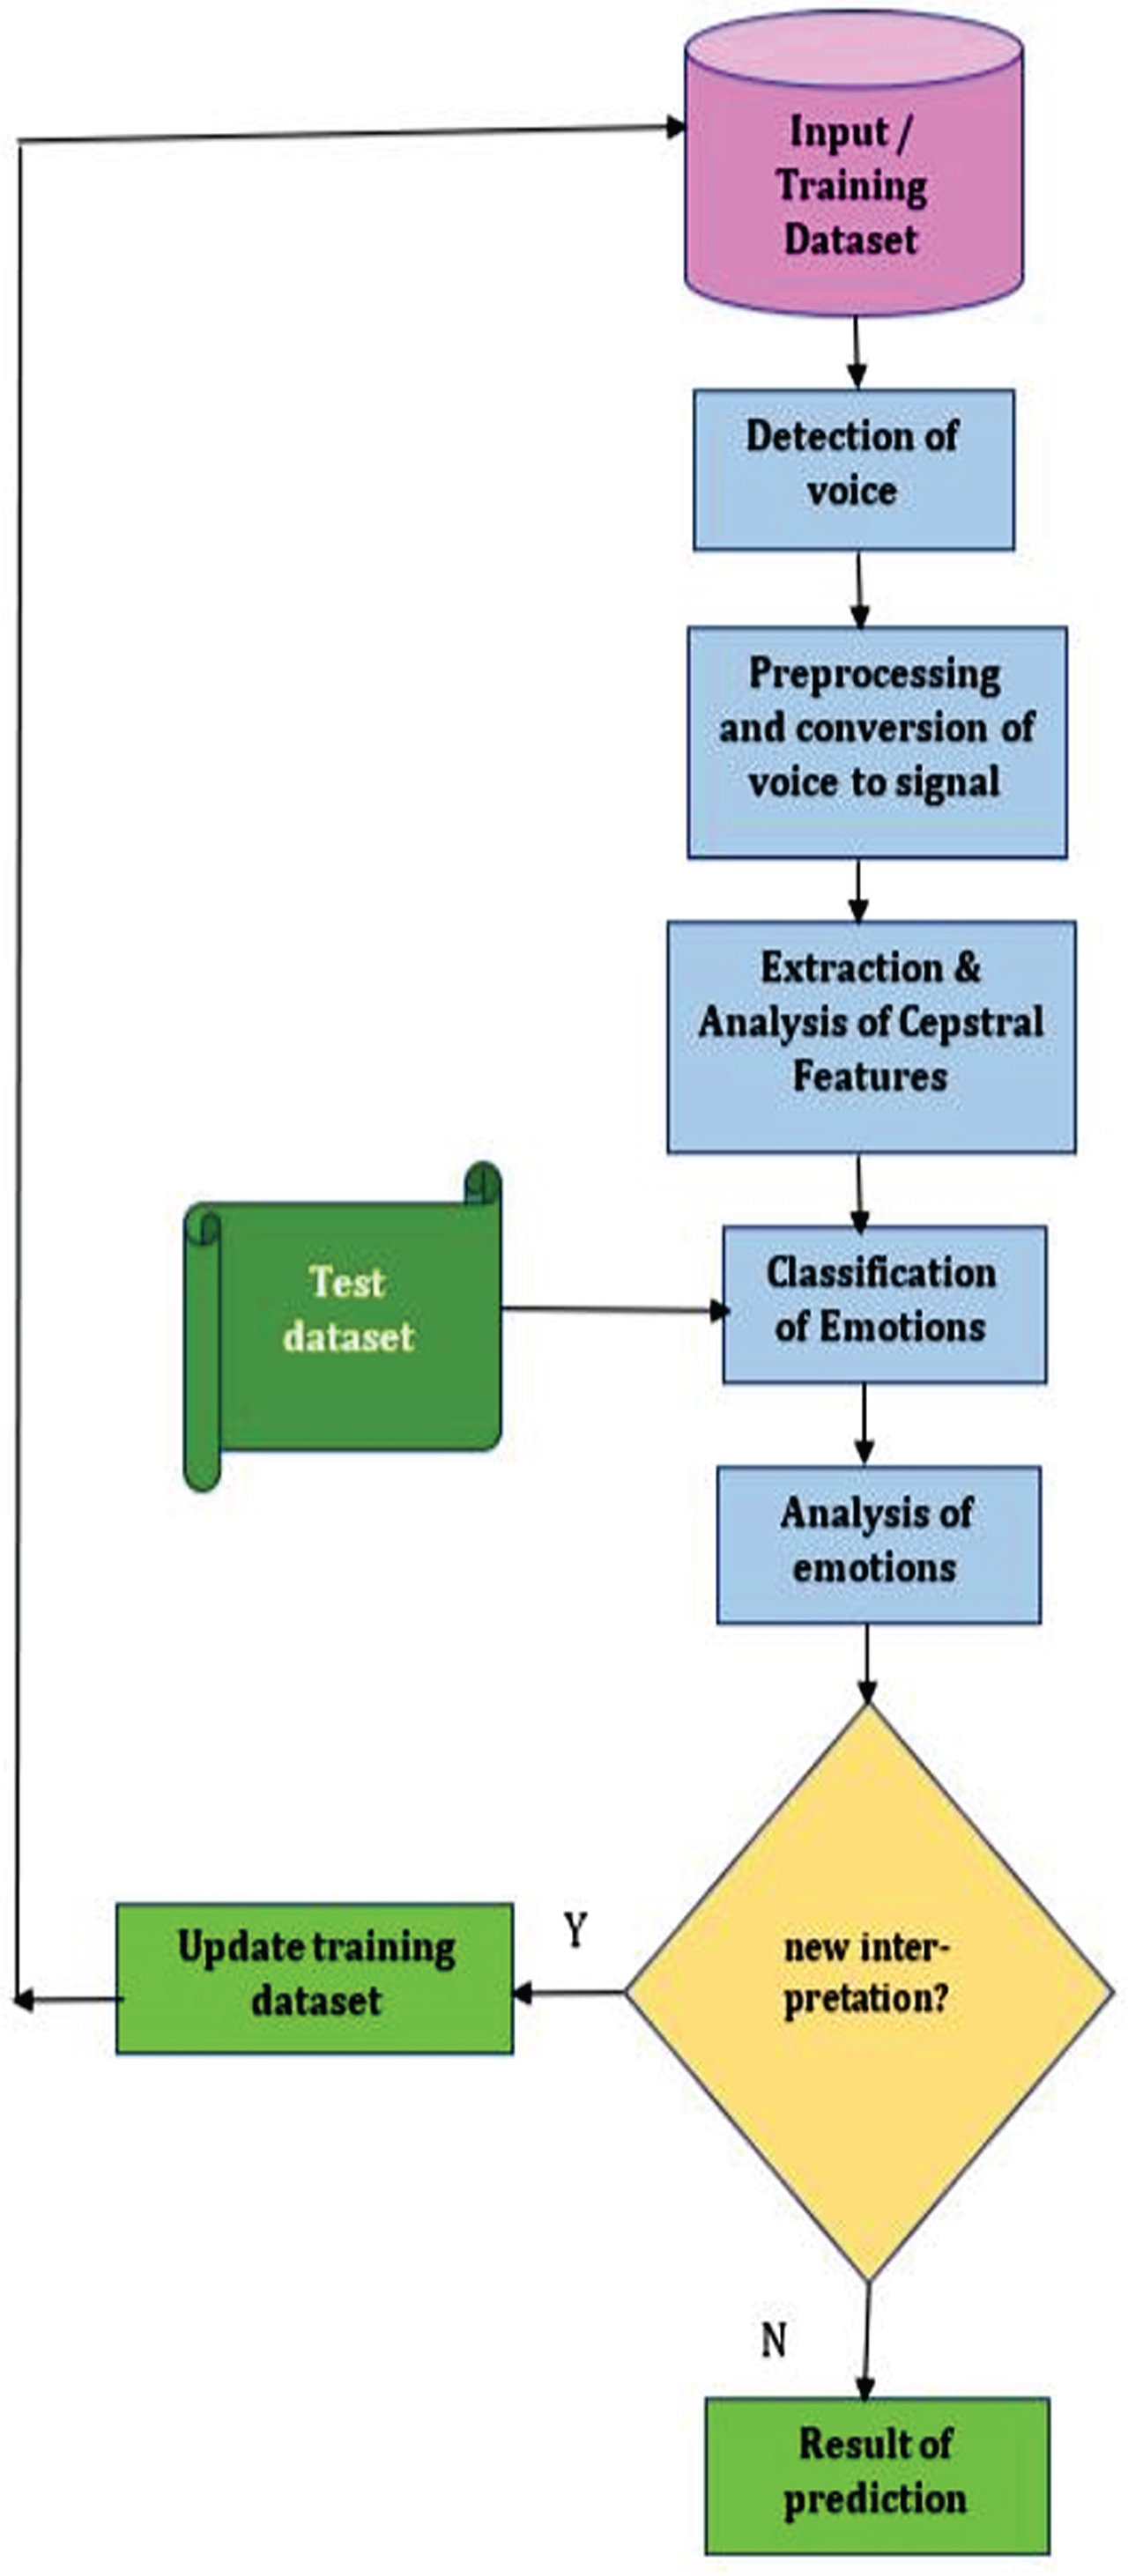
Flow diagram of emotion analysis in ASD.
The process of recognizing the emotions begins with the loading of the dataset. To perform this function, a special utility function called glob() function from the module called glob is used to retrieve the pathnames associated with the sound files in the dataset. To make the voice suitable for extracting its features, the voice signal obtained from the input dataset is processed in frames of 20 ms to 40 ms and these frames are overlapped to maintain a smooth transition. Windowing is done to minimize discontinuities and avoid spectral distortions. The FFT (Fast Frequency Transform) is applied to the windowing signal to convert the signal from the domain of time to the domain of frequency.
Feature extraction
This is a module that changes the waveform associated with the voice into a parametric form of representation at a comparatively reduced data rate. To perform this function, a special python package called librosa [21] is employed. The audio signal used by the deployed package for the feature extraction is characterized as a one-dimensional array, with the sampling rate denoting the frequency in which values of the audio signal shall be sampled. This part of the implementation is used to retrieve the following features from the input audio file.
Mel Frequency Cepstral Coefficient (MFCC)
This feature characterizes the short-term power spectrum of the corresponding sound. This represents the real value corresponding to the cepstral of the short-time signal resulting from the Fast Fourier Transform (FFT) of that particular signal. The extraction of MFCC consists of a series of steps such as pre-processing, framing (or) windowing, conversion into FFT spectrum, extraction of mel-spectrum. Table 1 shows the algorithm for MFCC extraction [24].
Algorithm for MFCC extraction
Algorithm for MFCC extraction
Figure 2. shows a sample visual representation of MFCC of anger emotion in the dataset in which the x-axis corresponds to the time and y-axis corresponds to the MFCC values concerned with anger emotion. The region matching the red color in the figure specifies larger values of the MFCC coefficients whereas the blue color specifies smaller values. This representation varies for every other emotion as the MFCC coefficients associated with each emotion are different.

MFCC representation of anger emotion.
The auditory system of humans does not have the capability of interpreting the pitch in a linear fashion that increases with frequency. To solve this, the mel-scale was designed in 1937 by Stevens, Volkmann and Newman [25] and framed the term ‘mel’ from the word ‘Melody’.
Mel is a frequency scale that is generally used to segregate and characterize audio signals and this perceptual scale of pitches is judged by listeners who are placed at an equal distance from one another. The solitary resolution of the experimentation was to define the auditory system of humans concerning a linear scale. The result of the experiment revealed that the frequency range of 0-1000 Hz perceives the pitch in a linear order. However this linear scale becomes logarithmic above 1000 Hz, which is 40 decibels above threshold of the listener.
A spectrogram is a visual depiction of various bands of frequencies of the audio signal as the signal is analog and non-periodic. A spectrogram can be produced by applying Fast Fourier Transform (FFT); This FFT is computed on overlapping several windowed segments of signals from which we get the resulting Spectrogram. Mapping y-axis frequency to ‘mel’ scale we get Mel Spectrogram.
Figure 3 depicts the visual representation of Mel Spectrogram of sample anger emotion. This is obtained by mapping the frequency of typical anger emotion present in the dataset in the scale of ‘mel’ (y-axis) to time (x-axis) & corresponding color dimension (amplitude) in decibels.

Visual representation of Mel Spectrogram of anger emotion.
The mel frequency scale is defined as:
Steps for computation of Mel Spectrogram
This feature of the voice corresponds to the 12 different classes of the pitch associated with the voice. Although representations of Mel-scale are generally used, they deliver a quiet low resolution of pitches and pitch classes. The representations of chroma or pitch class are frequently applied to convert harmony against suppressing variations in loudness, timbre and other aspects. Figure 4. portrays the visual representation of chromagram of sample anger emotion in the dataset using librosa package function [21]. The figure shows the different pitch classes represented by various colors corresponding to the sample emotion considered.
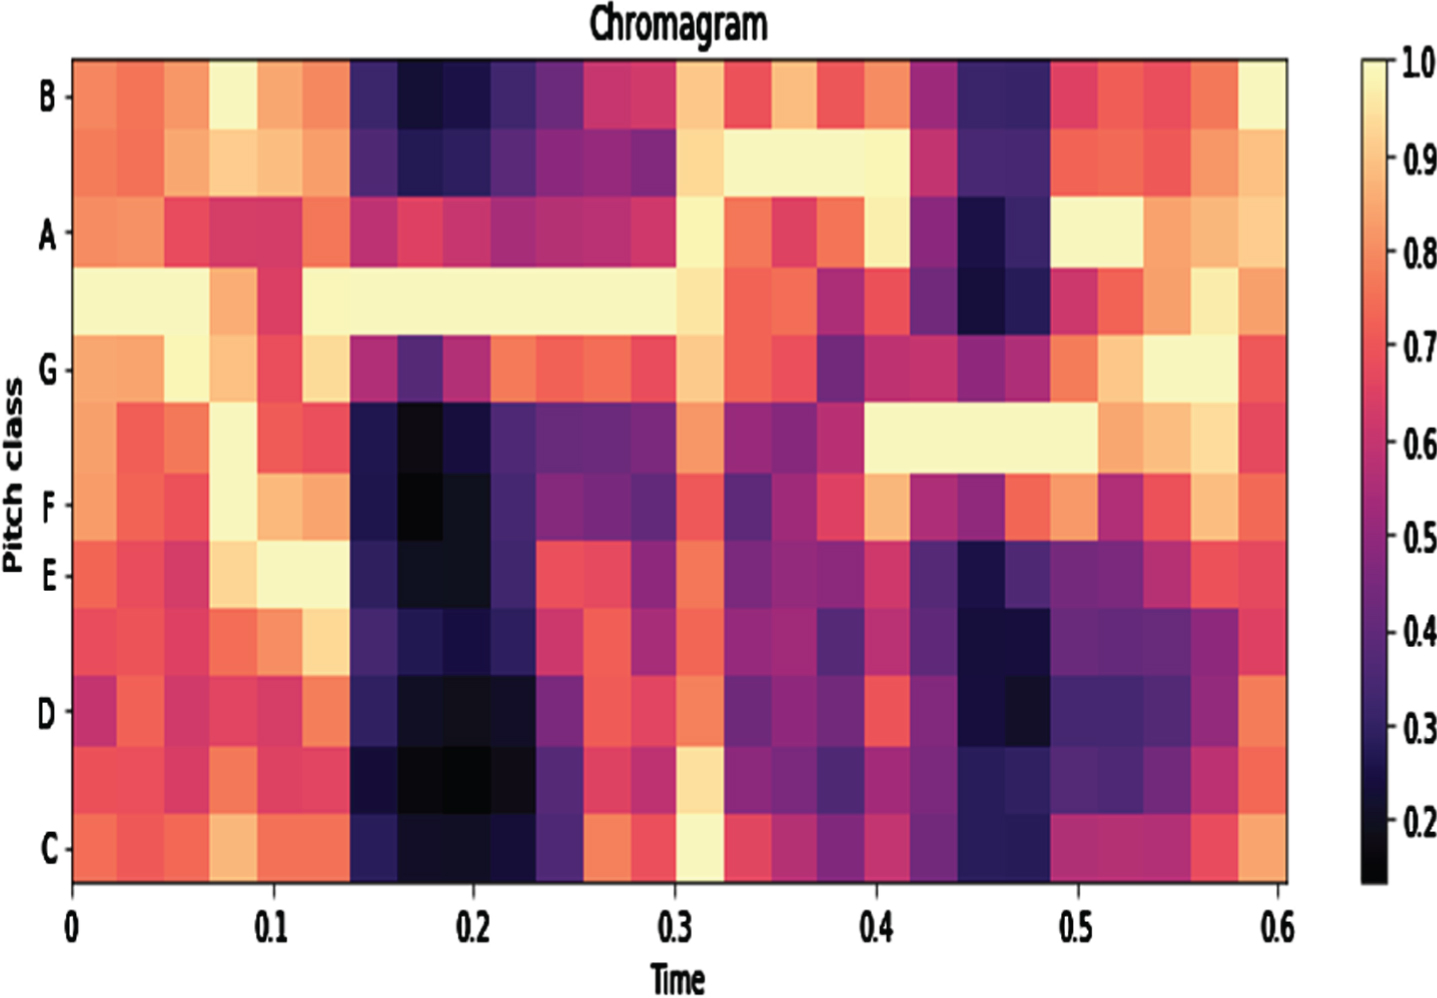
Chromagram representation of anger.
The tonnetz provides a different representation of harmony and pitch. A group of pitches namely a chord can be labeled as a single centroid point in the corresponding space. This feature encompasses such tonal centroids in the form of coordinates which are represented in a six-dimensional interval space. This is computed by the multiplication of chroma vector and the transformation matrix [23] where chroma vector is a vector representation obtained for each frame from 12 different pitch classes associated with the voice and the transformation matrix corresponds to the base of six-dimensional space. Thus tonnetz is used to represent the harmonic network associated with the voice. Table 3 shows the algorithm for feature extraction from voice.
Algorithm for Feature Extraction
Algorithm for Feature Extraction
Once the features are extracted, the emotions are predicted for the identified features using the Multi-layer Perceptron (MLP) Classifier. This classifier is a model of feedforward Artificial Neural network. Unlike other classification algorithms, this MLP classifier has an built-in neural network to perform classification.
A MLP classifier involves minimum three layers of nodes: an input layer, a hidden layer and an output layer. Excluding the first layer of input nodes, each node is designated as neuron that deploys a non-linear activation function. MLP employs a supervised learning technique known as backpropagation for training. Hence this work implements an MLP classifier to predict and classify the emotions.
The MLP classifier implemented in this work has one input layer, one hidden layer of 300 nodes and an output layer with the adaptive learning rate. The activation function used is Rectified Linear Unit (ReLU) function and the loss function is optimized using the stochastic gradient-based optimizer. Table 4 depicts the algorithm for emotion recognition from voice.
Algorithm for emotion recognition from voice
Algorithm for emotion recognition from voice
Dataset explanation
The data set used in this implementation contains the voice of the two classes of children who were identified as ASD and TD. Both the classes of children are observed in a similar environment and the voices have been recorded. This process takes 185 audio files categorized as ASD and 215 audio files categorized as TD. In the entire dataset, 80% of the files were used as training dataset and 20% of the files were used as test dataset in both the categories. Though the number of voice files considered for ASD seems to be minimum due to the challenges involved in data acquisition, the exploratory analysis of emotions using the dataset seems to be near to the processing capability. The experimental analysis performed in this paper focuses on exploring and analysing the emotions of the ASD children and TD children.
Classification of emotions
The classification of emotions is performed with the main aspect of articulating a fundamental screening mechanism that can be deployed as a suggestive factor of autistic behavior shortly. The proposed system revolves around seven major emotions such as anger, disgust, calmness, fear, happiness, neutral and sadness which exhibit the behaviour of humans. This classification and identification of emotions are performed through MLP classifier. MLP classifier proved to perform better to find the concerning emotion and classify them since it consists of an in-built neural network.
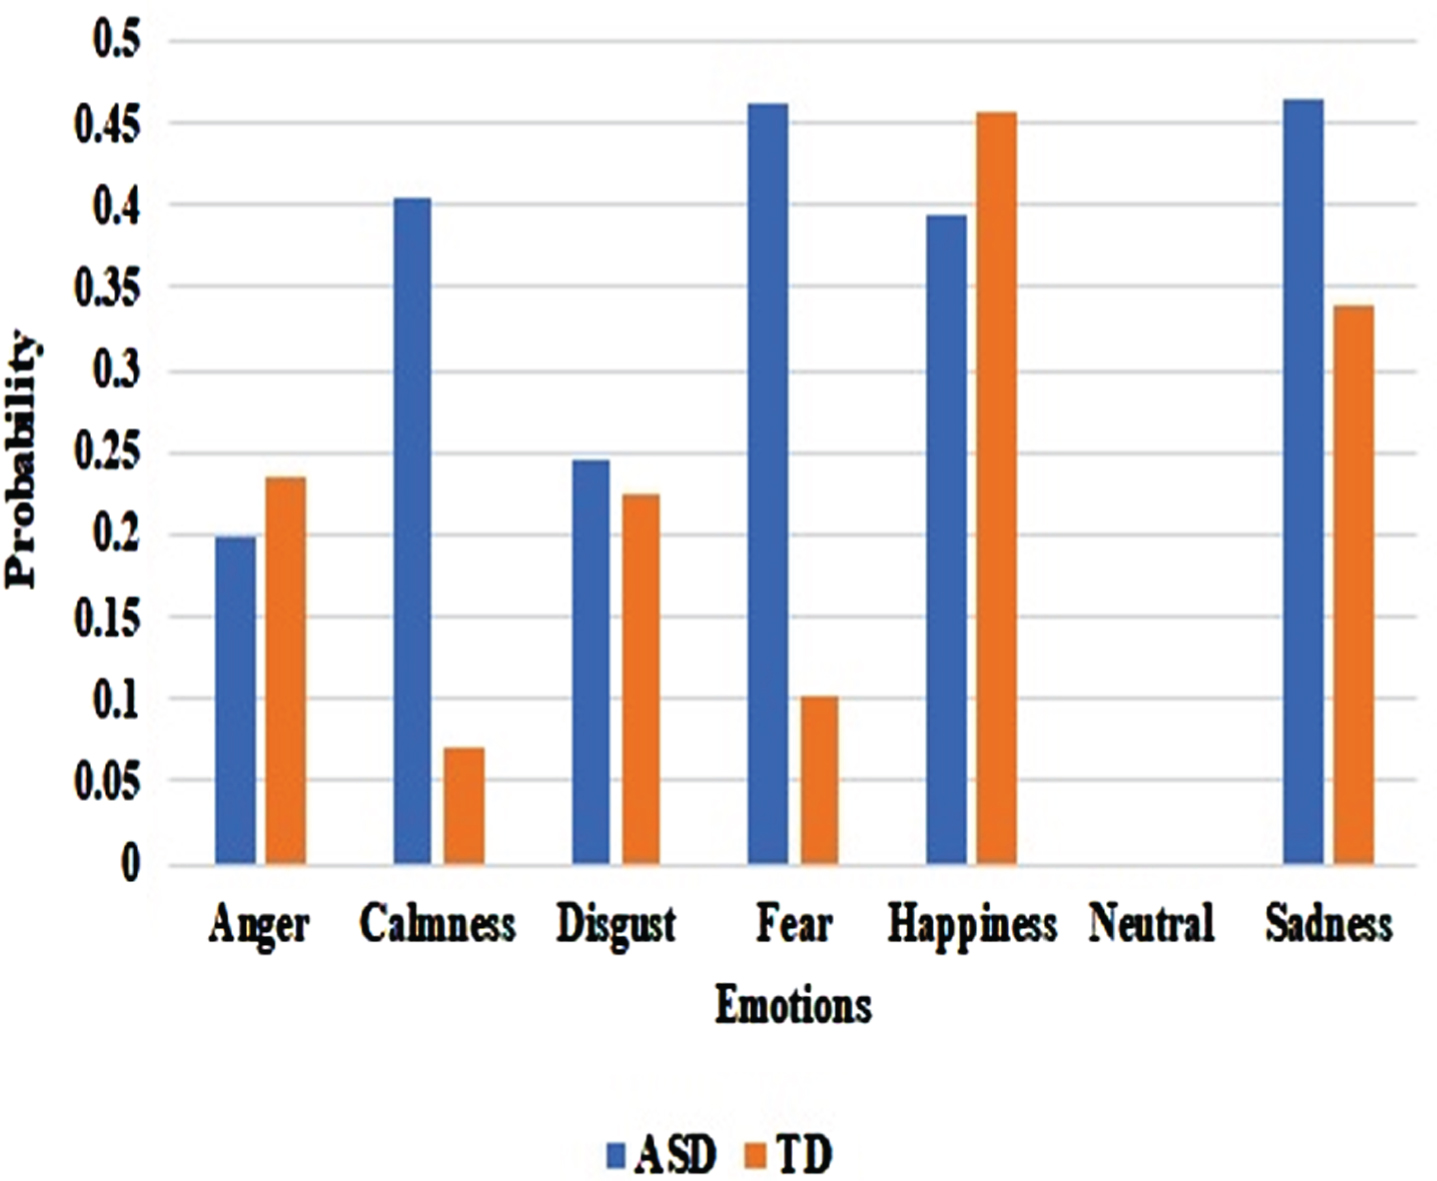
Table 5 shows the probability of each emotions corresponding to both ASD and TD. From Table 5, it can be inferred that the construal of emotions in ASD seems to be neutral, anger, disgust, fear, calmness, sadness, and happiness in maximum to a minimum order. It can be seen from Fig. 5. that the ASD children show neutral as their major emotion which is followed by anger or disgust as the next consecutive emotion with varied behaviour of the concerned children.
Probability of Emotions in ASD and TD
Probability of Emotions in ASD and TD
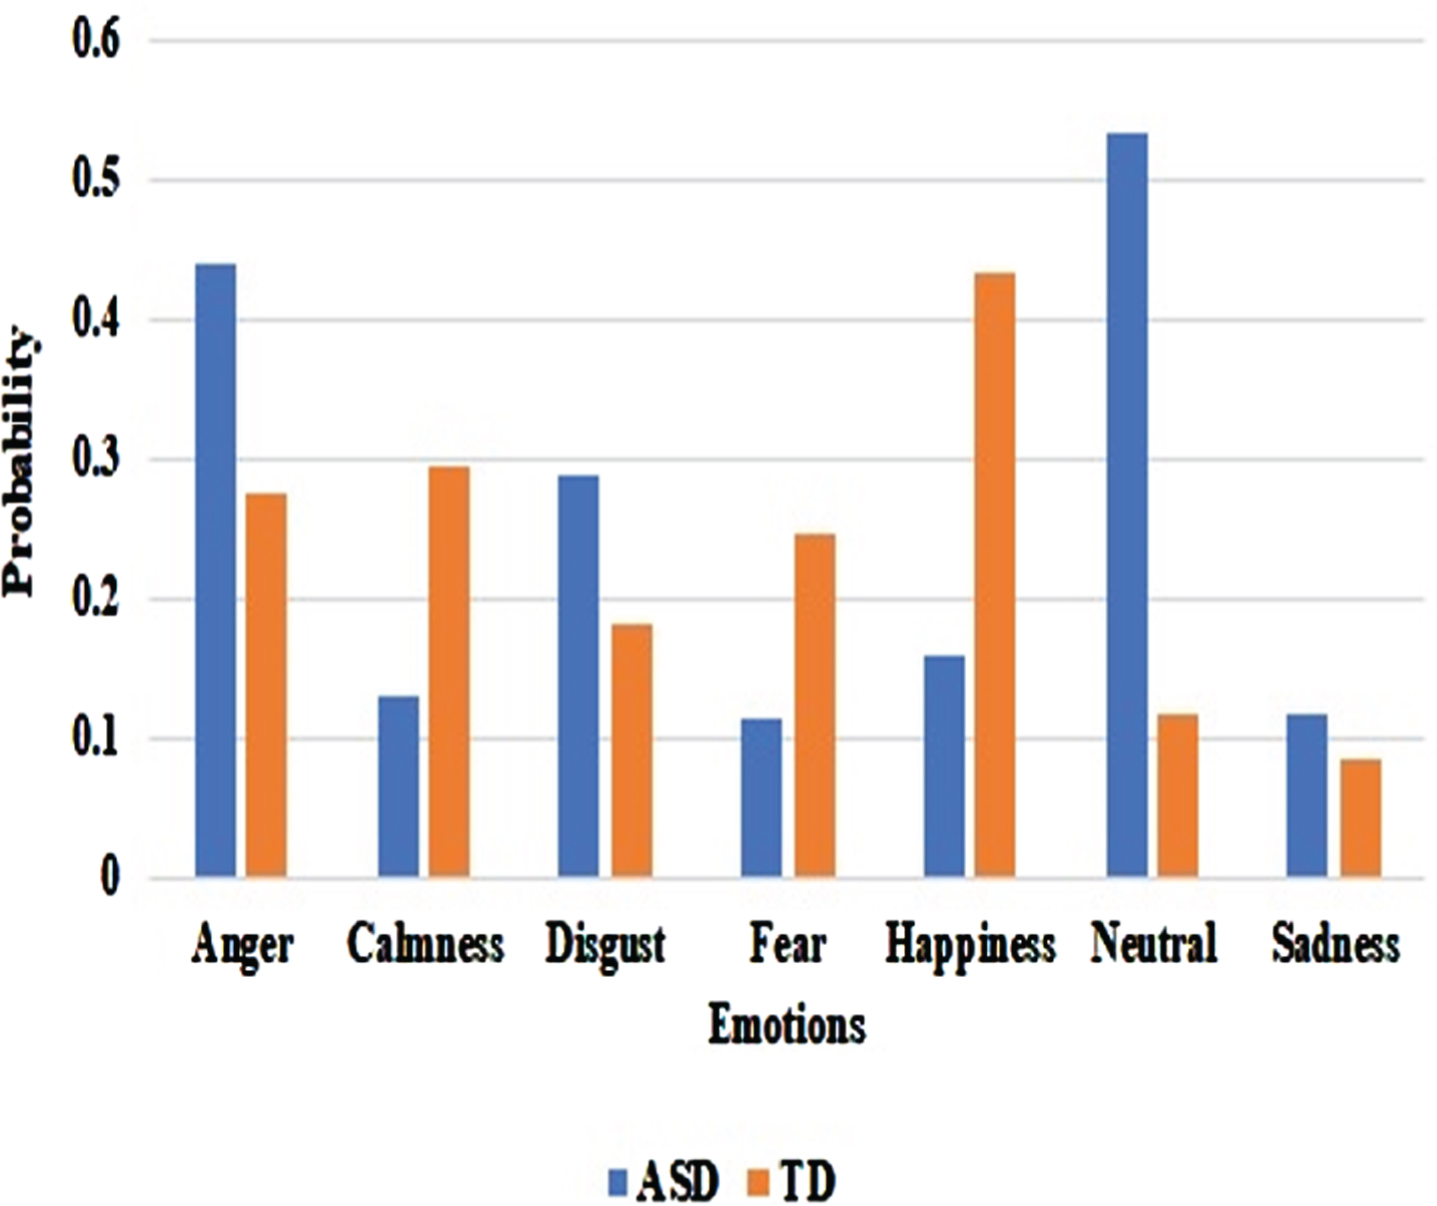
Comparison of emotions in ASD & TD.
The experimental studies indicate that TD children show happiness as the key emotion. Without any interference of the objects, the toddlers too exhibit neutral as their major emotion. This also interprets that the normal children show a maximum of happiness emotion which is followed by other emotions depending upon the atmosphere around them. However, in the case of autistic children, several objects can be shown, of which certain objects may contribute to change in the emotion exhibited by them.
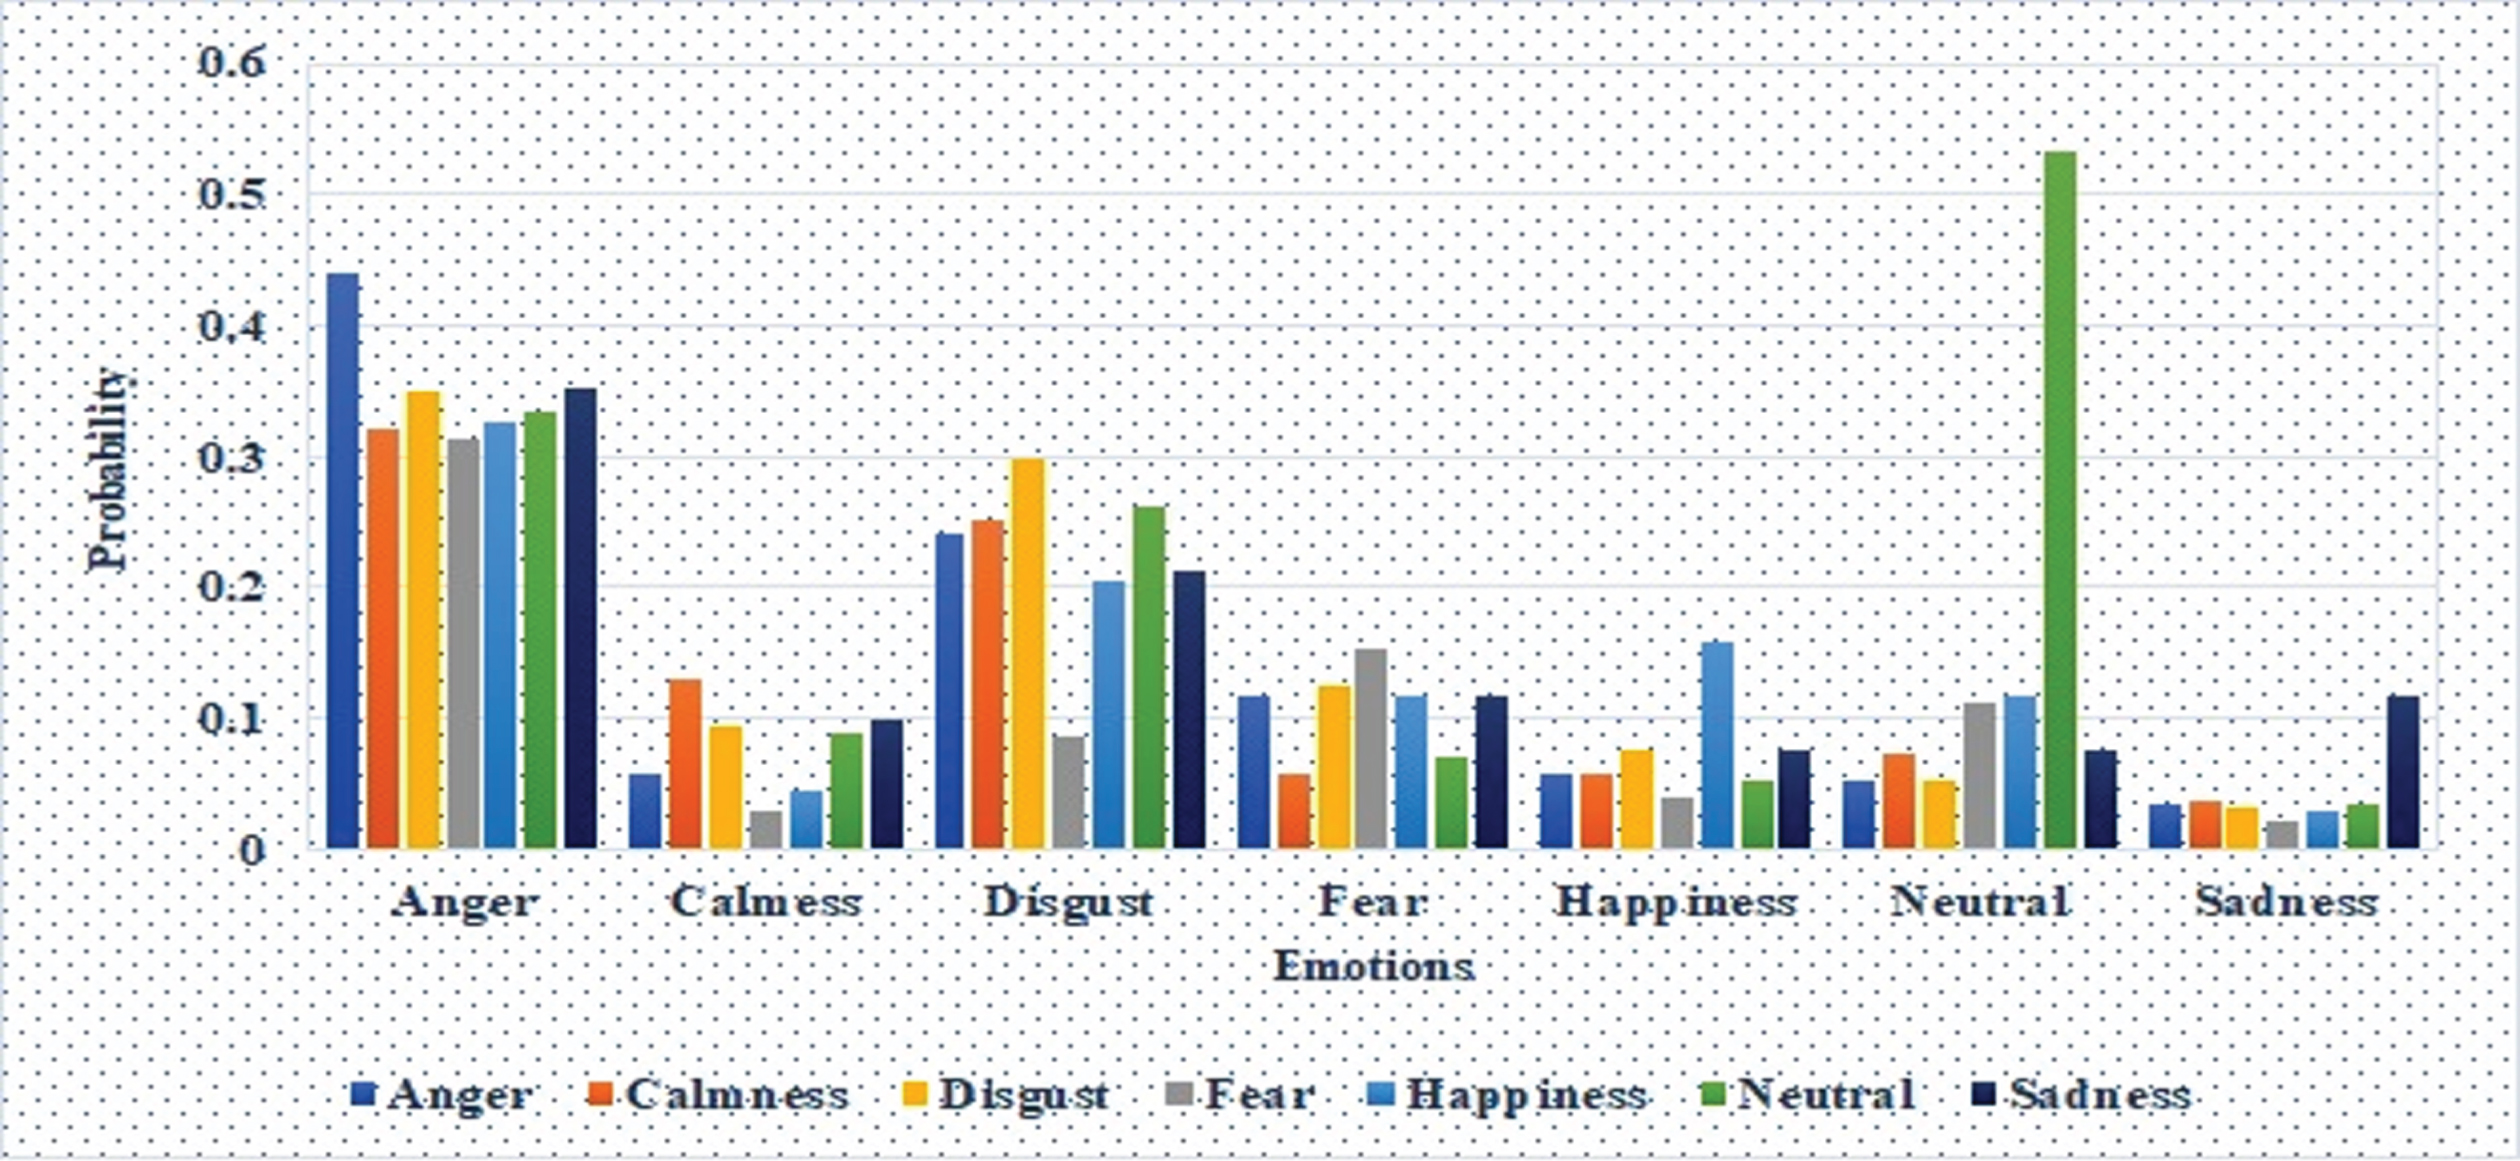
Table 6 shows the probability distribution of these seven emotions for ASD children derived as a result of experimental analysis. The above table shows the probability distribution which corresponds to the variation of emotions. From this table, the probability of any particular emotion to be predicted as that of the same emotion seems to be highest which commends the accuracy of the analysis. Figure 6. insights that maximum emotion prevailing in autistic children seems to be neutral taking the highest probability value in the experimental analysis which justifies the results shown in Table 5. Through this probability analysis, drifting from one emotion to other can be realized which may be used as a basic technique for discriminating between autistic children and toddlers.
Probability Distribution of Emotions in ASD
Flow of emotions in ASD.
The flow of emotions in TD children seems to vary smoothly may be from happiness to sadness, and then to anger or disgust and so on. But in autistic children, this smooth transition may not be happening which was inferred from the conventional clinical analysis method [17]. Their major response would remain as neutral emotion which may unexpectedly turn into anger [15] or disgust emotion that may drive them to show certain behavior which cannot be predicted. However, this variation of emotions may differ from children to children based upon the environment around them [26]. Henceforth this analysis can be used as a preliminary screening technique that can predict the autistic nature in children in the near future.
The trained model computes the probability values of each emotion and calculates the differences between them in successive iterations until there is no greater variation in the probability values across the emotions. The results are tabulated in Table 7 in which the probabilistic differences between the emotions could be observed that helps to understand the proximity emotions associated with each emotion of ASD and TD children. These deviations between the emotions helps us to realize the next consecutive emotion and their flow towards revealing their behavior.
Comparison of difference in probability values of ASD and TD
Figure 7 shows that the proximity emotions of anger are found to be disgust and neutral as inferred from the probability variation of the emotions for ASD children. This shows the next emotion of anger can be disgust or neutral as the probability differences between those emotions are minimum. This can also be inferred form the overall probability value given in Table 5 which justifies the analysis. Likewise, for TD children the observation indicates that the emotion next to anger might be pictured as calmness and sadness. Similarly, Fig. 8. provides the observation that anger and disgust are the proximity emotions for neutral in autistic children which is vindicated from the experimental insights.

Proximity emotion of anger.
Proximity emotion of neutral.
In the same manner, Fig. 9. depicts that the proximity emotions for disgust in ASD children are anger and neutral which justifies the experimental findings. The differences in probabilities provides insights regarding the change in emotions and thereby helps in the categorization between ASD and TD. Thus the analysis illustrates that the emotions of the majority of autistic children revolve around neutral, anger and disgust on most occasions.

Proximity emotion of disgust.
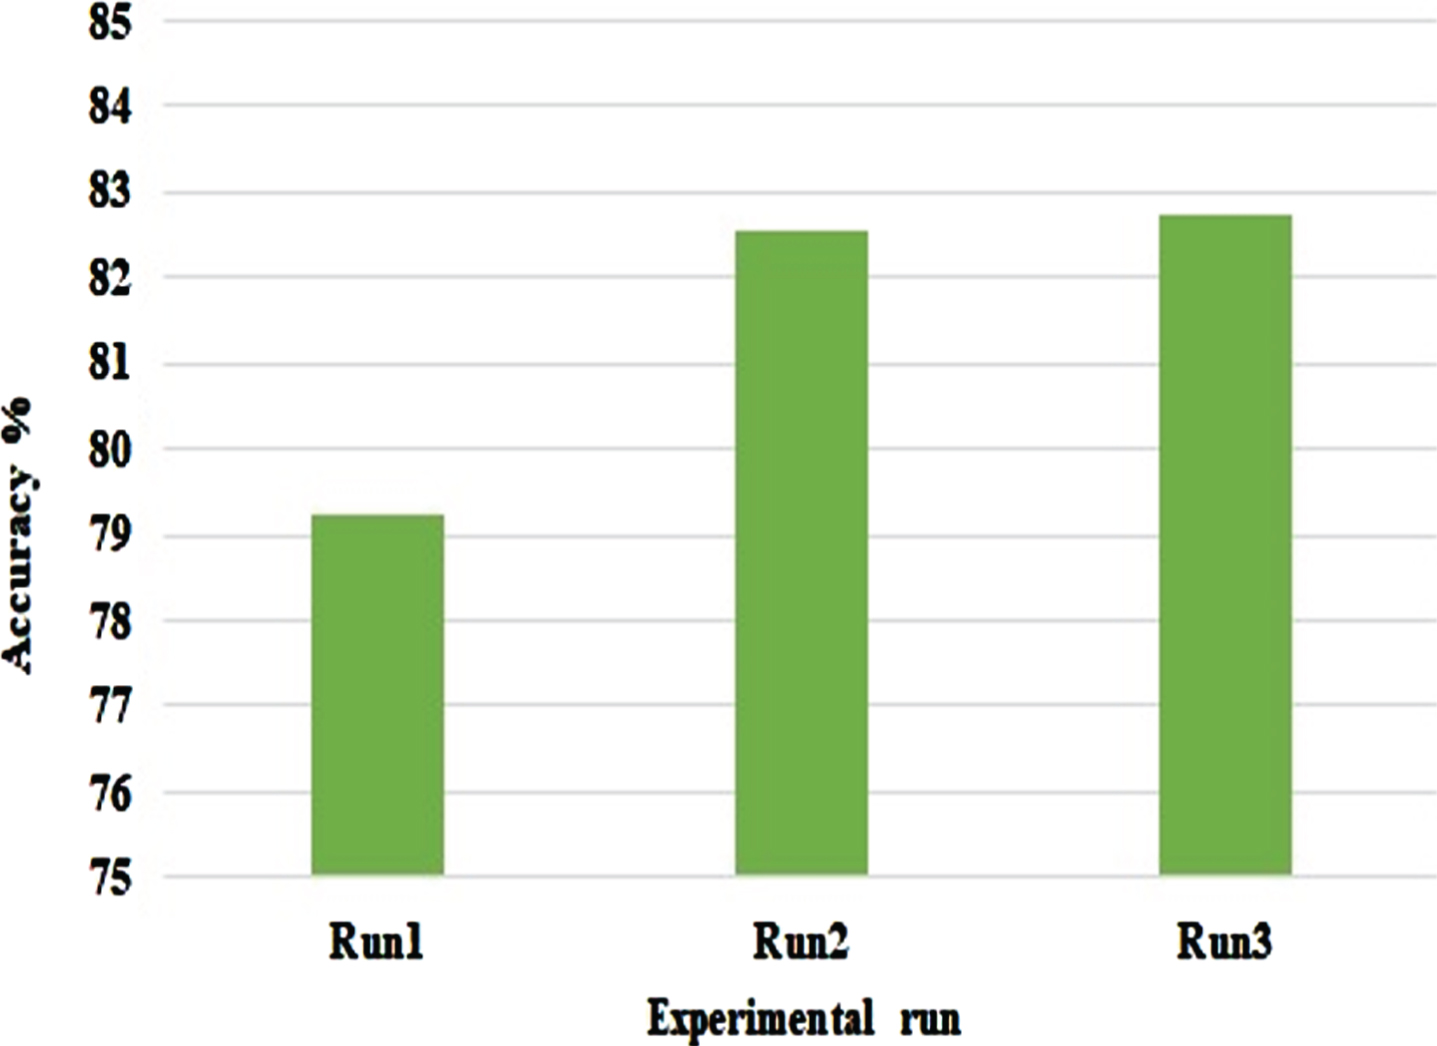
The testing is performed with the 20% of the datasets in both categories to ensure the correctness of the emotion predicted as a result. The measures such as precision and recall are used to evaluate the performance of the proposed model. Table 8 shows the performance measures for the emotion analysis in ASD children. The accuracy of the emotion analysis process is determined by the performance of the training and the testing datasets. The accuracy is calculated from the values of actual emotions and the predicted emotions. On first execution of the process, the accuracy was found to be 79.25% and during the second run it was found to be 82.56% and the next consecutive runs gave 82.75% of accuracy. On an average, the performance accuracy of the process was found to be 81.52%. Figure 10. depicts the accuracy factor involved in the process of emotion analysis. This can be further enhanced by improving the training process with more combinations of features and by increasing the size of the data considered for the process.
Performance Measures
Performance Measures
Accuracy of emotion analysis.
The identification of emotions in ASD children is extremely important to provide proper training and coaching to the concerned autistic children. There are many techniques and systems available to identify the presence of autism disorder in children. The paper focuses on the flow of seven basic emotions such as anger, disgust, neutral, happiness, calmness, fear and sadness which was evaluated by the probabilistic distribution values associated with the emotions. From the analysis, it can be perceived that the major emotion shown by the toddlers moves around happiness and calmness while the major emotion exhibited by the autistic children revolves around neutral, anger and disgust [13]. The emotion analysis performed in this paper also recommends the major emotion and the next prime emotion shown by the children through which the behavior of the children can be analyzed. The accuracy of this analysis revolves around 80% which can be further enhanced with the inclusion of more features. Thus the proposed analysis helps to assist the process of identification of autism through their voice and to analyze the emotions exhibited by them observing their natural behavior.