
Abstract
In process industries, measurements usually contain errors due to the improper instrumental variation, physical leakages in process streams and nodes, and inaccurate recording/reporting. Thus, these measurements violate the laws of conservation, and do not conform to process constraints. Data reconciliation (DR) is used to resolve the difference between measurements and constraints. DR is also used in reducing the effect of random errors and more accurately estimating the true values. A multivariate technique that is used to obtain estimates of true values while preserving the most significant inherent variation is Principal Component Analysis (PCA). PCA is used to reduce the dimensionality of the data with minimum information loss. In this paper, two new DR techniques are proposed moving-average PCA (MA-PCA) and exponentially weighted moving average PCA (EWMA-PCA) to improve the performance of DR and obtain more accurate and consistent data. These DR techniques are compared based on RMSE. Further, these techniques are analyzed for different values of sample size, weighting factor, and variances.
Introduction
In industries, process data play an important role in process control, monitoring, optimization, and decision making. As technological innovations continue to rise in the industrial sector, visibility into a process and its monitoring are frequently obstructed by randomness in on-line measurements, instrument inaccuracies and malfunctions, which can be classified either as gross errors or random errors [2, 13]. Data Reconciliation (DR) techniques are used to minimize the errors in process measurement data [1, 16].
A method popularly used for data processing and multivariate analysis is principal component analysis (PCA). PCA is mainly used for dimensionality reduction, and aids in developing predictive multivariate models. The transformed variables (known as Principal Components or PCs) are orthogonal, and when arranged in decreasing order, the first few principal components capture the largest amount of variation contained in the multivariate data [6, 15].
In most process monitoring applications, steady state process variables are assumed to have a fixed mean. Due to process dynamics, environmental variations, and equipment degradation, process data become time-dependent. These non-stationary behaviors are not captured by PCA and scaling (of statistical parameters like mean and variance) is required before decomposing large dimensional data. When measured values of process variables differ by a large magnitude (spanning across orders of magnitude), the data reconciliation may be inaccurate, due to the stretching of variables along one single axis, known in this context as the dominant PC axis. Thus, PCA based DR is sensitive to the magnitude of process variables. In this paper, two techniques MA-PCA and EWMA-PCA based DR are introduced to overcome this limitation [7, 19].
The paper is organized as follows. Section 2 provides a short summary of MA-PCA and EWMA-PCA based DR techniques. In Section 3, characteristics of the chosen benchmark problem (a steam metering circuit), simulation assumptions considered for process environment, and simulation results are presented. Section 4 contains the results and discussion of the simulation study.
Data reconciliation (DR)
DR estimates the true value of process variables via de-noising the measurement data. The reconciled data are more accurate compared to the original data. The variation between data reconciliation and other filtering techniques is that data reconciliation utilizes the process constraints in the model (typically based on conservation laws).
The steady state data reconciliation problem is defined in equation (1),
Where,
Figure 1 illustrates the process of data reconciliation to estimate true values. First raw measurements are obtained, then they are processed using MA or EWMA. Later PCA is applied to pre-processed data (Y
ma
or Y
e
) to estimate reconciled data (
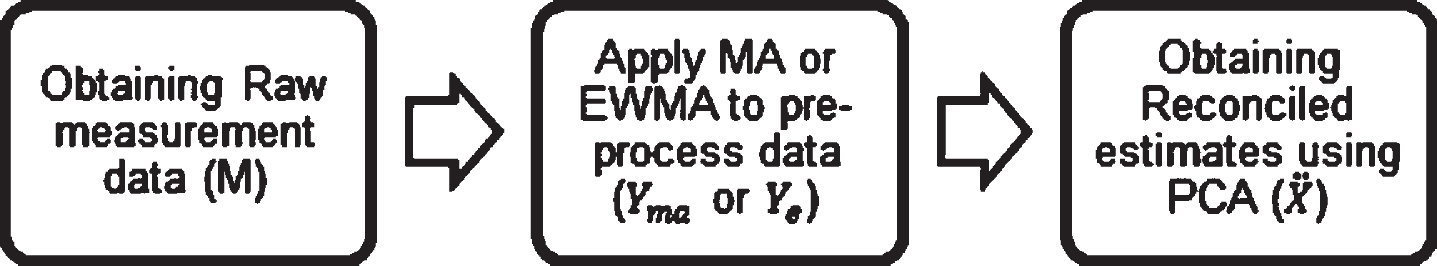
MA-PCA and EWMA-PCA based DR.
Moving Average (MA) is a method popularly used for pre-processing data to filter ‘white-noise’. It averages a specified number of variables, giving equal weight to each variable of the data [4, 19]. The moving-average can be expressed mathematically as:
The exponentially weighted moving average (EWMA) is a widely used method that gives weight to the recent data by improving simple variance [4, 10]. Here, the same approach is described based on a statistic
PCA based DR techniques are used for reducing random errors present in raw measurements and obtain reconciled estimates. In this technique, principal components (PCs) are obtained by linearly transforming the original variables into new ones that are mutually independent (orthogonal). Here, the new variable that has the highest variance is termed as the first PC. Orthogonal to the first PC is the second PC, which has next highest variance, and so on. Further, the dimensionality of the data is reduced to obtain reconciled data, and this is done by retaining the first few PCs that capture the most variance (typically selected using the 80:20 Pareto Principle). To obtain these PCs, Singular Value Decomposition (SVD) is used [11, 18].
To obtain PCs, Singular Value Decomposition (SVD) is applied to Y
ma
or Y
e
as shown in equation (6)
Root Mean Square Error (RMSE) is a measure of a performance metric that is applied to true values and the reconciled estimates. The individual differences between true values and the reconciled data are also called as residuals. RMSE serves to aggregate them to compare the prediction errors across different DR techniques [17]. Mathematically, it is defined as:
Figure 2 shows a large steam metering circuit, to obtain a materialized data matrix to implement DR techniques. This circuit consists of 28 flow variables and 11 nodes [3, 5]. At each node, it has the notation of inflows and outflows by an arrow that indicates the direction of flow. In the circuit (Fig. 2), the base values of flow rates are estimated through the mass-balance equation.
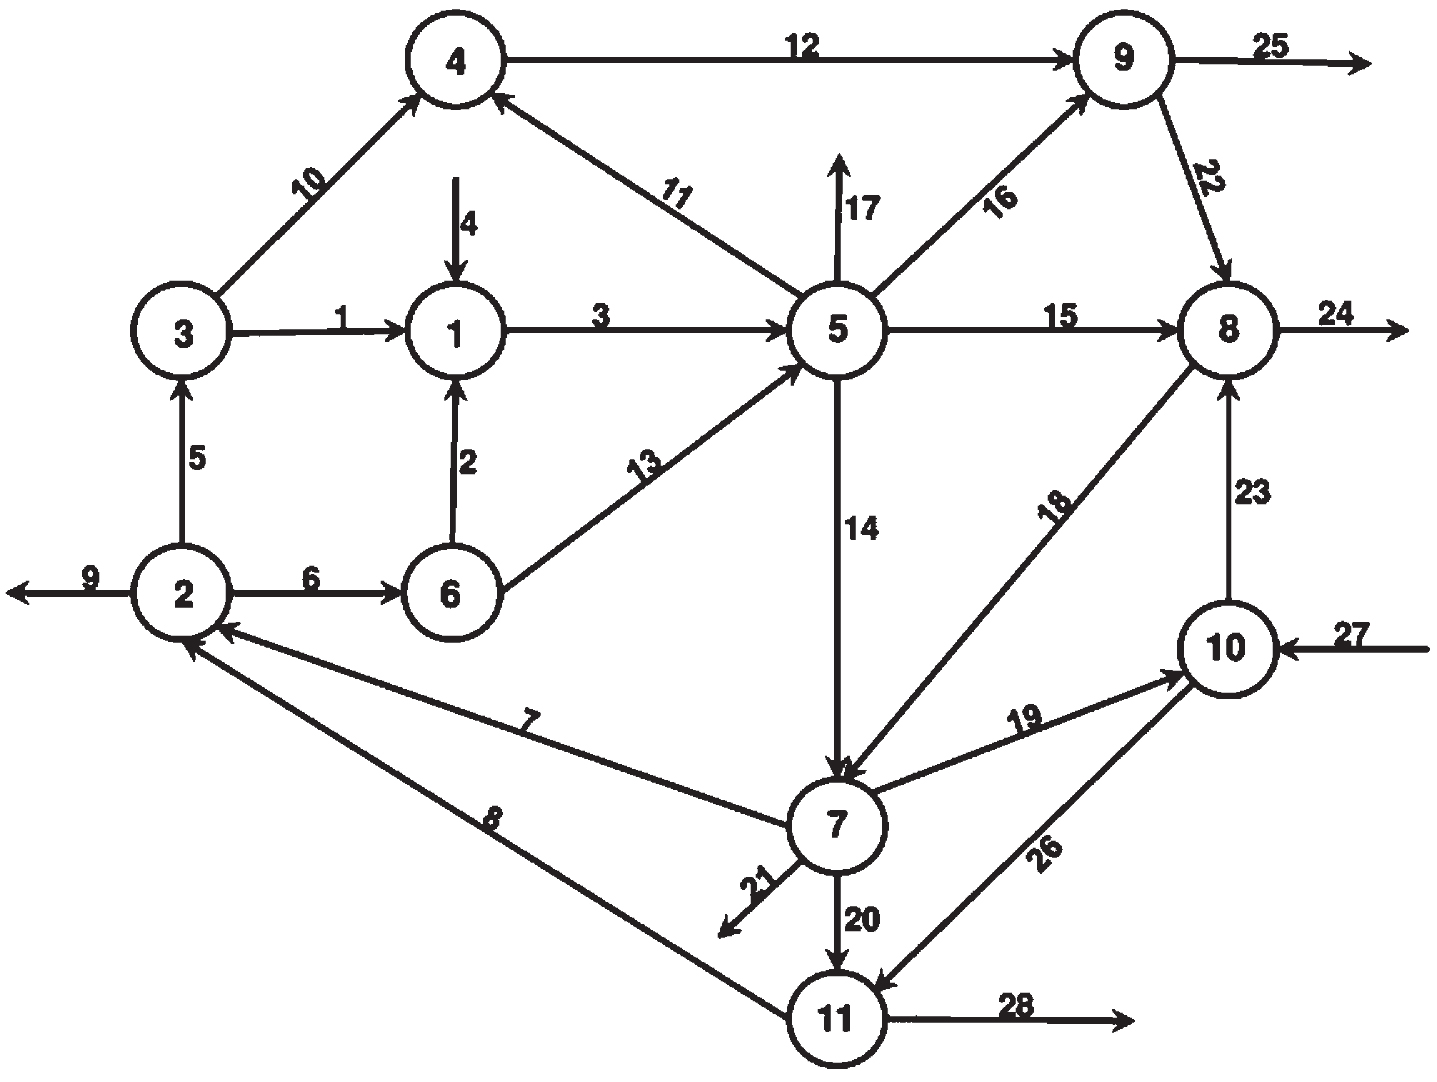
Steam metering circuit.
Base value of flow variable
The above mentioned DR techniques are implemented through python.
To simulate the data, the following assumptions were made [12, 15]: The flow process operates under the linear steady-state condition. The measured value of each flow variable is normally distributed, i.e., y (j) ∼ N (0, σ2) Process constraints are linear. The variables in the process have identical variances. The samples in the measurement errors are independent and identically distributed (i . i . d). The covariance matrix is known and considered, with ∑ = I
The proposed DR techniques described in Section 2 were implemented and results are presented in Table 2. Table 2 compares the performance of PCA, MA-PCA (sample size k* = 50), and EWMA-PCA (λ=0.01) based DR techniques. From Table 2, it is seen that PCA based DR values of node 8 with inflow 15, 22, and 23 are 0.4401, 0.8777, and 0.878 respectively, while the values of the outflow variables 18 and 24 are 1.7544 and 0.4405, respectively. RMSE of flow variables 15 and 24 are almost the same. This shows that RMSE of a node is independent of inflow and outflow.
Performance of DR techniques
Further, it is noticed that the RMSE of DR techniques of nodes 5, 9, and 10 with its corresponding flow variables are varying randomly. From this, it is concluded that the DR techniques are not influenced by inflow and outflow variables.
When the results were analyzed based on the base value of magnitudes (30, 40, and 45), the RMSE of PCA based DR of flow variables (F3, F18, and F27) were determined to be 1.3154, 1.7544, and 1.9727, respectively. This shows that there is a gradual increase in RMSE with an increase in the magnitude of flow variables.
Further, the performance of DR techniques is compared in Table 2. It is observed that after DR, reconciled data have smaller RMSE than raw data. This concludes that the performance of DR techniques led to an improvement (in the estimates of true values of process variables) compared to the raw data.
Figure 3 shows the performance of the DR technique for varying magnitude of flow variables. To compare these techniques, seven flow variables F1, F5, F7, F18, F25, F27, and F28 are selected and the graph is plotted. From this, it is depicted that RMSE of raw data is constant throughout flow variables, whereas, for DR techniques there is an increase in RMSE for a corresponding increase in the magnitude of flow variables. This shows that DR techniques are sensitive to the magnitude of flow variables. Here, it is also observed that the PCA has a high slope while EWMA-PCA has a low slope. This indicates that PCA is more sensitive and EWMA-PCA is less sensitive to the magnitude of flow variables. Further, it also inferred that EWMA-PCA and MA-PCA provide greater improvement in terms of DR accuracy compared to PCA.

Performance of DR techniques for varying magnitude.
MA-PCA based DR is performed for different values of the sample group (k* = 3, 7, 10, 20, 50). Figure 4 depicts that MA-PCA with a large value of k* (k* = 50) has a low slope and is less sensitive to the magnitude of flow variables, compared to PCA. This concludes that MA-PCA provides good improvement for large sample groups (k*).

Performance of MA-PCA for varying k*.
Figure 5 presents the performance of MA-PCA for varying sample sizes (k*). Sample sizes 3, 7, 10, 20, and 50 are selected for simulation. However, sample sizes of more than 50 may take longer computation time. For increasing sample size, the performance of MA-PCA shows an improving trend. RMSE for all selected variables is consistent from k*=20 to 50.
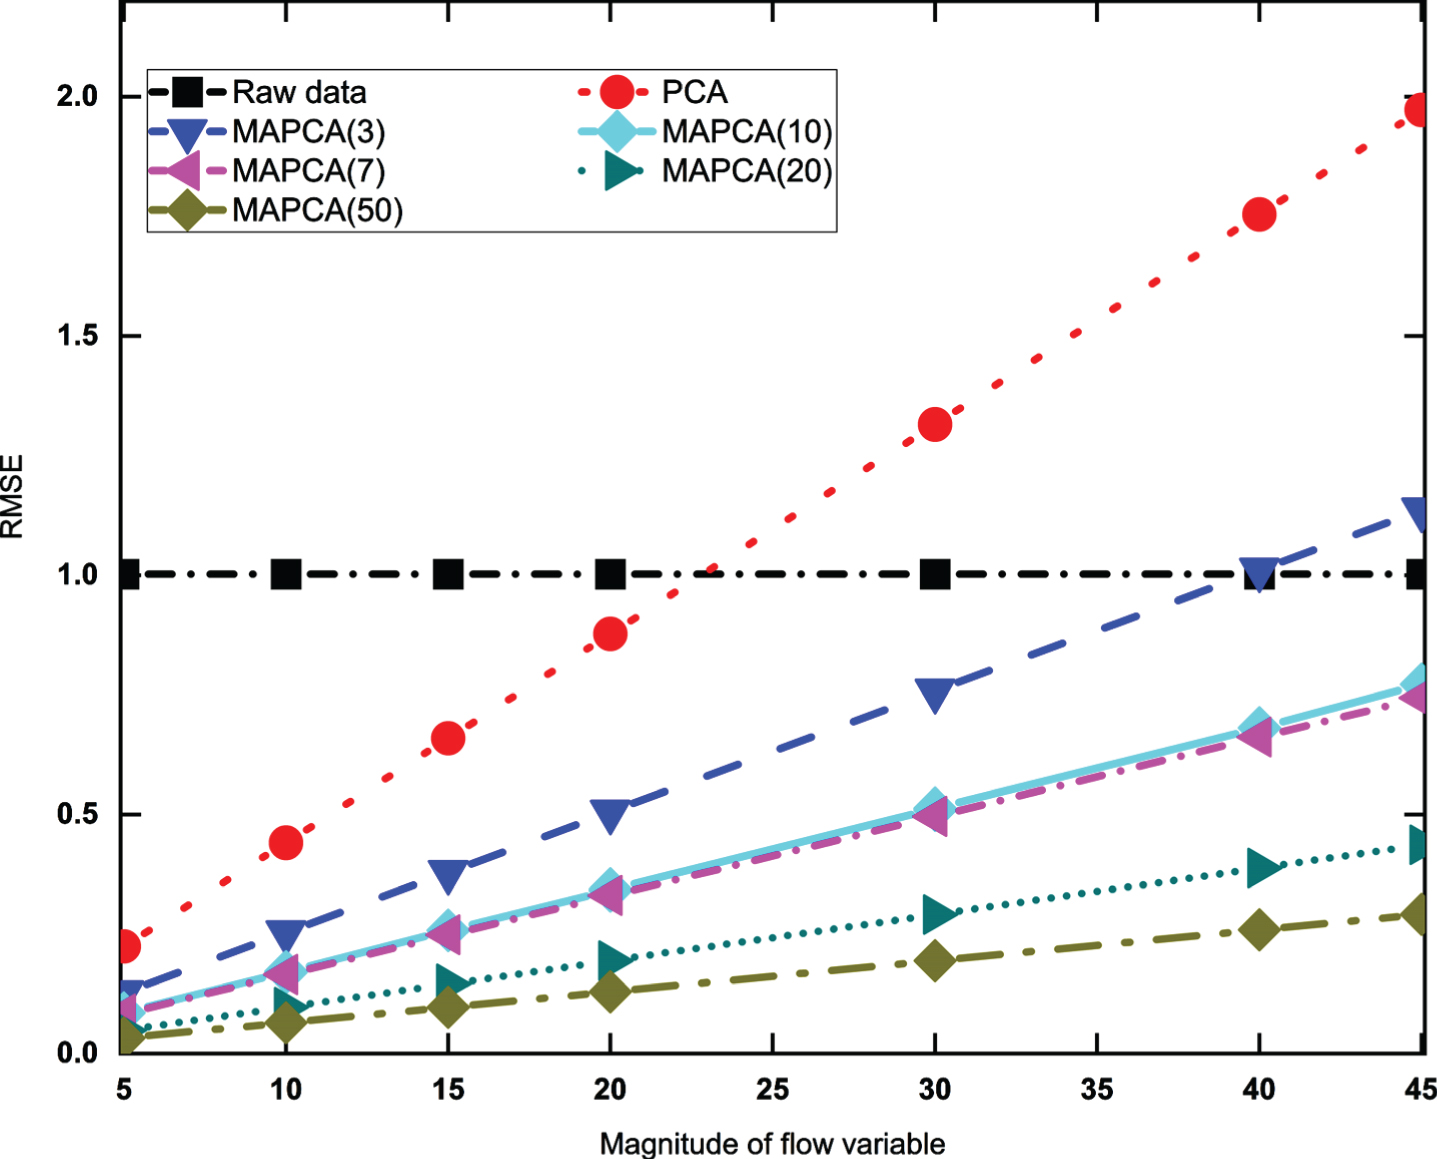
Performance of MA-PCA based DR techniques for varying magnitude.
Figure 6, shows the performance of different variables to varying values of the filter coefficient (λ). For higher values of filter coefficient, the performance of the DR technique shows a decline. Therefore, the range of filter coefficient is fixed between 0.01 and 0.05. For λ = 0.01, RMSE of all variables is low, and slowly increases for higher λ.

Performance of EWMA-PCA for varying λ.
Figure 7 shows the plot of EWMA-PCA based DR for varying magnitude with filter coefficient λ of 0.01 and 0.05. From this, it is observed that a λ of 0.01 has a low slope which implies it is less sensitive to the magnitude of flow variables. This implies that EWMA-PCA has improved for a small value of weighting factor (λ). Further, these DR techniques were also compared and analyzed for different values of variance (σ2). It was observed that a smaller variance made the DR performance less sensitive to the magnitude of flow variables.
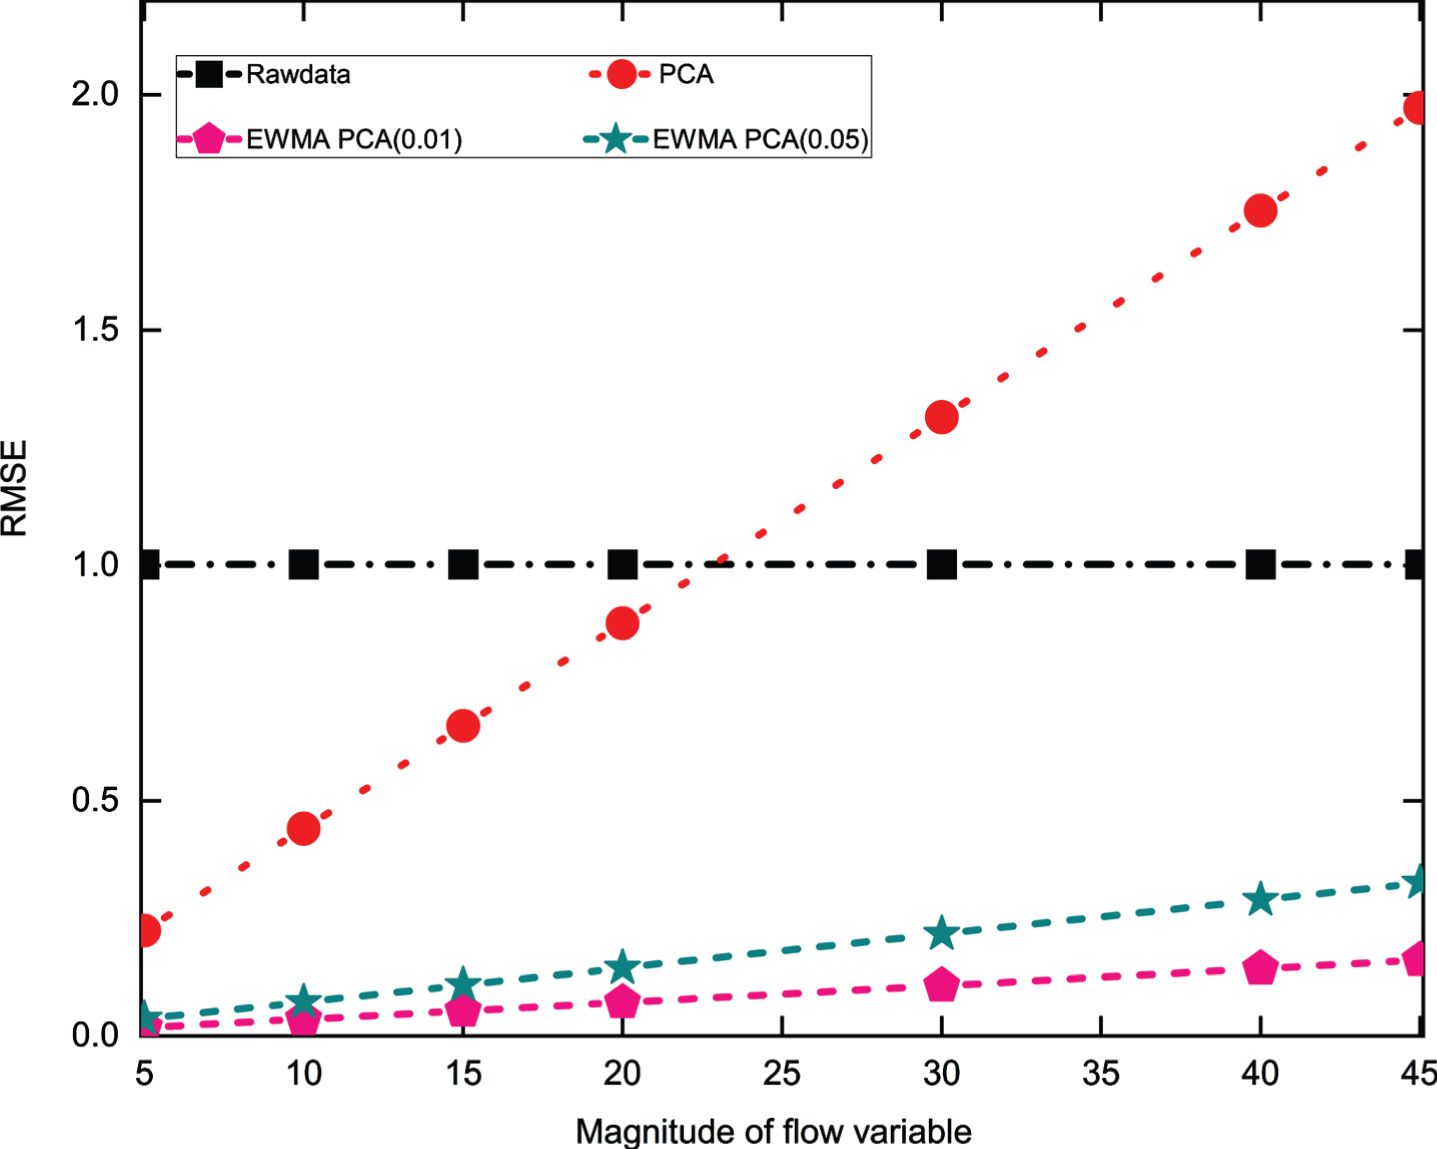
Performance of EWMA-PCA based DR techniques for varying magnitude.
In this paper, two DR techniques MA-PCA and EWMA-PCA are proposed, and implemented using Python. Here, simple PCA based DR was implemented to obtain reconciled estimates by reducing dimensionality as well as the effect of random errors. It was observed that the performance of PCA is more sensitive to the magnitude of flow variables. To reduce the sensitivity, MA-PCA and EWMA-PCA based DR techniques are recommended.
From the results, it was seen that EWMA-PCA is less sensitive to the magnitude of flow variables and provides more accurate estimate of process data, and MA-PCA has greater accuracy than PCA. Further, MA-PCA and EWMA-PCA were performed for different values of the sample group and filter coefficient, it was observed that MA-PCA with a large value of the sample group (k*) and EWMA-PCA for a small value of filter coefficient (λ) showed improvement over PCA, and provided more consistent data.
DR techniques were seen not to be influenced by the inflow and outflow of variables. This study has been carried out based on assumptions that the errors in the measurement are independent and identically distributed (i . i . d .) with all variables having identical variance. Further studies can be conducted for analyzing the performance of these DR techniques with variables having different variance, with a different set of assumptions.