
Abstract
With the development of the city, the passenger flow pressure of subway is increasing. At the same time, the daily travel of subway passengers produce a large amount of data such as inbound and outbound. How to use the big data to analyze the passenger flow is the key to solve the problems of crowded carriages and insufficient capacity in peak hours, high empty load rate in low hours and long waiting time for passengers. Based on the AFC data of Beijing subway system, this paper analyzes the temporal and spatial distribution characteristics of the passenger flow in the subway network. At the same time, taking subway line 5 as an example, it quantitatively calculates the imbalance coefficient of passenger flow in time, section and direction. Combined with the calculation results, it also proposes management optimization model and gives some adviceto the subway operation department from the aspects ofpassenger organization and transport management.
Introduction
As an important part of urban rail transit, the subway not only brings convenience and speed to people’s daily travel, but also plays an important role in easing urban traffic congestion. However, with the development of the city and the extension of the route mileage, the pressure on subway passenger flow is also increasing. The passenger flow in the main functional areas of the city is more intensive, which causes the passenger flow congestion in some sections of the line and brings hidden dangers to the driving safety. On the contrary, On the other hand, a low passenger loading rate and a waste of train capacity exist in the sections with low passenger flow, which increases the cost expenditure of subway operators. As we know, a large amount of data will be generated with passenger flow, such as inbound, outbound, card sales, recharge, etc. For the subway operation department, how to use these data to judge passenger flow, summarize the rules, and conduct stations and trains reasonably, is the key to solving the problems such as congestion and insufficient capacity during peak hours, high empty-load rates during trough hours, and long waiting time for passengers.
This article takes the Beijing subway as an example and uses AFC (Auto Fare Collection) data to analyze passenger flow. By analyzing the distribution characteristics of passenger flow in time and space dimensions, it identifies the differences of different passenger flow subjects in travel time and travel routes, and counts the whole day time-sharing passenger flow, the number of passengers getting on and off at each station, and analyzes the distribution characteristics of passenger flow in time, station, direction, and section for a specific line. At last it proposes improvement strategies for subway operation organization management so that the subway operation management department can better manage the traffic and passenger transport organization, solve the problem of passenger flow congestion at each station during the peak period of subway, so as to better satisfy the passenger travel experience, improve the subway operation efficiency, and realize the maximum benefit between the subway operation department and passengers.
Literature review
Subway passenger flow refers to the quantity and direction of passengers on a subway line in a period of time. It shows the displacement and quantity of passengers in space, and the displacement has a starting position and directionality. Keumsook Lee et al. (2008) calculated the distribution of passenger flow at 380 stations in the Seoul subway network and found that the distribution of passenger flow presents power-law distribution [7]. Shen Liping et al. (2007) analyzed the passenger flow forecast data of multiple lines of urban rail transit system in China, explained the growth law of passenger traffic, and established a research method of passenger flow space and passenger traffic time distribution based on stations and sections. and proposed the method of adjusting the passenger flow forecast results with changes of system and environment [9]. Liu Jianfeng et al. (2012) and others analyzed the passenger flow development trend and line passenger flow characteristics of each line of Beijing rail transit, based on the analysis of the spatial and temporal distribution characteristics of alighting volume, passenger travel distance distribution trend, transfer passenger flow space-time distribution rule, passenger flow time imbalance, cross-section flow, etc., to provide reference for operation organization [4]. Yi Qin et al. (2016) et al. used the time series clustering method of passenger flow characteristics to divide nearly 200 subway stations in Beijing into eight categories, so as to study the differences of urban functional areas and their social behavior characteristics [11]. Zhang Wandi (2018) analyzed and studied the overall distribution of subway passenger flow and passenger travel characteristics in Beijing, and clustered the passengers according to different travel modes to study their travel habits and regularity [14]. Zhou Yundi (2018) analyzed and studied the dynamic evolution law of passenger flow of Nanjing Subway Line 3 in time and space, showing the imbalance of passenger flow in the up and down direction, the number of passengers boarding and alighting at each station, and the passenger flow at each section, so as to put forward improvement measures for the operation organization work of the operation Department [16]. Based on cluster analysis method, Chen Jianjun (2019) analyzed the change of passenger flow of Guangzhou Subway on weekends, providing basis for urban subway line planning [5].
Kusakabe and Asakura (2014) use a naive Bayesian probability model to propose a data fusion method for smart card data, which can effectively predict the purpose of passenger travel, with a matching degree of 86.2% [12]. Liu Chaoyu (2016) made a comparative analysis of passenger flow and passenger behavior characteristics before and after the Beijing subway ticket reform based on the AFC system data, and gave a station organization optimization plan from the perspectives of management, personnel, and time [1]. Yue Zhenhong et al. (2017) and others proposed a subway station clustering method based on swiping card data and GMM model [19]. Its research shows that the GMM clustering method has a good effect on the identification of mixed types of stations, and can provide technical support for the identification of urban spatial structure and the development and utilization of land around the stations. Wang Ting et al. (2018) based on the data of the subway AFC system, compared and analyzed the travel rules of Beijing and London subway passengers from multiple granularities, multiple levels, and multiple perspectives, and found that subway passengers travel rules, urban structure planning, and residents’ lives As well as working status, there is a close relationship [13]. Li Wenfeng et al. (2018) and others analyzed the characteristics and laws of bus passenger flow from the aspects of cross-section passenger flow, passenger flow OD, waiting time, etc. based on bus IC card swiping data and GPS data, and built a bus passenger flow based on the data of getting on and off the bus and swiping card for segmented charges Visual model of big data [15].
In terms of research on subway operation management strategies, Vázquez-Abad et al. (2005) built a passenger waiting time optimization model, with the goal of operating and social costs, and finding the optimal service level after simplification of the discrete simulation model [3]. David King et al. (2014) took Toronto subway as the research object, reduced the current situation of passenger flow by improving the scheduling plan, and built an optimization model for simulation analysis, based on this, put forward suggestions for improving the current status of operation [8]. Dupljanin D. et al. (2019) proposed a mode of transport effects on fleet performance to solve urban crowdsourced last mile delivery problem based on simulation modelling [2]. Flores-Herrera L. A. et al. (2017) studied on CFD simulation of obstructed ventilation ports in a subway tunnel section [10]. Zhao Yutang (2015) uses LS-SVR to predict the time-sharing passenger flow of the subway based on the analysis of the distribution characteristics of subway passenger flow [17]. According to the results of passenger flow prediction, an optimization model is built, and a time-sharing dynamic train dispatch optimization strategy is proposed. Zhang Yayun (2016) used wavelet neural network model to make short-term prediction of cross-section passenger flow based on the imbalanced characteristics of urban rail transit passenger flow, so as to formulate a train marshalling plan, and then formulate a transit plan to optimize the operation organization [18]. Liu Zeyuan (2019) established the optimization model of urban rail transit train operation plan based on the form of large and small roads, taking the minimum waiting time of passengers and the minimum number of vehicle kilometers as the objective function, and verified that its model is effective in reducing the overall waiting time of passengers, It is effective and feasible to reduce the mileage of vehicles, and it has reference value for the management strategy of subway operation [20]. Jia Julong (2019) takes urban rail transit passenger transport services as the main research object, and seeks ways to improve subway passenger transport services from the perspective of operation organization optimization [6]. In response to the sudden large passenger flow, recommendations for optimization of operation organization management were put forward.
To summarize, scholars predicted the passenger flow by analyzing card data of public transportation or subway and other rail transit, based on the analysis results to model or simulate the best plan for train scheduling, and optimize the plan for train operation. Research focused on train routing plans, full-day train schedules, etc. The operation organization and management of the subway includes many aspects, and the research results of domestic and foreign scholars provide the theoretical basis and results for reference. However, with the extension of the line and network cable, the complexity of the passenger flow distribution characteristics has intensified. The original theories and schemes cannot meet the management needs of the existing line network, and cannot accurately control the complexity of the existing passenger flow. In addition, mathematical modeling cannot control all variables for practical problems. The calculation premise is relatively simple variables, which cannot fully reflect the actual situation. Therefore, it is necessary to conduct objective analysis and quantitative research on the current status of subway operation and passenger flow data in specific cities, and propose optimized management strategies on this basis.
Methods and analysis
Overview of Beijing subway passenger flow and AFC data
Subway passenger flow refers to the sum of the number and direction of passengers on a subway line within a period of time. It illustrates the displacement and number of passengers in space, and this displacement has a starting position and directionality. Passenger flow can be either predicted passenger flow or actual passenger flow.
The subway passenger flow is the foundation for the subway operation management department to carry out subway train dispatch, station passenger transportation organization and management, and train schedule preparation. Due to different spatial locations, subway passenger flow can be divided into two types: station passenger flow and cross-section passenger flow. The station passenger flow includes inbound passenger flow, outbound passenger flow and transfer passenger flow. Non-transfer stations have only inbound and outbound passenger flows. In addition to these two types of stations, there are also interchange passenger flows. Cross-sectional passenger flow refers to the passenger flow passing between stations of the subway line within a period of time. According to the different train driving directions, it can be divided into upward and downward cross-sectional passenger flows. Because subway passenger flow has great differences in time and space, when describing the size of this difference, the imbalance of passenger flow is generally used to evaluate it. There are mainly two aspects: time imbalance and spatial imbalance of passenger flow.
By the end of Dec. 2019, there are 23 subway operating lines in Beijing with a total mileage of approximately 700 kilometers, of which there are 405 stations on the entire network. According to statistics, the annual passenger flow of the Beijing subway has reached 4.5 billion passengers, and the maximum daily passenger volume is about 13.75 million.
AFC is the abbreviation of Auto Fare Collection, which is the automatic fare collection system. It has gathered a lot of information processing technology and computer technology. Compared with the traditional manual ticket sales and inspection method, it has the advantages of fast speed, fewer financial loopholes, and low error rate. It can effectively prevent the occurrence of fake tickets and favor tickets, which not only improves It improves the management level of the management department and reduces the labor intensity of the staff, which is an important manifestation of urban information construction. Its basic structure consists of five components, namely terminal equipment, station AFC system, line center, rail transit AFC clearing management center, and ticket. The different levels of the system are closely linked, and data exchange is carried out through the transmission system. The subway AFC system data refers to the data generated during the interactive operation of these systems, and specifically refers to the subway ticket card transaction data in this article. AFC is the automatic fare collection system. In this article, it refers specifically to subway ticket card transaction data. It mainly includes field information such as transaction serial number, deduction amount, entry time, wallet balance, ticket type, exit time, starting station number, and arrival station number.
The data in this article is derived from actual ticket and card transaction data generated by the Beijing subway operation, and the time period is from May 8 to May 14, 2019. Subway IC card data contains complete information, mainly including transaction serial number, deduction amount, entry time, settlement date, gate number, wallet balance, ticket type, exit time, starting station number, arrival station number, etc. Under normal circumstances, only the relevant key fields necessary for subway passenger flow analysis are retained and selected in passenger flow statistics, such as departure time, arrival station number, card number, starting station number, arrival time, etc., as shown in Table 1.
AFC data of Beijing Subway
AFC data of Beijing Subway
Passenger flow data of the largest cross-section of line 5 in the morning peak
Each card number represents different passengers, and the names of different stations have corresponding numbers. The numbers of the same station on different lines are different, which can be distinguished when counting the passenger flow of different lines.
Time distribution characteristics of subway passenger flow
(1) Changes within a day
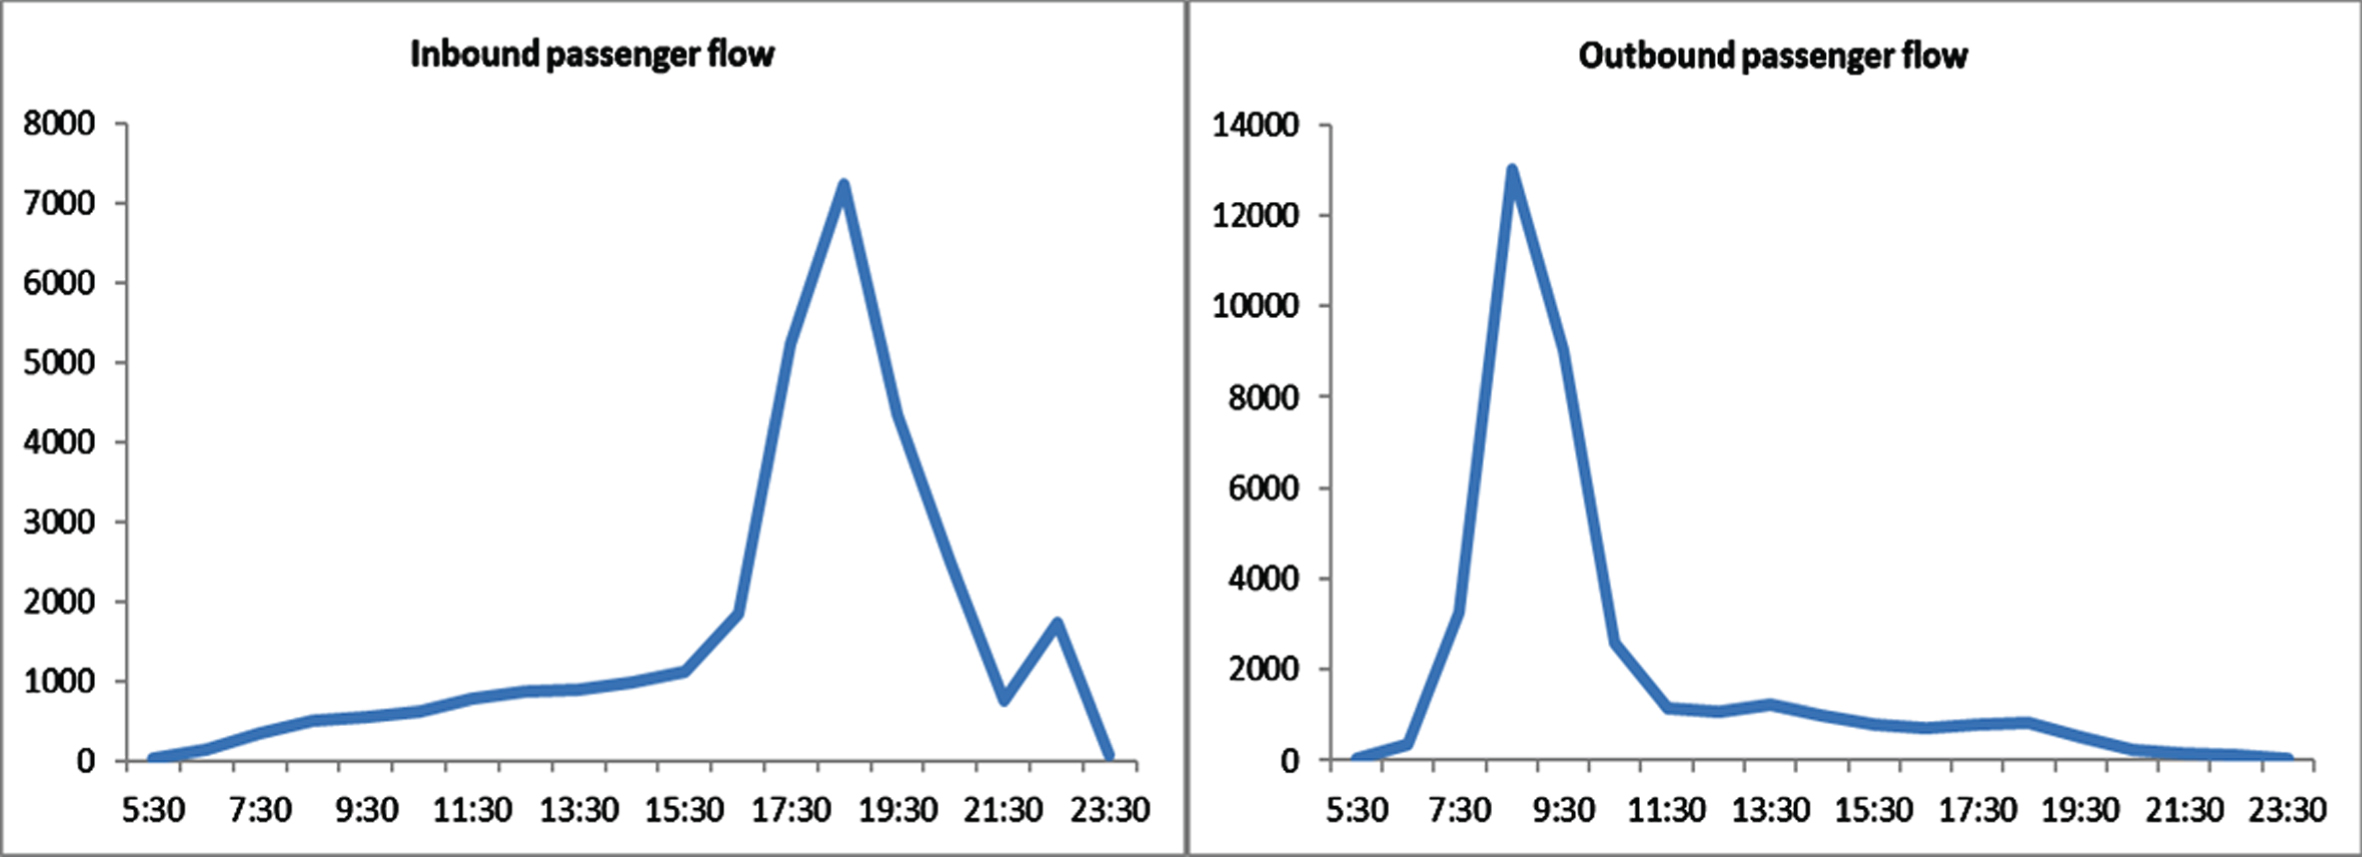
Unimodal station. Passenger flow at such stations has obvious tidal phenomena. The number of passengers leaving the station during the morning peak is far greater than the number of passengers entering the station, and the opposite is true during the evening peak. The Beijing Subway Jintaixizhao Station is distributed in this way.
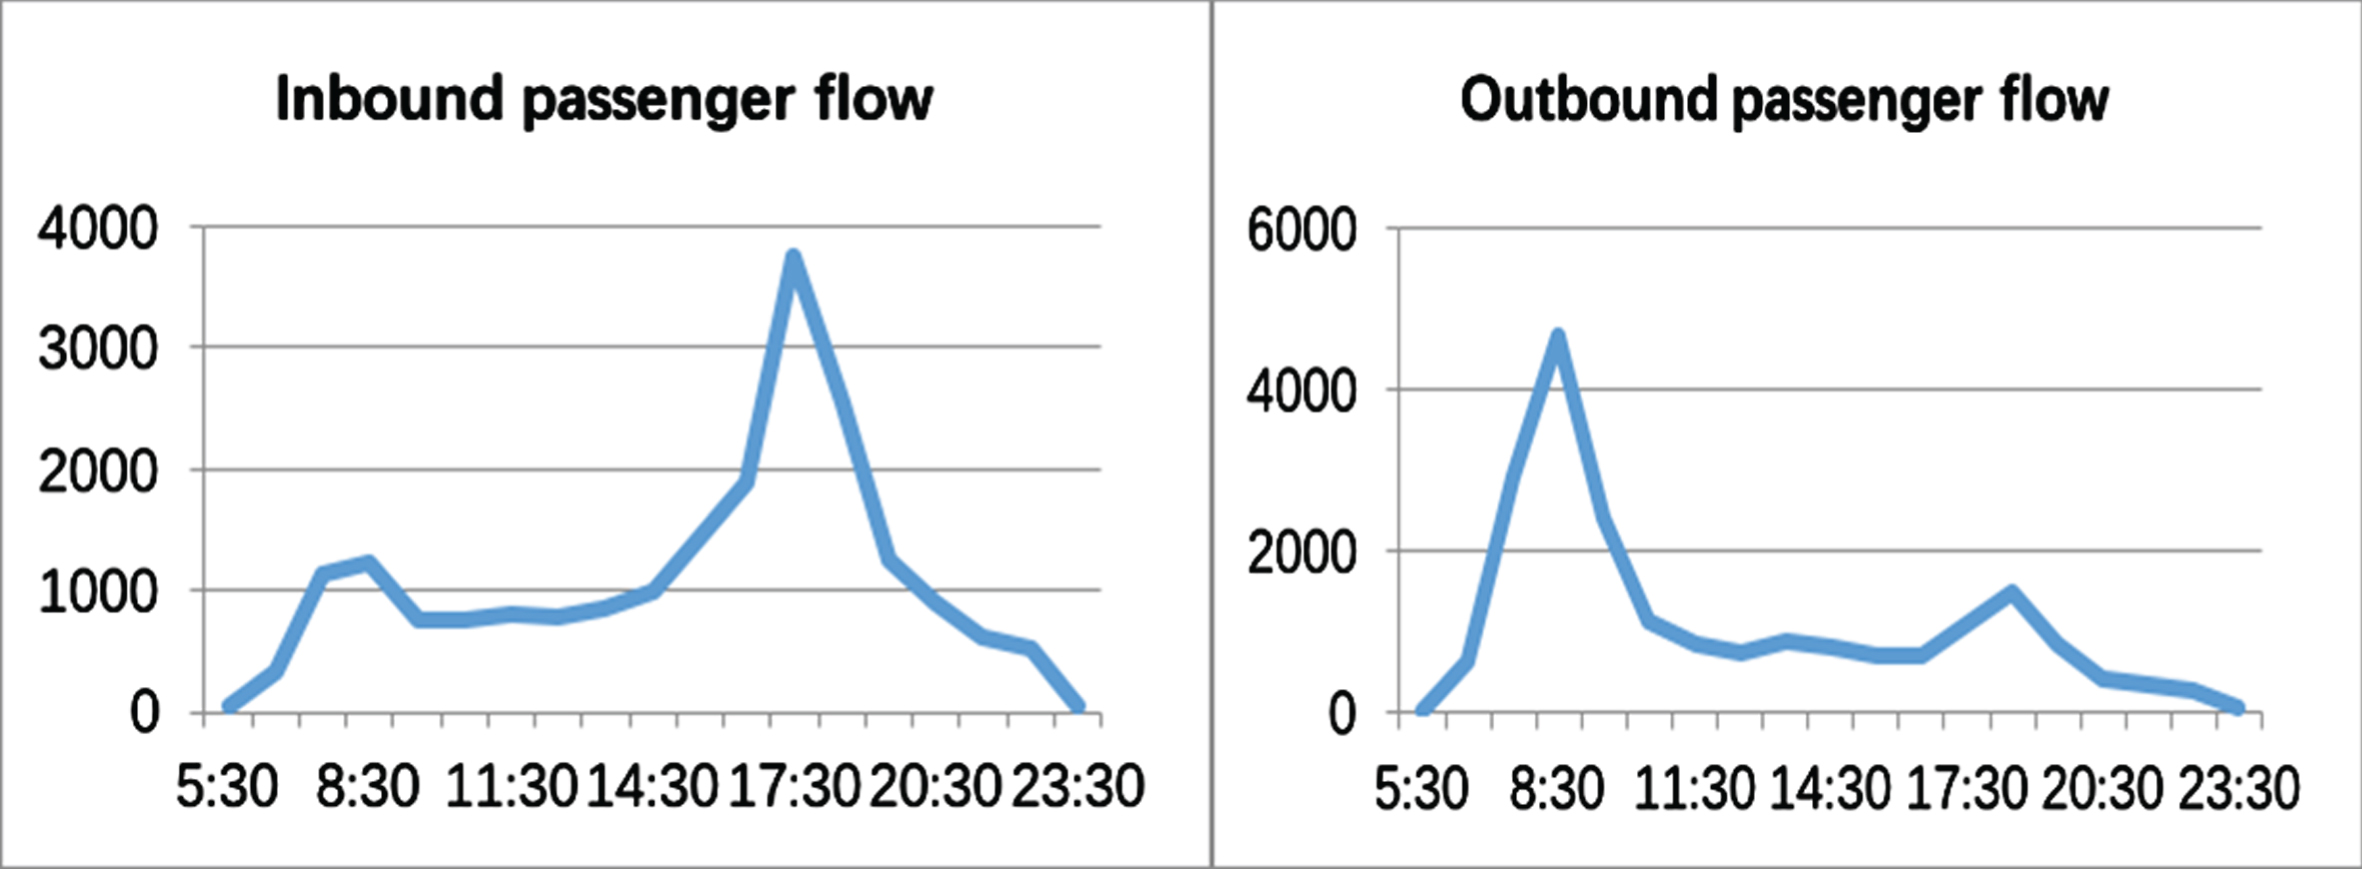
Bimodal station. Such stations are transfer stations in the line, and the utilization rate of land around the stations is relatively high. It is characterized by high inbound and outbound passenger flow during the morning and evening peak periods. Beijing Subway Dongsi Station belongs to this type.
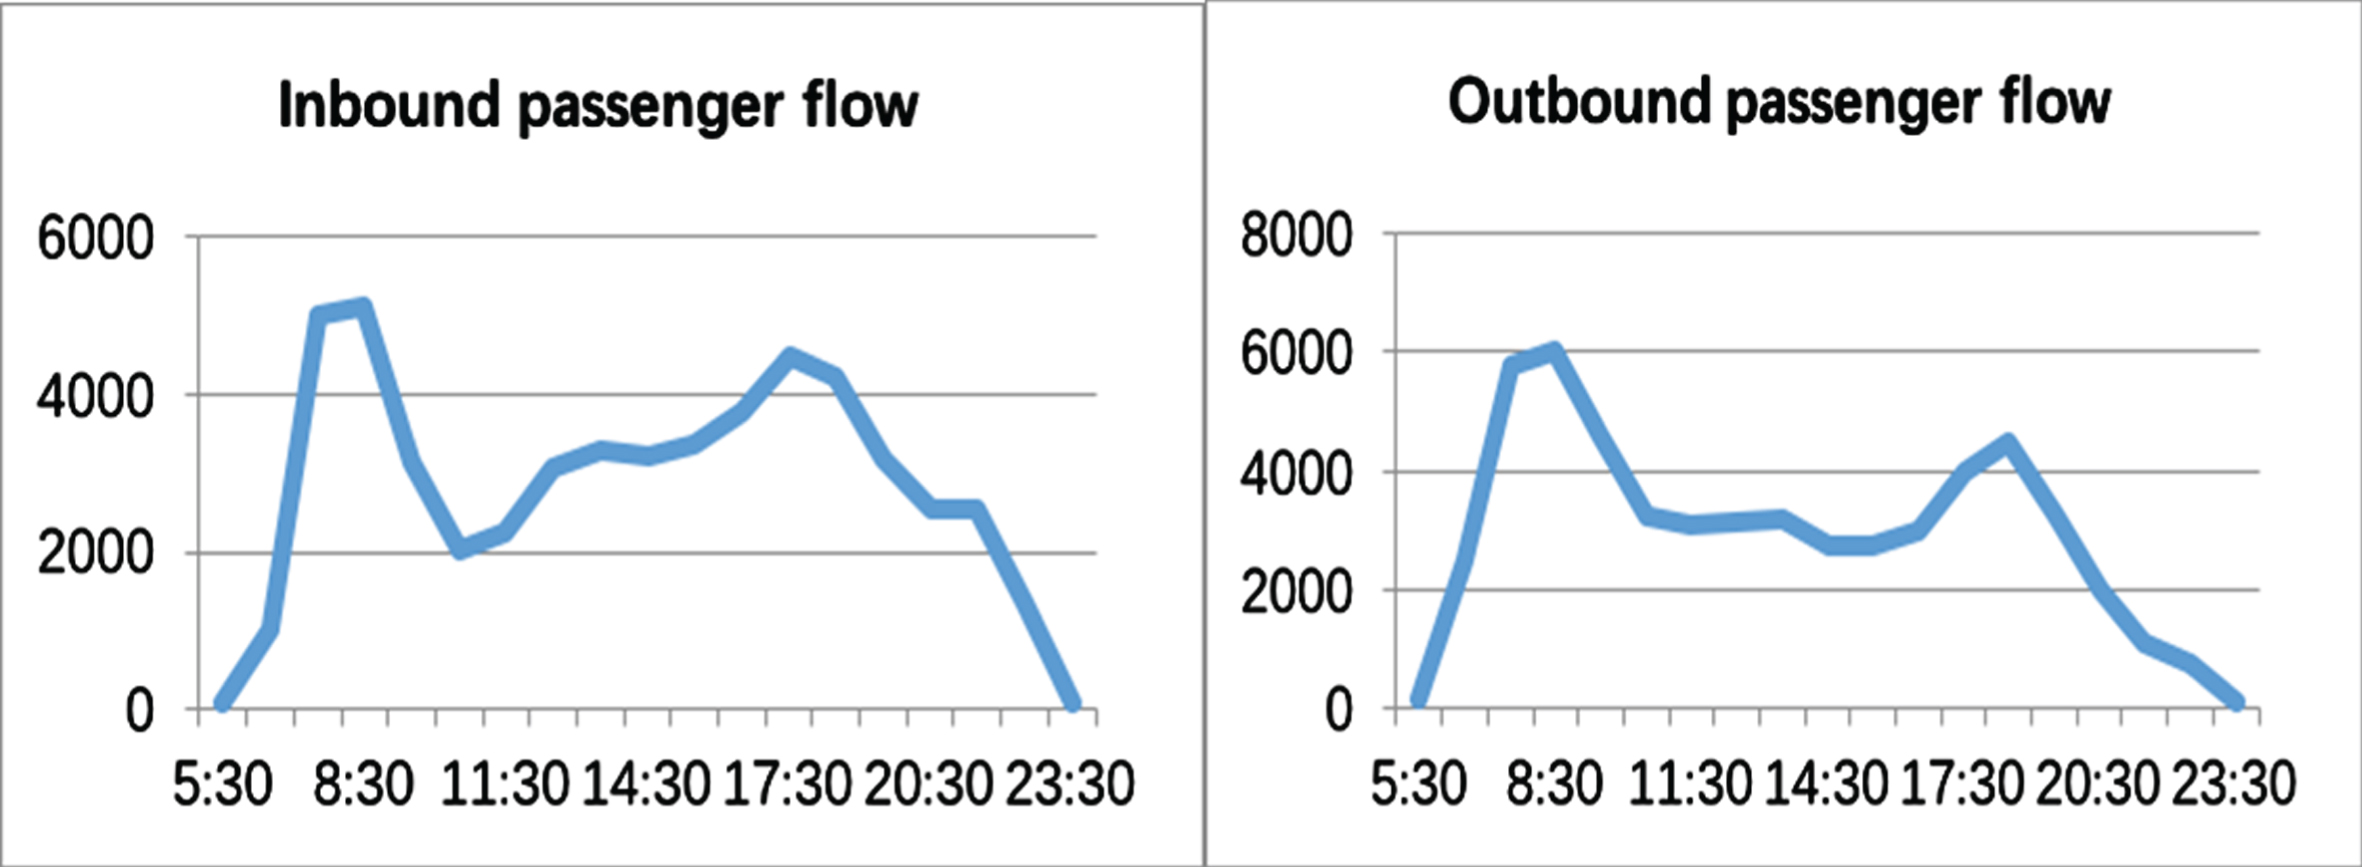
All-peak station. Such stations generally have strong development of surrounding land and are large passenger flow distribution areas. The passenger flow of the station is relatively strong throughout the day, and there is no difference in high and low passenger flow. Beijing South Railway Station belongs to this type.
No-peak site. The utilization rate of land development around such sites is low. During the whole day of operation, the passenger flow in and out of the station is small, and there is no particularly obvious peak. Qiaowan Station is a typical example.
Sudden-peak station. There are usually large stadiums, education centers, or activity centers around such sites. Sudden passenger flow has no fixed time and is affected by the start and end time of the event. Among the stations of Beijing Subway, such as Workers Stadium and the surrounding stations of the Bird’s Nest, are sudden peak type stations.
It can be seen from the above analysis that the passenger flow in and out of Beijing Subway stations varies greatly in unit time. According to different types of stations and their changing trend of passenger flow, subway operation management departments need to make different passenger organization and management strategies.
(2) Changes within a week
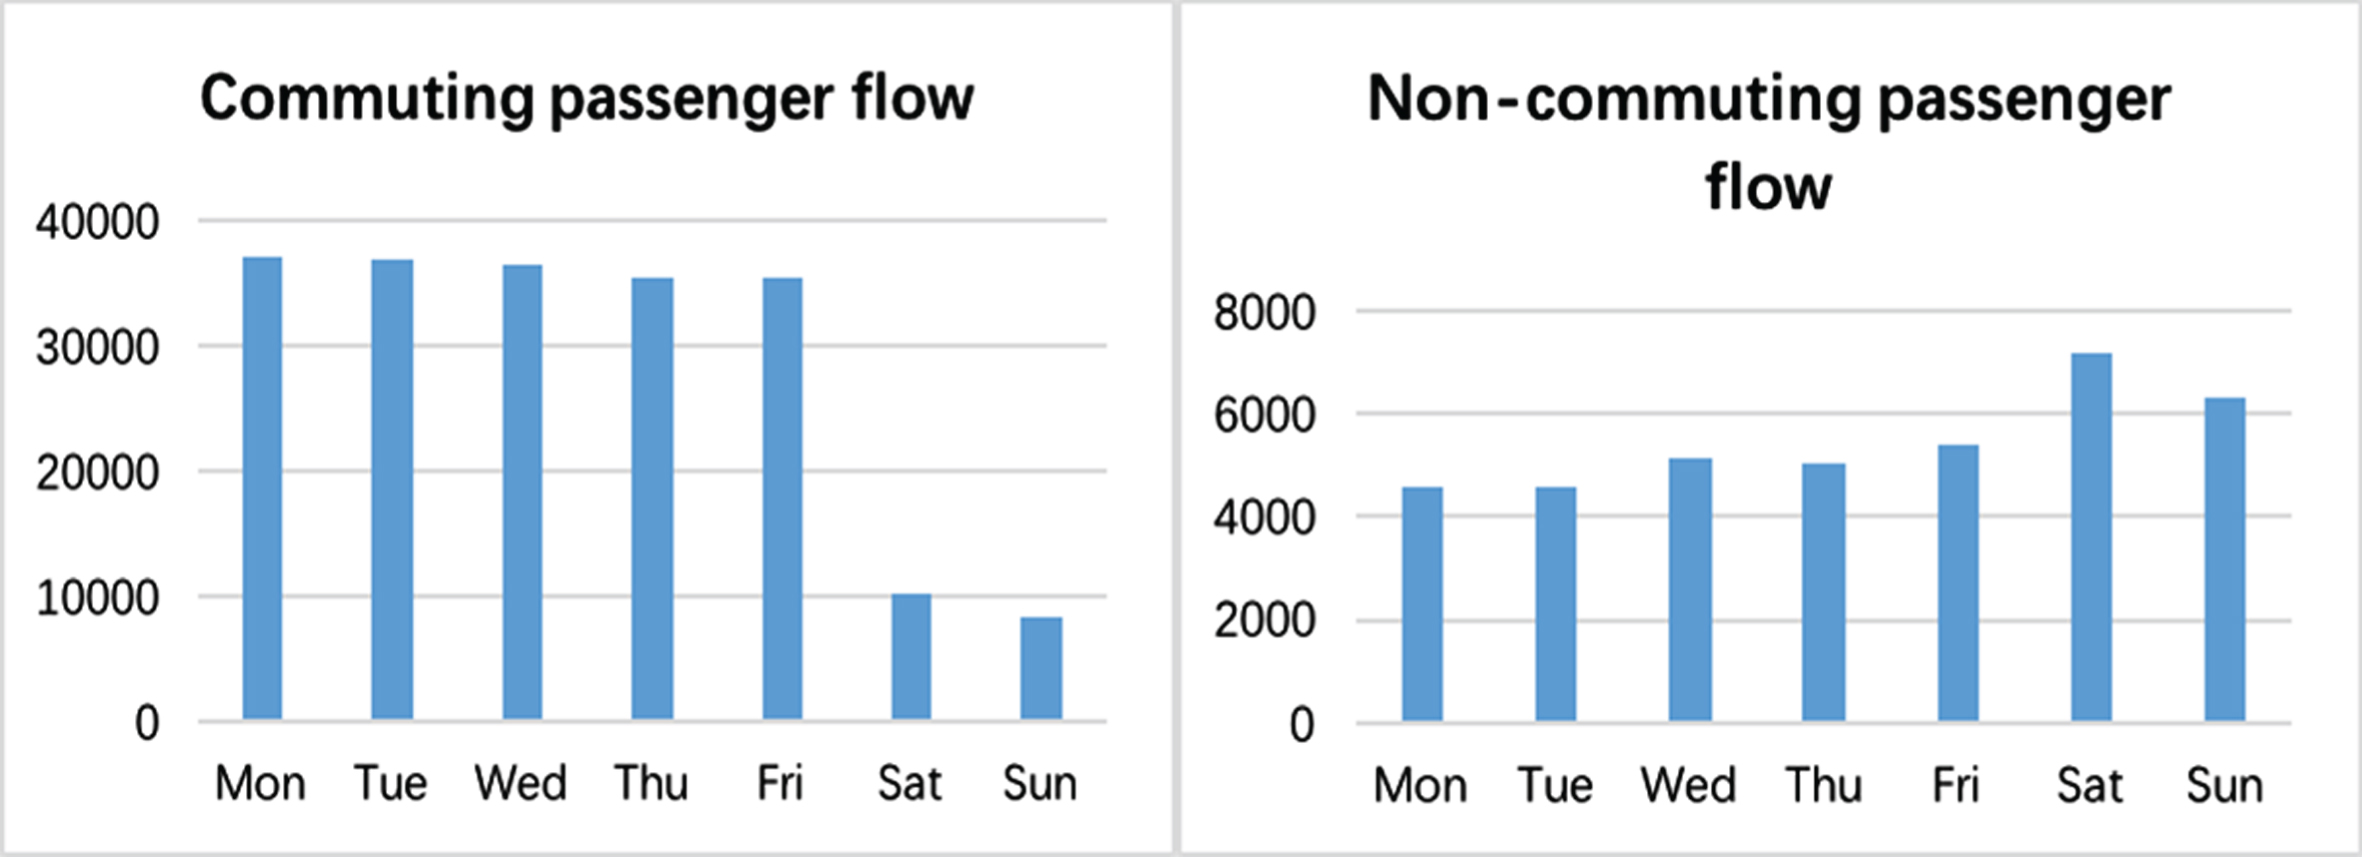
When the time was extended to one week, the characteristics of passenger flow changed into two types. One is the commuting passenger flow which is mainly for the activities of studying and going to work, and the other is the non-commuting passenger flow which is dominated by shopping, tourism and other activities
Commuting passengers requires frequent trips from Monday to Friday, but will be greatly reduced on weekends. The passenger flow of shopping and tourism is just the opposite. The characteristic distribution are as follows.
Due to the different characteristics of passenger flow on weekdays and non-working days, it is necessary for the subway operation Department to adjust the train operation number and routing plan in a week in order to better meet the travel needs of passengers.
Spatial distribution characteristics of subway passenger flow
The spatial distribution characteristics of subway passenger flow mainly include the passenger flow distribution characteristics in the direction of the line and the passenger flow distribution characteristics of the line section. When describing the spatial distribution characteristics of subway passenger flow, subway passenger flow specifically refers to cross-sectional passenger flow. Generally, when calculating the cross-section passenger flow, the time-sharing cross-section passenger flow in each section of the line is first counted. The calculation formula is as follows:
In the formula:
Pi+1—The passenger flow of the i + 1th section
P i —The passenger flow of the i-th section
P down —Number of people getting off the train at the station
P up —Number of people getting on the train at the station
(1) Distribution characteristics in the upstream and downstream directions
Due to the differences in the functional areas around the stations, the traffic of different types of stations in different directions also varies. During the morning peak period, the upward passenger flow to work, school, and other areas will be significantly more than the downward passenger flow. The flow path appears to flow from the periphery of the city to the city center. In the evening peak period, the opposite is true. Passenger flow to the city.
(2) Distribution characteristics of passenger flow on line section
During the planning and construction of subway lines, the links between the main functional areas need to be considered. During the construction of the stations, different stations will have different functions to carry, which will cause different passenger flows of the line sections. The cross-section passenger flow in the same direction in the line can be divided into four types: gradual, uniform, convex, and irregular.
Gradual type, as shown in Fig. 6(a). The gradual passenger flow is specifically manifested as a cross-section passenger flow showing a gradual increase or decrease along a certain direction.
Passenger Flow Distribution of Jintaixizhao Station.
Passenger Flow Distribution of Dongsi Station.
Passenger Flow Distribution of Beijing South Railway Station.

Passenger Flow Distribution of Qiaowan Station.
Different types of Passenger Flow Distribution within a week.

Cross-section passenger flow spatial distribution.
Equal type, as shown in Fig. 6(b). Equal passenger flow is manifested in that the number of people getting on and off at each station is similar, resulting in similar cross-section passenger flow.
Convex type, as shown in Fig. 6(c). Convex passenger flow shows that the passenger flow at both ends of the line is smaller and the middle cross-section is larger.
Irregular type, as shown in Fig. 6(d). Irregular passenger flow has no obvious rules to follow, and its cross-section passenger flow distribution is uneven, and the functional areas along the line are mostly scattered.
Disequilibrium coefficient of passenger flow distribution on subway lines
Taking Beijing Subway Line 5 as an example, it can be seen that the distribution of passenger flow in time and space exhibits imbalance, and it can be divided into the following types.
(1) Time disequilibrium coefficient of passenger flow
It is expressed by the time disequilibrium coefficient α of time-sharing passenger flow, and the calculation formula is as follows.
In the formula:
α—Time-sharing passenger flow timedisequilibrium coefficient
pmax—The largest time-sharing passenger flow throughout the day
p i —The maximum passenger flow in the first hour
n—Number of operating hours of the whole day line
When α tends to 1, it indicates that the time-sharing passenger flow is more balanced, and the larger the coefficient, the more unbalanced the passenger flow.
(2) Cross-sectiondisequilibrium coefficient of passenger flow
It is expressed by the cross-section disequilibrium coefficient α
h
and the formula is as follows.
In the formula:
α h —Unbalanced coefficient of one-way passenger flow
pmax—One-way maximum cross-section passenger flow
p i —The passenger flow of the first section
n—Number of one-way line sections
When α h tends to 1, it means that the passenger flow of each section of the line is relatively balanced. It is generally believed that when it is greater than 1.5, it indicates that the cross-section passenger flow distribution is uneven.
(3) Direction disequilibrium coefficient of passenger flow
It is expressed by the line direction disequilibrium coefficient αd.
In the formula:
αd—Line direction disequilibrium coefficient
When αd tends to 1, it means that there is little difference in passenger flow in the upstream and downstream directions. When the coefficient is greater than 1.5, it means that there is a great imbalance in passenger flow in the upstream and downstream directions.
(1) Analysis of passenger flow in different periods
Taking the passenger flow of Beijing Subway Line 5 on May 10, 2019 as the analysis object, the specific distribution of the full-day time-sharing passenger flow entering the station is shown in Fig. 7.

Passenger flow Distribution of Beijing Subway Line 5 on working days.
According to 18 hours of operation in a day and 93490 people with maximum hourly passenger flow from 8:00 to 9:00, the data is put into formula 2.2, and the time imbalance coefficient α of time-sharing passenger flow on Beijing Subway Line 5 during working days is calculated as 2.9. Under normal circumstances, the time-sharing passenger flow time imbalance coefficient value of urban lines should be about 2, which shows that the hourly distribution of passenger flow on Line 5 is relatively uneven.
(2) Analysis of cross-section passenger flow in different periods
It can be seen from Fig. 8 that the maximum time period for the full-day time-sharing passenger flow of Line 5 is 8:00–9:00, and this time period is selected to study the passenger flow of each section of the line. The 23 stations along the line from Tiantongyuan North to Songjiazhuang are represented by numbers 1 to 23. Get its cross-section passenger flow distribution map.

Passenger flow of each section of Line 5.
It can be seen from the figure that the maximum cross-section passenger flow in the upward direction is 27,383, the average cross-section passenger flow is 14,468, and the number of section intervals is 22. When the value is entered into formula 2.3, the cross-section imbalance coefficient α h in the upward direction is 1.89. Similarly, the downward direction can be obtained. The cross-section imbalance coefficient α h in the direction is 1.86, and both values are greater than 1.5, that is, the passenger flow distribution of Line 5 is relatively uneven.
Taking the maximum cross-sectional passenger flow of 27383 in the upstream direction and the maximum cross-sectional passenger flow of 20687 in the downstream direction into formula 4, the directional imbalance coefficient αd of the line is 1.14, that is, the interval of the maximum cross-sectional passenger flow in the upstream direction and the downstream direction is different, and the number is also different.
Subway operating organization and management optimization
The strategy of subway train organization and management mainly includes train formation scheme, train routing plan, train headway, train stop plan, and all day train operation plan. Since the train formation mode and vehicle selection of Beijing Subway have been fixed, once the train formation plan is determined, it will be rarely adjusted. For the unbalanced distribution of passenger flow in time and space, it is generally solved by the whole day operation plan, train routing plan and stop scheme. Among them, there are mainly two kinds of stop schemes: stop at station and stop at non station. However, in order to meet the travel demand of all passengers and reduce the waiting time of passengers, the subway operation department usually implements the scheme of station stop, which is also the subway parking mode of most cities in China. Therefore, this paper provides the management strategy of train operation organization for subway operation management department mainly from two aspects of train routing plan and train operation plan.
(1) Train routing optimization
Train routing is the line section of urban rail train operation, which consists of turn back station and section passing by the routing. If the section passenger flow of the line is relatively large, the subway operation Department can increase the number of trains and the number of trains to be delivered in large and small traffic areas. Compared with the traditional single route, the number of trains running on the line can be reduced, so the cost of subway operation can be reduced. And the small and small traffic roads are suitable for the case of large cross-section passenger flow in the middle section of the line and the smaller cross section passenger flow in the sections at both ends of the line, so it is suitable for Beijing Subway Line 5.
(2) Train operation optimization
Train operation plan refers to the whole day train operation plan. The preparation steps generally include the following processes, determining the maximum cross-sectional passenger flow in a day-sharing time, calculating the number of trains in each hour, calculating the driving interval, adjusting the driving interval and determining the final full-day driving plan. This section mainly studies the train operation plan during the morning rush hour of Beijing Subway Line 5, and proposes corresponding driving methods for this.
After obtaining the hourly cross-sectional passenger flow data during peak hours, calculate the number of trains operating within an hour. The specific formula is as follows:
In the formula:
N i —the number of trains in the hour (pairs)
pmax—The largest cross-section passenger flow in the first hour (persons)
p col -Train capacity (person)
β—Full load rate of line section
Subway Line 5 runs B-type 6-carriage trains. It is understood that the number of trains is 1,424, and the peak load rate is set to 100%. The data is entered into Formula 5, and the calculation is 19.23 pairs.
Then calculate the driving interval time, the formula is as follows:
In the formula:
T interval -subway train running interval
N i —The number of trains that should run in the first hour (pairs)
Substituting the N i calculated value from Equation 5 into Equation 6, we get T interval 187.2 seconds. Since the number of train running pairs is an integer, the theoretical value is adjusted. The actual number of train running pairs is 20, and the train running interval is 180 seconds. According to the latest official news of the Beijing Subway, the minimum train interval for Line 5 trains during the morning and evening rush hours in 2020 is adjusted to 180 seconds, and the number of trains on the line has increased to 20 pairs, confirming the improvement strategy given in this article.
Adjust the capacity of the equipment in the station. Including the passing capacity of entrances and exits and elevators and other boarding and landing equipment, the passing capacity of security inspection equipment, and the passing capacity of entry and exit ticket gates. Set up diversion fence at each entrance to strengthen the guidance of passenger flow. Secondly, the management of boarding and landing equipment should be strengthened. During the morning and evening rush hours, additional staff can be assigned to guide passengers to walk in and out of the station when escalators are congested. In the peak period of passenger flow, we can increase the channel or simplify the security inspection procedures, add the no package channel, and increase the staff to carry out security inspection with manual equipment. When the passenger flow in and out of the station is congested, the number of gate machines in and out of the station can be adjusted. At present, the “face brush” payment technology has been gradually improved, so the “face brush” payment function at the gate can be improved to reduce the passenger’s passing time. Strengthen guidance and information transmission. To strengthen the guidance of passengers, voice broadcast can be added in the station hall to remind passengers to travel orderly. At the same time, signs such as isolation belt and signboard should be set up in the station to guide passengers to evenly distribute to each waiting area and wait orderly. In addition, guidance screens can be set up at entrances and exits, security checkpoints, waiting platforms, etc., to release the expected security inspection time, the expected waiting time of passenger flow control, the congestion degree of each compartment, and the distribution of station congestion, so that passengers can have expectations of waiting time and car congestion, and facilitate passengers to master the dynamic information of the station. Improve the service level of station staff. Enhance the service level of station staff and conduct unified training, so that the staff can help and solve the related problems of passengers in time; in case of emergency, they can react quickly, make reasonable actions, evacuate the crowd and guide passengers; help solve the passengers who have difficulties or doubts in the process of automatic ticket selling; persuade passengers to behave uncivilized behaviors in the station; and Help passengers with large luggage to ensure smooth passenger flow at the station.
Conclusions
Based on the operation data of Beijing Subway AFC system, this paper analyzes the temporal and spatial distribution characteristics of the overall passenger flow in the subway network; taking line 5 as an example, it calculates the overall cross-section passenger flow of the line during peak hours; and selects Tiantongyuan north station to analyze the passenger flow in and out of the station in the morning peak; finally, combined with the quantitative analysis results of the passenger flow imbalance, the paper analyzes the passenger flow of the subway network The management optimization strategy is proposed for passenger transport organization and train operation organization.
However, there are still many limitations and deficiencies in the existing research. With the continuous development of urban rail transit and the wide application of Internet of things, driverless, 5 g and other technologies, the demand to improve the subway operation efficiency and passenger experience based on real-time data analysis needs to be solved. In the next step, the subway big data will be used to forecast the passenger flow in real time and accurately based on the passenger flow analysis; the unbalanced coefficient of passenger flow will be analyzed; management strategy for different lines and stations need to be targeted.
Footnotes
Acknowledgments
Supported by Social Science Program of Beijing Municipal Education Commission (No.: SM202111417008).