
Abstract
To lower the operating cost of an enterprise, improving the efficiency of logistics, or reducing the cost of circulation is one of the crucial means for the enterprise to cut the costs. In this paper, combined with the rough set fuzzy logic algorithm, in response to the features of the large-scale vehicle scheduling problem, the data collected by monitoring in real time provided by the tracking technology, in conjunction with the data mining technology, are used to support the decision making based on the reverse logistics mode and establish a vehicle scheduling optimization model with the purpose to support the decision making in transportation logistics.
Introduction
In recent years, with the continuous development of the social economy, competition among enterprises has become more and more fierce. Many enterprises have entered the era of meager profit. To lower the operating cost of the enterprise, improving the efficiency of logistics or reducing the cost of circulation has become one of the crucial means for an enterprise to cut the costs. Time and cost have become the key to the success of the regular operation of an enterprise [1, 4]. Hence, how to improve efficiency has become the key to research. The purpose of reverse logistics services is to make use of proper logistics management technologies and methods to achieve the goal of lowering costs and increasing efficiency and obtain profits outside of production management and marketing management. In addition, vehicle scheduling in the process of logistics and distribution issues is a crucial problem as well [2]. However, most of the domestic studies in this field are limited to the theoretical level, while the practical development and application of such systems have only just started [3, 5]. For example, a real-time vehicle dispatch system is put forward when the constant changes in the requirements at various network nodes are taken into consideration [6]. Some scholars introduced the application of the geographic information system (hereinafter referred to as GIS for short) in the optimal scheduling of logistics distribution vehicles, in which the graphics, images, and data processing techniques are used to enhance the visualization of the system [9].
At present, many famous foreign companies apply reverse logistics as a strategy to strengthen their competitive advantages and use it to increase customer value and improve the overall performance of the supply chain [7, 10]. Compared with forward logistics, reverse logistics has a high level of uncertainty in time, quantity, quality, and other aspects. Hence, companies did not introduce product supply chains into reverse logistics in the past [11, 12]. Although reverse logistics plays a vital role in the supply chain system, it is challenging to predict the location, time, and quantity of its occurrence. In addition, the location of reverse logistics is more fragmented than the forward one, and the processing system is more complicated and diverse as well [13, 14]. With the vigorous development and gradual integration of wireless communication, Internet network, RFID technology, and the popularization of mobile phones, smart handheld devices, and so on, mobile commerce combined with radio frequency (RF) technology have been applied successfully.
In this paper, combined with the rough set fuzzy logic algorithm, the data collected by monitoring in real time provided by the tracking technology, in conjunction with the data mining technology, are used to support the decision making based on the reverse logistics mode, with the purpose to optimize the cost of transportation logistics and lower the costs.
Rough set fuzzy logic algorithm
It is assumed that U is a domain, B is a sub-algebra of the Boolean algebra of all subsets of U, and L is a grid, then X = [XL, XU] ∈ B2 is a rough set. In the rough set, XL < XU, and A=(AL, AU) is a fuzzy rough set, in which μAL:XL⟶L, μAU:XU⟶L. In addition, for ∀x ∈ X U , μAL≤μAU (x). In order to facilitate simplicity, let μA (x) be denoted as A (x), the totality of all fuzzy sets on U is denoted as F (U), and the totality of all fuzzy rough sets on U is denoted as FC (U).
For ∀A, B ∈ FC (U), the operations ∩, ∪, c in FC (U) are defined as the following:
(A ∩ B) (x)=A (x) ∩ B (x)=[AL (x)·BL (x), AU (x)∧BU (x)]
(A∪B) (x)=A (x)∪B (x)=[AL (x)∨BL (x), AU (x)∨BU (x)]
AC (x)=(A (x))C=[1-AU (x), 1-AL (x)]
For ∀A, B ∈ FC (U), the partial order ≤, ≺, and ≺ in FU (C) are defined as the following: A≤B if and only if A (x)≤B (x), then AL (x)≤BL (x), AU (x)≤BU (x).
A ≺ B if and only if A (x) B (x), then AL (x)=BL (x), AU (x)≤BU (x).
A ≺ B if and only if A (x) B (x), then AL (x)≤BL (x), AU (x)=BU (x).
Let O ∈ FC (U), O (x)=[0, 0], I ∈ FC (U), I (x)=[1, 1], ∀x ∈ X U .
(Commutative law) A ∩ B = B ∩ A, A∪B=B∪A. (Associative Law) A ∩ (B ∩ C)=(A ∩ B) ∩ C, A∪ (B∪C)=(A∪B)∪C. (Dual law) (A ∩ B)C=AC∪BC, (A∪B)C=AC ∩ BC. (Rank preservation) If A≤B, then A ∩ C≤B ∩ C, A∪C≤B∪C. (Zero-one law) A ∩ O = O, A∪O=A, A ∩ I = A, A∪I=I. (Quasi distributive law)
A ∩ (B∪C) ≺ (A ∩ B)∪ (A ∩ C)
A∪ (B ∩ C) ≺ (A∪B) ∩ (A∪C)
Then h is referred to as the fuzzy rough complement operator on FC (U).
l:FC (U)⟶F (U), let l (A)=AL, ∀ A ∈ FC (U).
r:FC (U)⟶F (U), let r (A)=AU, ∀ A ∈ FC (U).
It is obvious that A = [l (A), r (A)] is established. If h is the fuzzy rough complement on FC (U), h1: F (U)⟶F (U), h2:F (U)⟶F (U) is defined as the following: h1 (AF)=l (h ([AF, AF])), h2 (AF)=r (h ([AF, AF])), ∀ AF ∈ F (U). Then the following can be obtained h1h2 is well-posed, that is, if AF = BF, then h1 (AF)=h1 (BF), h2 (AF)=h2 (BF). In fact, if AF = BF, then [AF, AF] = [BF, BF], so l (h[AF, AF])=l (h[BF, BF]. Hence, h1 (AF)=h1 (BF) can be obtained. Similarly, h2 (AF)=h2 (BF) can be obtained. If AF ⊆ BF, then h1 (BF) ⊆ h1 (AF), h2 (BF) ⊆ h2 (AF). In fact, since [AF, AF] ≺ [AF, BF] ≺ [BF, BF], h[BF, BF] ≺ h[AF, BF] ≺ h[AF, AF]. Hence, h1 (BF)=l (h[BF, BF]) ⊆ l (h[AF, AF])=h1 (AF). Similarly, h2 (BF) ⊆ h2 (AF) can be obtained. For ∀ A=[AL, AU], h (A)=[h1 (AU), h2 (AL)] is established. In fact, since [AL, AL] ≺ [AL, AU] ≺ [AU, AU], h[AU, AU] ≺ h[AL, AU] ≺ h[AL, AL]. Thus h1 (AU)=l (h[AU, AU])=l (h[AL, AU]), r (h[AL, AU])=r (h[AL, AL])=h2 (AL). Hence, h[AL, AU] = [h1 (AU), h2 (AL)]. For ∀ AF ∈ F (U), h2 (h1 (AF))=AF, h1 (h2 (AF))=AF is established. In fact, since h[AL, AU] = [h1 (AU), h2 (AL)], h (h[AL, AU])=h ([h1 (AU), h2 (AL)])=[h1h2 (AL), h2h1 (AU)] = A Hence, AL = h1h2 (AL), AU = h2h1 (AU). If AF ⊂ BF, then h1 (BF) ⊂ h1 (AF), h2 (BF) ⊂ h2 (AF). In fact, if h1 (BF)=h1 (AF), then BF = h2h1 (BF)=h2h1 (AF)=AF. h1 = h2, in fact, it can be known that h1 ⊆ h2 based on the definition. If ∃ AF, let h1 (AF) ⊂ h2 (AF), then h2h1 (AF)=AF=h1h2 (AF) ⊂ h1h1 (AF). Let BF = h1 (AF), then h2 (BF) ⊂ h1 (BF) can be obtained, which contradicts h1 ⊆ h2. It is denoted that h = h1 = h2, then h is complement. Moreover, h ([AL, AU])=[h (AU), h (AL)].
Conversely, if h (A)=[h (AU), h (AL)], then it can be directly verified that h meets the definition of the fuzzy rough complement.
Then * is referred to as the fuzzy rough “AND” operator. If * meets (1) ~ (3) and (4’) A*O=A, then * is referred to as the fuzzy rough “OR” operator.
AΠB=[ALT1BL, AUT2BU], ∀ A, B ∈ FC (U)
AFT1BF=l ([AF, AF]Π[BF, BF])
AFT2BF=r ([AF, AF]Π[BF, BF])
It can be easily observed that T1 and T2 are t-norms on F (U) and T1≤T2. Thus, ∀ A, B ∈ FC (U), A = [AL, AU], B = [BL, BU], and l (AΠB)=l ([AL, AU]Π[BL, BU])=l ([AL, AU]Π[BL, BL])=l ([AL, AL]Π[BL, BL=∪{XL|ALT1XL r (AΠB)=r ([AL, AU]Π[BL, BU])=r ([AL, AU]Π[BU, BU])=r ([AU, AU]Π[BU, BU])=AUT2BU
Hence, AΠB=[ALT1BL, AUT2BU].
Conversely, if T1 and T2 are the t-norms on F (U) and T1≤T2. The Π determined by AΠB=[ALT1BL, AUT2BU] meets (1)∼(4) in Definition 2, so it is a fuzzy rough AND operator on FC (U).
The proof is similar to that of Theorem 3. For the sake of simplicity, it is denoted as Π=[T1, T2], ц=[⊥1, ⊥2].
(1) A, B ∈ FC (U) is established so that AθB=I.
(2) C, D ∈ FC (U) is established so that CθD=O.
Framework of the system solution
As the distribution of commercial groups is carried out in the condition of a large number of users and distribution with high density, the scale of the vehicle scheduling issue is huge. In addition, it is difficult to resolve the large-scale vehicle scheduling issue satisfactorily with the theoretical algorithms mentioned in the literature above. Based on the features of this type of issues, the author proposes a three-stage solution framework: 1) Conduct regional integration of large-scale customer groups; 2) Establish a vehicle scheduling optimization model, and use the heuristic algorithm to complete the allocation of vehicles to the customer area; 3) With the support of the cargo franchise model, optimize the vehicle path between the areas based on the exchange insertion algorithm.
Regional Integration of Customers
As far as the distribution service objects of the commercial group are concerned, it mainly involves distribution for individual consumers and retail stores to retail stores. Since they are relatively scattered, the scope of distribution is large, and their locations are relatively fixed, these customers can be taken as nodes for network distribution directly, which will not be further studied herein. In this paper, mainly the individual consumers in the delivery object are studied. As they have the features of high distribution density, wide distribution scope, large distribution quantity, and very low demand of each customer. If we take these customers as nodes for network distribution directly, the research scale of the problem will be very large.
In order to reduce the scale of the problem, the author proposes that regional integration should be conducted based on administrative divisions. In this way, the customer group in the same administrative area can be regarded as a whole, that is, as a large node in the distribution (inside the large node, as the distance is very short, the specific delivery path can be determined and completed by drivers themselves). At the same time, when the administrative division is used as the standard integration, it has also taken the road and transportation issues that may exist in some administrative areas into consideration. As a result, it is likely that not all customers in the area can be accessed. If there are such problems, the area can be re-divided rationally to ensure the accessibility of all customers in the region. For example, when there are barriers such as rivers and railways in a certain area, it is possible that customers in the area cannot be accessed directly. In this case, the area can be subdivided into sub-regions based on the barriers such as rivers and railways to ensure the continuity of delivery to these customers.
The man-machine dialogue interface is an interface provided by the system to the user. On the one hand, the user can ask the system questions. The decision-makers can use it to call the model management component, select different models, extract the required data, and try to put forward different solutions. On the other hand, the results are presented to the user by the system. The work completed by the man-machine dialogue interface mainly includes the following: ➀ Offer control of the decision support system, which allows the users to control the operation of the system; ➁ Provide a variety of interactive forms for the convenience of the users; ➂ Generate input/output, understand the requirements of users within a certain range, prompt the input from the users and output the operating result of the system correctly, with a useful error correction and prompt function; ➃ It has excellent adaptability, and the interface is easy to expand with the change of the environment and requirements; ➄ It has good confidentiality, and only authorized users are allowed to access the system.
Vehicle scheduling
After regional integration, the vast customer base has become one of the few customer areas. The allocation of vehicles in the customer area is still a vehicle scheduling issue. Based on the vehicle scheduling model at present, the following vehicle scheduling optimization model is put forward. Subsequently, the heuristic algorithm is used to complete the allocation of vehicles to the customer area.
Vehicle scheduling optimization model
It is assumed that there are m vehicles in the distribution center that are involved in the dispatch, the volume of the k-th vehicle is Vk (k = 1, 2,..., m), and the travel cost per unit distance is ck (k = 1, 2,..., m), and the set of all customers is 0, 1,..., n, in which 0 stands for the distribution center, the total volume of demand in each customer area is vi (i = 1, 2,..., n), and the shortest haul distance from customer area i to j is dij (i, j = 0, 1, ... , N), and the following is established:
Hence, the mathematical model can be established as the following: Objective function:
Objective function
End condition
The constraint condition (1) indicates that the total volume of the goods demanded by the customer for each vehicle should not exceed the maximum volume of the vehicle. The constraint conditions (2) and (3) indicate that each customer can only be delivered by one vehicle, and for customer point j (except for the distribution center), it is required that there is another (and only one) customer point (including the distribution center) i, from customer point i to customer point j. On the other hand, for customer point i (except for the distribution center), there is also another customer point. The vehicle arrives at the customer point i from the customer point, and each vehicle departs from the distribution center and returns to the distribution center. The constraint condition (4) indicates that the number of customers delivered by each vehicle should not exceed the total number of customers;
The rough set fuzzy logic algorithm is adopted to calculate the short drum distance dij of any two customer areas. Subsequently, the kj travel cost Ckj per unit distance of the vehicle is calculated accordingly. In addition, the remaining capacity of all vehicles is initialized to the vehicle capacity Vk, and all the tasks of vehicle distribution are initialized to only one task of the distribution center; The distribution center is taken as the starting point, and the customer area i with the highest transportation cost in all the tasks delivered by the vehicle kj is selected from the customer area to be delivered; whether the task tik in this area is less than the remaining capacity of the vehicle kj is determined. If it is, the task of area i is added to the task group Tj, and the remaining capacity of the vehicle kj minus the freight volume of the task tik is taken as the new remaining capacity of the vehicle kj. The area i is deleted from the customer area to be delivered, and go to the next step; if not, go to step 4); Whether the remaining capacity of the vehicle kj is less than a given smaller value is determined. If it is (the task group has been assigned, and it is no longer necessary to arrange for more tasks), the vehicle is deleted from the vehicles to be dispatched. Subsequently, whether the tasks in all customer areas have been delivered is determined. If they have, the algorithm ends; if not, go to step 2); Otherwise, go to step 5) directly; The customer area with the lowest transportation cost in all the tasks for the vehicle delivery is selected from the customer area to be delivered, and whether the task tik in this area is less than the remaining capacity of the vehicle kj is determined. If it is, the task of the area is added to the task group Tj, and the remaining capacity of the vehicle kj minus the freight volume of the task tik is taken as the new remaining capacity of the vehicle kj. In addition, the area is deleted from the customer area to be delivered, and go to step 3); if not, go to step 4); Determine whether the tasks in all customer areas have been delivered. If so, the algorithm ends; if not, go to the next step; The customer area j with the least transportation cost for all tasks in the task group Tj is selected from the customer area to be delivered, and whether the task tik in this area is less than the remaining capacity of the vehicle kj is determined. If it is, the task of area i is added to the task group Tj, and the remaining capacity of the vehicle kj minus the freight volume of the task tik is taken as the new remaining capacity of the vehicle kj. In addition, the area i is deleted from the customer area to be delivered, and go to step 2); if not, go to step 4).
Vehicle path optimization
After the regional integration of customers and vehicle allocation, the customer area to be delivered by each vehicle is fixed. The issue of the path between the vehicles in the fixed area is converted into a pure cargo franchise issue.
Decision support based on the reverse logistics model
The mode of reverse logistics can mainly be divided into return reverse logistics and recovery reverse logistics. Return reverse logistics is formed mainly due to the fact that the final product cannot be used effectively or the customer is not satisfied or unwilling to use the product. The recovery reverse logistics is carried out mainly based on the requirements of environmental protection, regaining the value, and other reasons for the recovery or other processing of the logistics in the whole supply chain. Each reverse logistics system includes four main behaviors in the process: Gate keeping, Collection, Sortation, and Disposition. Gate keeping is mainly to determine whether the product is involved in the reverse logistics system. The first key to determining the management of reverse logistics is whether it has a suitable monitoring mechanism. Collection is to accumulate the commodities in the reverse logistics system. Sortation is to determine how to deal with the commodities in the reverse logistics system. Disposition is to handle the classified commodities properly. Figure 1 shows the basic reverse logistics process from the beginning of the collection. In many studies, the reverse logistics network is often accompanied by the existing logistics architecture. Through reverse logistics, the traditional linear supply chain is extended into a closed-loop. In this loop, various materials can be fully utilized and regenerated to form a re-circulation system network so that the whole logistics system can be managed effectively.
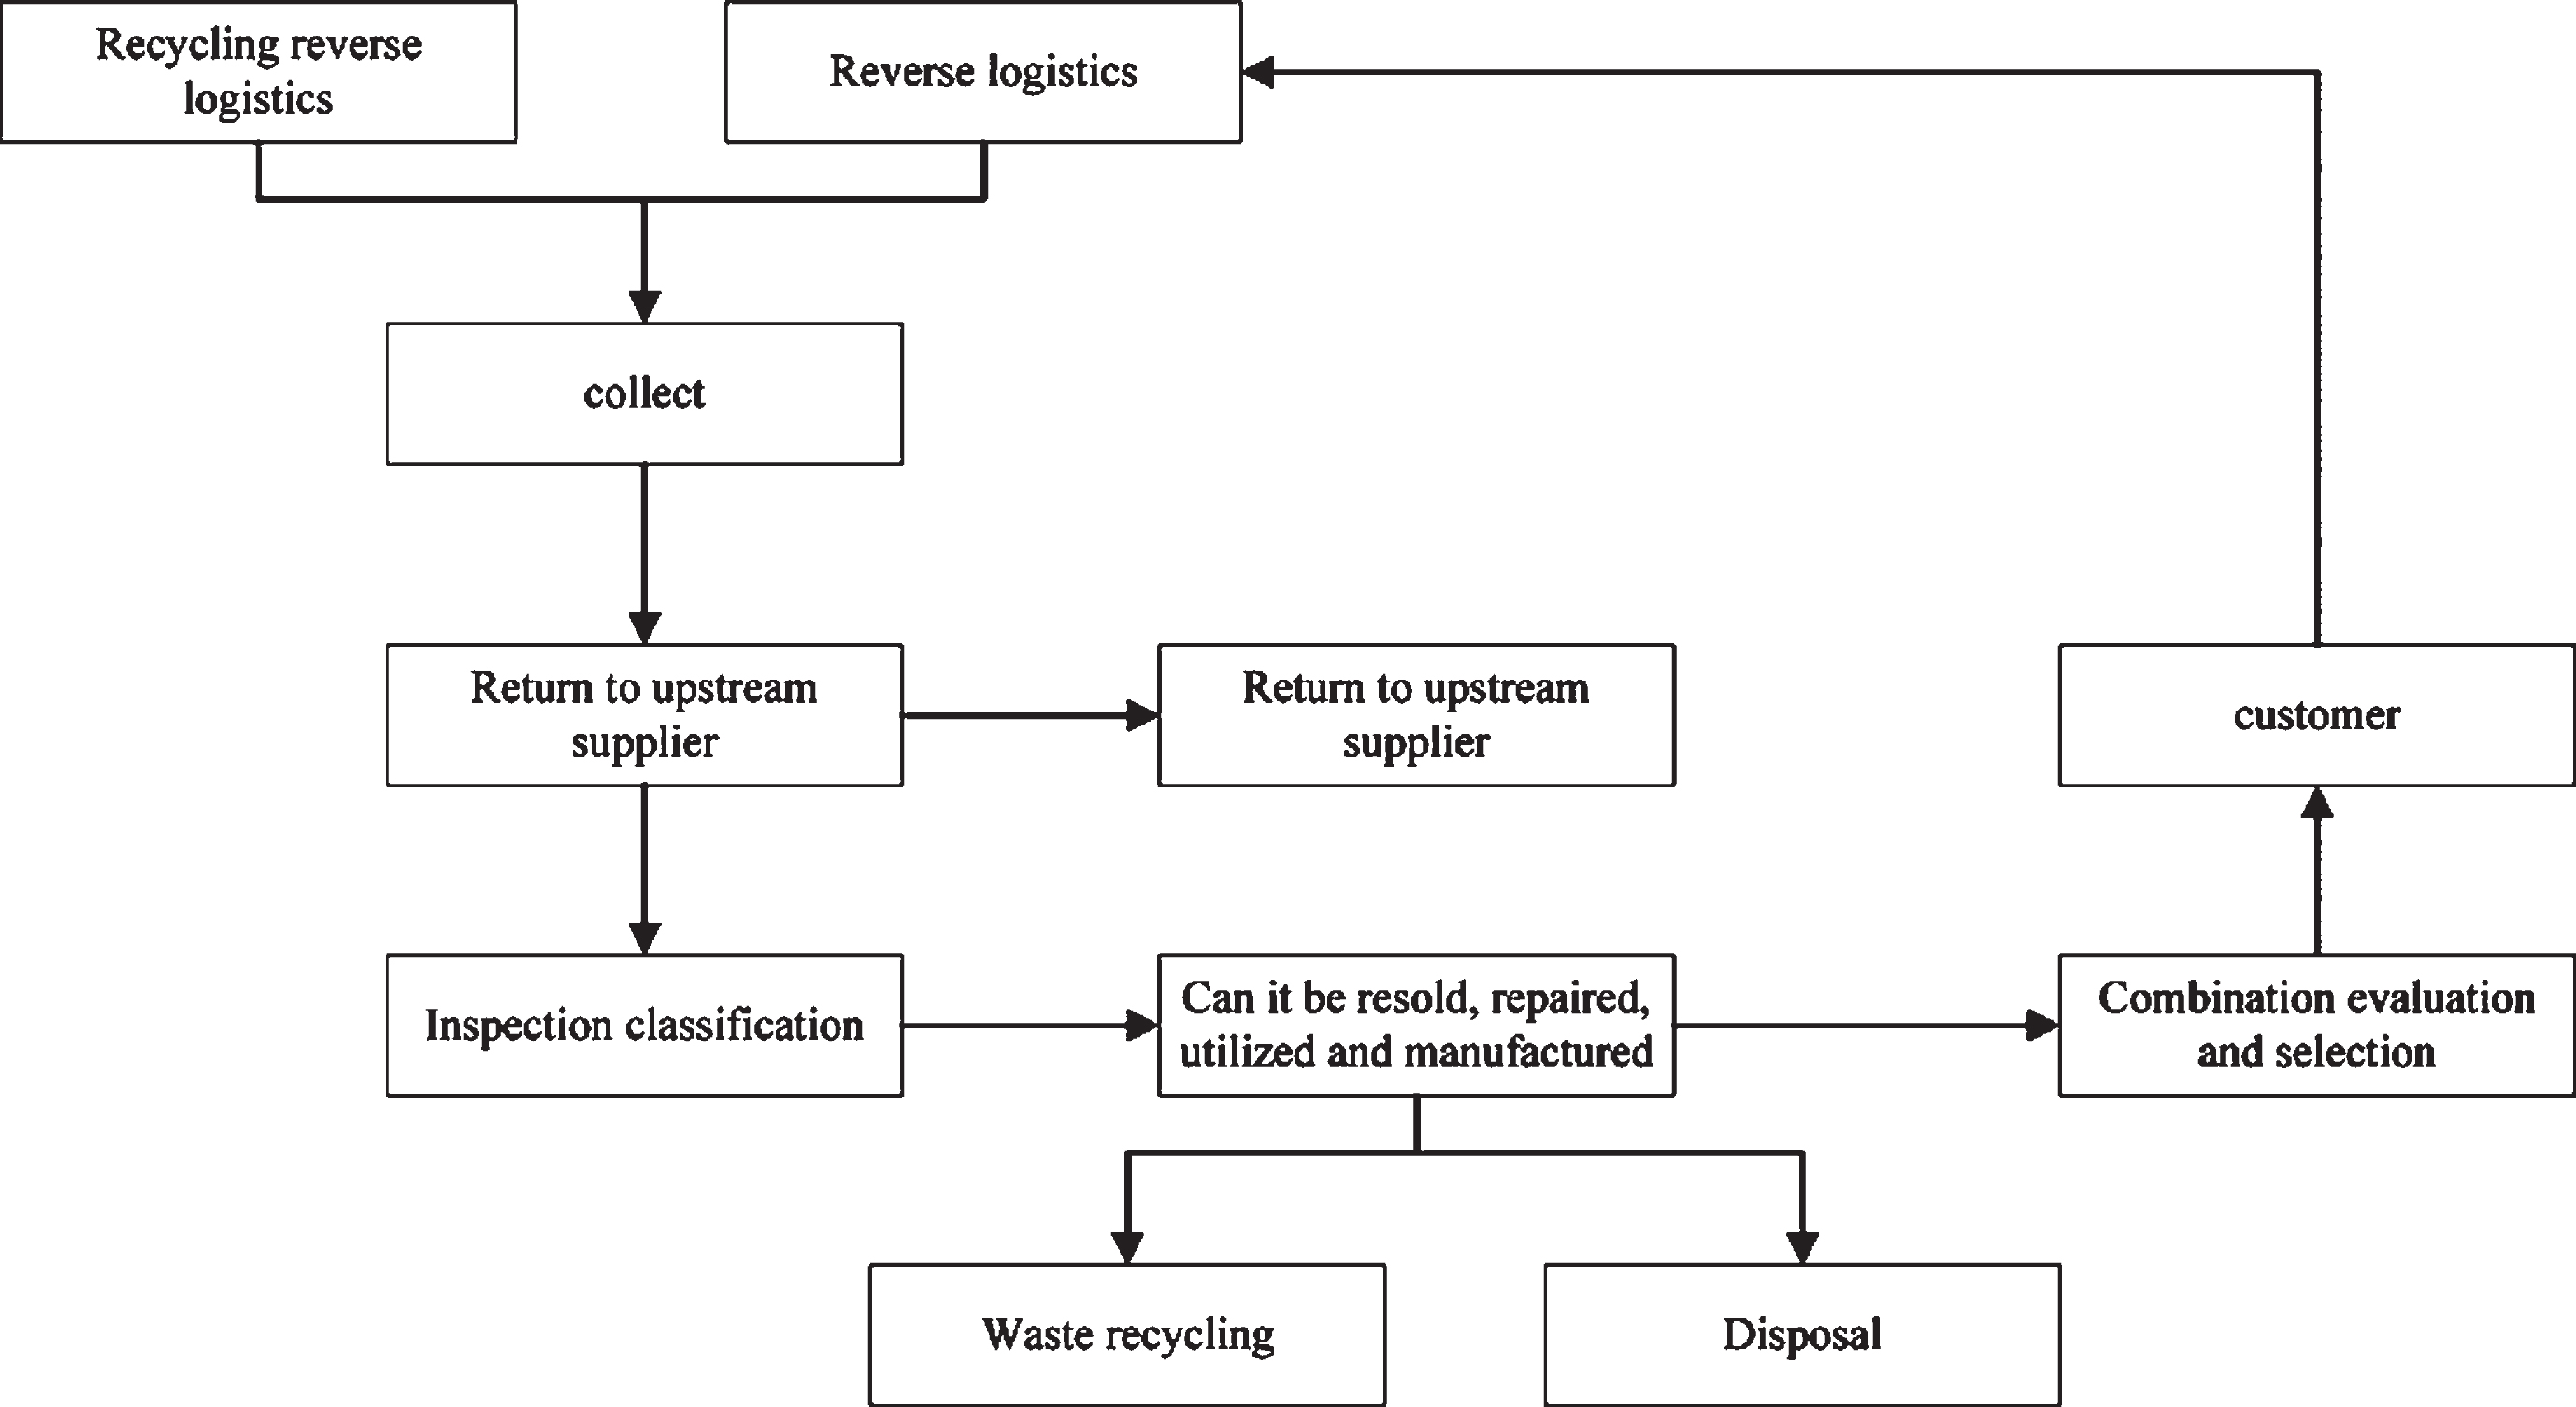
Basic process of reverse logistics in the reverse logistics system
Radio Frequency Identification (hereinafter referred to as RFID for short) is an information technology that has developed and been applied rapidly after the Internet network. RFID technology can be divided into wireless automatic identification and automatic data capture (hereinafter referred to as ADC for short) technology. ADC mainly includes barcoding, optical recognition, biometrics, card technology, touch or contact memory technology. With the high development of automatic identification functions and information vehicles, RFID technology and equipment have been extensively applied in various industrial sectors. After the RFID and EPC specifications of the label-related specifications were formulated by the international organization EPCglobal, they were quickly introduced by various countries to establish the applications. RFID is a radio frequency identification system. Based on the interpretation of RFID in the EAN.UCC RFID white paper, RFID is a set of automatic data extraction (ADC) technologies. The system is composed of a reader, electronic tags, middleware, and the application system.
The tracking technology based on RFID has been extensively used in various sectors at present. Partners in the supply chain acquire the relevant product delivery information through the optimal channels, which makes the information monitoring of products in real time possible. In addition, combined with the huge amounts of internal data for decision-making inferences, it can support the operation analysis and application effectively and further enhance the competitive advantage of an enterprise.
A commercial group is a time-honored, large-scale chain retail group. Its original distribution center is only responsible for the distribution to retail stores, while the distribution to customers is completed by various retail stores themselves. Although this practice can reduce the burden of the distribution center, and the distribution process can be accomplished based on manual experience, as the secondary distribution centers of each retail store distribute the products by themselves, the distribution work can be conducted in a repeated and overlapped manner, which has increased the operating cost. Last year, the commercial group planned to abolish the secondary distribution centers and adopt a model in which the distribution center distributes goods to customers directly. The workload of the distribution center has increased accordingly, and it is quite challenging to carry out distribution based on manual experience alone. It has not only resulted in low distribution efficiency and a poor level of distribution services, but the distribution cost can also be very high.
In order to improve the distribution efficiency and reduce the distribution cost, the solution framework described above is used to design a distribution decision support system for the commercial group to assist the group in distribution.
Design of the decision support system
The most important and basic function of the system is to complete the primary function of vehicle allocation for the customer and select the vehicle travel path based on the information of customer demand, vehicle information, and actual road condition information between the customer and the distribution centers. Some auxiliary functions support its implementation, including the entry and maintenance of necessary information such as personnel and vehicles, distribution query, document loading, the setting of the geographic area, and the backup of the system parameter setting data. All the functions form a decision support system that is perfectly functional.
System management: Manual entry is mainly to record the basic data that are required to generate the distribution plan, such as the personnel, vehicles, commodities, and vehicle types, to edit, delete, modify, and implement other maintenance functions for these data, and to perform maintenance of the system. For example, parameter setting (setting the basic parameters, such as the database name, the login name, and the password that is required to access the system), data backup (backing up the database of the system to a disk or floppy disk), data uploading (recovering data from the disk to the database).
Information on road conditions: In the geographical area setting, the distribution network of the distribution center is mainly divided into various regions according to the information of customer demand, the condition information of all roads between the customer and the distribution center. In addition, the relevant regions are added, deleted, and modified based on the development of the road network in the future. In the setting of the travel path, the path distance between any two areas is calculated based on the actual condition information of the roads between the customer and the distribution center, including the shortest path between any two areas. In addition, operations such as adding, deleting, and modifying the path can be carried out according to the road condition information in real time.
Document management: Document uploading is mainly to import the basic data of the documents to be dispatched from the original system database of the group into the SQL database of the proposed system. In the document query, the dispatch order can be queried according to the delivery area, shipping store, computer order number, user name, and other conditions of the dispatch order.
Delivery schedule: Vehicle management is mainly to determine whether a vehicle is available for the dispatch in vehicle delivery and to carry out regional integration of customers based on the information of the delivery orders. Subsequently, the customers served by each vehicle is determined based on the road condition information and the information of the vehicles that are available for the dispatch, develop the vehicle travel path, and present the vehicle travel path in diagrams. In the delivery query, the delivery result can be queried according to the dialed number, word dialing time, or the reserved vehicle.
Implementation of the decision support system
Entry of raw data
Before the solution framework described above is used for vehicle optimization scheduling, it is necessary to record the raw data, load the dispatching document, as well as enter the raw management data of the available vehicles based on the road condition information, the information of the products and vehicles. The entry of the road condition information includes the entry of the regional conditions and that of the regional access distances. Product information includes product barcode, name, model, specification, and whether the product can be stacked. Vehicle information includes the license plate number, vehicle type, driver, fuel consumption, vehicle license, and so on.
In the uploading of the dispatching document, mainly the basic data of the delivery document is imported, such as the computer number of the delivery document, the delivery destination, the contact person, the contact number, the delivery address, and the time limit, from the original system database of the group to the SQL database of the proposed system.
The management of available vehicles is carried out based on the information of the goods delivered, the information of the customer, and the road condition information between the customer and the distribution center so that the vehicles that are available for dispatch can be selected.
Allocation of vehicles
After the above operations are completed, the customers to be delivered are first regionalized and integrated according to the delivery address of the document uploaded, and the heuristic algorithm is used to generate a temporary delivery scheme. Subsequently, the goods allocated by each vehicle can be adjusted according to the previous delivery experience, the time limit requirements of the customer, and the features of the goods. Finally, an ideal distribution scheme can be obtained.
In this paper, the RFID technology is used to encode the information transmission method in the reverse logistics system through the specifications of the EPC global network, that is, the EPC code is used for the encoding of the RFID label, and the encoding level is mainly divided into five layers as the following: Container Level, Pallet Level, Case Level, Inner Pack Level, and Item Level. The operating mode of the EPC global Network is as the following: Based on the system architecture developed by EPC global, EPCIS plays an intermediary data processing role in the network architecture of EPC global. From event reading and registration to data exchange, information is transferred and converted through the EPCIS system, and the corresponding event management interface and network service are established based on its role in the supply chain. In the framework, the design of the interface between the EPCIS information system and the other information systems is taken as the primary specification goal to formulate its related transmission format and the way of interaction between various roles.
The workflow of the decision support system for the reverse logistics model based on RFID technology is as the following: Firstly, the factors related to each role in the selected reverse logistics model are screened and selected as the variables necessary for this study. Subsequently, the data algorithm is used to carry out causality mining of the variables. Finally, after the data are collected through the RFID system platform, they are converted and analyzed for decision support and other analysis. The decision of the factors can be divided into two main stages: the nature of variables and the role in the supply chain. They are classified into three categories according to the nature of the variables, external factors, decision factors, and internal factors. The external factors are mainly factors that can vary randomly, for example, defective rate, return rate, temperature abnormality, and so on. This category of factors has a decisive influence on the performance of the supply chain. Although there is no method to control them, they can be monitored in real time by using the RFID technology. The decision factor mainly refers to the operation levels set by enterprises themselves in the supply chain, for example, safety stock. This factor has a critical interactive relationship with external factors. Internal factor mainly reflects the performance of the supply chain, such as inventory levels and productivity. The changes in this factor will vary with those in the external factors and decision factors. Hence, its changes are random. Retailers can be regarded as the end point in the final product processing of forward logistics and the starting point in the processing of reverse logistics. The proportion of direct contact between consumers and retailers is the highest. Hence, consumers are an important reference for the performance evaluation of retailers.
System implementation case
This solution framework has guaranteed the effectiveness of its implementation from two aspects as follows: 1) The issue of optimal vehicle scheduling is broken down into two sub-problems of vehicle allocation and single vehicle routing in a way that each sub-problem is subject to fewer constraint conditions, thereby improving the speed of problem solving. 2) As the regional integration of customers is carried out first, the scale of the search is reduced so that the optimal solution can be identified with a high probability.
The application of the system has been implemented in a commercial group in Chongqing. In order to test the specific effect of the implementation of the system, the author used part of the previous real distribution data of the group to carry out a calculation based on the system and then compare the result with the real distribution data. There are ten distribution tasks at present, and three vehicles are available to be scheduled. It is assumed that the maximum load of each vehicle is 100 units, the distance between the distribution center (numbered 0) and the ten distribution tasks as well as the demand unit of each distribution task are shown in Table 1 as the following.
Distance between the distribution task (km) and its demand unit
Distance between the distribution task (km) and its demand unit
The above algorithm is used to calculate the three distribution paths as the following: distribution path A: 0-8-5-10-0; distribution path B: 0-2-9-6-0; distribution path C: 0-7-I -3-4-0; and the path of the scheme is as the following: S = 48.5 + 46 + 25 = 119.5 (km); while the actual distribution path of the group is: 0-1-3-4-7-0, 0-6-9-5-0, 0-10-2-8-0, and the path of the scheme is: S0 = 27 + 50 + 56 = 133 (km).
Through the aforementioned example, it can be seen that after the calculation based on the solution framework, the distribution path of the company has been properly optimized. In addition, due to the application of the system, the cost of the group has been dramatically reduced, which is mainly reflected in the following three aspects: l) As the distance cost is the highest in all the costs, the system has reduced the cost by shortening the transportation distance, and the distance is shortened accordingly, the fuel consumption, the number of drivers, and the working hours of the drivers are reduced as well. 2) The system has freed the logistics and distribution management of the group from tedious manual labor, improved the efficiency of distribution, and reduced labor costs. 3) Before the application of the system, as no accurate transportation paths can be obtained for the distribution, the cost accounting can only be carried out based on 17 yuan/case. Through the proposed system, the unit distribution cost can be calculated accurately based on the transportation distance, which has improved the cost accounting system of the group.
In this paper, based on the rough set fuzzy logic algorithm, the monitoring data collected by the tracking technology in real time are used. In conjunction with the data mining technology, the decision making is supported based on the reverse logistics model to optimize the distribution path in the transportation logistics, improve the distribution efficiency, and reduce the distribution cost of enterprises, including transportation cost and labor cost.
Footnotes
Acknowledgments
2018 Fujian Undergraduate University Education and Teaching Reform Research Project” Practical Teaching Reform of Logistics Specialty Based on Innovation and Entrepreneurship Concept” (FBJG20180063).
2.2018 “New Century Excellent Talent Support Program for Colleges and Universities in Fujian Province”.