
Abstract
In this paper, a new optimization methodology to assess the designs of the various renewable generation systems of electrical energy is used. This methodology utilizes Whale Optimization Algorithm (WOA) to minimize the cost of the electrical energy generated. The methodology permits to examine and to combine different sources of energy as to touch base at an optimal configuration of the hybrid system. This system is capable of providing energy to the predefined site in an achievable way as indicated by certain specialized and financial criteria. The system incorporates wind generation, photovoltaic generation and batteries for energy storage. The recreation results have been acquired with the help of MATLAB programming. Moreover, the outcomes of the proposed methodology have been compared with Particle Swarm Optimization (PSO) Algorithm for validation. The recreation results demonstrated the predominance of the proposed methodology.
Keywords
Nomenclature
Whale Optimization Algorithm Particle swarm optimization Hybrid renewable energy system Renewable energy resources Photovoltaic Fuel cell Fuzzy discrete harmony search Discrete harmony search Firefly algorithm fractional-order firefly algorithm Wind turbine Coefficient vectors Vector describes the position of the best solution Refers to the current iteration Vector describes the position of the whale The vector components Random vectors The consistent number for deciding the shape of the spiral An irregular number between [–1, 1] Random number in [0, 1] Cut-in wind speed Cut-out wind speed Rated wind speed The mean values of x
i
The mean values of y
i
The total number of pairs of values available The average required load from wind turbine The average electric power generated from each wind turbine The energy yield The number of photovoltaic panels in the system The ambient solar radiation intensity The intensity of solar radiation under standard test conditions The photovoltaic panels installed capacity under standard test conditions The system efficiency that relates to the working temperature and cleanliness of panel The factor of safety The variability The theoretical solar cell efficiency The solar cell efficiency at time t The theoretical solar cells temperature The power conditioning system efficiency The self-discharge rate Charging and discharging efficiency of the battery Generated power from wind The generated power from PV The load requirements The inverter efficiency Levelized cost of electricity
Introduction
As is outstanding that the demand for energy changes from one day to another according to the requirements of the separated territories and as indicated by the annual, seasonal and daily periods [1, 2]. Thus, the development of generation facilities to serve energy demand became an important requirement in the whole world [3–5]. Therefore, renewable energy generation is beginning to assume an increasingly essential job in national power systems. Renewable energy technologies have picked up conceded noteworthy mindfulness so as to accomplish the desired environmental usable power [6]. These technologies have a quick comprehensively increment, thus, putting away such energy still a noteworthy hindrance. Wind and solar powers are among the most appealing options of renewable energy technologies. These powers are influenced by open-air conditions, for example, the measure of sun based radiation, wind speed and so forth [7]. In this way, because of the haphazardness and irregular nature of renewable energy, as well as the load fluctuation, the designing and sizing of the renewable energy sources have considered as a big challenge between the researchers [8]. As a result, modern power systems require increased intelligence and flexibility in the control and optimization to ensure the capability of maintaining a generation-load balance, following serious disturbances [9–11]. In the course of the most recent decade, a review of the literature shows that various works associated with hybrid renewable energy system (HRES) have been done in a few nations around the globe. For instance, the authors in [12] assessed the techno-financial achievability of a photovoltaic (PV)/wind/hydrogen system to supply electricity for a specified site using HOMER software. The got outcomes affirmed the plausibility and adequacy of the proposed framework. Zahboune et al. [13] assessed the techno-monetary execution of various half breed frameworks to supply power for rustic telecom. The reproduction results performed by utilizing HOMER software demonstrate that the SPV/wind/battery or SPV/wind/battery/Fuel Cell (FC) are the most reasonable and proficient cross breed framework because of their low aggregate net present cost, individually $75515 and $7, 34,662. The authors in [14] exhibited an investigation of hybrid power system dependent on PV array, wind turbines (WT), converter, batteries, electrolyze, FC and hydrogen tank for various regions in Saudi Arabia. Six configurations were utilized and tried utilizing HOMER software. The investigation demonstrated that the reconciliation 7 batteries storage bank, 3 wind turbines, 2 kW PV array and 2 kW converter is the most reasonable combination, it offers the lowest cost of energy. The authors in [15] presented an iterative strategy for optimization of a non-intermittent source of biomass and energy storage system for distributed energy generation system. The authors in [16] proposed an effective algorithm, namely fuzzy discrete harmony search (FDHS), incorporating fuzzy logic and discrete harmony search (DHS) to specify optimal capacitor locations and amounts of the fixed capacitors in the distribution systems. The FDHS algorithm is conceptually simple, versatile and robust. The results demonstrated that FDHS has superior performance in finding the optimal capacitor allocation and sizing in terms of power dissipation and annual cost savings. Sichilalu et al [17] revealed the viable utility of utilizing estimating strategy and demonstrated the impact of the battery storage the aggregate expense of the hybrid energy system. The authors exhibited a deterministic algorithm to minimize the aggregate system cost while fulfilling the load requirements of an off-grid hybrid PV/wind/diesel energy system. This algorithm utilizes the data of six months of wind speed, solar radiation and temperature. In [18] the authors exhibited an estimating technique for an off-network PV/wind framework by building up an adaptable calculation in the goal to assess the proposed framework. The proposed techno-monetary calculation must be capable of measuring the PV-wind framework with most minimal speculation, for example, optimizing the size of battery bank and PV array for a given load and increasing the efficiency. The authors in [19] introduced a specialized financial examination of hydrogen age and sustainable power source frameworks. The enhanced framework incorporated a 15.9-kW sun based board, an 8-kW power module, and a 16-kW electrolyzer which could deliver 3.2 m3 hydrogen per hr. Besides, the limit of hydrogen stockpiling tank was 320 kg compacted hydrogen with a 30-bar weight. In long haul situations, a half cost decrease in electrolysis cost and a 40% decrease in hydrogen stockpiling cost were considered. Baghdadi et al. [20] investigated a streamlined arrangement for vitality supply of a regular family unit (3 kWh multi days) in three territories. In their examination, specialized financial enhancement of a framework including wind and sun based power with a battery was explored. The capacity limit with regards to two days was found as the ideal arrangement with the least expense of vitality utilization. In [21] the authors considered arranging and execution of sustainable power source frameworks utilizing sun-based, wind and tide energies. The authors in [22] exhibited a framework including photovoltaics board, power module and battery for a vitality providing of a district in Amazon. The objective of this examination was a financial investigation of the referenced pilot framework. The outcomes demonstrated that enhanced essential cost, present venture esteem and power vitality cost of this framework alongside hydrogen stockpiling were 87.138, 102.323 and 1.351$/Kwh. The authors in [23] deal with the parameters estimation problem of chaotic systems using firefly algorithm (FA). The authors introduced a modified version of FA by incorporating fractional calculus during the search process, namely fractional-order FA (FOFA). The authors in [24] introduce a novel technique for designing such control techniques by formulating it as a nonlinear non-convex constrained problem. A novel PSO algorithm, namely the Augmented Lagrangian Particle Swarm Optimization with Fractional Order Velocity (ALPSOFV), is proposed for improving the convergence rate. Most of the methodologies shown in these literature use a short-term meteorological data of wind speed or solar radiation and temperature which in turn reduces the system sizing accuracy. In this paper a new Whale Optimization Algorithm (WOA) [25] has been utilized to assess the designs of the various renewable generation systems of electrical energy. One year of electricity usage has been modeled explicitly, and the delegate year is expected to rehash for the examination time frame. The principal thought of this calculation is to minimize the cost of the electrical energy generated so as to touch base at an optimal configuration of the hybrid system to supply energy to specified load demand. The proposed framework incorporates wind generation, photovoltaic generation and batteries for energy storage.
Whale optimization algorithm
The Whale Optimization Algorithm (WOA) is a recently developed meta-heuristic optimization algorithm which is based on the hunting mechanism of humpback whales, which has good exploration ability for function optimization problems. WOA has been proposed by Seyedali Mirjalili and Andrew Lewis [25]. Humpback whale is one of the immense baleen whales. WOA has been set up as per the hunting procedure, which is called bubble-net feeding technique [26]. This kind of whales chases and hunt their preys close to the surface of the water by making an uncommon stream of bubbles of spiral shape as shown in Fig. 1. The Flowchart describing the operation of WOA is shown in Fig. 2. The numerical portrayal of WOA is clarified in the accompanying sections [27]:
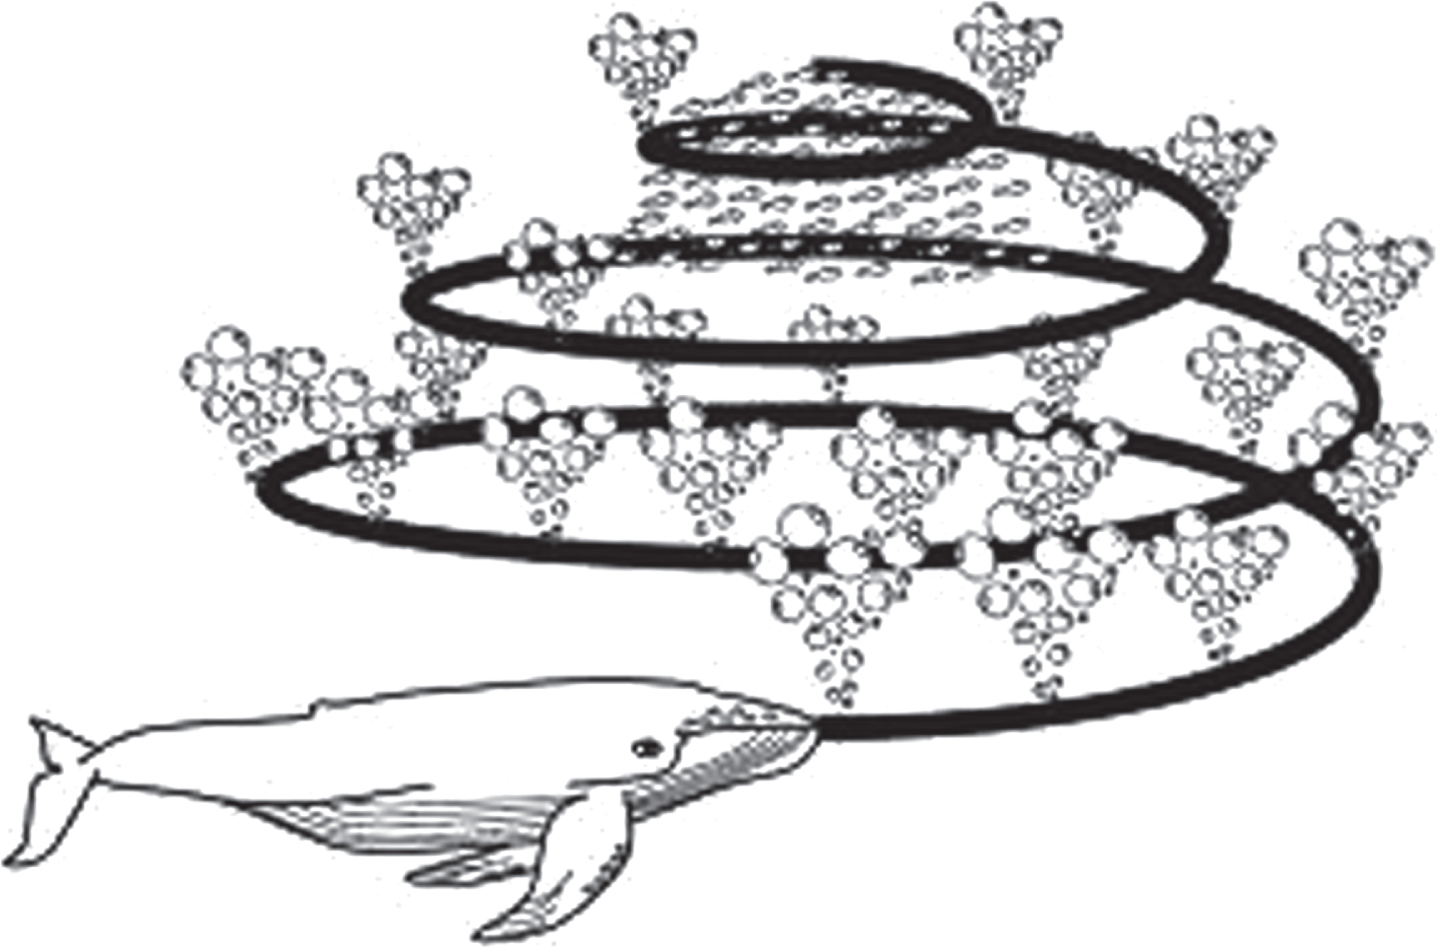
Bubble-net feeding behavior.
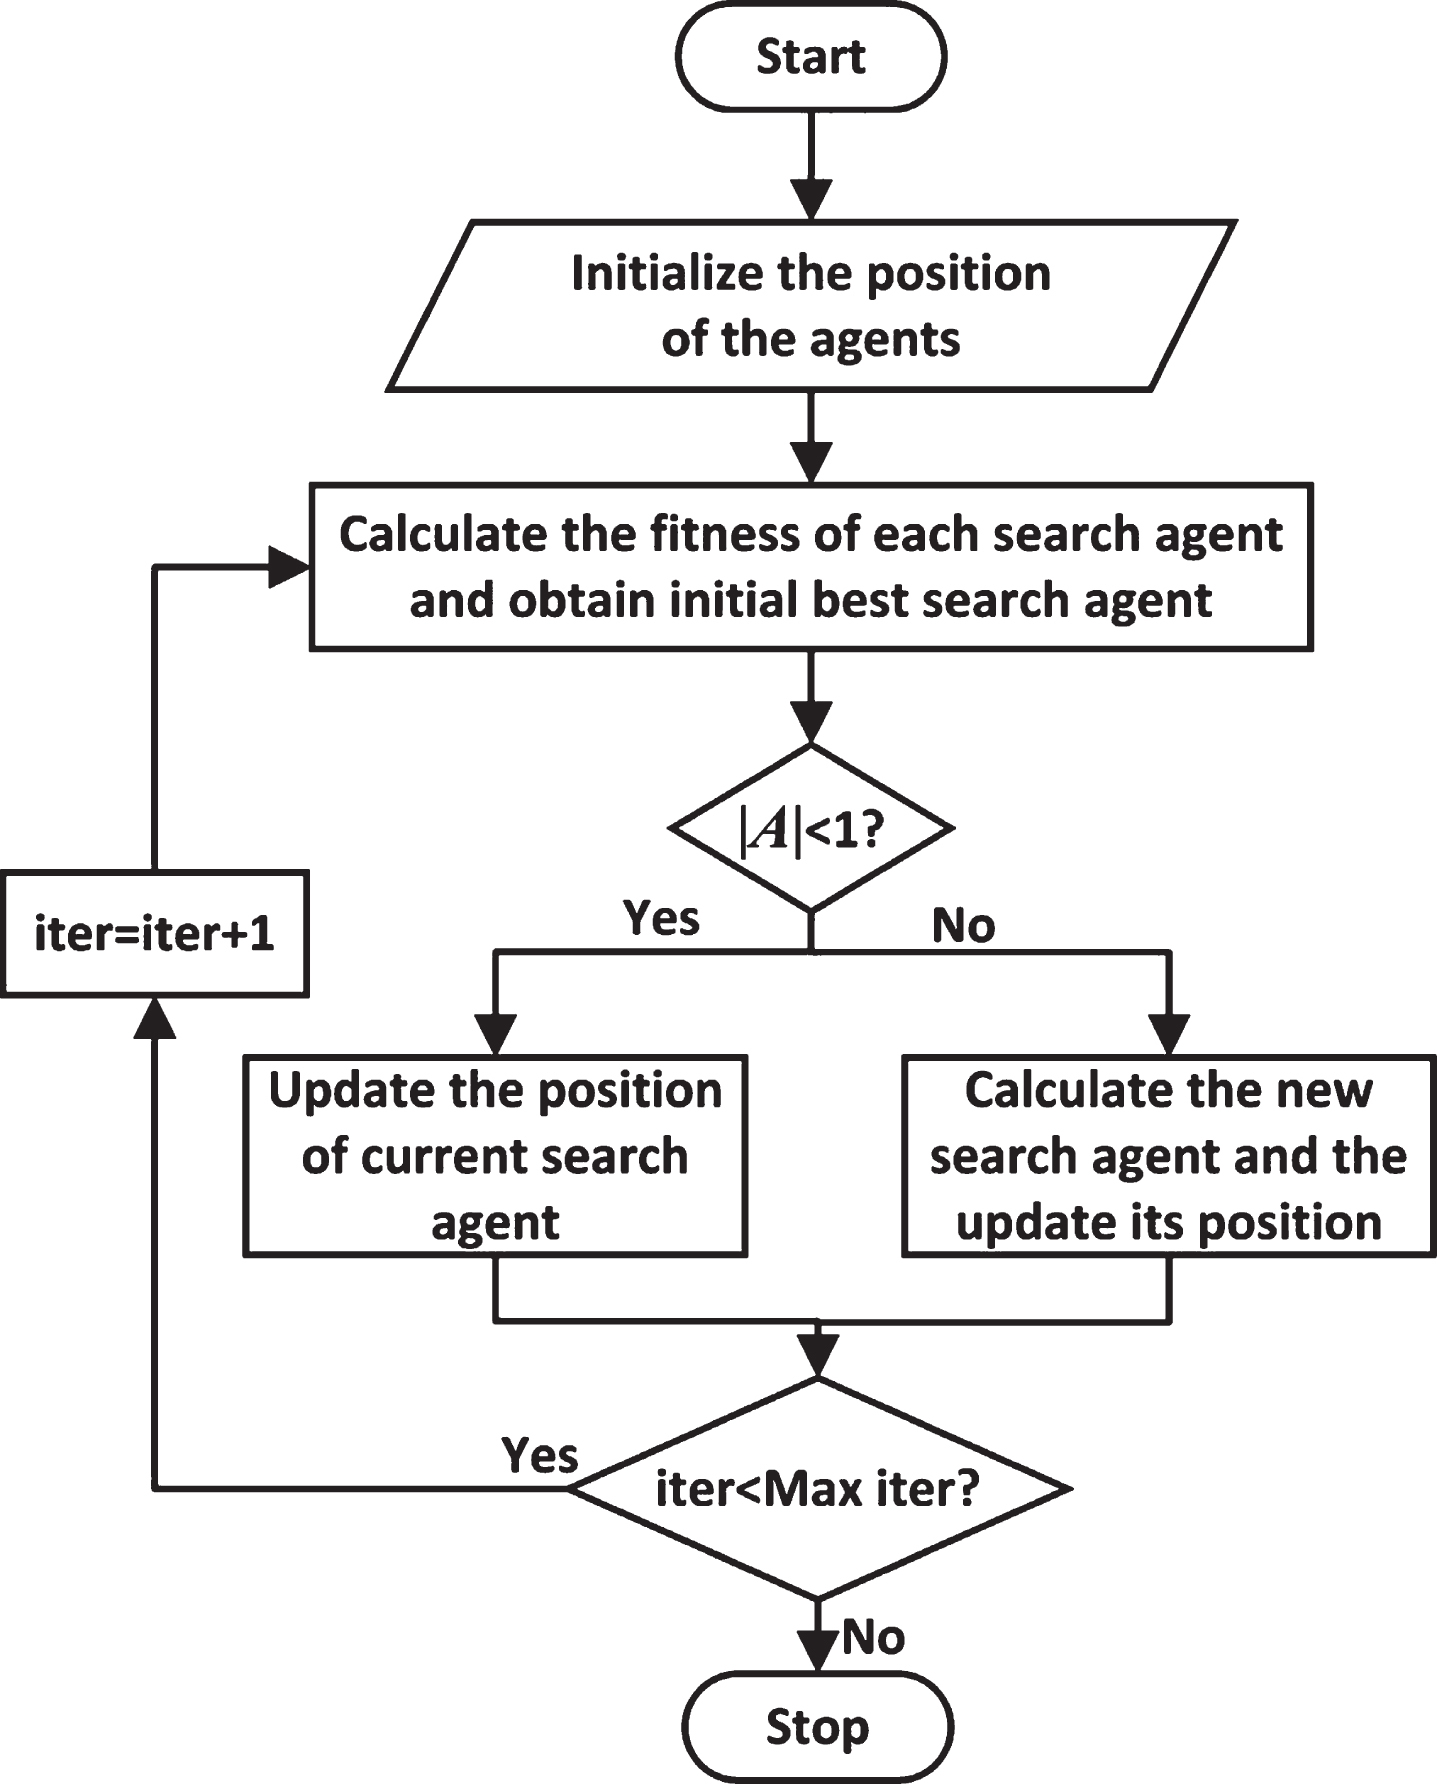
Flowchart of WOA.
As the situation of the optimum incentive in the inquiry space isn’t known, the WOA accept that the best objective prey is the candidate solution [28]. Therefore, the other inquiry agents refresh their situation as indicated by the foreordained position of the best specialist as the accompanying:
Where,
The bubble net behavior of the Humpback whales has two approaches as described in the sections [30]:
Shrinking encircling mechanism
This mechanism is obtained by minimizing the value of
Spiral updating position
Humpback whales jump down and deliver a flood of bubbles in a spiral shape around its objective (prey). In this mechanism the separation between the whale and prey is right off the bat processed, at that point a spiral equation between the situation of the prey and the whale, which takes the spiral shape and is numerically clarified as the accompanying [31]:
Where, b is a consistent number for deciding the shape of the spiral, and l is an irregular number between [-1, 1] [32].
Humpback whales swim around the prey inside a contracting range and over a helix-molded way at the same time. At that point two probabilities are considered to pick among them and are numerically demonstrated as the accompanying [33]:
Where, p is a random number in [0, 1] [33].
Other than bubble-net mechanism, the Humpback whales scan for hunting the prey arbitrarily in the iteration. Whales pursue randomly as per the position of each other. Thus,
On the off chance that the renewable energy resources (RES) created control surpasses the required load request, at that point surplus power is conveyed to charge the battery bank unit. From that point the battery becomes possibly the most important factor when the age of RES is deficient to take care of the heap demand [35]. The PV/wind HRES activity relies upon every segment execution. Hence amending each sustainable source execution, an individual sustainable power source is displayed is talked about in this segment:
Modeling of wind energy generator
The power from the wind can be defined as the following:
Equation (10) shows that wind power is proportional to the power three of the wind speed that is why the output power from wind turbines is affected considerably with the wind speed. The actual wind turbine output power can be calculated from the typical power characteristics curve of the wind turbine as the following, Fig. 3:
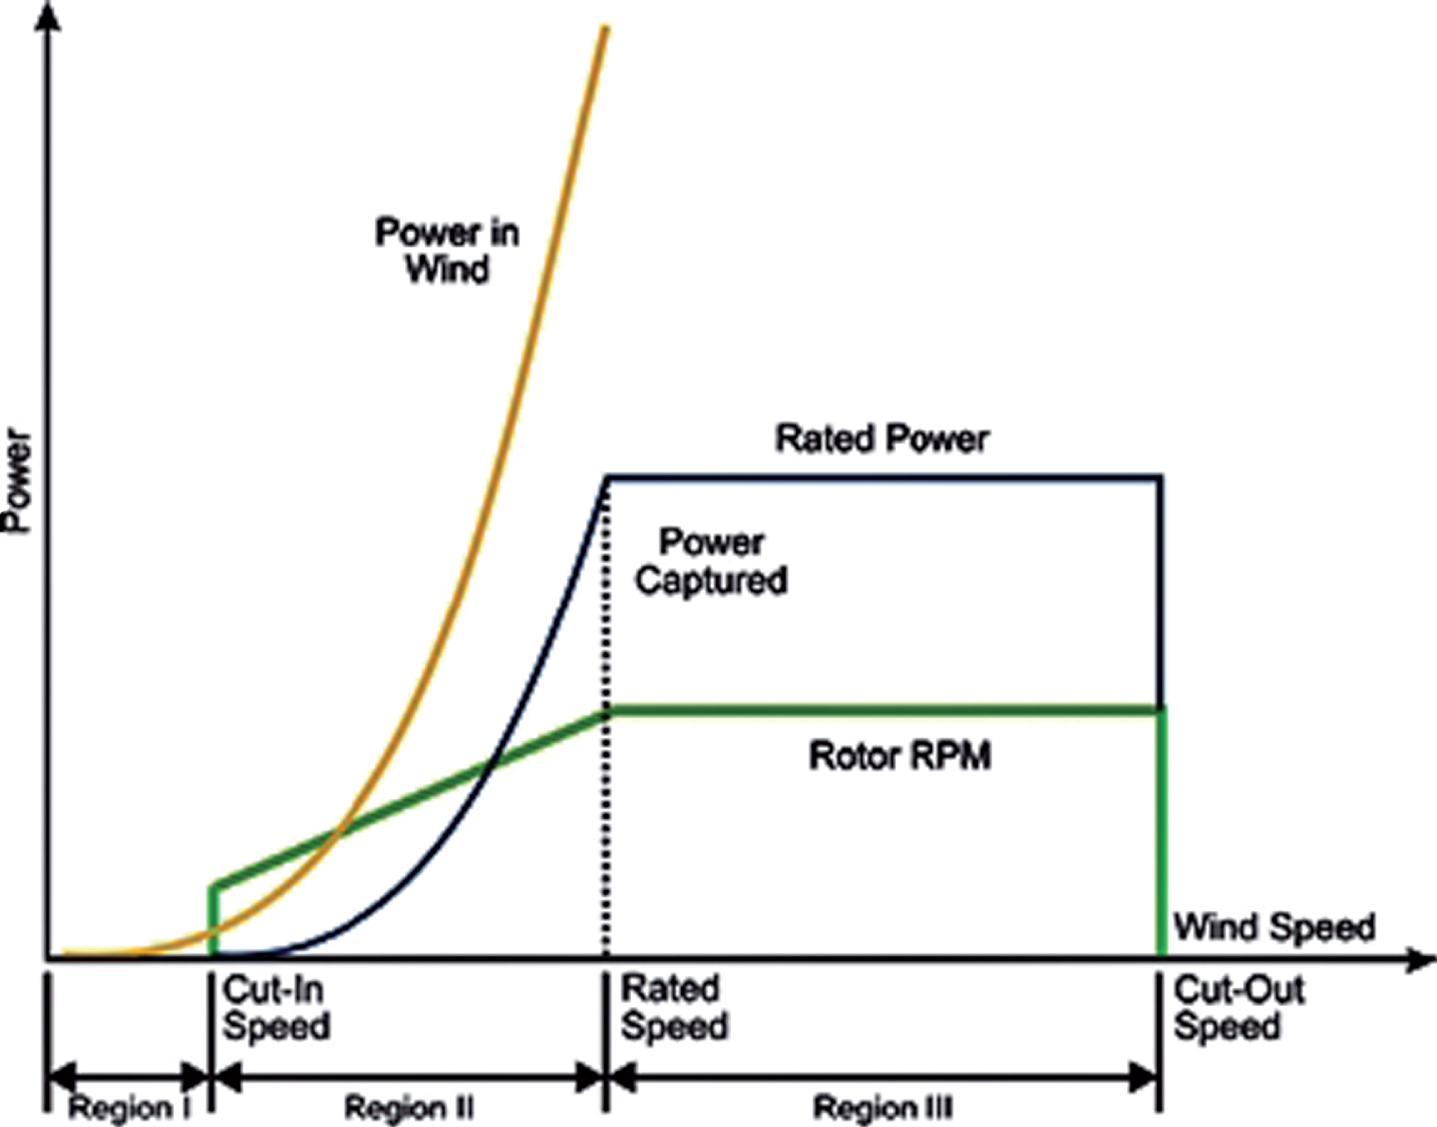
The actual wind turbine output power in relation to wind speed.
From Fig. 3 the following equation can be extrapolated:
Using the above equation, the power yield of a turbine can be modeled if the cut-in (Ucut-in), cut-out (Ucut-off) and rated wind speed (U rated ) and the rated power (P WT ) are known.
The method used in this paper for Weibull parameters estimation is the Least squares approximation to a straight line. The wind speed u is distributed as the Weibull distribution if its probability density function is:
An accurate statistical method for obtaining Weibull parameters has been used in this analysis [36]. The final results for the Weibull parameters are shown in the following equations:
f (u) contains an exponential as shown in Equation (12) and that, in general, exponentials are linearized by taking the logarithm.
This equation takes the form of a straight line as shown in the following equation:
y = ax + b, y = ln [- ln(1 - F (u))] , a = k, x = ln u, b = - k ln c
The values of a and b are determined as follow:
And
Where
The capacity factor of the wind turbine in a specified site can be calculated as the following:
The average number of wind turbines, ANWT required is given by the following equation:
Where, PLW,av is the average required load from the wind turbine, PW,av is the average electric power generated from each wind turbine.
The energy yield from the PV array can be expressed as [37]:
Where, EPV is the energy yield (kWh); n P V is the number of photovoltaic panels in the system; Irad(t) is the ambient solar radiation intensity (kWh/m2); I S TC is the intensity of solar radiation under standard test conditions (kWh/m2); P P V is the photovoltaic panels installed capacity under standard test conditions (kW); η P V is the system efficiency that relates to the working temperature and cleanliness of panel [38].
The solar cell average area (PVA) required to feed load with average load, PLPV,av can be calculated from the following equation:
F s is the factor of safety in the order of 1.1. V F is the variability, about 0.95.
Where, η c r is the theoretical solar cell efficiency, η c (t) is the solar cell efficiency at time t, T c r is the theoretical solar cells temperature, η PC is the power conditioning system efficiency [39].
The maximum and minimum limits that the battery can store are EB,max and EB,min individually. The condition of charge of the battery ought to between these two breaking points. The control framework should quit charging in the event of the condition of charge of the battery reached EB,max and stop discharging in case of this state reaches EB,min to avert batteries against shortening their life or even their demolitions [40, 41]. The condition of the battery after a certain time frame Δt in charging and releasing procedure (E B (t + Δt)) can be characterized from (22) and (23) individually. These two conditions are legitimate just when the condition of charge of the battery inside as far as possible appeared (24) generally the condition of the battery can be gotten from (25) [42].
Where, σ b is the self-discharge rate in the value of 0.2% per day. ηBC and ηBD are the charging and discharging efficiency of the battery, 90%, 85%, respectively. P W (t) is generated power from wind, P PV (t) is the generated power from PV, P L (t) is the load requirements and η inv is the inverter efficiency, 90% [43].
The Levelized Cost of Electricity (LCOE) has been used in this study and can be calculated from the following:
The detailed calculations of the parameters of Equation (26) are available in [44–47].
A load demand in a specified area has been utilized in this study. This load including the electricity supply of 45 houses located in the site under study. The estimated monthly load profile is shown in Fig. 4. Figure 5 shows the schematic diagram of the proposed system.

Monthly load profile.
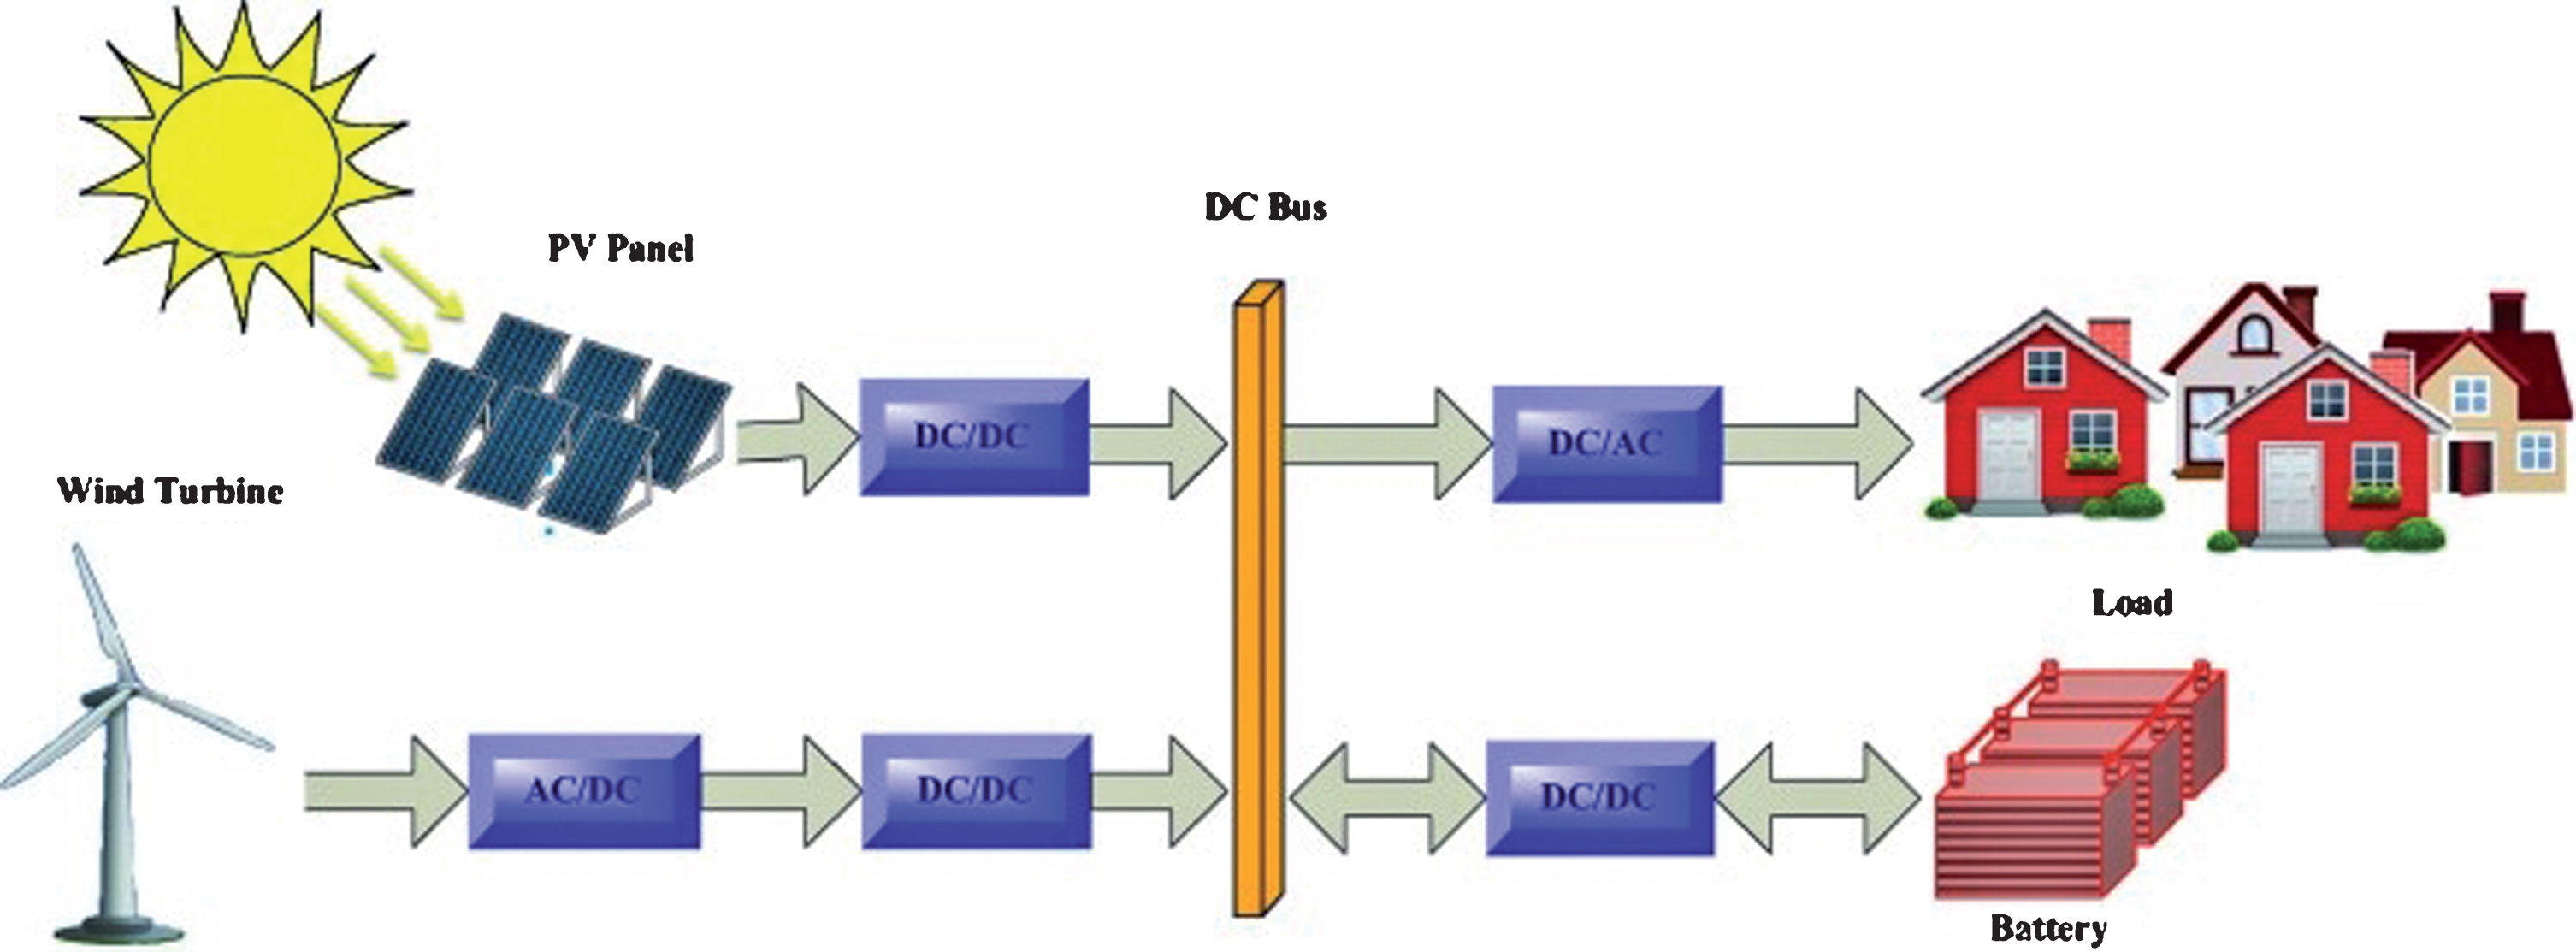
Schematic diagram of the proposed system.
The proposed WOA methodology has been applied to perform sizing and optimization of a standalone hybrid PV/wind/ battery system in order to supply the demand. The simulations were executed using one year hourly data of wind speed, solar radiation and ambient temperatures for the sites under study. The results obtained from WOA methodology have been compared with the results obtained from the PSO algorithm for validation. Figures 6 and 7 show the solar irradiance/temperature data and wind speed data for the selected site, which is obtained from NASA [38]. Table 1, shows the economic characteristics of the system components [49, 50]. Table 2, shows the technical characteristics of the system components [51]. Figure 8 demonstrates the convergence process of the WOA algorithm during the minimization of the LCOE for 2 autonomous runs. As obvious in this figure, the optimum solution is acquired after around 20 iterations, and the 200 iterations are considered as a reasonable end measure. In addition, it can be noted that the optimum solution almost converges to the same optimum value (global minimum) for all runs. According to the optimization results the WOA reached the optimum solution (LCOE = 0.2337 $/kW) after 19 iterations as shown in Fig. 8.

Solar radiation/temperature.
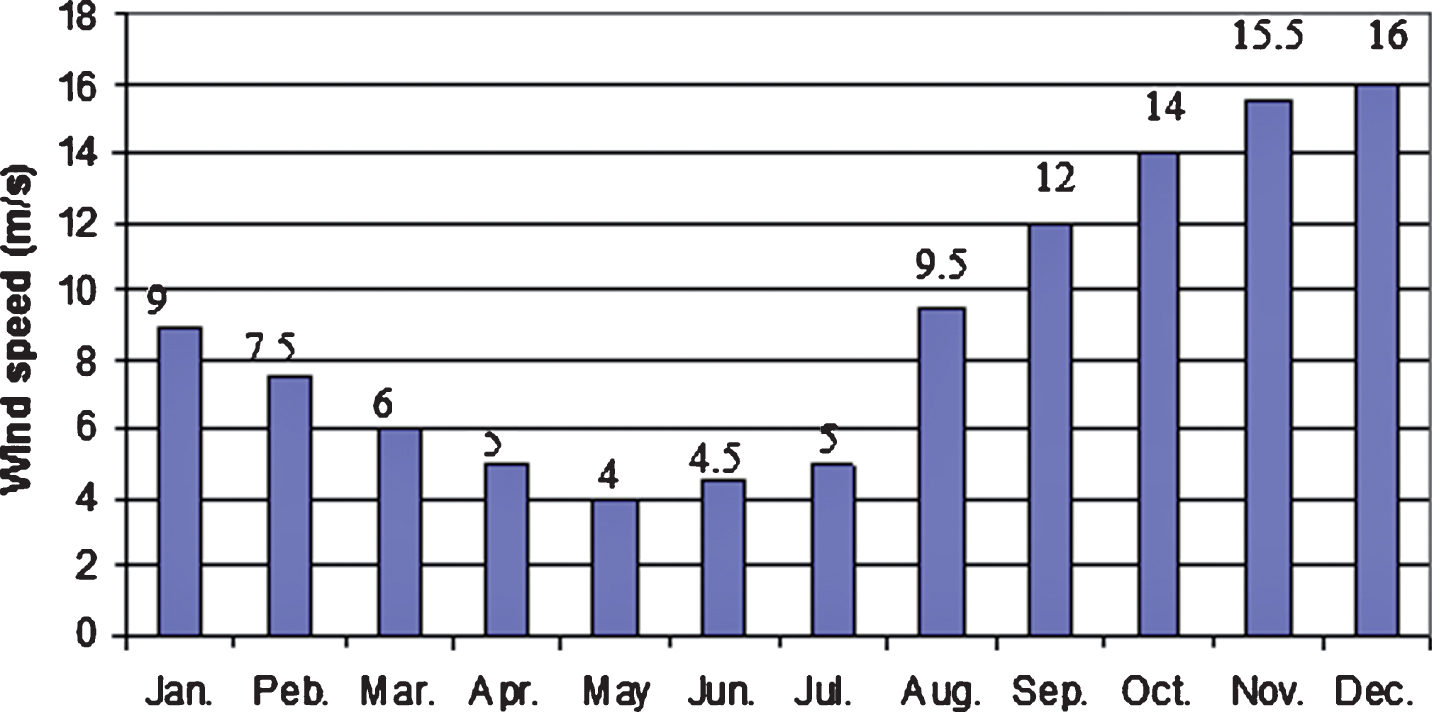
Wind speed.

WOA convergence.
The economic and technical characteristics of the system components
The technical characteristics of the system components
The WOA results have been compared with the results obtained from PSO [52]. A PSO-based MATLAB code has been used to determine the optimal size of the HRES to supply the load demand. The parameters of PSO consist of 50 populations and 200 maximum generations. Comparison results of the optimal sizing for HRES are shown in Table 3. As seen from this table that the results obtained from PSO, WOA are nearly the same. In the WOA, the program can design the optimum size of each component depending on the minimum cost of energy. The main advantage of WOA is its high flexibility and ability to deal with nonlinear, non-differentiable functions and functions with a large number of parameters.
Comparison of results of the optimal sizing for HRES
This study has been carried out a design and an economic feasibility assessment of a stand-alone hybrid PV/wind/battery energy system. The proposed methodology depends on the meteorological data of wind speed, solar radiation and temperature. Whale Optimization Algorithm (WOA) has been utilized to minimize the cost objective function of the system to supply the electricity demand of typical houses located in a specified site. MATLAB software has been utilized to set up the code used for sizing of the system under study. The proposed algorithm assured good performance, especially with the huge number of variables. Moreover, the global minimum value of the objective function has been acquired quickly and in a short time compared to other optimization algorithms.