
Abstract
Structure of convolutional neural network (CNN) applied for image recognition requires large numbers of tuning for designated datasets in practice. It is a time-consuming process to finally come up with a feasible structure for specific requirement. This paper proposes a method based on Taguchi method which can efficiently determine the optimal structure of hyperparameters combination. Five hyperparameters with four levels are defined as control factors and two indicators are chosen to measure the performance of CNN structure. L16 (45) orthogonal array is used to arrange the experiment. S/N ratio and main effect plot are used to identify the optimal structure (hyperparameter combination) of CNN. The classic case of MNIST is employed to verify the practicability of the proposed method. Results show that the proposed method can identify the optimal CNN structure efficiently and also rank the significance priority of hyperparameters.
Introduction
In the field of image recognition, the convolutional neural network (CNN) has been proved to be a widely used and successful approach. The adoption of CNN as features extractors and image classifier has been applied in extensive fields, such as medical image classification [1], lung image recognition for diagnosing interstitial lung disease [2], and pavement deterioration evaluation based on 3D images of pavement surface [3]. From 1962, when the research of receptive fields in cat’s visual cortex triggered the idea of artificial neural network (ANN) with convolutional layers was completed [4]. Until today, a large numbers of state-of-art CNN structures has been created and developed, such as LeNet-5 [5], Alexnet [6], GoogleNet [7] and ResNet [8]. While CNN has been proved to be effective method of features extraction and image recognition, there are still drawbacks in certain aspects to obtain better performance.
Tuning of hyperparameter is one crucial issue in assembling CNN structure which is designated for specific task assignment [9–11]. That is, even though many CNN structures have been proposed and applied successfully; however, hyperparameter selection which considerably alters the structure of network. Combination of hyperparameters is still a major task for customized networks.
Alexnet is a groundbreaking work which considerably increases the efficiency and accuracy with applications of several revolutionary approaches which now have been widely employed. In recent years, Alexnet’s performance has been also improved via justifying its structure. Simply stacking layers would not always contribute to performance of neural network. In fact, deeper neural network is not only hard to train but also will not increase the accuracy when reaching the threshold [8]. Furthermore, certain characteristics also impact machine learning performance in different levels. Alexnet introduces several methods such as using non-saturated function as activation function, local response normalization and overlapping pooling, to avoid overfitting which are considered to be effective and broadly adopted in subsequent emerged architectures [6]. All these properties of Alexnet already fulfill the fundamental requirements in qualitatively examining significance analysis of hyperparameters. Several parameters are selected to be fixed in all trials with others altered respect to experimental set up in order to investigate significance of targeted hyperparameters.
Taguchi method is demonstrated well applications to obtain the optimal parameter combination in the area of quality engineering. Taguchi method has many advantages as: (1) Taguchi method can achieve global optimum in a more efficient approach; (2) The methodology is adapted to dealing with parameters which are qualitative and discrete; (3) Orthogonal arrays with S/N ratio adopted as normalization approach emphasizes on analyzing variability of control factor which facilitates investigating significance analysis.
For these considerations, Taguchi method is also a statistical design of experiment (DOE) which can be treated as mathematical model to elucidate the quantified relationships between variables hence intuitionally computing correlation analysis. Taguchi method as a statistic method is widely used in determining optimal parameters combination. Taguchi method can be used to restrict numbers of experiments to minimum which has equally credible statistical result compared to that of running all experiments. Therefore, this paper builds an optimization method based on Taguchi method to identify the optimal CNN structure and analyze the influences of hyperparameters.
In CNN structure, variable definition and significance analysis are the two major tasks conducting analysis the optimal combination [12, 13]. Variable, i.e., hyperparameter and also named control factor. In this paper, definition is the foundation of conducting orthogonal arrays and significance analysis. This paper chooses five control factors from CNN hyperparameters and assign them with different levels in order to measure performance change due to cause of variability. Two performance indicators, time and accuracy, are employed to measure the performance of CNN structure. Statistical processing methods, such as S/N ratio and min-max normalization, are employed for qualitative significance analysis.
A classic case of MNIST is used to verify the practicability of the proposed method, including the optimal CNN structure and significance priority of control factors.
This paper is organized as below: Section 2 reviews the control factors of CNN structure, the performance indicators of CNN, and the Taguchi method. Section 3 develops the optimization procedure of CNN structure, including the layout of control factors and levels, the optimization algorithm, and the performance indicators. In Section 4, the illustrative example is presented to demonstrate the effectiveness of the method. Finally, conclusions are given in Section 5.
Related works
Control factors of CNN structure
Parameters (such as weights in the black box) and hyperparameters (such as layers, activation functions) are two types of factors influencing the CNN performance. CNN structure is established by hyperparameters, i.e., hyperparameters can be regarded as control factors and CNN structure can be regarded as control factors combination. CNN structure will significantly influence the performance.
For this specific research, there are two major innovation points: (1) the selection of hyperparameters which emphasized on architectural parameters, and (2) the comprehensive analysis and evaluation based on definition of control factors and performance indicators.
There are several researches of hyperparameters which affect performance of CNN have been done. A typical CNN structure often contains convolutional layers, pooling layers (maximum or average) and full-connected layers. Convolutional layers serve as feature extractors and convolutional kernel is the real tool of extraction which is analogy of receptive field in biological neural network ([4, 14]). Convolutional layers can be formed deeper in order to more effectively extract feature maps in raw data [11]. Also, since the convolutional kernel represents artificial receptive field which accepts stimulation and extracts features, the size of the kernels is decisive for the quality of extracted features. Related researches proved that the quantities of convolutional layers and the quantities of kernels are important control factors.
On the other hand, fully connected layers are the classifier of image. Neurons in full-connected layers are connected to all neurons in previous layers [6]. Though this fact surely will improve the performance of classification, while it also causes huge computation hence results slow speed of operation since every neuron in full-connected layer are involved in calculation. Though it is pretty obvious that changing quantities of neurons in fully connected layers will affect performance of network, how these changes are impacting the performance is still uncertain. Hence, both quantities of full-connected layers and neurons in each full-connected layer are selected to be another control factor.
At this point, five main control factors can be determined (quantity of convolutional layers, quantity of full-connected layers, Kernel size, neurons in single full-connected layer, and quantity of kernels in single convolutional layer). Nevertheless, there are still other hyperparameters having influence on performance which not included in this paper.
According to Thoma [15], hyperparameters are parameters of models which are not optimized automatically. The study comprehensively introduced and discussed multiple approaches to optimize CNN structure, such as adjusting batch size, data augmentation, local response, etc. According to Madić and Radovanović, optimal selection of hyperparameters of artificial neural network (ANN) could be investigated through adopting Taguchi method [16]. The research stressed on hyperparameters related to algorithms training. Furthermore, the structure of ANN could not be easily applied indiscriminately in CNN structure. Though both articles chose Taguchi method as the statistical framework, this study proposes a different selection of hyperparameters with emphasis on CNN structure which due to the reason that CNN performance could strongly be altered by changes in structure. Another reason that to choose these 5 hyperparameters as factors is that this study would like to spend more focus on hyperparameter structure.
In fact, other hyperparameters are relatively elucidated and can be regarded as fixed control factors. In the pooling layer, compared to average pooling, max pooling has higher efficiency which has been proved theoretically and experimentally [17]. The function of max pooling layer is to reduce feature maps which extracted in previous convolutional layer hence reduce the amount of calculation in operation [11]. In fact, this paper deployed two max pooling layers in all trials due to the consideration of dimension reduction.
Nonlinear activation is another import hyperparameter that considerably effecting network training time, and this has a significant influence on the performance [14]. In this paper, leaky Rectified Linear Unit (leaky ReLU) is deployed as nonlinear activation function for all trials; since non-saturated nonlinearity such as ReLU has been proved to facilitate reducing training time remarkably [6]. Even though ReLU no longer suffers from vanishing gradient problems, there are still drawbacks that urge us to employ leaky ReLU as only nonlinearity ([14, 18]). Weight-training of neurons with gradient descent optimization algorithms will be shut down once the weights become zero which triggers these units become nonactivated. ReLU still will suffer from slow convergence if there are plentiful previous units have been shut down, while leaky ReLU allows for small nonzero gradients when the units are not active yet is saturated [19].
Performance indicators of CNN
Performance indicators are crucial for evaluating whether a machine learning network feasible. Two indicators, time of single iteration (also known as unit time in later context) and accuracy, are commonly used in related works. Time consumed in single iteration is used to represent how fast one network could converge. Timing of convergence or rate of convergence actually is quite determined by the structure; in other words, good convergent performance is likely caused by appropriate assembling of structure and hyperparameters ([14, 21]). Since all of our experimental trials have been proved to be able to converge decently in practice, time of single iteration could be adapted to evaluate the rate of convergence, i.e., the efficiency of whole network.
On the other hand, accuracy is another crucial indicator in performance evaluation. There are several indicators can denote correctness of image classification, such as accuracy, precision, and interpretability etc, which might have different definition in the field of machine learning. This paper uses accuracy as the performance indicator of correctness. Accuracy measures the number of successful hits relative to the total number of classifications. There are four situations to describe correctness and accuracy is calculated as sum of true positive and true negative over all prediction outcomes. A true positive is an outcome where the model correctly predicts the positive class. Similarly, a true negative is an outcome where the model correctly predicts the negative class. Classification rate and Cohen’s kappa are two mainly accepted accuracy measurements; whose major distinction is the scoring of true classification rates [22]. Though both metrics originally adopted in two-class classification, several researches have demonstrated the possibility to deploy same approach in multi-classification task. Classification rate refers the number of correct predictions over total number of predictions, which is by far the most commonly used evaluation metric [23].
Layout of control factors and levels
Layout of control factors and levels
Taguchi method is a widely used method of design of experiment (DOE) in the field of quality engineering. For this research, the optimization of CNN structure can be regarded as a DOE problem and Taguchi method can appropriately solve this problem. The goal of Taguchi method is to assemble factors properly in order to reduce variation from target value so that the quality loss is less sensitive to the cause of variability [24–28]. Taguchi method can not only significantly bring the trials of experiments to the minimum but also quantify the interactions between control factors and causality of control factors and performance indicators. Orthogonal array is the main tool used to test the entire parameter space with a small number of experiments only [29]. For five control factors with four levels, there should be 625 (54) experiments to identify the optimal combination. With the employment of orthogonal array, the trials of experiments are reduced to 16 (L16 (45)) experiments for which obtains equally statistical valid results. Taguchi method has been widely used and recently employed in solving the optimization problems of mathematic models. Khorasani et al. [30] used ANN and Taguchi method to predict the milling operation in manufacturing process. Subbaraj et al. [31] used Taguchi method to enhance the self-adaptive real-coded genetic algorithm for economic dispatch problem. Maji et al. [32] deployed Taguchi method to select then rank important factors into optimized combination in order to achieve better diagnosis of abnormality with automated detection approaches. In this case, the classification of medical images is actually completed by employing CNN as artificial detection tool and also exhibits that CNN is a strong and well-accepted machine learning approach in the field of image recognition. Sun et al. [27] adopted Taguchi method as robustness optimization algorithms to discover maximum structural crashworthiness design which involved various uncertainties.
Methodology
Definition of control factors and levels
As mentioned above, this paper chooses five control factors from the related works of CNN hyperparameters. Each control factor defines appropriate four levels by referring commonly used CNN models. The layout of control factors and levels is shown as Table 1.
For first three control factors, they determine the attributes of convolutional layers hence domain the features extraction phase. In Table 1, control factor A represents how many convolutional layers stacked in single network which will diversify the patterns of extracted features along with the changes of quantities of convolutional layers. Deeper stacks of convolutional layers will increase the performance of multi-classification of images [33–36]. Two stages of feature extraction yield better accuracy than one [33]. This improvement of performance requires deeper stacking of convolutional layers. However, sometimes it would also like to find a tradeoff between accuracy and efficiency for designated target for costumed CNN. Deeper structures may suffer from slow convergence even fail to be trained. With this consideration, quantity of convolutional layers is assigned to be control factor as deeper networks are not always good.
Control factor B which represents quantity of full-connected layers draws similar concern. The trade of between efficiency and accuracy is crucial for this research. In fact, neurons are connected to all neurons in previous layers in fully connected layers which may cause considerable redundant calculation. For this reason, the number of hidden neurons in full-connected layer. Control factor D also should be discovered.
Both control factors C and E are attributes of kernel which determines how many and what kind of features will be extracted.
All five selected control factors have certain impacts on both efficiency and accuracy of a CNN structure. Setting up with various levels will allow us to investigate the impacts more intuitively and apply statistically credible significant analysis with the application of Taguchi method. Other hyperparameters, such as nonlinearity activation function, and pooling layers, are not assigned as control factors since their mechanics has been quite revealed in some related works.
L16 (45) orthogonal array
L16 (45) orthogonal array
In this research, the experiment design of five control factors with four levels is arranged in a standard L16 (45) orthogonal array which effectively expurgates the numerous experiments, from 625 to 16 trials, but still has valid statistical result. The experiment design is shown in Table 2.
For data acquisition, there are two performance indicators adopted which are unit time and accuracy. Unit time calculated by averaging all single iteration time represents the efficiency of CNN; meanwhile accuracy, as maximum value of accuracy among all results in single experiment trial, represents correctness of data training process.
Optimization algorithm
This paper proposes an optimization algorithm based on Taguchi method to determine the optimal CNN structure. The process of the proposed algorithm is shown as Fig. 1. Firstly, through the control factors defined in this study and their levels, an experimental orthogonal array can be generated, and the accuracy and the unit time of CNN of each experiment can be obtained by combining SN ratio and normalization method. Finally, the optimal structure of CNN is obtained according to the main effect plot.

Optimization algorithm of CNN structure.
Orthogonal array and signal to noise ratio (S/N ratio) are two crucial tools of Taguchi method while another normalization approach, feature scaling, is also used in statistical analysis. On account of mathematical definition, S/N ratio hence represents the interaction of control factors and noise which has significant impact on variability reduction, to be more specific, slight interaction contributes greatly to variability reduction [25]. S/N ratio can be more particularly classified in three categories which the selection based on features of responses. In this case, the smaller-the-better (STB) ratio is adopted for unit time since it is necessary to pursue faster training process, while the larger-the-better (LTB) is selected for accuracy.
The smaller-the-better (STB) type:
The larger-the-better (LTB) type:
With the generated main effect plot for S/N ratio, the significance of five factors will be visually demonstrated.
Considering the inconsistence of range of two performance indicators, the min-max normalization is adopted in order to investigate the comprehensive analysis of performance. Min-max normalization as one of most common method of normalization rescales data in [0, 1]. Since data range of time and accuracy are quite separate which require normalization before further statistical analysis and comprehensive evaluation.
Formula of min-max normalization for accuracy in each experiment:
Formula of min-max normalization for unit time in each experiment:
After normalized value of unit time and accuracy are generated separately, to merge both performance indicators into one measurement, the weighting algorithm is adopted. Considering training time and accuracy are equally important for a testing model of CNN, at this point, the comprehensive measurement is calculated by setting individual characteristics equal-weighted.
The realization of the proposed methodology in this research is implemented under the framework of TensorFlow which is installed on python. Though there are several program languages or platforms, such as python, C language, and MATLAB etc., which have been widely used due to different consideration. For this research, python is selected as a programming framework, with TensorFlow library installed. TensorFlow is a machine learning system which can be built into multiple programming languages. TensorFlow supports a variety of applications, with a focus on training and inference on deep neural networks. TensorFlow installs a variety of classic machine learning algorithms which are packed in relatively simple program statements; these statements are named as operations (as shown in Table 3). Classical neural-net building blocks includes activation functions (Sigmoid, ReLU), the classifier (softmax), and computations (Convolution2D, Maxpool), which are all crucial algorithms and computations for developing customized CNN structures. For instance, sigmoid as a specific type of activation function represents a logistical function which is widely used in feedforward neural networks because of its nonlinearity and the computational simplicity of its derivative. With the packed algorithms dedicated to machine learning, TensorFlow library installed on python has been assigned as the coding framework for this study.
Several frequently-used TensorFlow operations
Several frequently-used TensorFlow operations
In order to intuitively demonstrate how CNN works in programming perspective, the specific codes are presented according to a typical CNN structure. LeNet model is the groundbreaking work in the field of CNN, though might be obsolete presently since numerous developments of algorithms and techniques have been proposed till today. Its originality actually allows this study to introduce the structure of CNN more intuitively.
A typical CNN training process often includes four phases: input, feature extraction, classification, and output. Generally speaking, feature extraction refers as arithmetic and operation occur in both convolutional layers and pooling layers, while full connected layers, also known as hidden layers, refers as classifier. To run a complete training of CNN, firstly raw data (images for this specific case) is pretreated into a dataset which has been altered into numerical matrix. Then, pretreated matrix is transformed through convolution then whose size is compressed in pooling layers. Multiple convolutional kernels facilitate diversity of features since more kernels mean more features. The next step is to train classification algorithms by assigning features extracted in last phase. The softmax function is selected as the classifier for this case since it is especially useful for multi-class problems that are critical to image recognition. At this point, the training of a CNN structure is basically completed.
The process of programming is listed below:
(1) Disposal of the transformed data. The raw data for image recognition is image which cannot be directly programmed in python; hence, the preprocessing of data is indispensable. In this phase, images is transformed into matrix then saved as character strings in TensorFlow. The matrix manipulation could be easily applied with pre-installed statements in TensorFlow library.
(2) Development of the model (y, x, w, b). Softmax has been assigned as the only classifier for multi-class in this case, the mathematical model is abstracted and translated into the programming language: tf.nn.softmax(tf.matmul(data, weight)+bias)
tf.matmul refers matrix multiplication while tf.nn.softmax refers softmax function. It should be point out that for this specific statement, the data is entered as a format of matrix and later output as vectors. This transformation is caused by the softmax function itself which is introduced in detail later in this section.
(3) Disposal of weights and bias. For weights: Initial = tf.truncated_normal(shape, stddev = 0.1)
This definition generates a matrix with a standard deviation of 0.1 according to the number of elements in input matrix.
For bias: Initial = tf.constant(0.1, shape = shape)
This definition generates a matrix with a value of 0.1, and then forces it to a variable of TensorFlow.
(4) Convolution. Since the modular design of the program is introduced for this study, the convolution and max-pooling operations are pre-defined to allow for adjusting the code more effectively.
The statement is tf.nn.conv2d(input, filter, strides, padding)
In this case, the programming language is tf.nn.conv2d(x, W, strides=[1, 1, 1, 1], padding=’SAME’)
(5) Max pooling and activation function
The function of pooling layer, which often follows convolutional layer, is to compress the size of the computational matrix, thereby reducing the amount of computation due to previous operation which can effectively avoid over-fitting. The statement is tf.nn.max_pool(x, ksize=[1, 2, 2, 1], strides=[1, 2, 2, 1], padding=’SAME’)
(6) Softmax function as a classifer. SoftMax function, in short, is an activation function which used for mapping the output of previous layers of neural network into probability [37], which is presented as tf.nn.softmax(tf.matmul(x, Weight) + bias)
This function is essentially a normalized exponential function whose input is a vector and then normalized into a probability distribution in the range of 0 to 1. softmax function, usually applied in multi-category classification, is a widely tool for logistic regression.
(7) Training the model by adopting gradient descendent algorithms. Neural networks with softmax as a classifier are usually trained with cross-entropy to give multinomial logistic regression. For this case, cross entropy is selected as loss function. Gradient descent algorithm is introduced for training of loss function: cross_entropy = -tf.reduce_sum(y_*tf.log(y)) train_step = tf.train.GradientDescentOptimizer(0.0001).minimize(cross_entropy)
Case Background
MNIST data set of hand written digits [5] is used in this paper for training and testing. MNIST is widely used data base in field of CNN and images retrieved from MNIST which have sized of 28×28 pixels are the input of CNN under research in this specific case.
Results
All 16 trials are inspired by the structure of Alexnet with certain hyperparameters changes. Though with the alteration of layers stacks, numbers of neurons and kernel size, distinctive structure will be conducted; other control features will be set invariantly so that tuning methods will not vary properties of networks substantially.
The experiment of A1B1C1D1E1 is employed for demonstration. The structure of A1B1C1D1E1 is shown in Fig. 2.
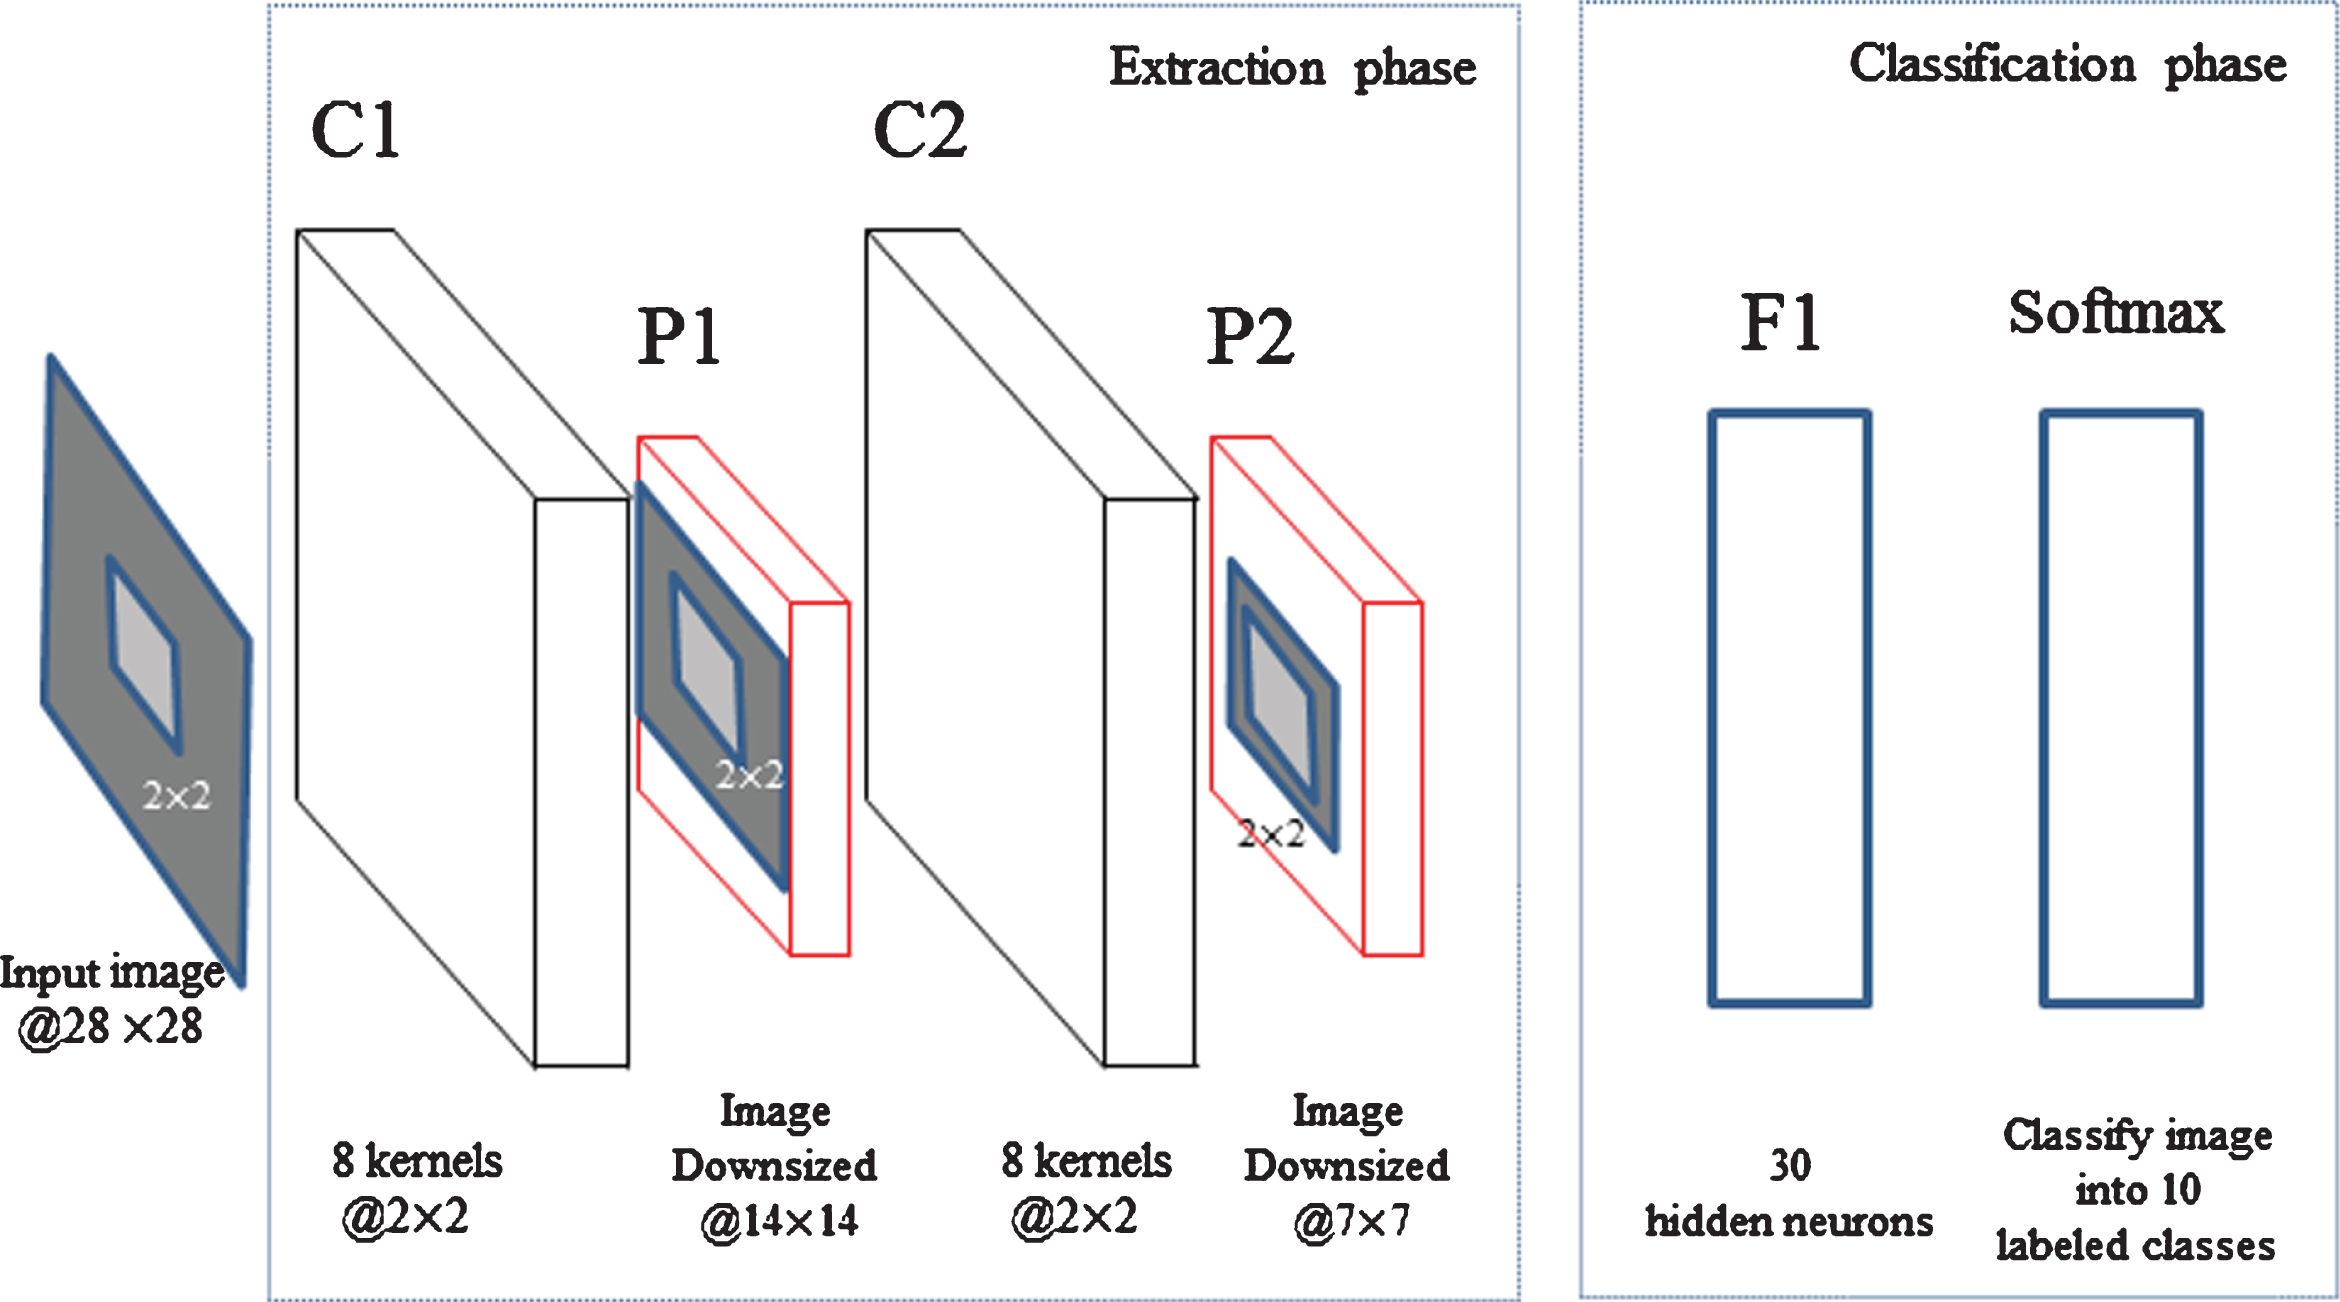
CNN structure of A1B1C1D1E1.
Results of accuracy
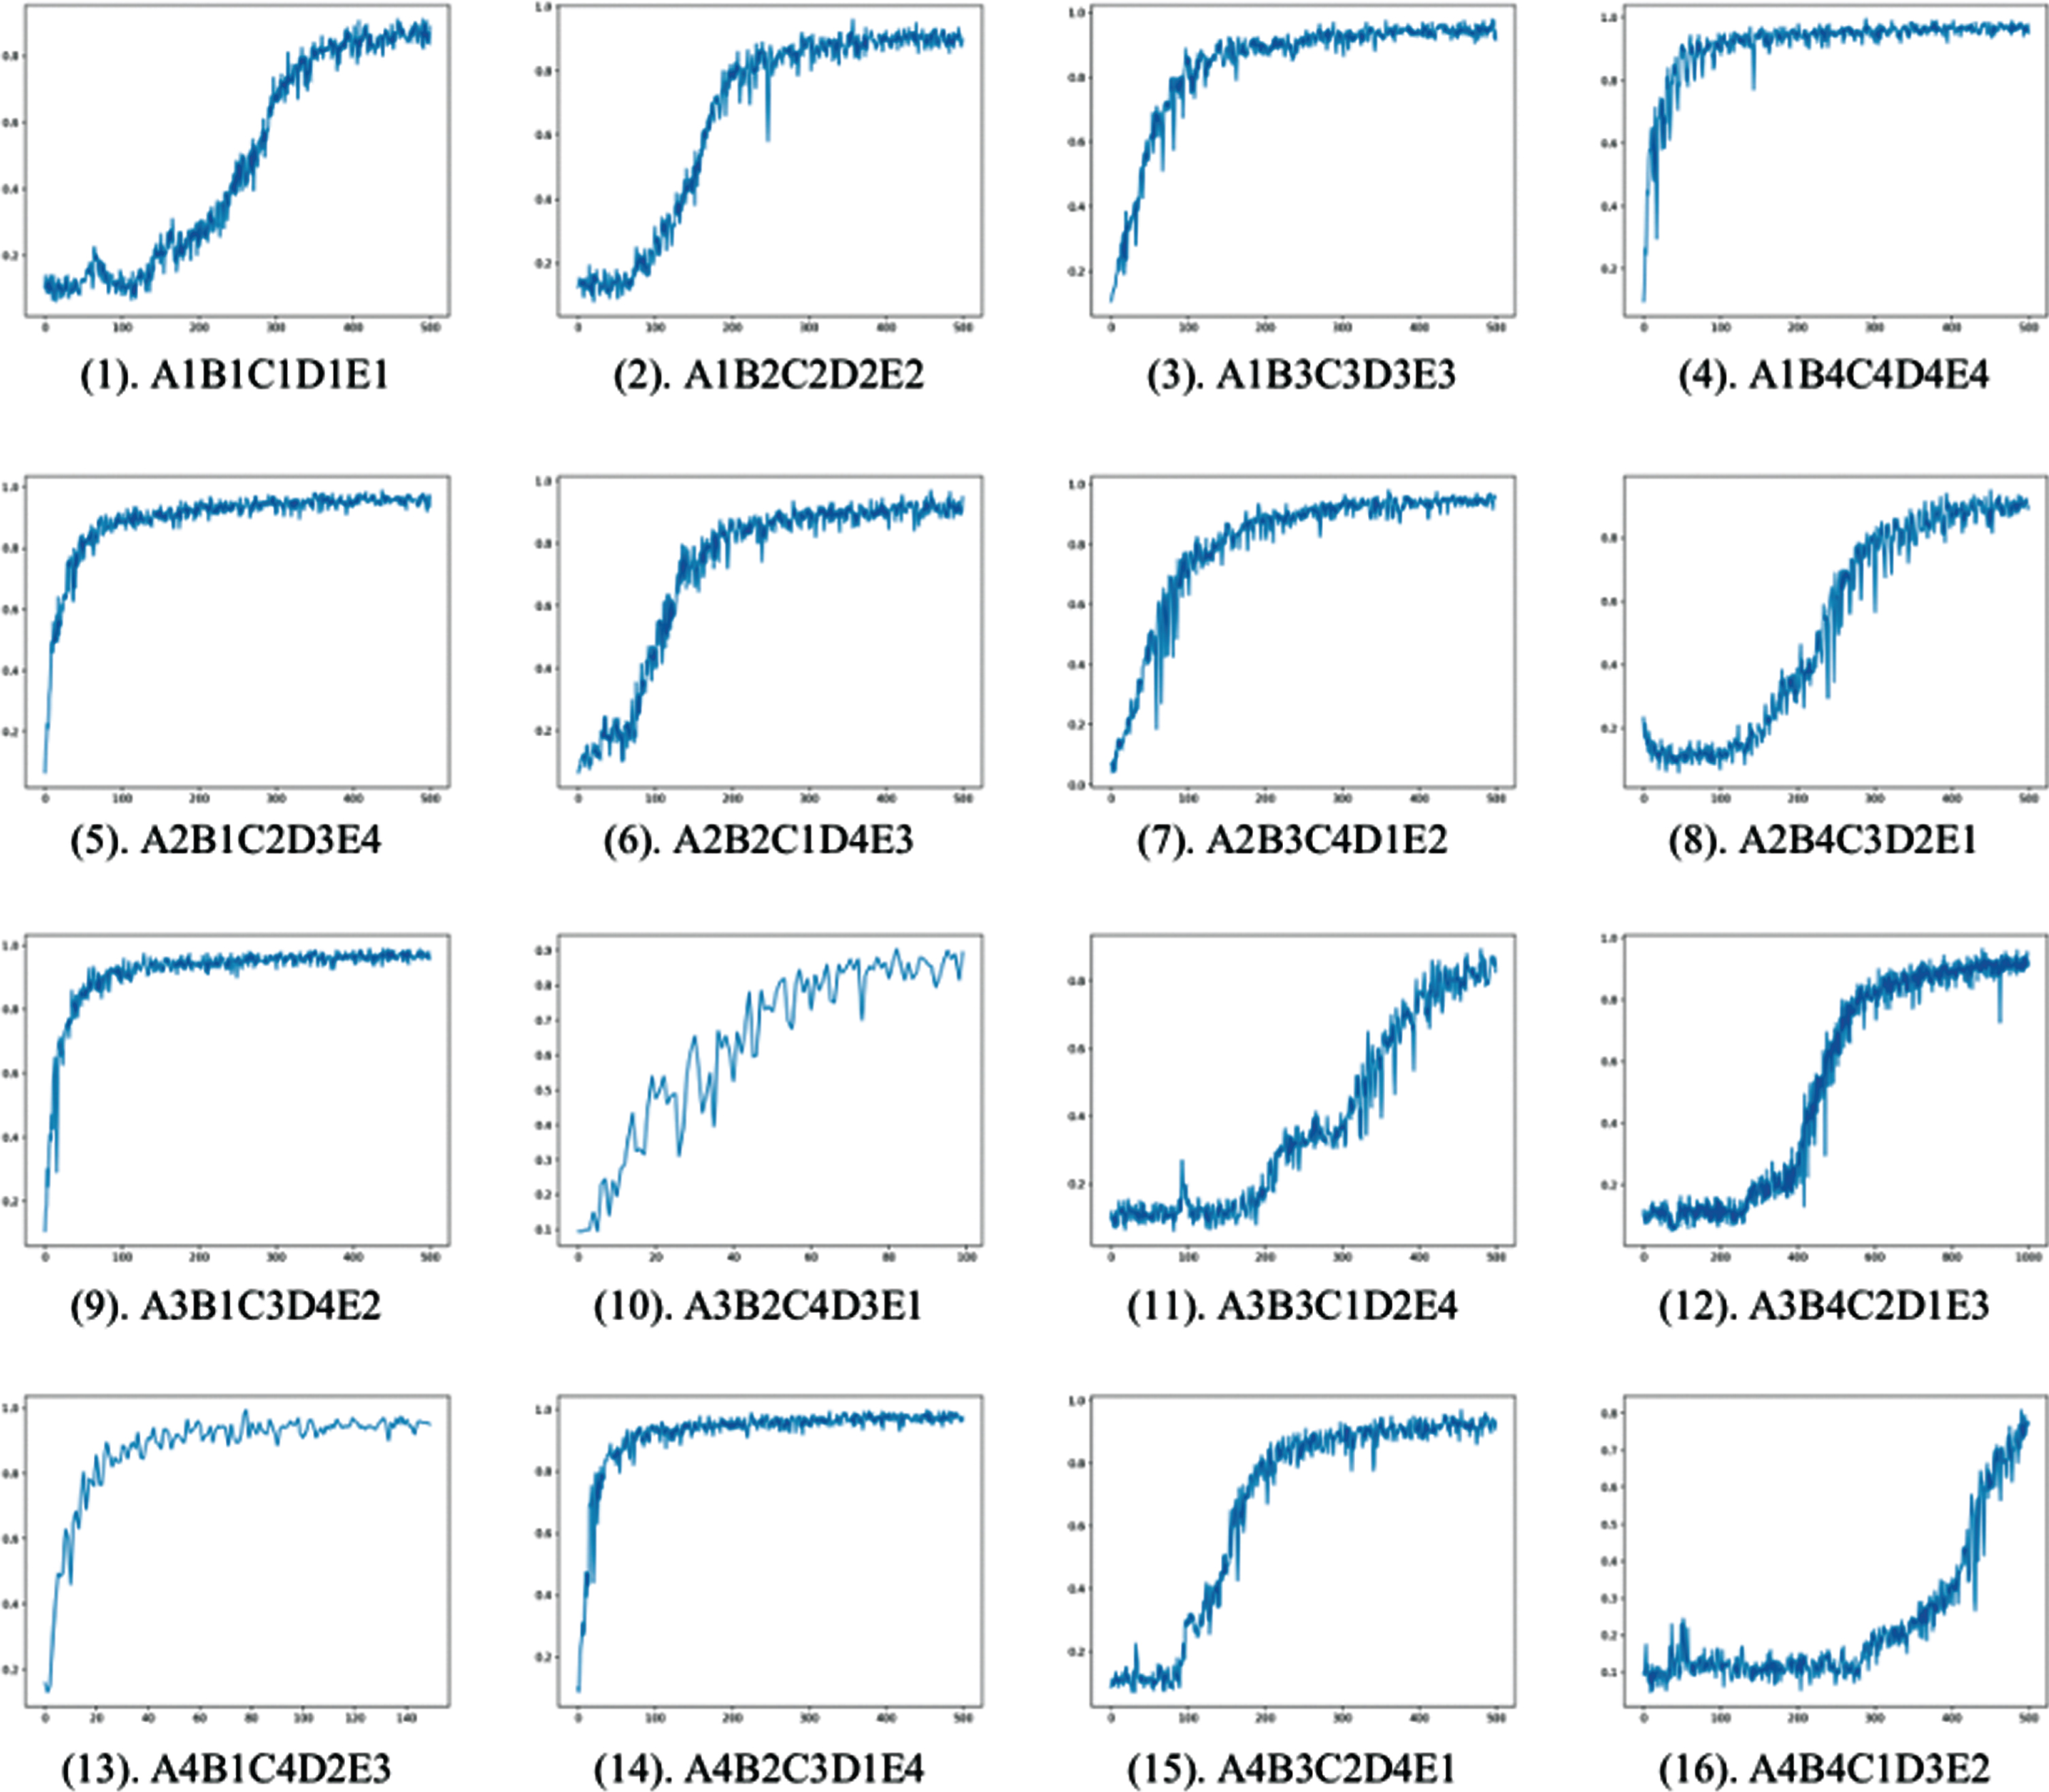
Training accuracy of the 16 experiments.
With the example of structure, we will be able to exemplify principles of assembly of networks in this research. Generally, all structures include convolutional layers, max pooling layers, full-connected layers and softmax function as classifier at the end of networks. The max pooling layers have size 2×2 for all experiments and are implemented after first two convolutional layers. Max-pooling is deployed to reduce spatial size hence computation and to increase the robustness to local feature distortion [3]. Leaky ReLU is employed as non-saturating nonlinearity activation function with learning rate set 0.0001. Output layer contains softmax function as classifier to label distribution of 10 features (10 features refers to 10 hand-written digits) extracted previously in the network.
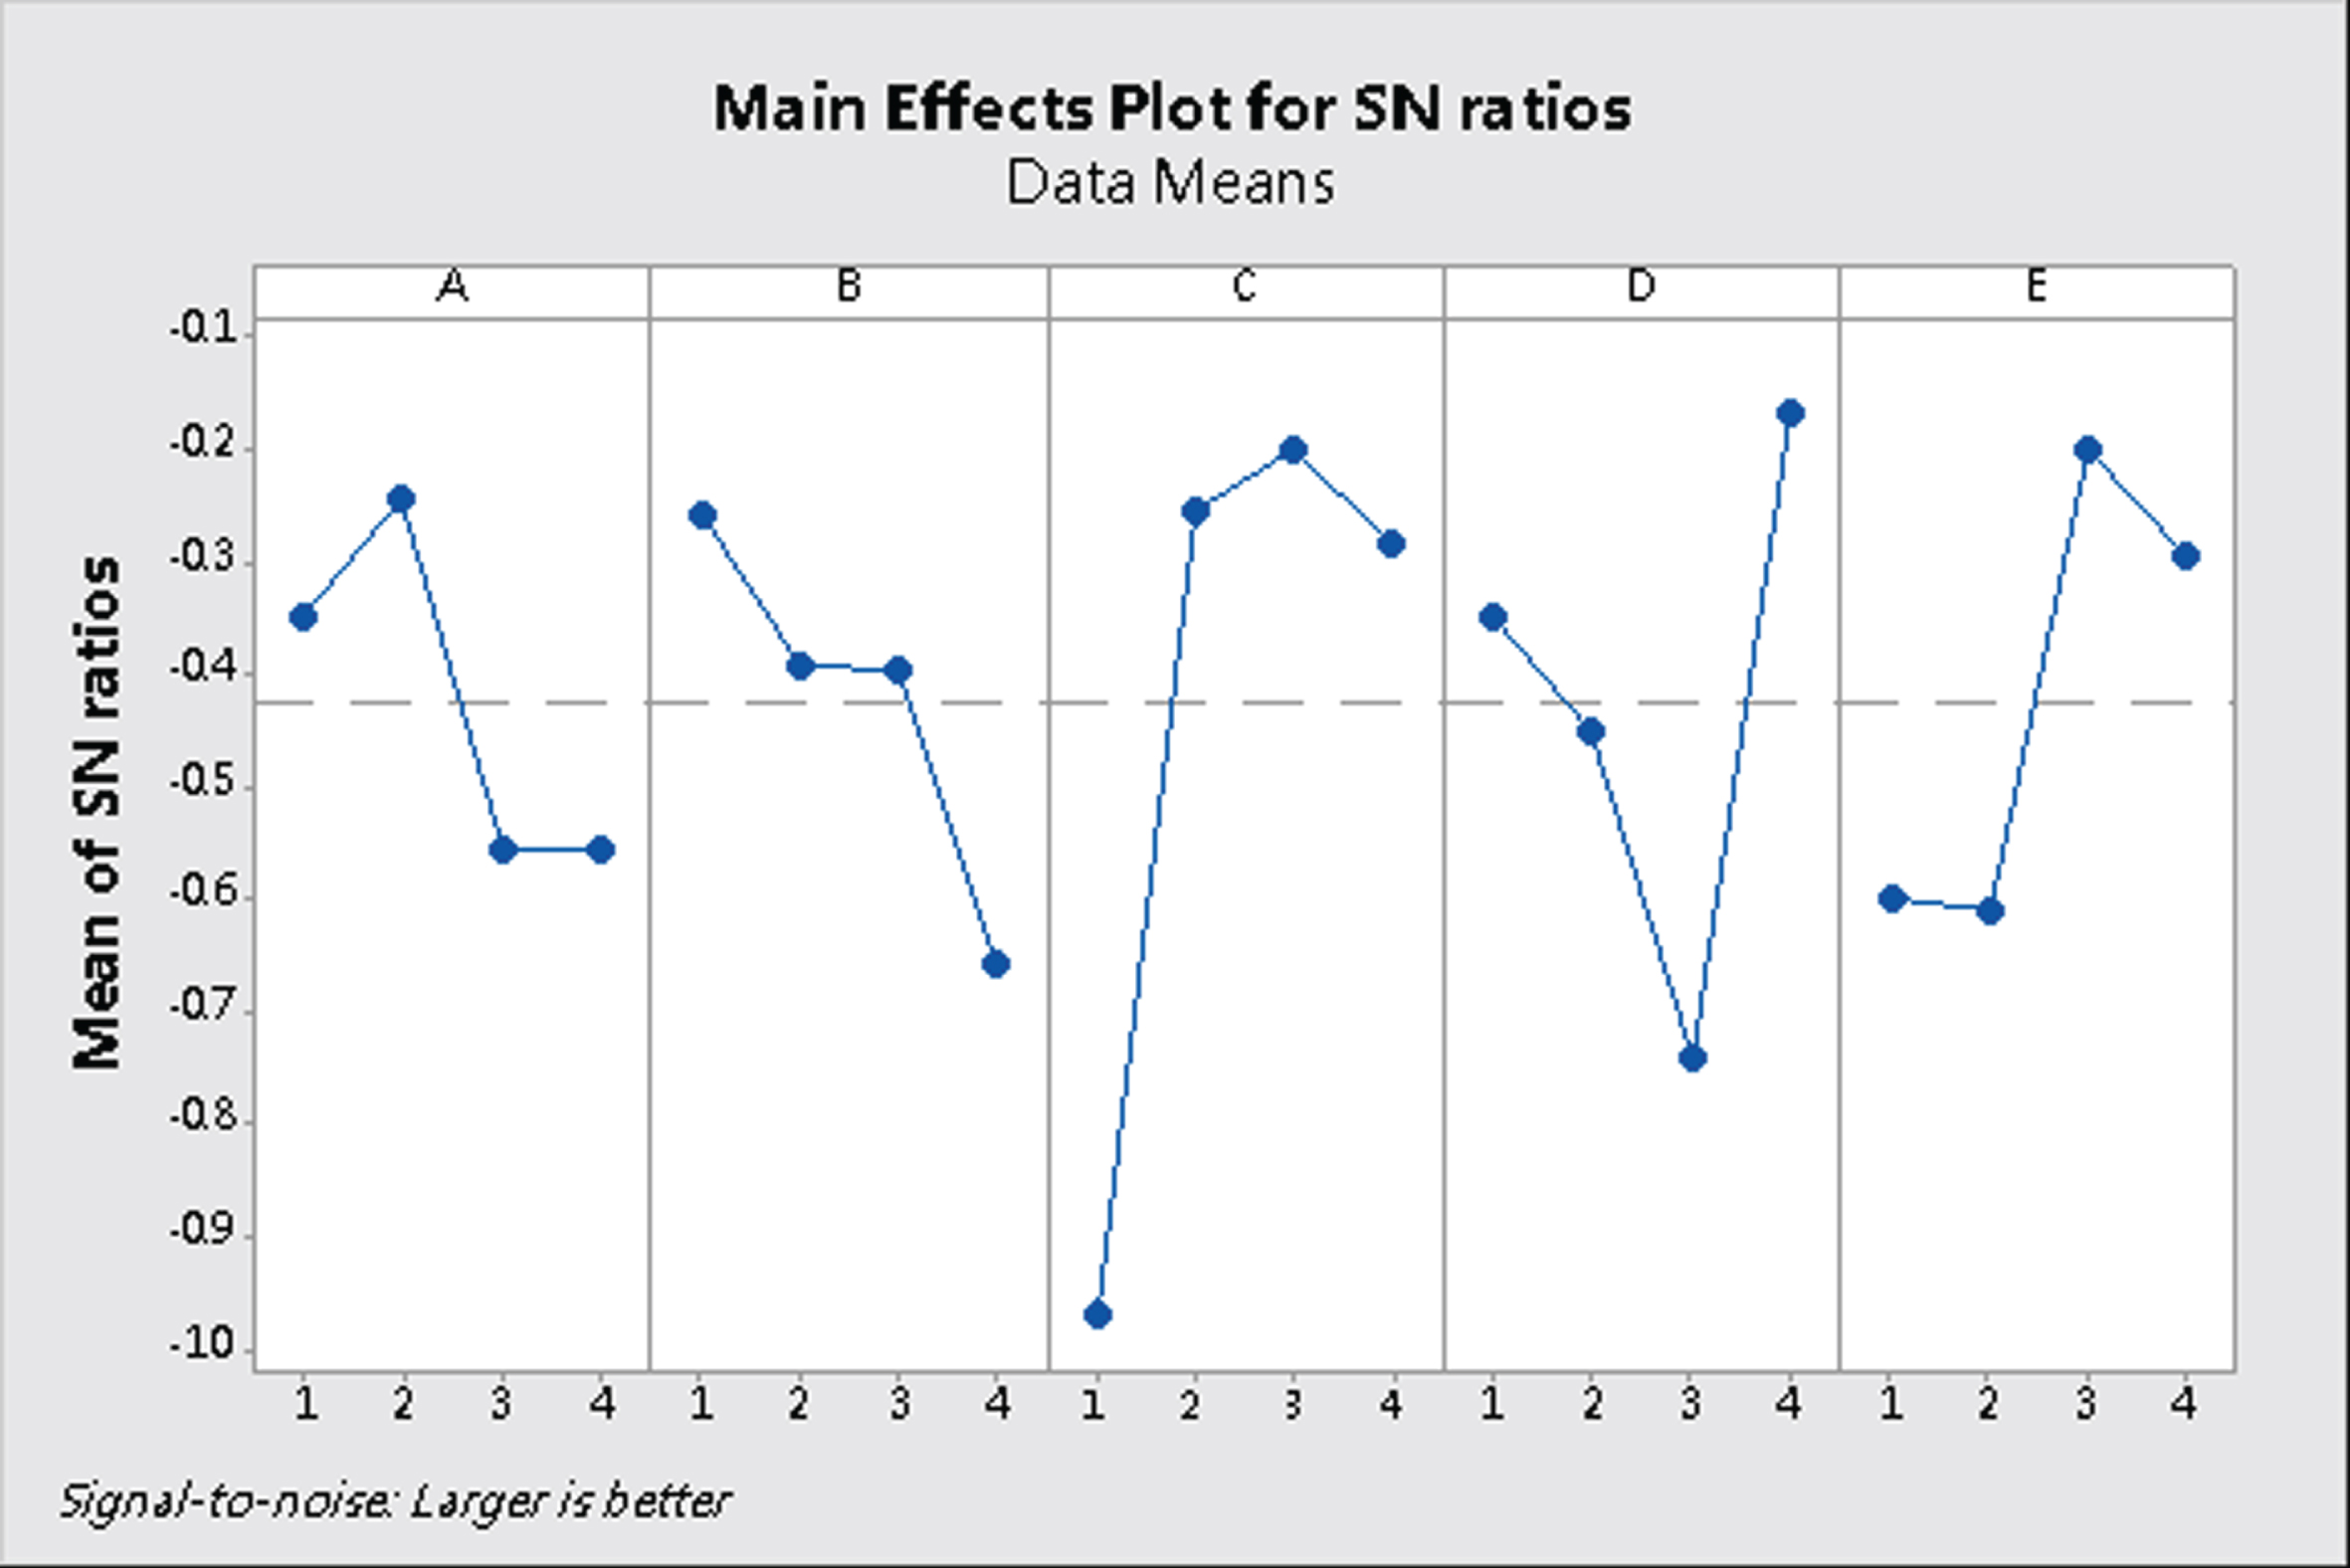
Main effect plot for S/N ratio of accuracy.
For this illustrative experiment whose specific assembly is presented in Fig. 2, there are three layers with weights: two convolutional layers and one full-connected layer. Each convolutional layer contains eight kernels with size of 2×2, and 30 neurons in full connected layer. It is worth noting that typically for a feasible CNN structure, the numbers of parameters in each different layer is set to be altered in order to achieve better performance. However, in this article, for individual training practice, the numbers of parameters are fixed invariant which changed respect to the various levels of the factor due to consideration of control variate. This setup is adopted for both convolutional layers and full-connected layers.
Since two performance indicators are tested, unit time and accuracy, for which cannot demonstrate all-inclusive performance individually. The discussion of result should be considered both separately and combinedly.
Table 4 and Fig. 3 show the training accuracy of the 16 experiments and Fig. 4 shows the main effect plot of control factors.

Main effect plot for S/N ratio of unit time.
As shown in Fig. 4, the optimal CNN structure under the accuracy indicator is A2B1C3D4E3, which means two stacks of convolutional layers, one full-connected layer, with 3×3 kernel, 80 parameters in each convolutional layer, and 20 parameters in full-connected layer. The accuracy of A2B1C3D4E3 is 0.995 (the highest among these experiments).
According to the main effect plot shown in Fig. 4, the most crucial factor is the size of kernel (factor C), successively followed by the quantity of neurons in single full-connected layer (factor D).
Table 5 shows the training time of the 16 experiments and Fig. 5 shows the main effect plot of control factors.
Results of unit time
Results of unit time
Results of comprehensive indicator
As shown in Fig. 5, the optimal CNN structure under the time indicator is A1B1C1D3E1, representing 2 stacks of convolutional layers, 1 full-connected layer, kernel sized 2 pixels, 80 parameters in each convolutional layer, and finally 8 parameters in full-connected layers. The unit time of A1B1C1D3E1 is 0.17589 (the fast among these experiments).
According to the main effect plot shown in Fig. 5, factor C (kernel size) has most significant impact on unit time, then factor E (quantity of kernels in each convolutional layer). Main effect plot for S/N ratio of comprehensive indicators.
After separately examining the results based on dual effects, we hence try to find an integrated combination of factors that fits both performance indicators. As shown in Table 6, the normalized accuracy (A′) and normalized unit time (T′) are calculated via Equations (3) and (4), respectively. The comprehensive evaluation (
Optimal CNN structures and priorities of control factors
Optimal CNN structures and priorities of control factors
As shown in Fig. 6, the optimal CNN structure under the comprehensive indicators is A1B1C2D4E1, representing 2 convolutional layers, 1 full-connected layer, kernel size as 3, 120 neurons in each full-connected layer and 8 kernels in each convolutional layer.
Though the rank of control factors’ significance in three different situations varies, the most significant factor is kernel size for all three situations (as shown in Table 7 and Fig. 7). It is intuitively accessible since the fact that convolutional kernel, or known as filter, represents receptive field which determines the features extraction in artificial genetic based neural network.

Training accuracy of optimal structures.
This study validates the proposed method to improve the efficiency of CNN structure adjustment. In terms of efficiency, the original 625 experiments can be greatly reduced to 16 experiments, and the best CNN structure (hyperparameter combination) can be found, which is helpful for saving experimental time and experimental effectiveness. In terms of effectiveness, whether it aims at accuracy, or targets unit time, or targets comprehensive indicator, the proposed method can find the best CNN structure. At the same time, the results of Table 4 to Table 6 can prove the effectiveness to find out the CNN structure from the experiment results. In addition, through the analysis of the proposed method, Table 6 can further realize that Kernel size is the most important control factor both in accuracy and unit time, and also understand the influence priority of each control factor.
Conclusions
With the craze of deep learning and powerful tools such as TensorFlow, CNN’s applications are becoming more and more popular. However, the same CNN structure application may not be satisfactory on different issues, so a tuning process is needed to adjust the hyperparameters in the CNN structure to get the best results. Therefore, the contribution of this research is not to propose a new CNN structure but to propose a practical and effective method to improve the efficiency of CNN structure adjustment.
To meet the purpose, this study adopts a classical data set (MNIST) and the orthogonal array to reduce the experiment times. Five hyperparameters are used as the control factors with four levels, and accuracy and unit time are adopted as the performance evaluation indicators. Results show that the proposed method can determine the optimal structure in the feasible region with fewer experiments and improve the efficiency. Meanwhile, the proposed method can also efficiently determine the optimal structure within different performance indicators (or the comprehensive indicators). The degree of influence of different control factors on performance indicators, such as time, accuracy, or comprehensive indicators, can be further analyzed. The proposed method can provide a guidance for the adjustment of CNN structure and improve the efficiency of adaptation when applied to different problems in the future. The contribution of this study can be summarized as follows. To propose an efficient method to identify the optimal structure based on Taguchi method to assist users rapidly defining the CNN hyperparameters. To determine five CNN hyperparameters as the control factors and two performance criteria to build the orthogonal array. To develop a practical implement process to make the proposed method to be well applied in CNN problems.
Since this study proposes an effective adaptation method from the typical CNN structure, there are still limitations in its use. Therefore, this study proposes two future research directions to enhance the applicability of the method: (1) In terms of control factors, five hyperparameters are defined as control factors in this study according to the typical CNN structure. However, in some special cases or new CNN structures, other methods may be integrated to avoid the over-fitting. These methods will cause some hyperparameter changes. In future research, the hyperparameters of complex CNN structures, the properties of image data, and the pre-processing methods can be used as control factors or interference factors to further increase the applicability of the method; (2) In the aspect of the performance criteria, some other performance criteria, such as rate of loss convergence, interpretability, recall rate etc., may be also considered in some special purposes. Furthermore, the aggregation methods, such as grey relational analysis, TOPSIS, AHP etc., can be used to give a comprehensive value.