
Abstract
In today’s world, there have been lots of unique optical character recognition systems. One drawback of these systems is that they cannot work effectively on natural scene images where the text is not only subject to different orientations, lightning, and background but can be of multiple scripts as well. The paper, proposes a state of the art algorithm to detect texts of different dialects and orientations in an image. The whole text detection pipeline is divided into two parts. First, extraction of probable text regions in an image is performed based on a combination of statistical filters, which results in a high recall. These regions are then fed to an Artificial Neural Networks (ANN) based classifier which classifies whether the proposed regions are text or non-text, which increases the overall precision. The validity of the algorithm is verified on the most challenging bilingual text detection dataset MSRA-TD500 and a promising F1 score of 0.67 is reported.
Keywords
Introduction
Text or more formally written communication is one of the two ways of communication humans use. From the cave paintings which ages back to the era of Neanderthals to the sign posts available on streets now, humans have always relied on a written way of communication to pass on information. It is the only way with which our species have been recording its work and passing it generation by generation. The current scenario is that the text is not just restricted to being written on artifacts or wall paintings, but when one sees around one can observe that there is a piece of text written on almost all man-made objects whether it is a product description, advertisement or some information. Today there is a demand for systems which can robustly detect texts of all kinds in an image, which includes variation in not just lightning, style, size but also can cover different dialects. These systems will then be able to aid the process of searching by the content in an image or video in search engines or end to end text recognition and machine translation systems.
Text understanding problem in images and videos can be divided into the following sub problems: (i) detection, (ii) localization, (iii) tracking, (iv) extraction and enhancement, and (v) recognition (OCR) [1]. The paper concentrates mainly on text detection and localization in natural images. Although lots of work [2–4] has been done in the field of text detection, but text detection and localization in natural images is challenging because text can be of different fonts, colors, and orientations; subjected to uneven lighting conditions and distortions and finally natural images have a diverse range of objects and patterns which are similar to text [5].
Text detection and localization approaches can be grouped into (a) texture based classifier techniques [6–9]:- identify text regions by considering them as unique textures that are distinguishable from background; (b) connected component techniques [10–20]; exploit the text regularity by extracting features such as edges, strokes, color etc. (c) Sliding windows based techniques, [21–23] which use windows to locate text lines or regions and later employ machine learning for classification and (d) hybrid techniques [5, 24]. A detailed review of these techniques is presented in section (2).
Here a region based text proposal approach is proposed that combines the use of statistical filters to detect thetext proposal regions through background elimination and later employ translation and rotation invariant shape features (Zernike Moments) to classify the regions as text or non-text. The combination provides fewer text proposal regions per image which are very low compared to other approaches like [11, 14] which gives around 100–1000 regions per image. Further, unlike other methods which focus on text detection in the uni-lingual dataset, the proposed method is testedon a very challenging dataset released by [10] containing both English and Chinese text. The paper is organized as follows: Section 2 provides a detailed review of the text detection methods. The overview of the proposed algorithm is presented in section 3. The details of the experiments and the results are discussed in section 4. Finally, section 5 and 6 contains limitations and conclusion respectively.
Literature survey
Numerous research have been done in the area of text detection pertaining to real-world scenes in images and videos. Elaborate surveys can be found in [1–3]. Most of these works focus on the horizontal text. Since the inception of multi-oriented datasets like MSRA-TD500, the community has started paying attention to the real-life scenarios of text detection. A recent survey which explains about the different state of the art algorithms, challenges, and future directions can be found in [2]. Although most of the existing works use the ICDAR (’03 ’05 ’11 ’13) dataset, the proposedwork focuson MSRA-TD500dataset, since ICDAR datasets only contain horizontal English text lines.
The texture-based techniques consider the text as a unique texture which is different from the background [6–9] employ features based on texture properties like regional intensities, wavelet coefficients, and filter outputs to localize the text regions. These methods are computationally costly and are subject to rotational and scale variations. These techniques are limited to texts in a horizontal orientation and fail to work with vivid backgrounds and patterns like brick structure, glass or leaves behind the text because the texture properties of these are similar to text.
The component-based techniques [10–20] are generally a cascade of classifiers with increasing strength. The first level of weak classification is the extraction of probable regions of text by proposing candidates based on some sort of clustering or grouping. The second level of classification is to screen out the non-text candidates based on manually designed threshold-based rules or feature-based learning classifiers. These methods are invariant to rotation and scale change but have a drawback of generating a high number of false positives. Lately, these techniques have become the mainstream approach in text detection, but very few works have been done on texts of arbitrary orientations [10, 11].
Sliding window-based techniques, [21–23] use sliding template (window) of different scales for a coarse identification of the text lines followed by feature extraction. These techniques distinguish text and non-text based on local and global geometric properties of text followed by machine learning-based filtering as done by the authors in [21, 22]. Researchers in [23] slide the window across the whole image and do a variant of K- Means Clustering on input vector obtained after ZCA whitening. As these methods scan the whole image, the performance is good, but there is a tradeoff with speed as these approaches suffer from severe computation complexity. Recently to overcome the computational load of sliding window technique, [11–14] employ different approaches based on region proposals as done in object detection (RCNN, Fast RCNN, Faster RCNN, Mask RCNN) to generate probable proposals of text region rather than text lines. This approach has a computational advantage over sliding window since the whole is not required for analysis. Further in [11], the authors use concept of edge boxes with a region-based network and generate 100–1000 text proposals per image, which are then classified using a cascade of weak and strong classifiers and then sent for recognition, whereas [14] uses Faster Region based Convolution Neural Networks on detecting text regions in an image.
Hybrid techniques [5, 24] are those who employ the advantages of both texture-based and component-based techniques. These methods are computationally less expensive than texture-based techniques and generate less false positives (candidates) compared to component-based techniques. Similar to other algorithms these two algorithms can only detect horizontal text. This work employs a hybrid approach whereboth texture-based and component-based techniques are used to identify text regions and report a very promising F1 score.
Overview of the proposed algorithm
Two aspects motivate our algorithm: (a) based on the recent success of symmetry window techniques for text localization [21] where a symmetrical template is employed only to localize probable text lines, here the probable text regions are identified instead of the text line and classify them using ANNs. This will drastically reduce the computational load as symmetrical template window is not required to run across the whole image and (b) to increase the visibility and readability, the text is normally portrayed on distinguishable constant gray level regions [6]. Hence efficient detection and elimination of background regions would enable faster text detection. Our text detection pipeline can be divided into: Reduction of Area of Text Analysis Generation of probable text proposal regions Feature extraction and classification of probable text proposals
Reduction of area of text analysis
Text detection in natural scenes is a challenge since the images contain a wide variety of information. Hence grouping similar regions and removal of unneeded content would greatly reduce the area of text analysis. The approach is similar to the texture based technique discussed in [6, 22], but the novelty lies in the usage of statistical features instead of texture features in detecting the dissimilar regions and usage of shape features for accurately classifying the text and non-text regions. Here a combination of statistical filters is proposedto accentuate the dissimilar neighbors and determine the text proposal regions.
Entropy is a measure of randomness and variance is a measure of variability [25]. Since text regions exhibit certain regularity and are distinct from other objects, these statistical features can be employed to highlight the edges of the dissimilar regions. The intent is to calculate the entropy and variance of each pixel and employ a dynamically calculated threshold value to determine if the pixels belong to text or non-text proposal regions.
Here a sliding window technique is employed to compute the entropy and the variance of the centre pixel of an nxn window of the input image IOriginal. The window is moved along the horizontal and vertical directions with a fixed step size to obtain the entropy image IE and the variance image Iv using Equations (1 and 2). Here considering the computational efficiency, the window size and step length were fixed as 31×31 and 1 respectively.
where,
p(i,j) is the probability of occurrence of an intensity level in an image.
μ is the mean of the image.
From the outputs shown in Fig. 1(a) itcan be verified that the IE and Iv images can be employed to emphasize dissimilar neighbors by brightening edges pixels. Since text regions exhibit spatial symmetry and geometric regularity they have higher entropy and variance values when compared to homogeneous background regions [25]. Hence a simple threshold mechanism can be used to eliminate background pixels from the text pixels, but since statistical features vary for images, the threshold value cannot be preset. Therefore, based on the analysisit wasfound that pixels with entropy and variance above the median value can be considered as text candidates, but this approach would fail if the text is less distinguishable from the background or the background as it has a geometric pattern similar to text. To overcome the problem and to effectively identify the text proposal regions, a two-step process is adopted wherein atfirst the pixels that are above the median value of both IE and Iv images are determined and later the common pixels are foundamong the identified ones. Equations (3–5) explain the process mathematically and Fig. 1(a) illustrate the procedure of identifying the text proposal regions.
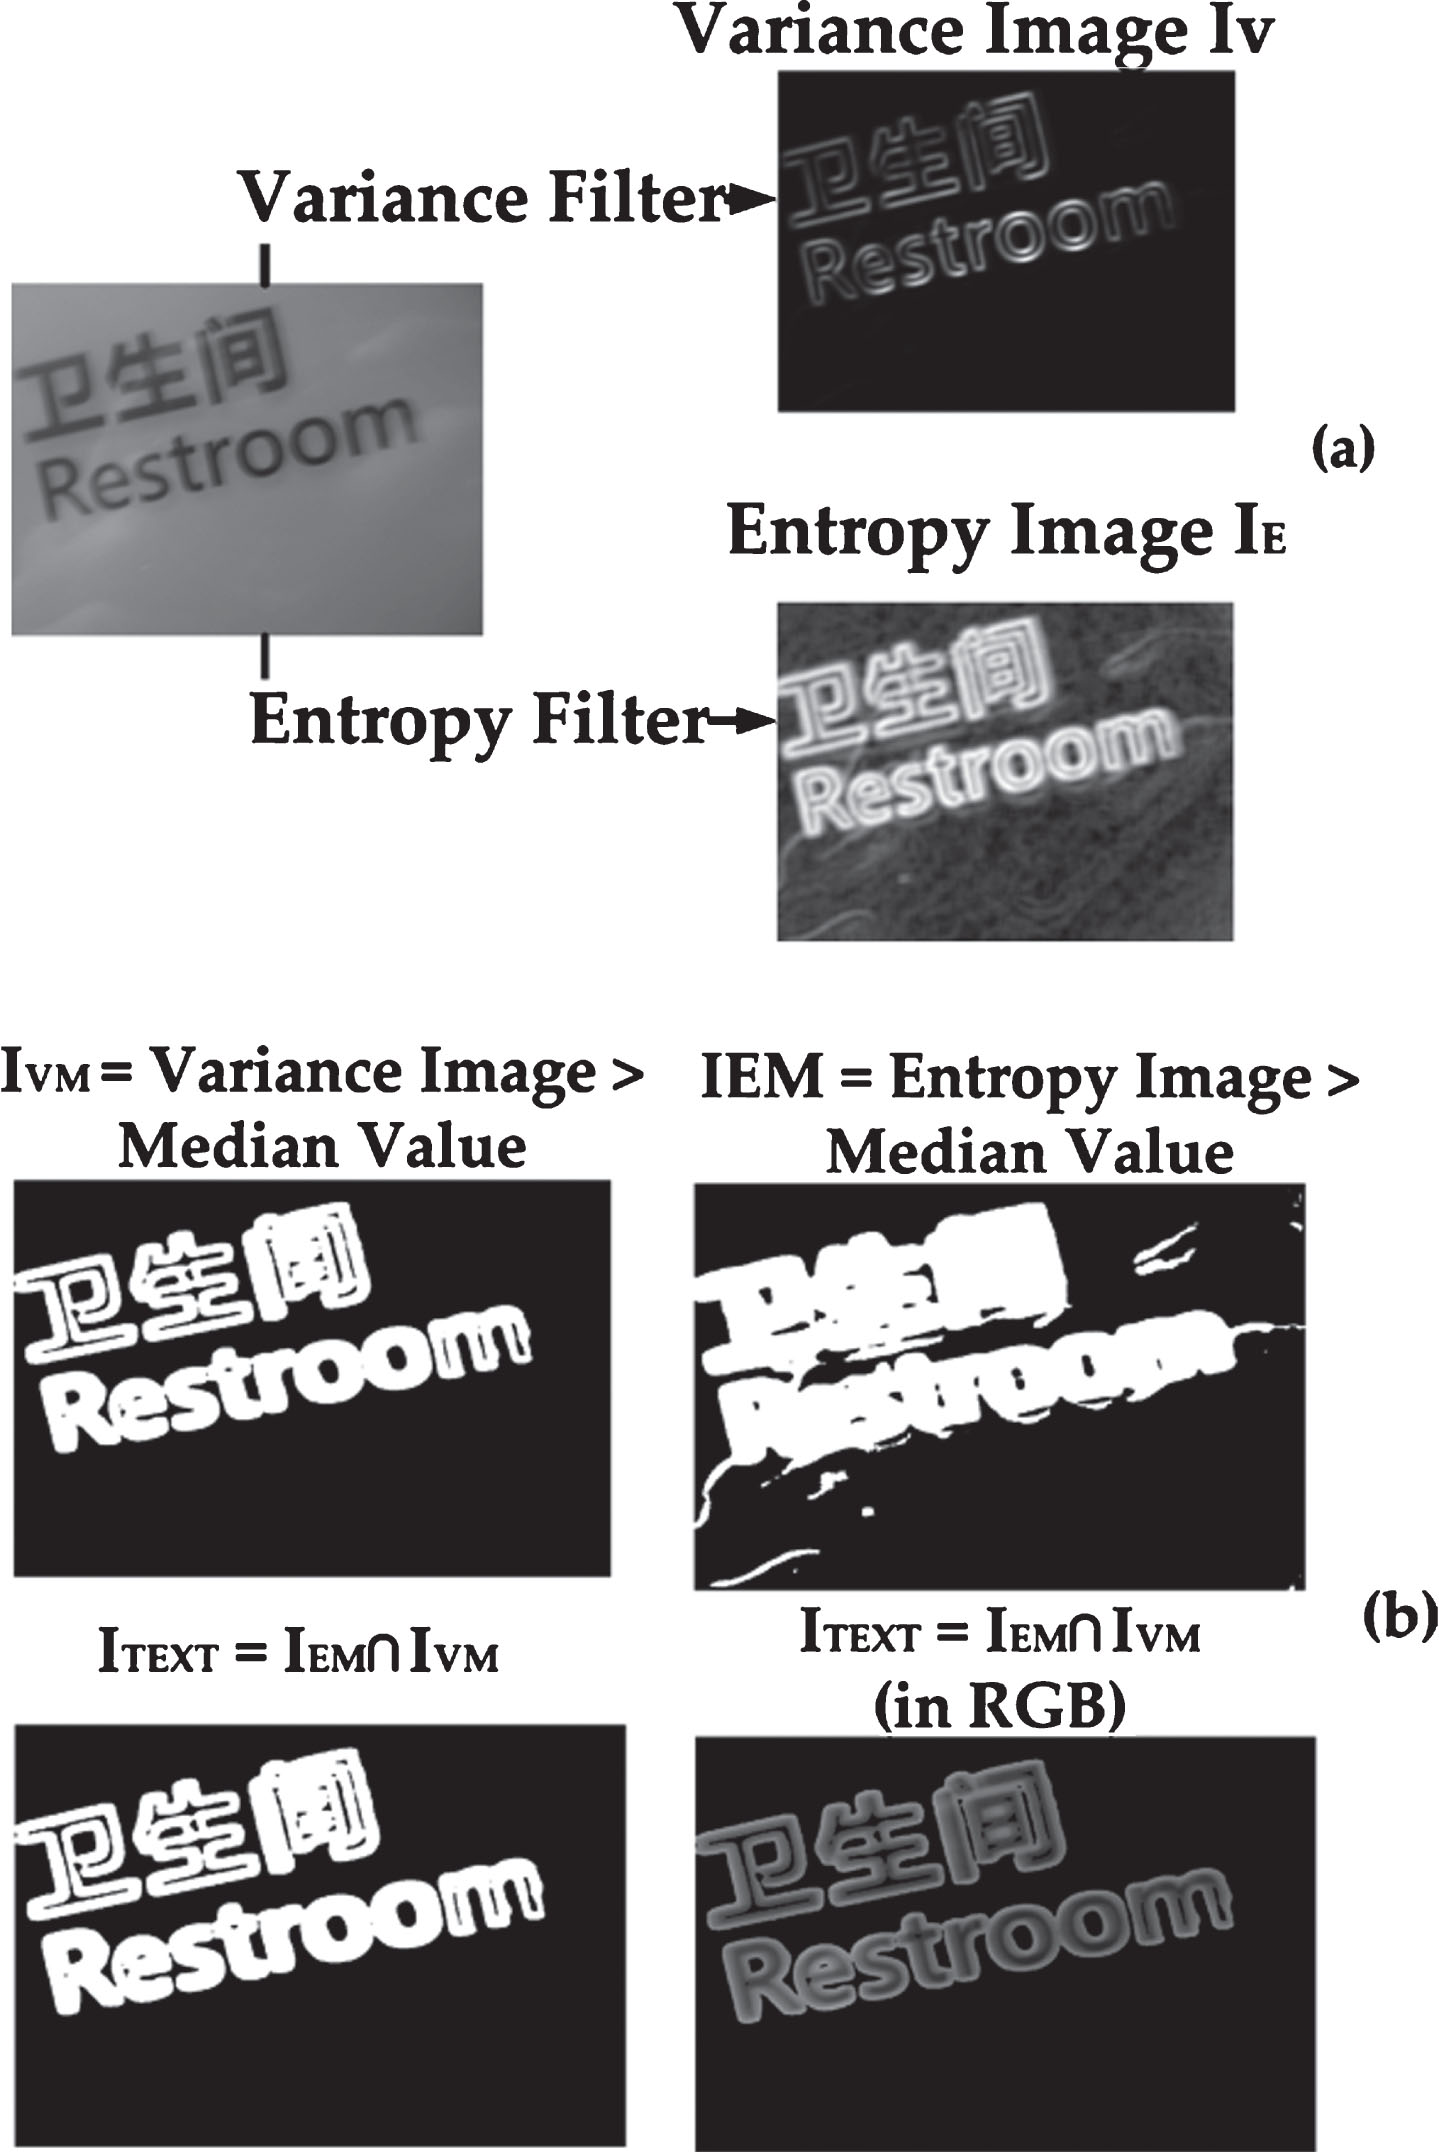
(a) Illustration of outputs of Entropy and Variance filters. (b) Illustration of extraction of common pixels based on Equations (3–5) with a sample image taken from MSRA-TD500 dataset.
Here IEM and IVM represent the images obtained by considering pixels that are greater than the median value of entropy and variance respectively and ITEXT represents the image containing the probable text regions obtained from common regions of IEM and IVM.
It can be seen from the Fig. 2(a) and (b) the procedure eliminates the background regions and highlights the probable text regions, thus reducing the area of text analysis significantly since only these regions will be considered for further analysis. The experimental analysis of this step on MSRA-TD500 data set presented a recall close to 0.96, and the quantitative analysis of the reduction in the search area is presented in section (4).

Text proposal obtained from the original image after background removal; (a) Text proposals generated through the combined use of statistical filers; (b) Sample Image from MSRA-TD500 data set.
The regions identified in ITEXT as probable text regions are extracted as individual sub-regions by considering an 8×8 connectivity. The use of statistical filters in locating the probable text regions reduces the text search area significantly, and on average 17 text proposals per image, are produced which are comparatively lower than a number of proposals generated in other approaches like [11, 14] which gives around 100–2000 regions per image. The features extracted from text proposal can be used to train a classifier to classify the regions as text as non-text, but it is observed in a few cases that the text proposals are of abnormal size since background also becomes a part of the extracted sub-regions as shown in Fig. 3. Extracting features from these abnormal sub-regions will directly result in poor classification. Hence to improve the accuracy, the abnormal sub-regions are fed to a stronger proposal generator algorithm which prune these abnormal regions into further sub-regions by accurately localizing the text regions.

Illustration of Pruning algorithm with a sample image from MSRA-TD500 data set.
The abnormal text regions are pruned based on the assumption that (a) characters within the text regions have closed contours [27] and (b) the characters within the text regions have similar slopes due to their regularity and geometric symmetry [6].
The sub-regions that are greater than 60% of the original image (in terms of area) are considered as abnormal and are fed to this stronger proposal generator algorithm. Since the characters within the text regions have closed contours, herethe algorithm explained in [27] is employed to identify the regions which have closed contours (edges). Later the corners of these text proposal regions are found by the technique given in [28] and determine the slope between the successive corner points in different orientations. Later the corners points with similar slope are identified and connected. Post this a cascade of a sliding window of sizes 128×128 to 256×256 with an increment of 32 pixels,is used to detect the regions that provide a higher density of lines with a similar slope. Here it is believed that the text line has the same slope throughout. These regions are the new text proposals which are extracted out of previously generated abnormal text regions from (5). The pruning algorithms serve two purposes (a) localizes the text regions within the abnormal text regions and (b) further sub-divides the abnormal text regions them into smaller sub-regions. The whole process can be visualized in Fig. 3.
Feature extraction using Zernike Moments
The text proposal regions, obtained through the combination of statistical filters contain text, and non-text information isefficiently described using image descriptors for successful classification. A good choice of features enables the proposed system to provide better accuracy. Since text regions exhibit spatial symmetry and geometric regularity, shape characteristics [26] can be employed to differentiate between text and non-text regions. The requirements of a good shape descriptor are (a) invariance to change in rotation, scale and translation, (b) provide features with low redundancy and large discrimination ability and (c) present hierarchical representation, i.e., furnish coarse (global) to finer (local) details. Literature suggests that moment-based descriptors satisfy the above requirements. Zernike moments (ZM) [29] due to their orthogonality, have lowest feature redundancy, and also it is observed that their hierarchical nature allows the lower order moments provide global information, and higher-order moments provide local information respectively [30, 31]. Further, it is computationally less expensive to compute the higher order moments. Therefore, the shape features are extracted using Zernike descriptors and the classifier is trainedto classify the sub-regions as text and non-text.
Let S (x, y) be the sub-regions extracted from ITEXT.
ITEXT = {S1 (x, y) , S2 (x, y) , …… S n (x, y)} where n be the number of sub-regions per image.
To compute ZM, each sub-block S (x, y) is re-scaled to N×N dimension and projected on to set of complex Zernike polynomials as given in Equation (6)
where x2 + y2 ≤ 1
where
Vnm (x, y) is the Zernike Polynomial
n is the order of the polynomial,
m is the repetition factor such that |m| ≤ n and n - |m| is even,
ρ is the length of the vector from the origin to the pixel located at spatial location (x,y) and is given by
θ is the angle of the vector from the origin to the pixel located at spatial location (x,y) from the x-axis in counter clockwise direction and,
Rnm (ρ) is the radial polynomial defined as,
The ZM obtained from the above equation is a complex quantity given by,
Here |An,m| represent shape descriptor obtained from Zernike moments for the order n and repetition factor m. To obtain the complete shape information a feature vector is formedby concatenating the moments obtained by varying n and m. For the proposed work, 72 different ZM are computed for each S (x, y) by varying n from 0 to 15 and concatenate them to form a feature vector (FV) as shown in Equation (10). The FV is later used for training the classifier.
The feature vectors so obtained have strong class discrimination ability and hence can differentiate the text and non-text sub-regions effectively. The FV obtained for text images, and non-text images are visualized in Fig. 4(a) and (b).
From the figures, it can be noticed that the ZM magnitudes for both text (red) and non-text (black) regions have negligible likeliness between them. This motivates the classifier for easier distinction between the text and non-text regions. Further, from Fig. 4(c), it can be observed that there are eight prominent peaks (for both text and non-text regions) at positions 1, 3, 7, 13, 21, 31, 43 and 57 on the x-axis. These peaks correspond to the magnitudes of Zernike moments: |A00|, |A20|, |A40|, |A60|, |A80|, |A10,0|, |A12,0| and |A14,0| respectively that are significant and hold larger descriptive information. The significant features in the feature space for Fig. 4(a) and (b) are depicted in Fig. 4(c).
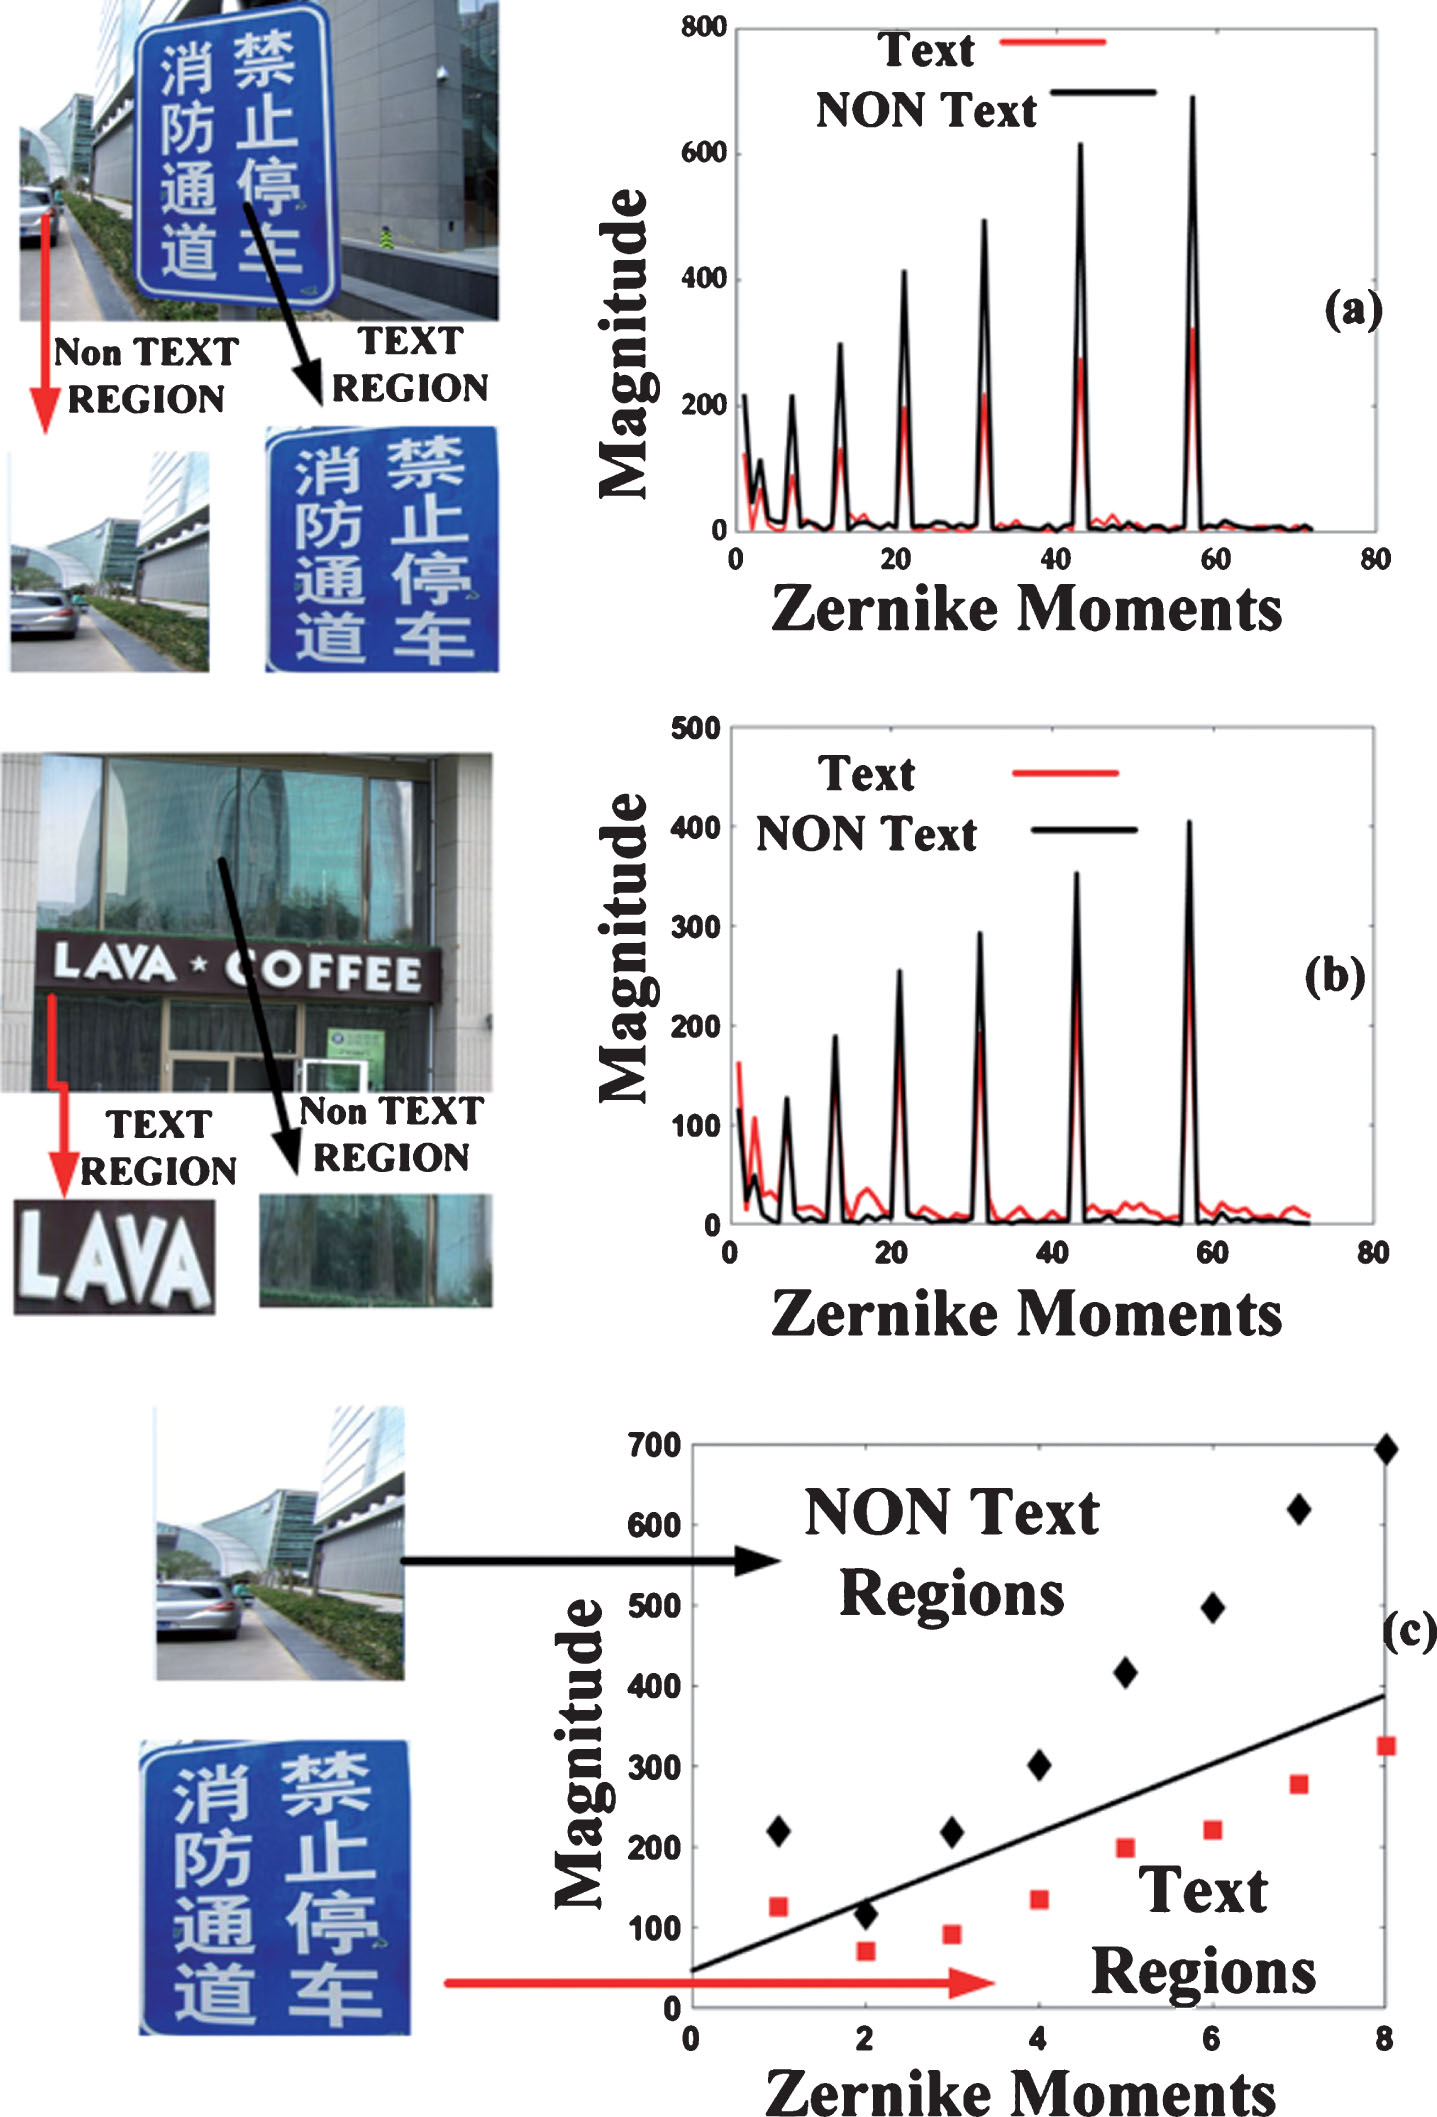
(a) and (b) Illustration of Zernike magnitudes between Text (Red) and Non-text region (Black); (c) Feature space showing the significant Zernike features (Red) for Text and Non-Text regions (Black).
The features extracted from all the text and non-text sub-regions form the input that is fed to the artificial neural network (ANN) for classification. The proposed method was evaluated considering the MSRA-TD500 dataset with 500 images of which 300 are training images and 200 test images. The evaluation comprises of training and testing process. ANN classifier is deployed here that is capable of learning by example and process the information in parallel. ANN has layered architecture that includes: the input, hidden layers, and output layer. Each layer has neurons with its associated activation function that process the data presented to it. The ANN maps various inputs to output by finding a non-linear relationship between them. The mapping is governed by the adjustable parameters of the network (weights and biases). These parameters are adjusted during the training process by providing the training dataset to the network. The training devises an optimal learned model that is saved and assessed in the testing process.
For all the training images, text and non-text sub regions were identified and extracted from the 300 training images. For each region of text and non-text ZM feature vector is extracted with feature vector size of [72, M] where M is the number of samples in the dataset. These feature vectors are labeled with two classes C1 and C2 that represents text and non-text respectively. With this, a complete training set is achieved as shown
where
Tr= [Zernike feature vectors for all text and non-text sub regions of training images] and, y = [C1, C2].
This training datais fed to a simple 3-layer ANN as displayed in Fig. 5. The network’s input is a feature vector of length 72. The network has two hidden layers of 36 and 18 nodes respectively and an output layer with 1 node. The number of learnable parameters is 2628 (72×36 + 36) in the1st layer, 666 (36×18 + 18) in the 2nd layer and 19 (18×1 + 1) in the final layer. Thus a total number of 3313 learnable parameters or weights of the network are to be modified during training process. The network now takes in Xr as the input for learning. The hidden layers find non-linear patterns in the data and pass them to the output layer, which predicts the probability with which a particular input belongs to a class, in this case (C1 is text and C2 is non-text).

The neural network structure.
Neurons of each layer use sigmoid non-linearity which can be defined as,
where
y i is the network output of the network and,
t i is the desired output from the network.
MSE is used as the loss function since when used with sigmoid activation function in a shallow network(as incorporated in the proposed work), gives similar or better results when compared with cross-entropy loss function [34]. Also, it has been observed in many works that cross entropy loss function works better with softmax as an activation function when compared with sigmoid,thus acombination of MSE and sigmoid for a shallow network gives optimum results. Further, with a better initialization, MSE outperformscategorical cross-entropy based networks in terms of less error achieved [33, 34]. The training process is presentedin Fig. 6. From the plot, it can be observed that training is stopped at 3665th epoch when a minimum error of 0.001 is achieved. The network required 04 hours and 15 minutes of training time. The network was trained on a NVIDIA Quadro P4000 GPU.
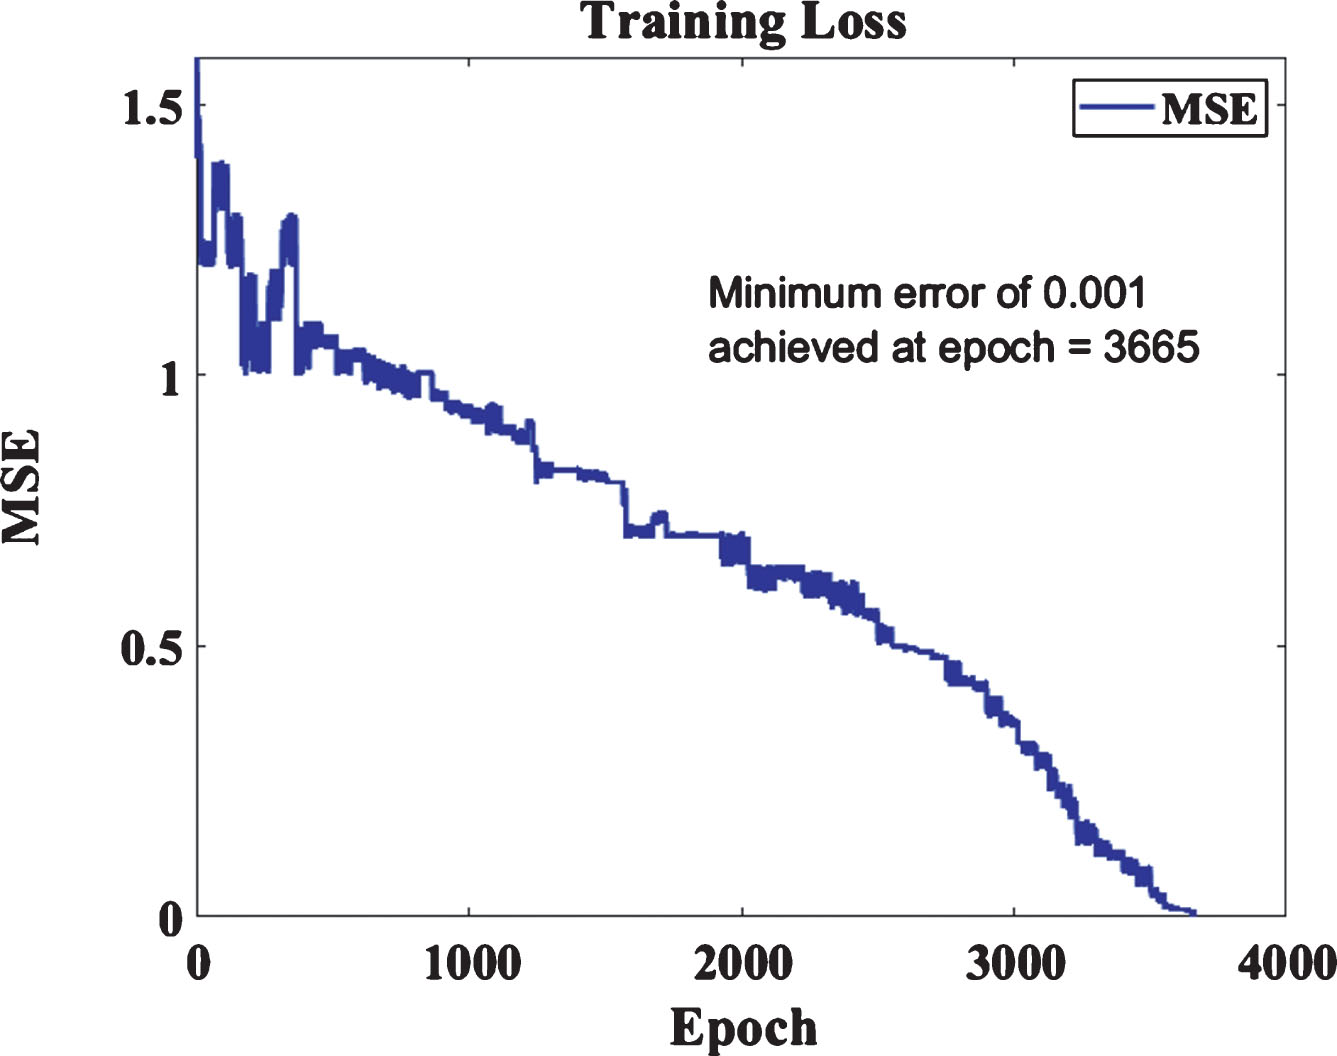
Graph depicting training loss per epoch.
As mentioned earlier that MSRA-TD500 has a set of 300 train and 200 test images. In thisapproach training set widens up and all the proposals generated from those 300 images become the training setwith 5133 proposals.The features of these proposals are extracted and train the ANN. A group of volunteers labeled the whole training dataset.
The training process is followed by testing, where, the proposals generated from 200 test images becomes the test dataset. During testing the learned ANN model is evaluated for its accuracy by providing the test set Xt = [Tt] obtained from 200 testing images (3592 proposals) to it.Finally, for the regions that are classified as text (C1), a bounding box was plotted around those regions on the actual image, and that becomes the final output of thealgorithm. The flowchart which explains the entire flow ofthe algorithm is shown in Fig. 7. Further the performance of the model is assessed using the confusion matrix or contingency table.

The flow diagram of the proposed algorithm.
The functionality of the proposed algorithm was testedon one of the most challenging text detection dataset proposed by a team of researchers from Microsoft Research Asia [10]. This dataset is referred to as MSRA-TD500 an openly released public dataset that contains 500 natural scene images covering more than one dialect, English and Chinese for text detection. These images were carefully split by the creators themselves in the ratio of 60:40 for training and testing. Thus the dataset has300 train and 200 test images. Not only the dataset is known for its toughness and variety but also it serves as a benchmarking dataset for all new algorithms.
To illustrate the efficacy of our algorithm, three different experiments were performed; (1) Reduction in Area of Text Analysis; (2) Computation of performance metrics of the ANN classifier and, Precision, Recall, and F1 score of the proposed algorithm and (3) Comparison of the proposed algorithm with other text detection techniques.
Reduction in area of text analysis
The combined use of statistical filters followed by the two-step threshold detection procedure explained in section (3.1) eliminates the homogeneous background regions and improves the computation efficiency by reducing the search area of text regions. The resultant ITEXT corresponds to the image containing the probable text as shown in Fig. 1. Accordingly, after the filtering process, it can be noted from the figure that the background is eliminated to highlight the probable text regions thus reducing the Area of Text Analysis. The total reduction in the area is quantified through Equation (14)
Here N represents the total number of images considered. For MSRA-TD500 dataset where N = 500, the reduction achieved through the combined use of statistical filters was 72.85%.
On average, the algorithm was able to locate 17 sub-regions regions per image, and later these regions were resized to 256×256 and then fed into the Zernike feature based neural network for training and classification. The training set had 300 images which generated 4493 sub regions, out of which 4102 sub regions were normal, and 391 were of abnormal size and therefore required to be pruned as per the procedure explained in section (3.2). The pruning algorithm further generated 1031 probable regions of text from those abnormally sized probable text regions. Thus, the training set generated 5133 regions that included 3977 non-text regions and 1156 text regions which were manually labeled as C1 (text) and C2 (non-text) respectively. The position of the sub-region is extracted and stored separately and is later used to plot the bounding box if the sub region is classified as positive. Also, coordinates of the sub-blocks (x, y, width, and height) with respect to the original image are extracted for future reference. Two different performance measures have been presented (a) Classifier Accuracy and (b) Evaluation with respect to the ground truth.
Classifier Accuracy
For each sub-block, a 72-dimensional Zernike based shape feature vector was computed which were then labeled and later used to train the ANN. The ANN was trained with 5000 epoch limits with a learning rate of 0.001. During training, the trainable parameters of the network are modified to produce the optimal model. A confusion matrix [35] is framed from the result of the training process to compute the training accuracy of the model which is displayed in Table 1.
Confusion matrix from training ANN
Confusion matrix from training ANN
From the matrix, the training accuracy is computed using,
which was found to be 98.81%.
Here, True Positive (TP): Region of text detected as text,
False Positive (FP): Region of non-text detected as text,
False Negative (FN): Region of text detected as non-text,
True Negative (TN): Region of non-text detected as non-text,
To illustrate how good, the proposed method localizes the text within a scene image, thetext localization outputs are compared with the ground truth results. Accordingly, a bounding box is plotted around all the positive classifications (TP and FP) and then it is compared with ground truth. To have a realistic comparison with other text detection techniques,an evaluation procedure detailed in [10] was followedto compute the final F1 score:
Positive Predictions (TP):-
If the prediction of the model overlaps with 50% of the pre-defined ground truth and the angle between them is less than π/8, then they are treated as valid. This protocol used by [10] allows us to have a fair comparison
Maximal suppression is adopted, i.e., if the proposed method predicts two bounding boxes, and if the bigger box contains a smaller box covering the text region then the bigger box is suppressed (refer. Fig. 8)

Illustration of Maximal suppression with a sample image taken from MSRA-TD500 dataset.
Based on the assumptions made, the bounding boxes are plotted around the positive classifications of both training and testing sets. From Tables 1 and 2 it is seen that the training process with 300 images (5133 sub-images) produced positive classifications of 1215 whereas the testing with 200 images (3592 sub-images) produced 758 positive classifications respectively. These bounding box predictions were then compared with ground truth label, and the performance measures such as Precision, Recall, and F1 score [35] are calculated based on Equations (16–18), and results are summarized in Table 3. Further, text detected on few sample images from the dataset are shown in Fig. 9.
Confusion matrix from testing ANN
Performance Evaluation with respect to the ground truth text bounding box
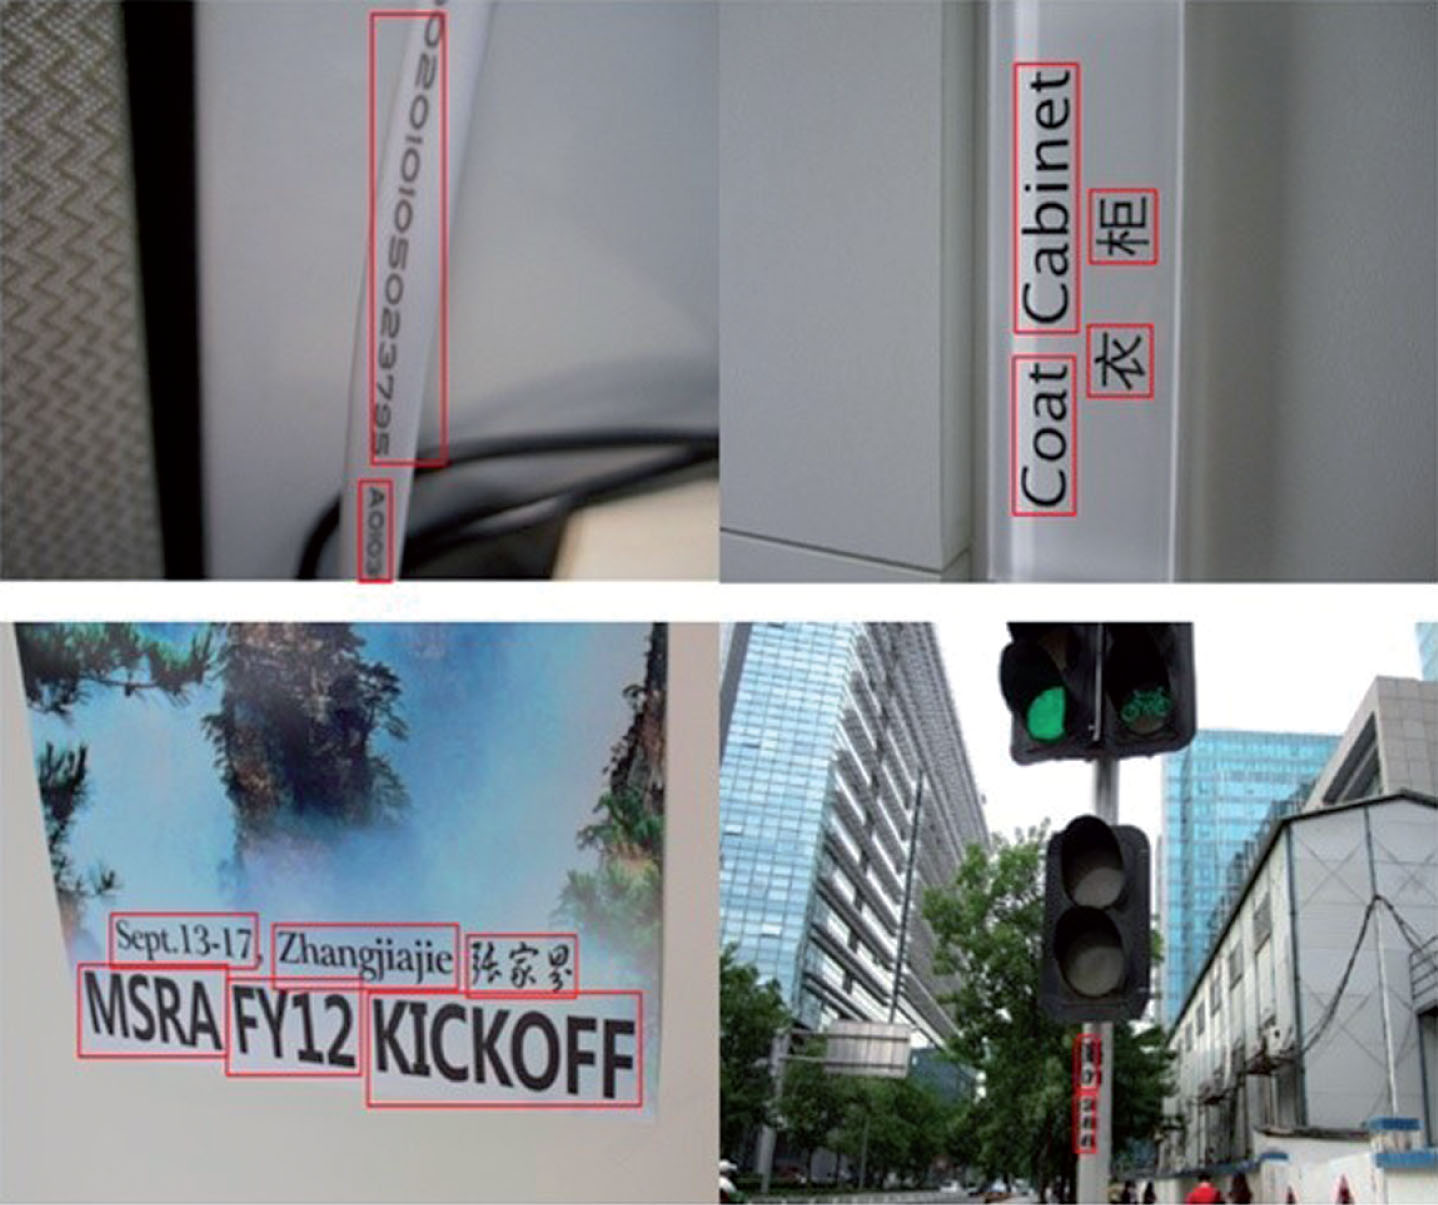
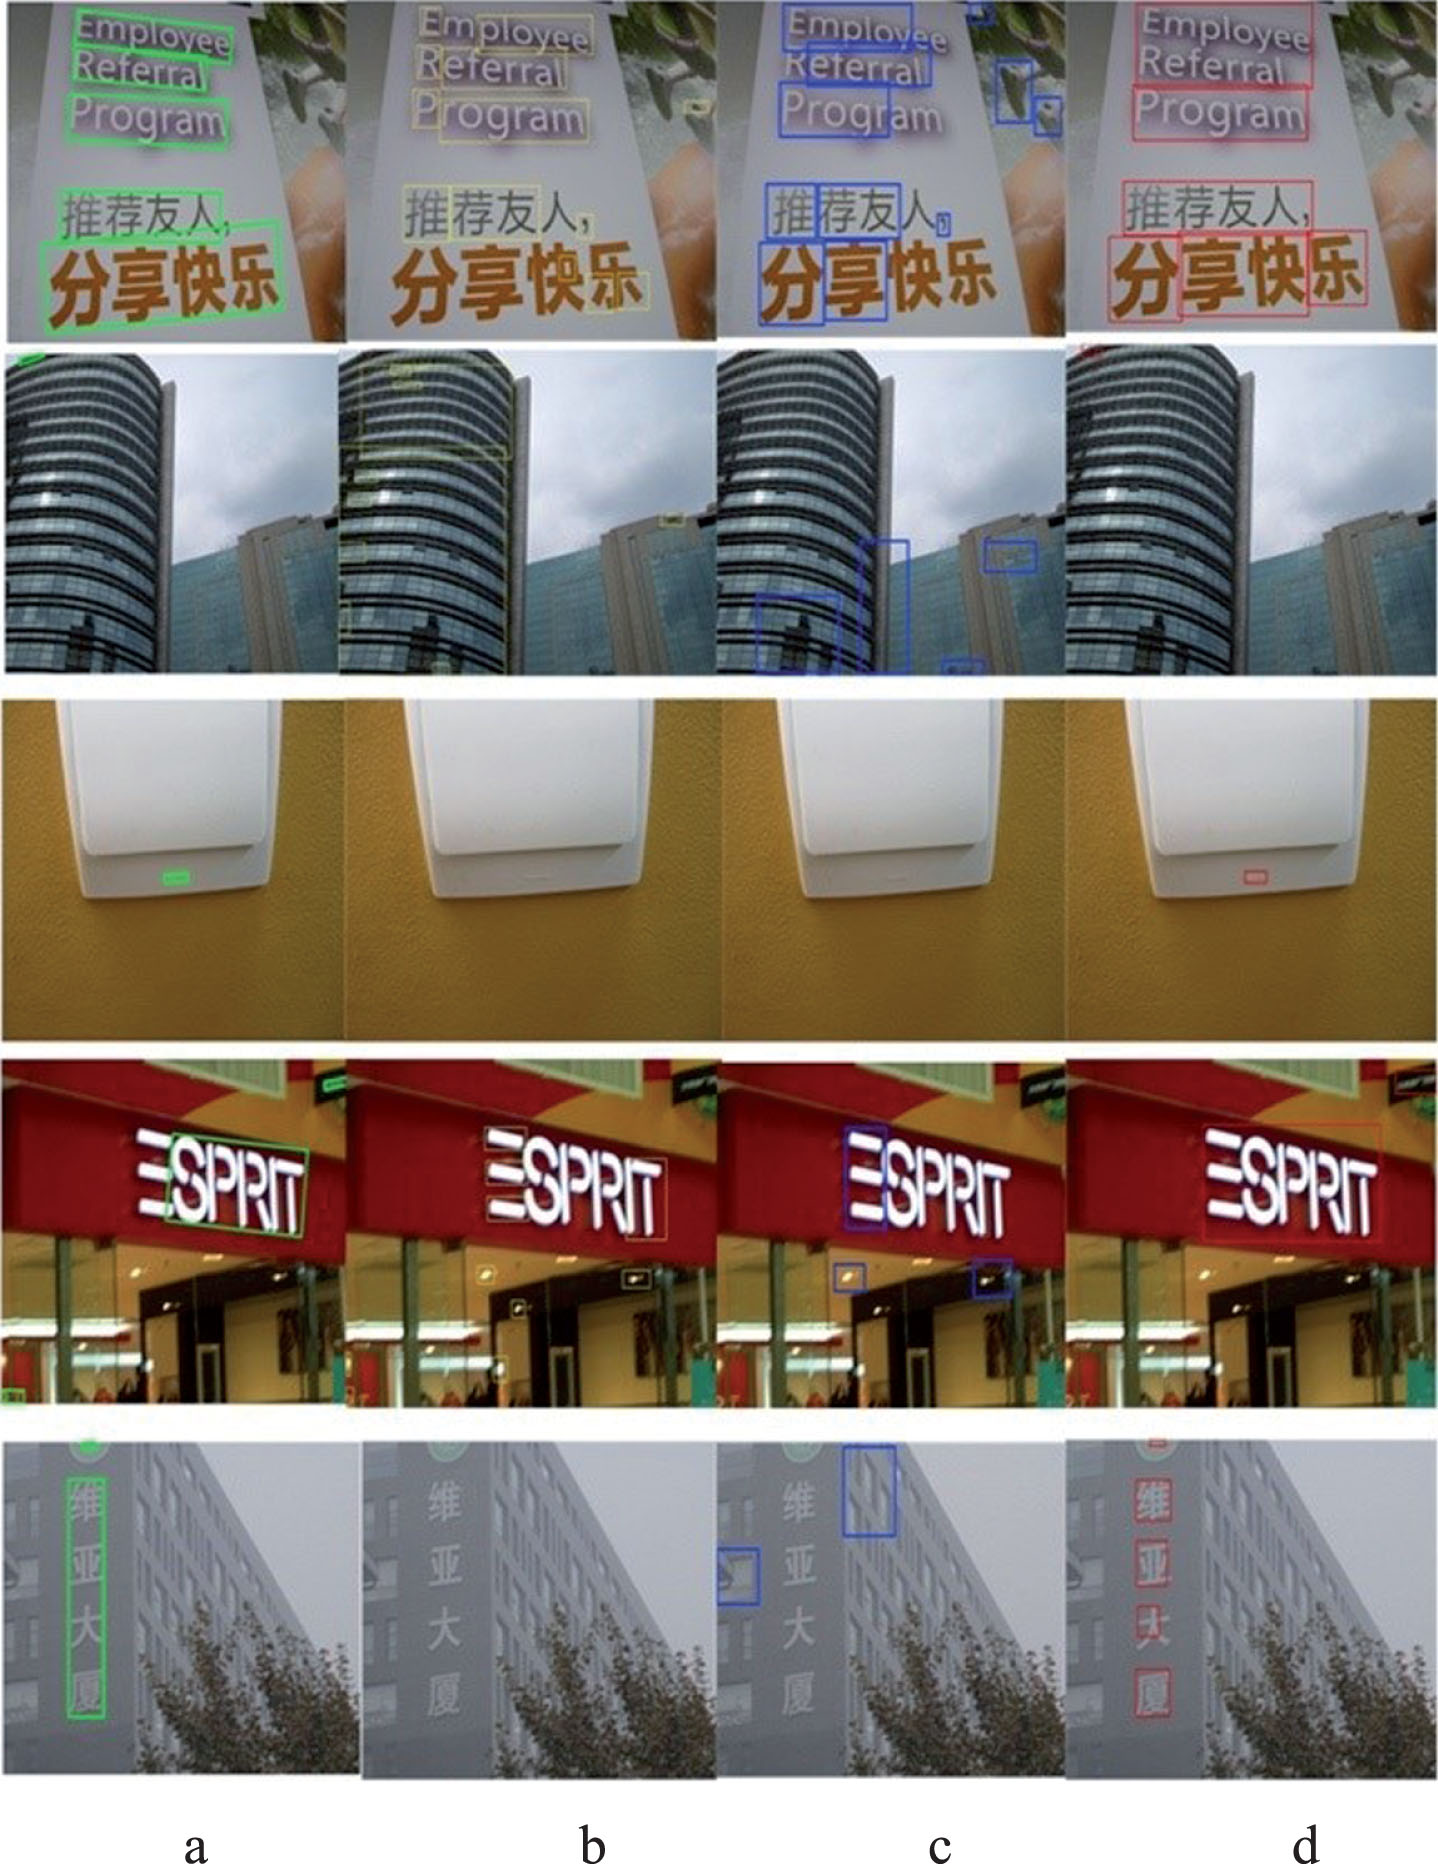
Text detected on sample images from the MSRA-TD500 dataset using the proposed algorithm.
The performance of the proposed method is compared with the [7, 36–38], and their F1 scores are reported in Table 4. The techniques illustrated in Table 4 with * were collectively obtained from [10], the authors have reported having tested these techniques on MSRA-TD500 dataset, and the technique with ** was re-evaluated by us on the dataset.
Performance evaluation with other text detection techniques
Performance evaluation with other text detection techniques
These results logically compare the performance of the proposed algorithm with that of the state-the-of-art algorithms. These performances have been directly referred from the high-quality research articles. With a high F1 score of 0.67, the proposed method provides a better classification of text and non-text regions when compared to other algorithms tested on the same bilingual dataset.
From Table 4, it can be inferred that the proposed method has a better Precision and F1 score compared to other state-of-art techniques. This illustrates that the proposed method can be effectively employed to detect text regions in natural scenes which have diverse objects in different orientations, brightness, and texture. To further show the efficacy of the proposed method, images comparing the proposed algorithm’s performance with [36, 37] are presented in Fig. (10)
The proposed algorithm gives very promising results on a very challenging dataset and effectively localizes texts of different dialects at arbitrary orientations within natural images. Still, the performance is far from perfect and the algorithm is observed to failrepetitively on two cases. 1)When the text is on the reflective surface as observed in Fig. 11(a) and 11(b). 2) When the text has less contrast with respect to the background and background has a strong recurring pattern similar to the text as shown in Fig. 11(c) and 11(d). The failures areattributed to thepoor accuracy in locating the text proposal regions using the statistical filters rather than the classifier.
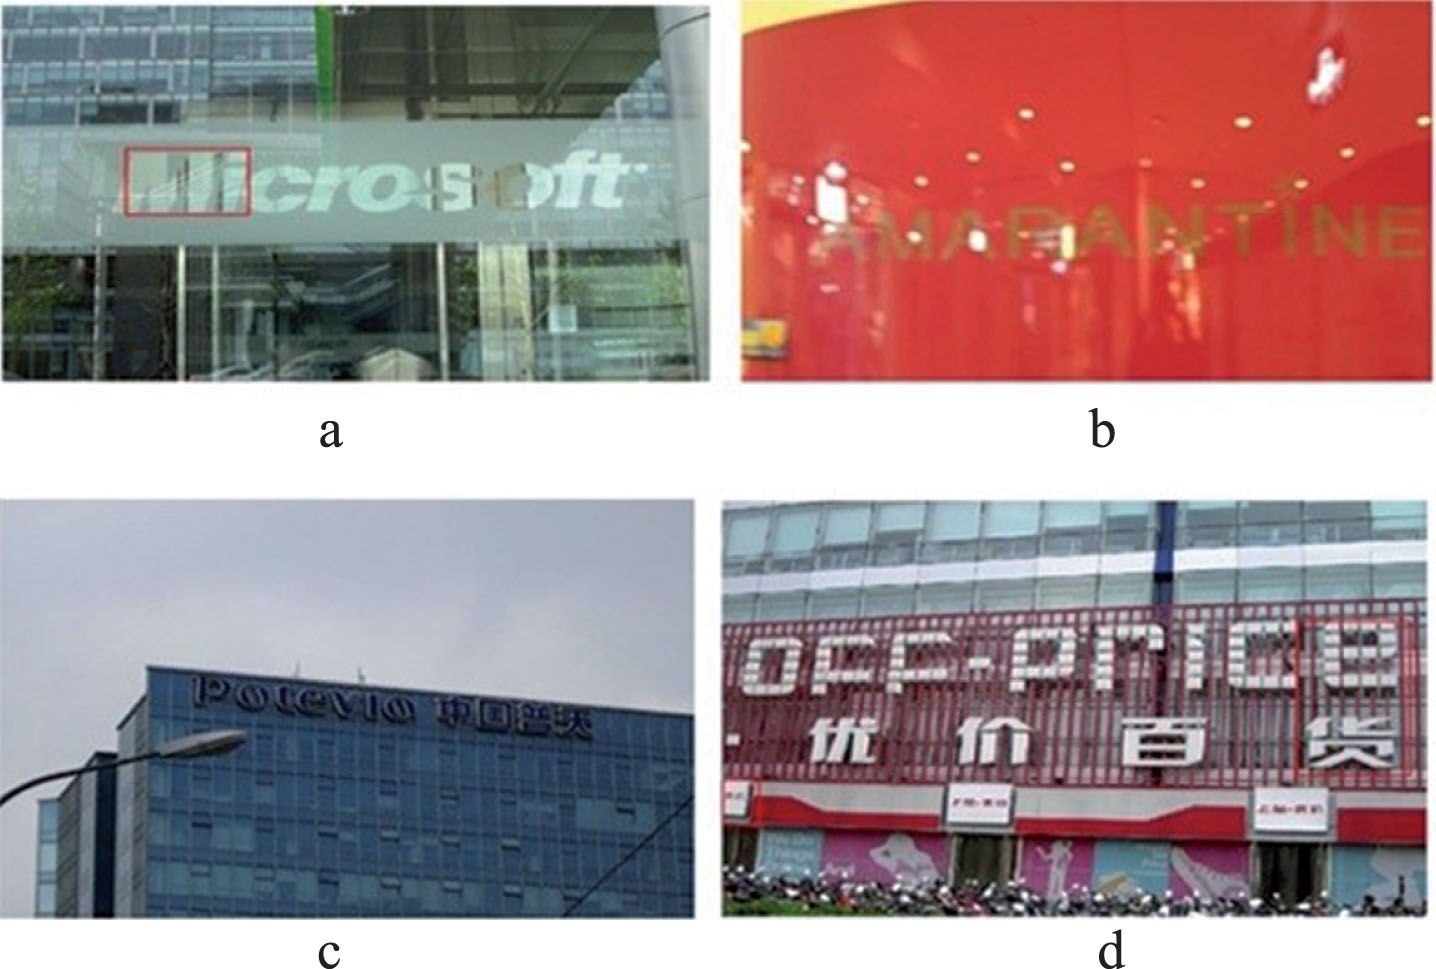
Failure of text detection (a) and (b) on a reflective surface; (c) and (d) on a recurring pattern with sample images from from MSRA-TD500 dataset.
The work presents a unique state of the art pipeline for text detection in natural images. After scrutinizing theperformance on test images, it can be stated that the hybrid approach is better than existing techniques regarding performance and speed due to the following reasons. 1) Very high recall (0.96) of the output of Equation (5) ensures that texts of different dialects are captured. The interplay of variance and entropy filters makes sure that vivid texts are captured. There are very few False Negatives (Text Detected as Non-Text) when the performance on Eq. (5) was evaluated. 2) The novel method employs rotational and translational invariant moments as an input feature vector to the classifier ensures that the algorithm detects texts of all orientation. The next tasks to be carried can be categorized as follows 1) to improve the performance of the algorithm by keeping the limitations, mentioned in Section 5, in mind; and (2) once detection is perfected the problem of text recognition of the detected text will be approached.
Footnotes
Acknowledgments
The project is supported by the Research Start-up Fund Subsidized Project of Shantou University, ChinaGrant No: NTF17016. The National Science Foundation of China, Grant. No: 61471228 and the Key Project of Guangdong Province Science and Technology Plan, Grant. No: 2015B020233018.