
Abstract
The stability of a colluvial slope, which is different from a rock or soil slope, is determined by the properties of both the bedrock and the colluvium. Coupled with artificial excavation and environmental effects, the stability factors of such slopes are complicated. To rapidly and effectively evaluate the risk of a colluvial cutting slope, a risk evaluation system for this type of slope is established herein. First, an evaluation index system is established, and reasonable risk evaluation indices are selected. Second, the fuzzy analytic hierarchy process (FAHP) is applied, a fuzzy pairwise comparison matrix, that must satisfy a consistency test, is constructed, and the weight of each index is determined. Third, the risk evaluation grades are divided into 4 risk grades, and the risk evaluation criteria for each basic index are determined. Finally, the three-level fuzzy comprehensive evaluation (FCE) method is applied, the membership function for each index is constructed, the membership degree is calculated, and the risk grade of the colluvial cutting slope is determined. This risk evaluation system is used to evaluate the risks of 148 colluvial cutting slopes along the Xiaomengyang-Mohan highway in Yunnan, China. The results show that there are 24 slopes of low risk (grade I), 85 of medium risk (grade II), 22 of high risk (grade III), and 17 of very high risk (grade IV). The evaluation results obtained are in good agreement with the actual slope instability states: failure occurred in 15 out of 85 slopes of risk grade II, 13 out of 22 slopes of risk grade III, and 16 out of 17 slopes of risk grade IV. This application demonstrates that the proposed risk evaluation system for colluvial cutting slopes is universal, and stable and that the calculation results are objective.
Keywords
Introduction
Colluvial slopes are widely distributed around the world, for example, in Southwest China [1], the Western United States [2], southwestern Europe [3], Southeast Brazil [4], and northern Chile [5]. Colluvial slopes are usually formed through a strong downcutting period, followed by the long-term gravity-driven processes, rainfall or earthquake activity [6]. The stability of a colluvial slope, which is different from a rock slope (Fig. 1(a)) or soil slope (Fig. 1(b)), is determined by the properties of both the bedrock and the colluvium. The geological evolution of a colluvial slope is illustrated in Fig. 1(c).

Different types of slopes and the formation process of a colluvial cutting slope (a) rock slope; (b) soil slope; (c) the geological evolution of a colluvial slope; (d) colluvial cutting slope.
With the acceleration of urbanization and economic development, the number of civil engineering endeavors in mountainous areas, throughout which many colluvial slopes are present, is increasing; one example is the implementation of the Belt and Road Initiative in Southwest China, where highways are being constructed in mountainous areas with a gradually increasing frequency. Southwest China, which is situated around the Tibetan Plateau and the Yunnan-Guizhou Plateau, experienced a strong downcutting period in the Quaternary, resulting in severe deformation, the destruction of existing slopes and the formation of a large number of thick colluvial slopes [1]. Coupled with artificial excavation and environmental effects, the stability factors of colluvial slopes are complicated [7]. Therefore, to provide guidance for supporting measures and for the construction management of colluvial cutting slopes, thereby ensuring the safety of engineering constructions on colluvial cutting slopes, it is highly necessary to evaluate the risk of a colluvial cutting slope (Fig. 1(d)).
To date, many studies have been conducted to evaluate the risk and analyze the stability of colluvial slopes. Ohlmacher [8] used multiple logistic regression and geographic information system (GIS) technology to predict the landslide hazard of colluvial slopes in Northeast Kansas, USA. Meisina [9] adopted the stability index mapping (SINMAP) and shallow landsliding stability (SHALSTAB) models to analyze the stability of colluvial slopes in an area of the Oltrepo Pavese, Northern Apennines. Xiang [10] conducted geological surveys and employed an optimization method to search for the critical slip surface of a colluvial slope on the bank of the Three Gorges Reservoir. Zhou [11] analyzed the stability of a colluvial slope at the dam site of the Gushui hydropower station under an engineering disturbance. Choobbasti [12] developed artificial neural network (ANN) systems consisting of multilayer perceptron networks to predict the stability of a colluvial slope at a specified location. He [13] established the dynamic displacement destabilized criterion using damage mechanics and applied it to the typical rainfall-induced landslide that occurs on colluvial slopes in the Three Gorges Reservoir area. Matassoni [14] studied the seismic influence on colluvial slopes by measuring microtremors and installing a field mobile seismic station. Liang [15] combined electrical resistivity tomography (ERT) and terrestrial laser scanning (TLS) with traditional monitoring methods to monitor changes in water content and the deformation of the colluvial slope landslide in the Goulingping valley in the middle of the Bailong River catchment in Gansu Province, China.
In summary, most of the abovementioned studies were performed on individual slopes in particular areas relying on the acquisition of detailed parameters of rock and soil mechanics and measuring structural characteristics through monitoring or experimentation, as this information is also widely used for other kinds of slopes [16, 17]. In contrast, little research has been conducted on rapidly and effectively evaluating the risks for many colluvial slopes, such as colluvial cutting slopes along highways, due to the absence of detailed parameters. Numerous mechanical tests and engineering investigations have shown that colluvial slopes are not specifically defined and that their stability boundaries are not very clear and rather fuzzy; consequently, it is difficult to measure such slopes uniformly with classic mathematical models. Alternatively, considering the relevant factors of the evaluated objects and their attributes, comprehensive evaluation methods, such as the fuzzy evaluation method, gray correlation analysis, and reliability analysis, are suitable for analyzing the stability of slopes subjected to multivariate and multifactor influences and are thus widely used for the risk evaluations of rock and soil slopes [18–23]. Nevertheless, no comprehensive evaluation method has been proposed for colluvial slopes.
The fuzzy evaluation method, while mature, is a still developing method based on fuzzy set theory [24] introduced to address uncertainties caused by imprecision or fuzziness. Many scholars have devoted themselves to studying fuzzy theory methods or algorithms [25–31], and others have investigated the applications of fuzzy theory [32–36]. In this paper, the fuzzy analytic hierarchy process (FAHP) and fuzzy comprehensive evaluation (FCE) methods are adopted. The analytic hierarchy process (AHP), which is a multilevel weight analysis and decision-making approach with high logic and practicability, was initially proposed by Saaty [37]. However, the AHP technique is greatly influenced by the subjectivity of human judgment; consequently, the FAHP, which combines the advantages of fuzzy methods with the AHP [38], was developed to consider the fuzziness of human judgment and to make the weight of the determined index more reasonable [39]. The FCE technique is a comprehensive decision-making method for solving complex multivariate problems [40], that can reasonably quantify the fuzzy index in the evaluation system [41]. These two methods have been applied for evaluation problems in several disciplines, such as petrochemistry [42], mining [43], education [44], transportation [45], aeroacoustics [46], electronic engineering [47], and medical science [48], accordingly, objective and effective evaluation results have been obtained in these practical applications. Therefore, the FAHP and FCE methods are selected herein to establish a risk evaluation system of colluvial cutting slopes.
The remainder of this paper is organized as follows. In Section 2, the concepts of fuzzy systems are presented, and the FAHP is introduced. In Section 3, the FCE technique is introduced. In Section 4, the risk evaluation system for colluvial cutting slopes is established. Section 5 presents an application of the proposed risk evaluation system, and the results are analyzed. Finally, conclusions are given in Section 6.
Fuzzy sets and fuzzy numbers
Assume a fuzzy set
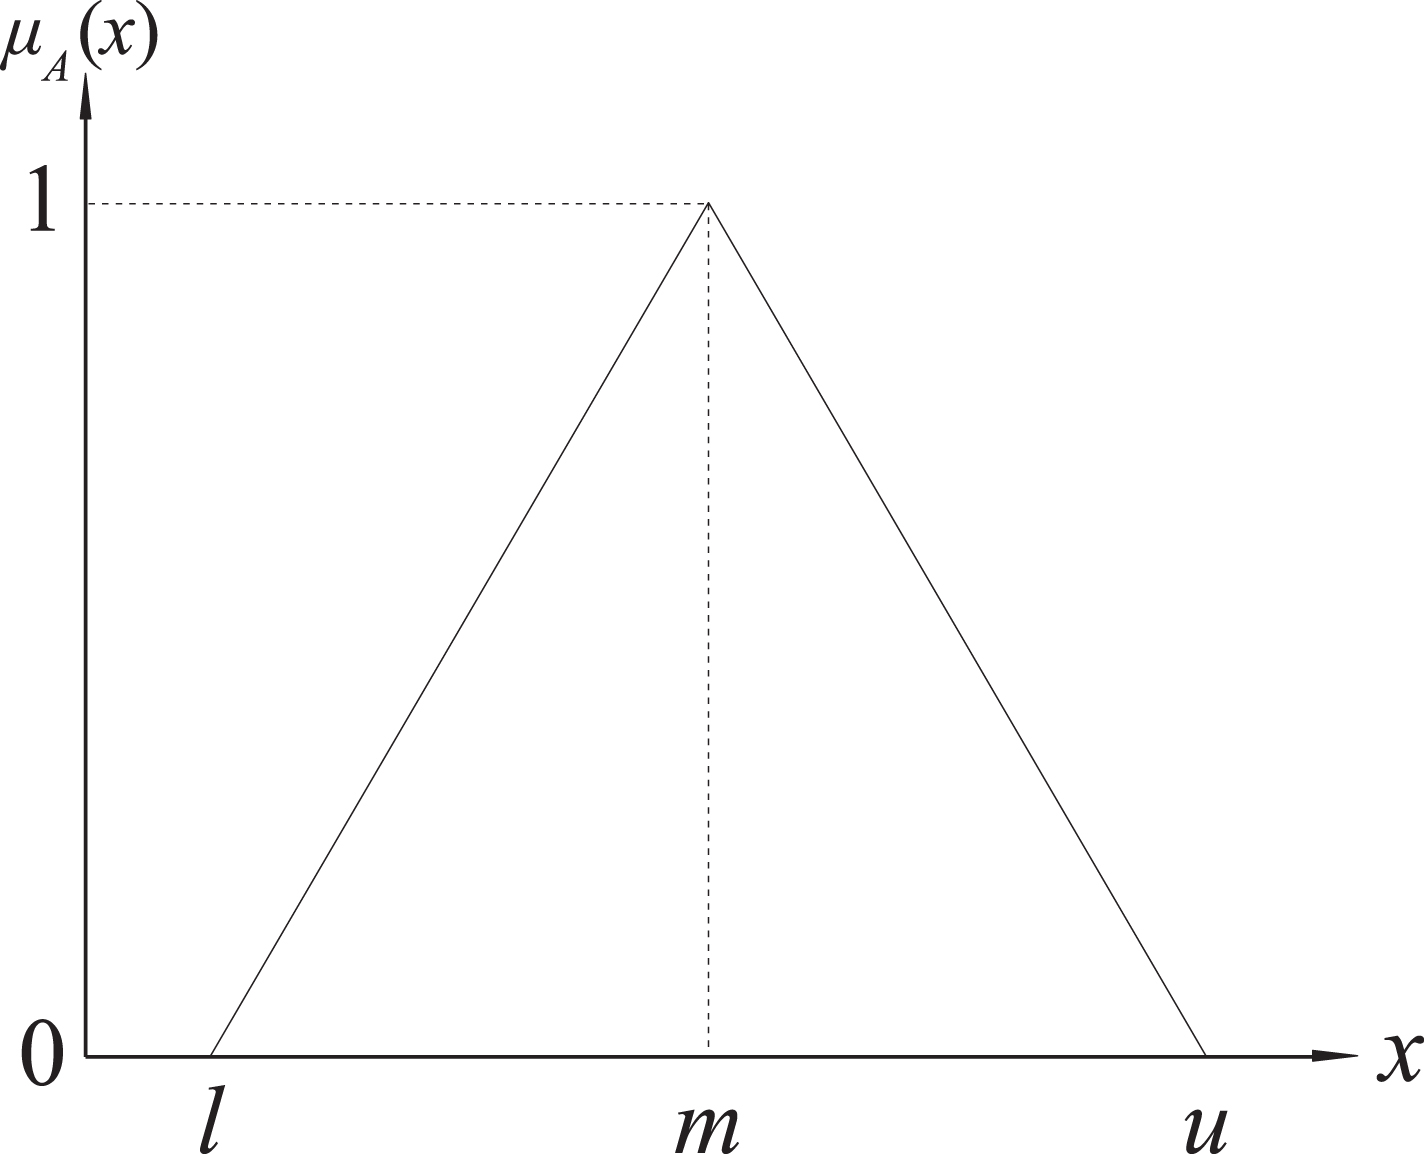
Triangular fuzzy number.
Consider two triangular fuzzy numbers
Several practical FAHP methods can be found in the literature. Among these different approaches, the FAHP proposed by Chang [38] is widely used in different applications because it boasts a lower computational complexity than other methods.
Assume that

Comparison between D i and D j .
Assume that d
i
(i = 1,2, ... ,b) is the minimum degree of possibility of D
i
≥ D
j
(j = 1 , 2 , . . . , b , j ≠ i) , and is obtained from Equation (12):
Take d
i
as the initial weight of the i-th index. Then, the initial weight vector of b indices can be calculated and expressed as Equation (13):
Finally, the weight vector can be normalized as Equation (14):
To objectively determine the weight of an index, the criterion of constructing fuzzy pairwise comparison matrix must be determined first. The method used in this paper was proposed by Kahraman [50], in this technique, linguistic descriptions can be transformed into triangular fuzzy numbers, as shown in Table 1.
Linguistic descriptions and fuzzy numbers of importance
Linguistic descriptions and fuzzy numbers of importance
Consider a problem with n factors in one layer; a triangular fuzzy number is used to judge the relative importance between factors i and j. If one decision maker postulates that factor i is more important than factor j, the triangular fuzzy number can be obtained according to Table 1. If factor j is believed to be more important than factor i, then the reciprocal of the triangular fuzzy number is taken. Accordingly, the comparison matrix
To ensure the quality of the decision, it is necessary to test the consistency of the fuzzy pairwise comparison matrix. For consistency testing, a fuzzy matrix is usually converted into a crisp matrix [51]. Several methods are available to convert a fuzzy matrix into a crisp matrix [52, 53]. The method presented by Chang [54] is used in this paper. A fuzzy triangular number
The crisp matrix is obtained when all fuzzy numbers are converted into crisp numbers, as shown in Equation (19); the maximum eigenvalue λmax of the crisp matrix can be obtained and the consistence index (CI) can be calculated from Equation (20). In addition, the random index (RI) of a matrix of n dimensions can be obtained from Table 2. Then, the consistency ratio (CR) can be calculated from Equation (21). If CR < 0.1, the crisp matrix and the original fuzzy matrix satisfy the consistency condition.
Random index (RI) of matrix
Each individual judgment is different. Hence, the judgments of all decision makers must be brought together. In the conventional AHP, there are two basic methods for aggregating individual judgments into a group judgment: individual judgment aggregation and individual priority aggregation [55]. The most commonly used method is individual judgment aggregation, whose algorithm is a geometric average, which is chosen in this paper.
Considering a group of K decision makers judging the weights of n indices, a total of K fuzzy comparison matrices
Membership function and membership degree
According to the mathematical classification, there are two types of basic evaluation indices: continuous indices and discrete indices. For a continuous index, a suitable distribution form of a membership function can be selected to obtain the membership degree according to the index characteristics. The most commonly used distribution forms are trapezoidal, triangular, and normal, among others. In contrast, it is difficult to obtain the membership function of a discrete index directly, and the membership degree can be evaluated only by experience. Thus, the corresponding membership degree is generally calculated by constructing a pairwise comparison matrix [56]. The relative importance obtained from the comparison matrix can be analyzed as the membership degree.
Procedure of the FCE method
Consider two discussion domains: a factor set U ={ u1, u2, . . . , u
n
} (ui is the evaluation factor) and an evaluation set V ={ v1, v2, . . . , v
m
} (vj is the evaluation grade). Each element in U is judged separately to obtain a membership matrix R by the membership function selected, the form of which can be expressed as Equation (25) [41]:
Consider the weight vector of n indices
The fuzzy mapping of U∼V can be calculated as Equation (27):
Establishment of an evaluation index system
According to the characteristics of colluvial cutting slopes and the statistics in the relevant literature [57–60], an evaluation index system is constructed herein. Corresponding to the applications of the FAHP, the index system can be divided into three layers: a target layer, a criterion layer and an index layer. The architecture of the system and its specific indices are shown in Fig. 4.

Evaluation index system of colluvial cutting slopes.
To obtain the weights of the indices of each layer, a group of 10 decision makers, including experts and geologists engaged in slope research, is formed. Taking the “Characteristics of rock and soil (U12)” layer as an example, the fuzzy comparison matrices are constructed by these 10 decision makers, and the representative matrix is obtained by aggregating the 10 comparison matrices and then employing Equation (22) ∼ Equation (24), as shown in Table 3.
Representative matrix of the subindices within the “Characteristics of rock and soil (U12)” index
Representative matrix of the subindices within the “Characteristics of rock and soil (U12)” index
Each of the 10 fuzzy comparison matrices should be tested for consistency, as should the representative matrix. The stability of the decision-making environment (α) and the personal attitude (λ) of the decision makers need to be determined first. In this paper, α= 0.5 is used to indicate that the environmental uncertainty is stable, and λ = 0.5 is used to indicate that the attitude of each decision maker is fair. The crisp matrix of the representative matrix of the “Characteristics of rock and soil (U12)” layer can be obtained using Equation (16) ∼ Equation (18), as shown in Table 4.
Crisp matrix of the subindices within the “Characteristics of rock and soil (U12)” index
CR = 0.0975 < 0.1 is obtained by employing Equation (20) ∼ Equation (21), which demonstrates that the representative matrix is reasonable.
When the representative matrix satisfies the consistency condition, the weights of the indices can be calculated. Applying Chang’s method, the initial fuzzy weight of each subindex in the “Characteristics of rock and soil (U12)” index can be calculated using Equation (7) ∼ Equation (10) from Table 3 as follows:
Then, the values of Di (i = 1, 2, ... , 6) are individually compared, and the degree of possibility P(Di > Dj) is obtained by using Equation (11), as shown in Table 5.
Values of P(D i > D j )
The minimum degree of probability of each index relative to the other indices is obtained from Table 5 as follows:
The initial weights of the subindices within the “Characteristics of rock and soil (U12)” layer can be expressed as follows:
The weights of the indices are then normalized and expressed as follows:
Similarly, the representative matrices for the indices of all other layers are obtained, and the results are shown in Table 6 ∼ Table 10. The images of fuzzy numbers of importance pertaining to the representative matrices are shown in Fig. 5.
Representative matrix of the subindices within the “Terrain and geomorphology (U11)” index

Fuzzy numbers of importance pertaining to representative matrices. (a) comparison with U1; (b) comparison with U11; (c) comparison with U21; (d) comparison with U111; (e) comparison with U121; (f) comparison with U211 .
Representative matrix of the subindices within the “Risk evaluation of colluvial cutting slope (U)” index
Representative matrix of the subindices within the “Root hazard source (U1)” index
Representative matrix of the subindices within the “State hazard source (U2)” index
Representative matrix of the subindices within the “Artificial excavation (U21)” index
Next, the weights of the subindices within the indices ranging from U to U21 are calculated, and the results are shown in Table 11. The normalized weights of all the basic indices are illustrated graphically in Fig. 6. The weight determination results show that the “slope structure (U125)” is the most influential index for the stability of colluvial cutting slopes, followed by the “crushed stone content of colluvium (U124)”, which is one of the typical characteristics of colluvial cutting slopes differentiating them from rock slopes and soil slopes. The least influential factor is the “vegetation development characteristics (U114)”. These results suggest that the “slope structure (U125)” and the “crushed stone content of colluvium (U124)” should be investigated and determined with a considerable accuracy in the risk evaluation of a colluvial cutting slope.
Weights of the indices within each layer
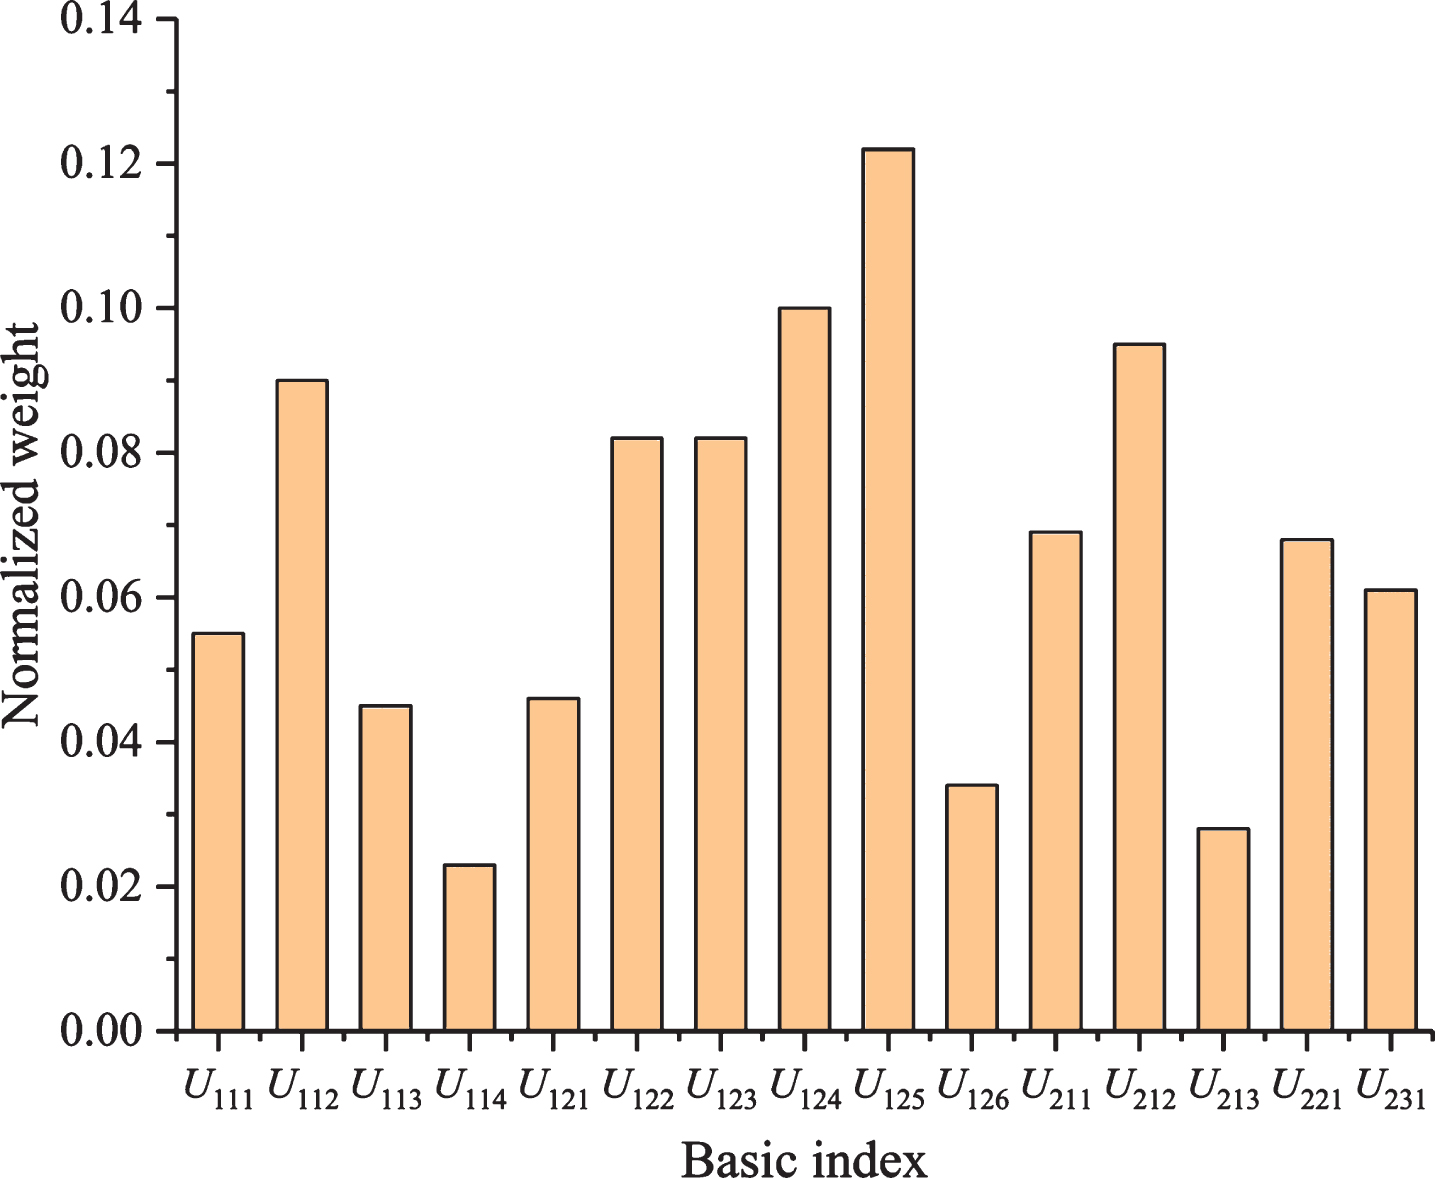
Normalized weights of the basic indices.
Combined with the characteristics of colluvial cutting slopes and the relevant literature [61], a risk evaluation set is established with four grades in this study: V = {Low, Medium, High, Very high}. For continuous indices, including the slope height, slope angle, thickness of colluvium, crushed stone content of colluvium, excavation height, and excavation angle, membership functions with a triangular form are constructed in this paper according to the risk evaluation criteria. Due to differences in their dimension and length, the raw data must be normalized. In contrast, for discrete indices, including the slope shape, vegetation development characteristics, bedrock lithology, weathering degree of bedrock, slope structure, water table, excavation mode, rainfall intensity, and seismic intensity, the importance comparison matrices are constructed by experts according to the risk evaluation criteria. The risk evaluation criteria for the basic indices are shown in Table 12. The values related to the continuous indices in brackets represent the normalized values, and the values related to the discrete indices in brackets are classification grades.
Risk evaluation criteria for the basic indices
Risk evaluation criteria for the basic indices
Taking the continuous “slope height (U111)” index as an example, the membership functions corresponding to each risk grade Low (I), Medium (II), High (III), Very high (IV) are constructed following Equation (28) ∼ Equation (31):
The membership functions for the other continuous indices are constructed similarly, and images of the membership functions are shown in Fig. 7:
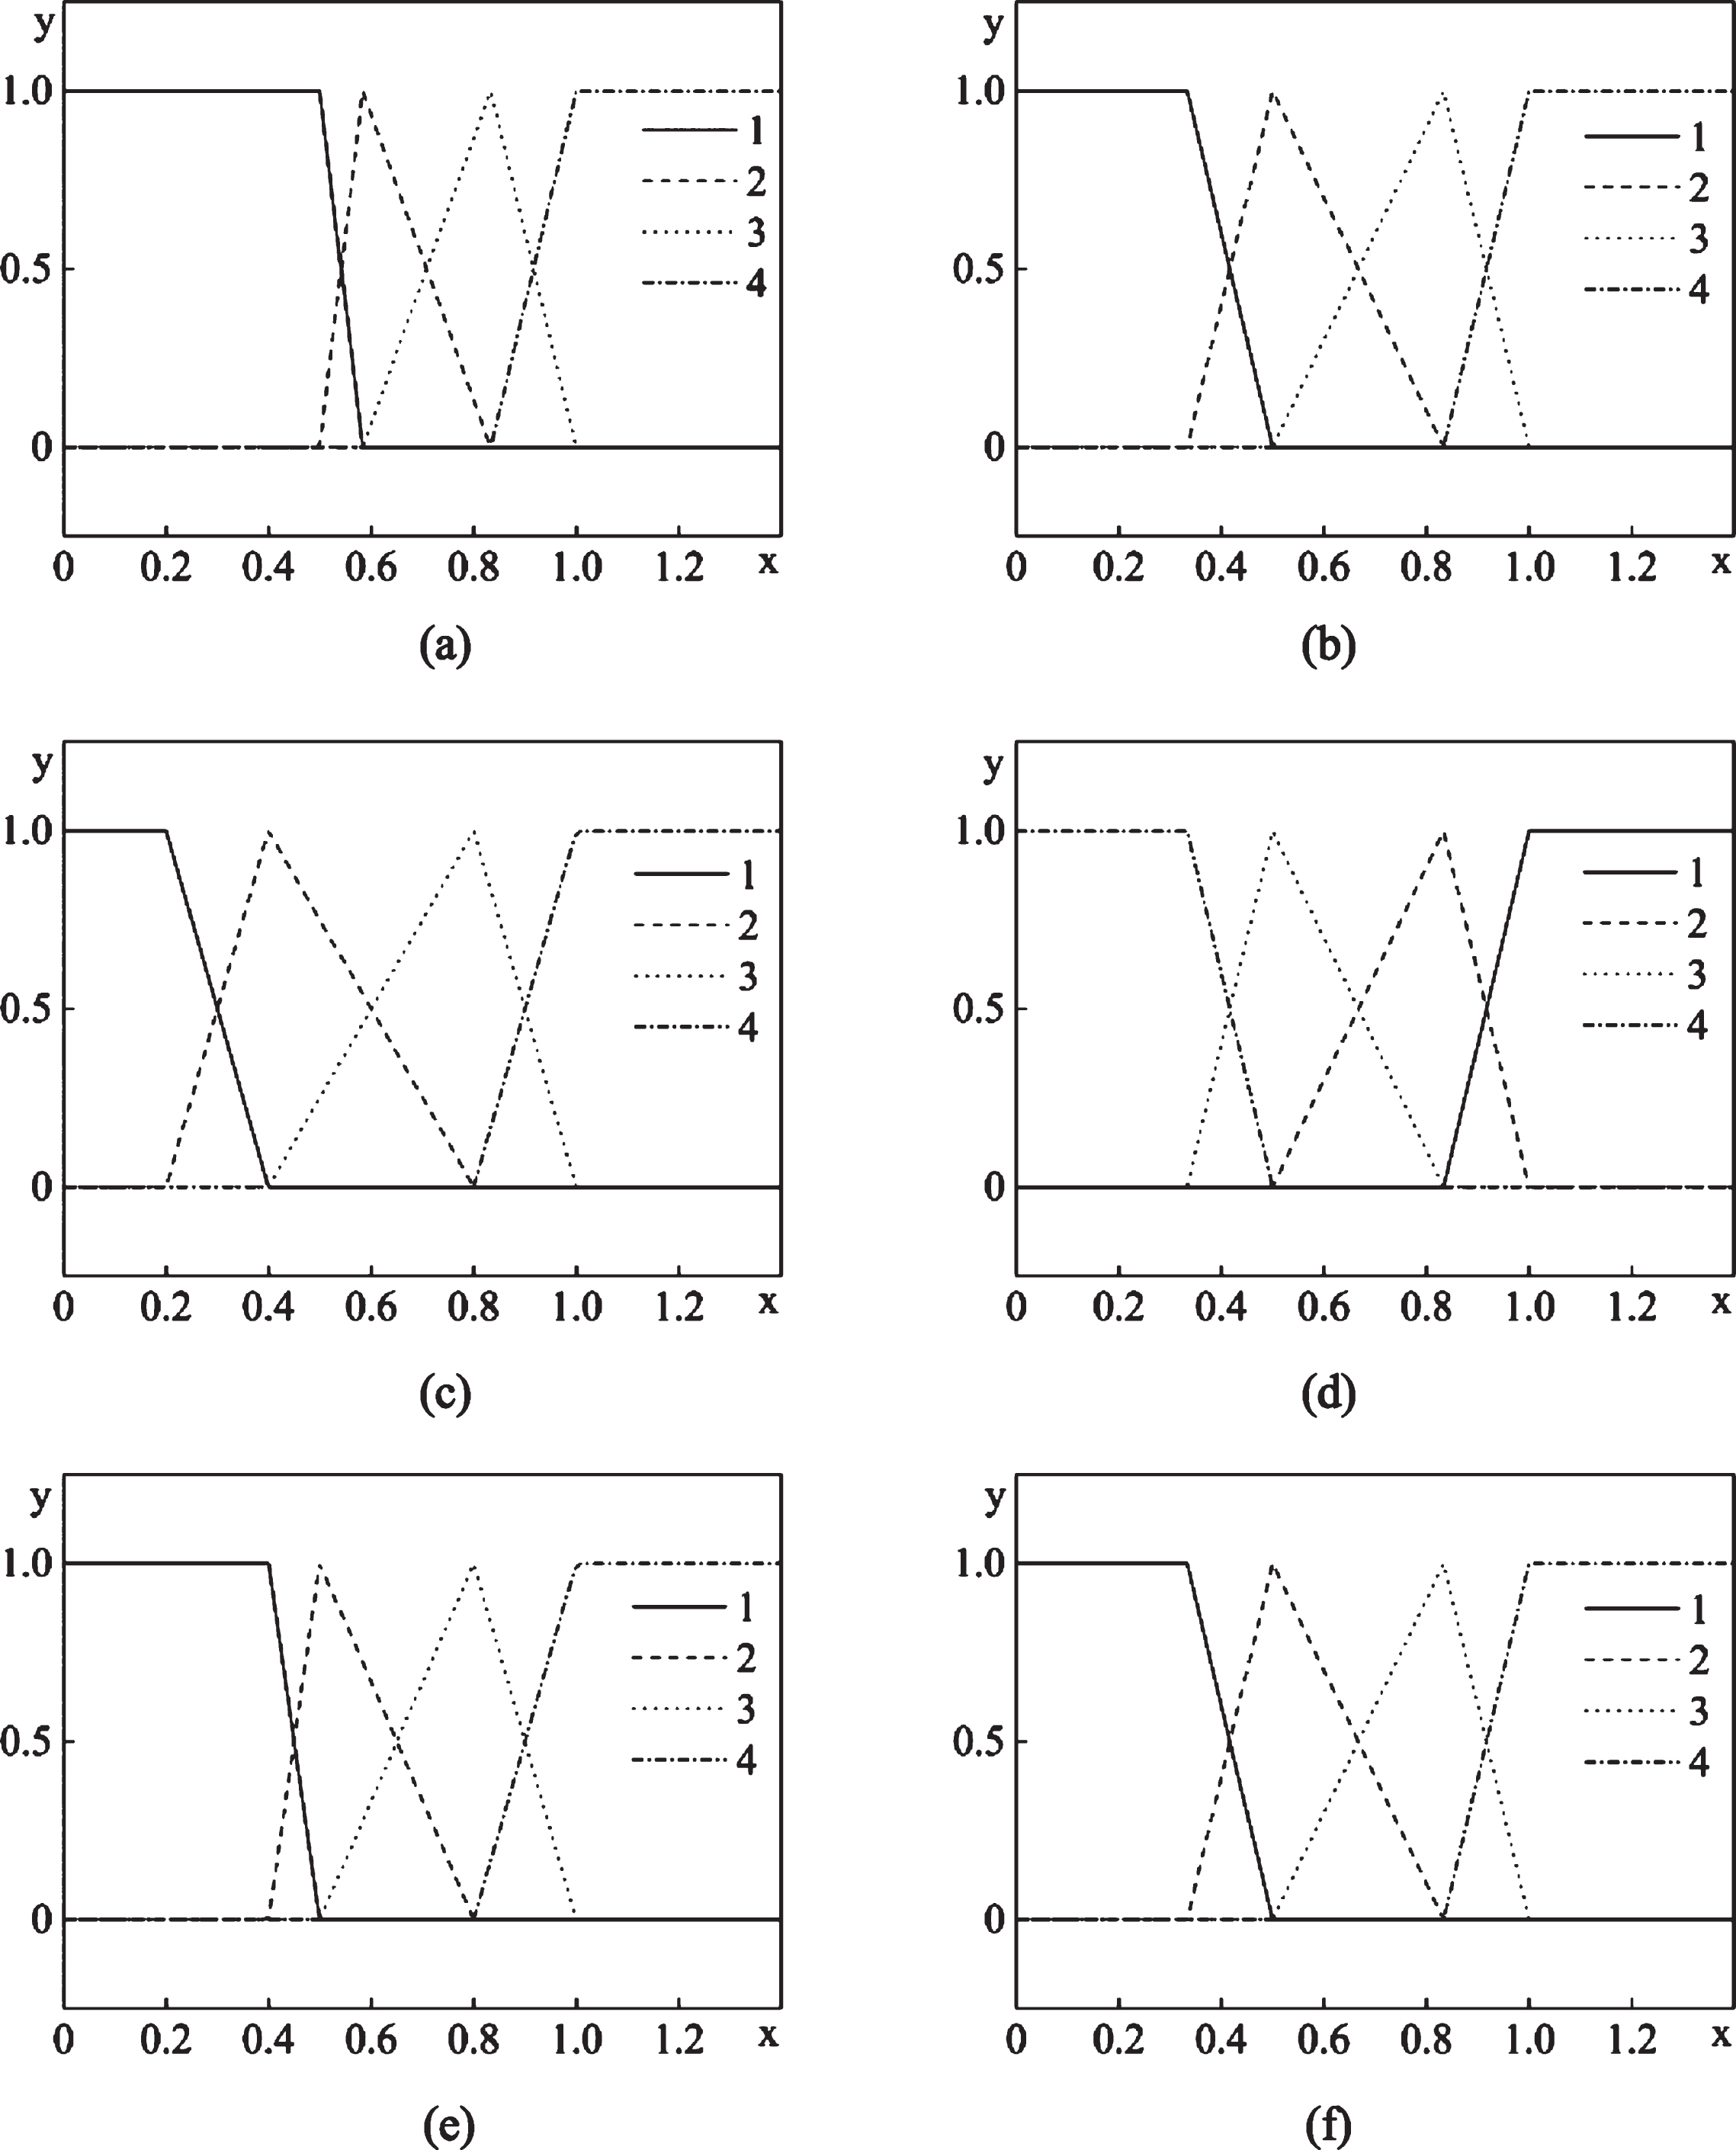
Membership functions for continuous indices (a) U111; (b) U112; (c) U123; (d) U124; (e) U211; (f) U212. 1-membership of low grade; 2-membership of medium grade; 3-membership of high grade; 4-membership of very high grade.
Taking the discrete “Slope shape U113” index as an example, the importance comparison matrices corresponding to each classification grade are constructed following Equation (32) ∼ Equation (35):
The membership degree to each risk grade can be calculated from the importance comparison matrix determined by the selected classification grade. The membership degree values of the discrete indices to each classification grade are thus obtained, as shown in Table 13.
Membership degree values of discrete indices
Based on the membership function constructed for each basic index, the corresponding membership degree to each evaluation grade can be obtained when given a value to the index, and the membership degree matrix of basic indices
The risk evaluation system of colluvial cutting slopes based on the FCE method is segmented into three levels according to the index system structure. The membership degree vector of the first-level
The membership degree vector of the third-level
The risk evaluation system process is illustrated in Fig. 8.
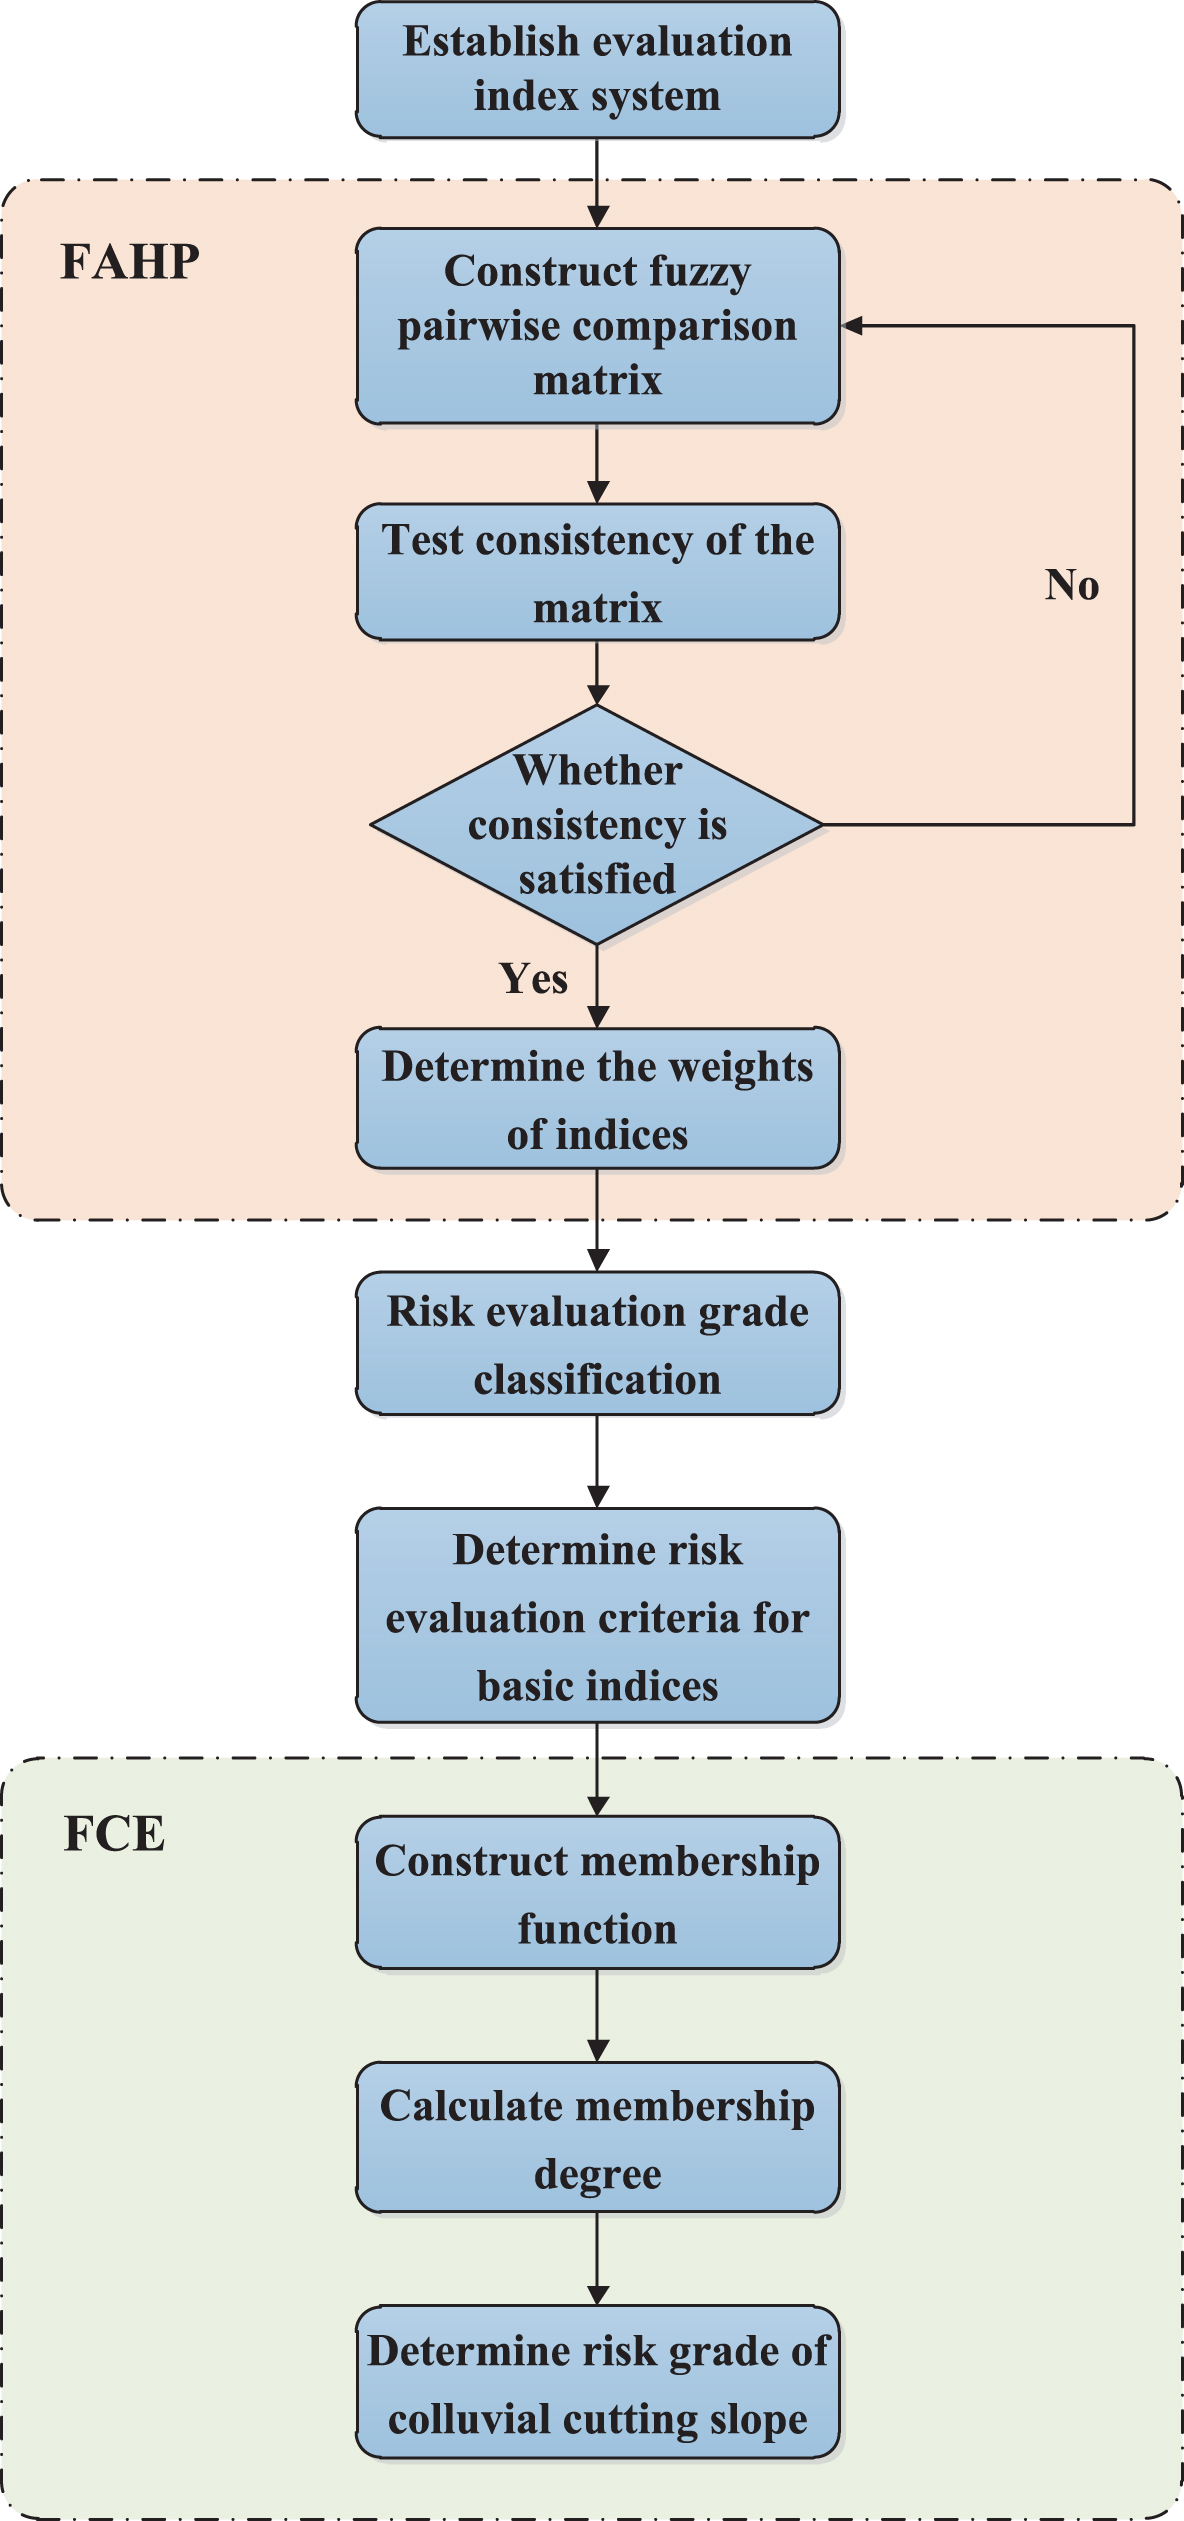
Risk evaluation system process.
The Xiaomengyang-Mohan section of the Kunmo Expressway located in Jinghong, Xishuangbanna, Mengla County, Yunnan Province, is a part of the planned AH3 line of the Asian Highway Network that starts in Ulan Ude, Russia, and enters China via Ulaanbaatar, Mongolia, and then stretches from Beijing to Chiang Mai, Thailand, via Shanghai, Hangzhou, Kunming, Mohan, South Pylon, and Laos. The Xiaomengyang-Mohan highway is the last part of the Kunming-Bangkok passage in China. The total length of the highway reconstruction and extension project is 156.043 kilometers. The geographical location of the project is shown in Fig. 9.

Geographical location of the project.
The surface layer of the highway route area is mainly composed of Quaternary colluvial and residual product. The colluvial slope layer is distributed mainly atop the slope and valley slope and is composed of silty clay, gravel soil, and massive stone soil. Most of the basement rocks are composed of loosely cemented fuchsia conglomerate intercalated with lithic sandstone, argillaceous siltstone and gray-yellow quartz sandstone. Field photos of typical features are shown in Fig. 10, and the typical geological profile is provided in Fig. 11. According to meteorological data, the annual rainfall within the route area is 1291.2 ∼ 1943.9 mm. According to the relevant statistics, the route area is a multi-seismic area, the seismic intensity is VII∼VIII magnitude. Hence, the complex factors of instability for these colluvial slopes represents considerable hidden risks to slope cutting engineering.

Typical field photos of colluvial slopes.
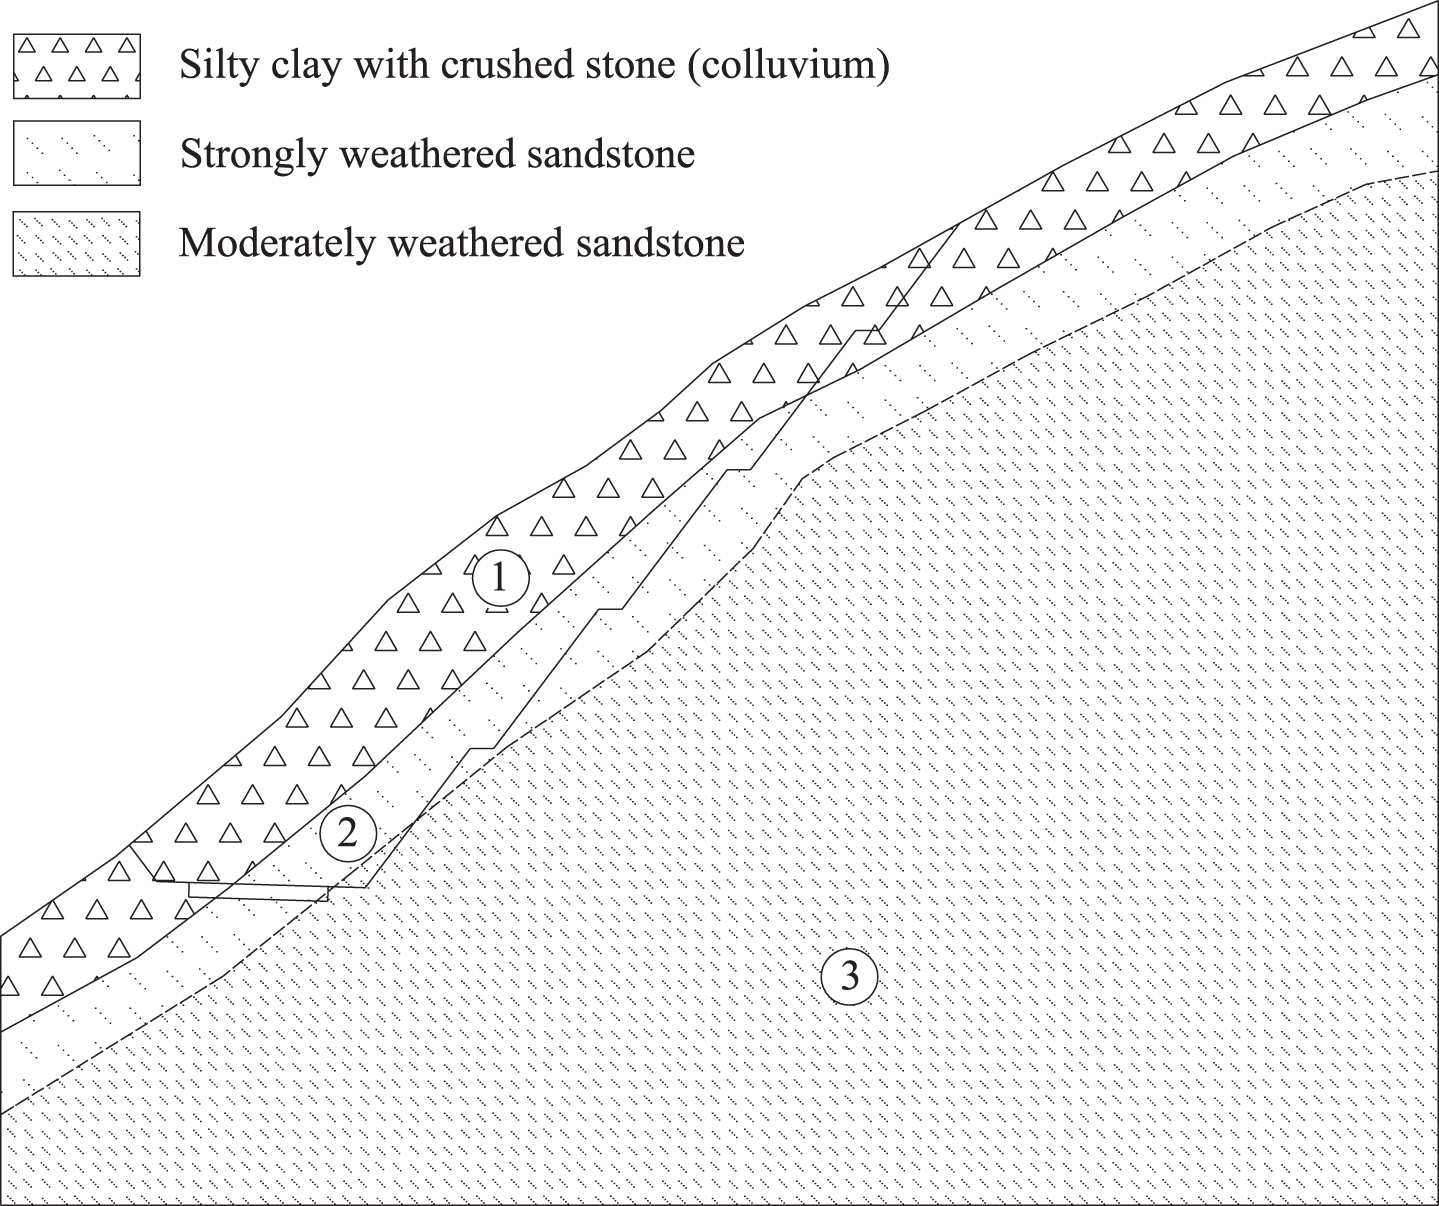
Typical geological profile of the colluvial slope in the project area.
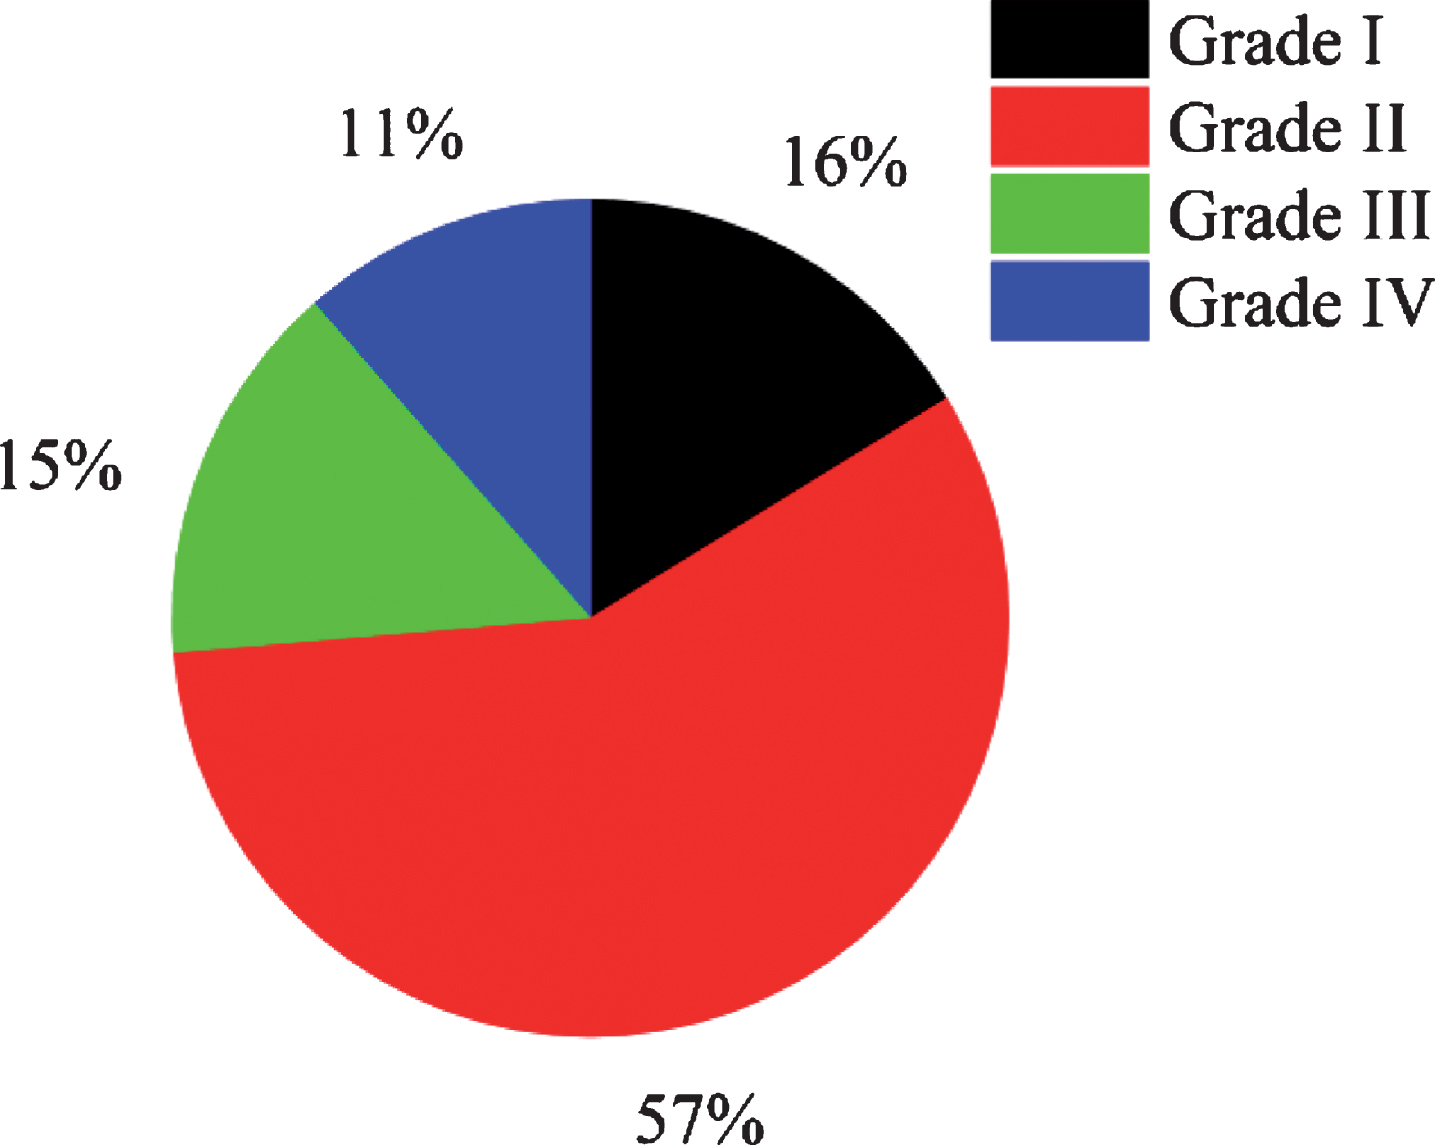
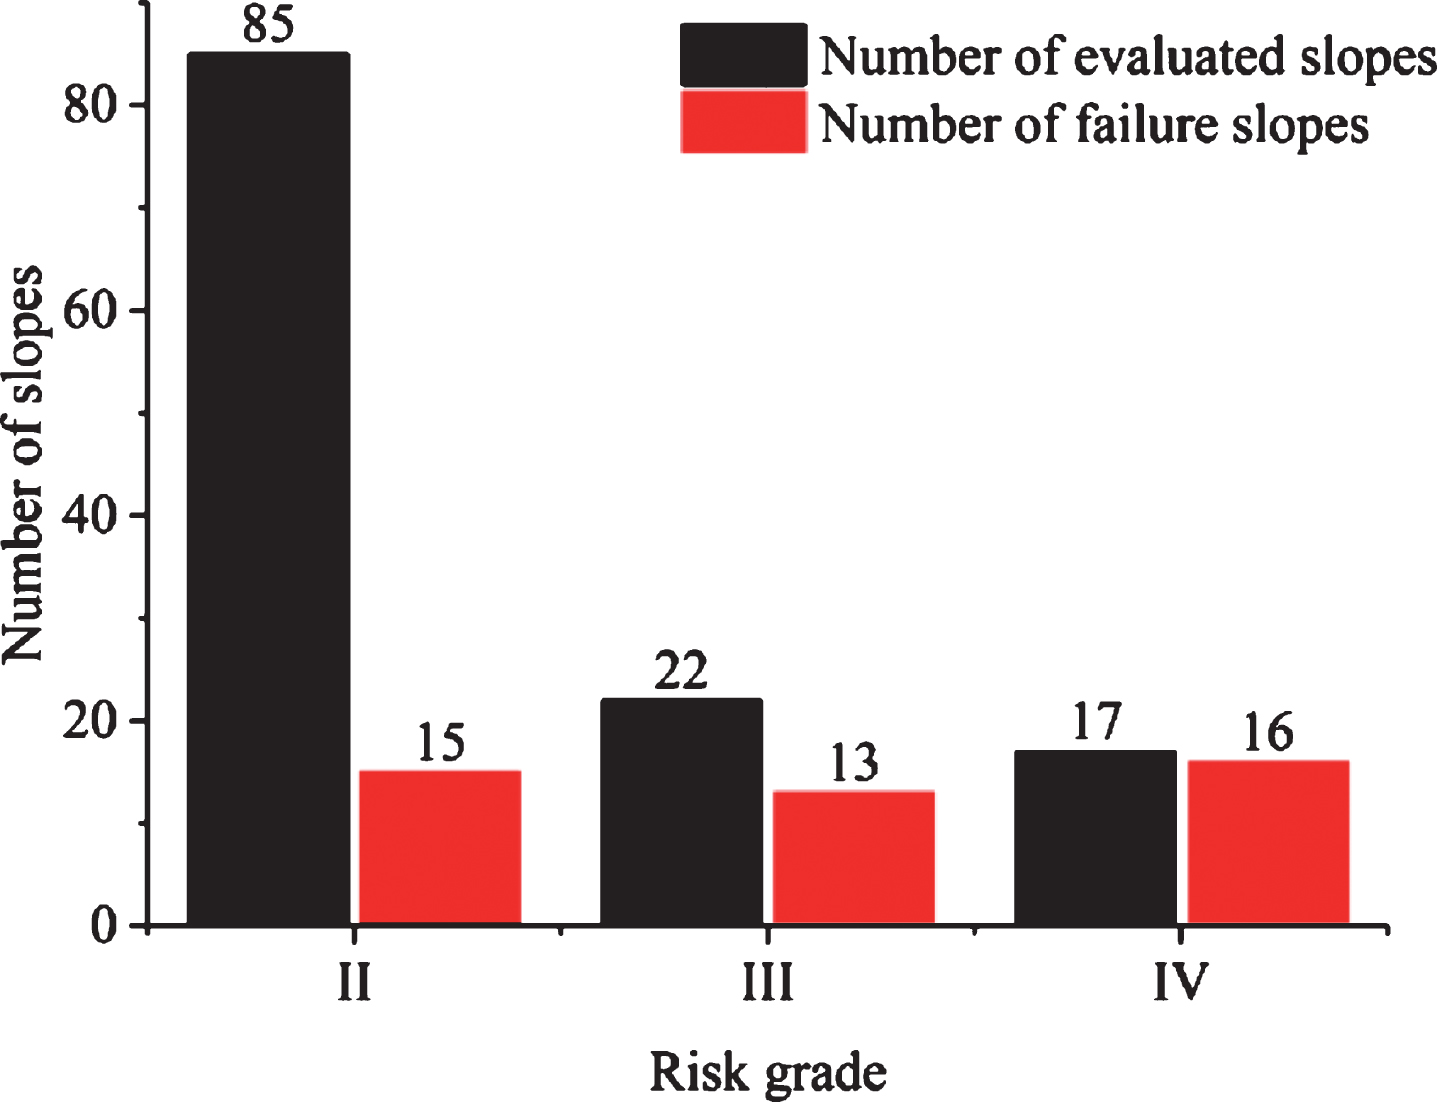
The risk evaluation system established in this paper is used to evaluate the risks of 148 colluvial cutting slopes along the Xiaomengyang-Mohan highway section. The results are as follows. There are 24 slopes of low risk (grade I), accounting for 16.2% of the total; 85 of medium risk (grade II), accounting for 57.4%; 22 of high risk (grade III), accounting for 14.9%; and 17 of very high risk (grade IV), accounting for 11.5%, as shown in Fig. 12. According to the site construction data, the failure or local failure slopes all have a risk grade of II, III, or IV: failure occurred in 15 out of 85 slopes of risk grade II, accounting for 18%; 13 out of 22 slopes of risk grade III, accounting for 59%; and 16 out of 17 slopes of risk grade IV, accounting for 94%, as shown in Fig. 13. The risk grades of some typical slopes are shown in Table 14. Evidently, the evaluation results obtained by applying the risk evaluation system proposed in this paper are in good agreement with the actual slope instability states. These evaluation results show that the risk grades of colluvial cutting slopes in different locations along this section of highway are different due to the discrete spatial distribution of rock and soil masses, but most of the slopes are of risk grade II, indicating that this section displays medium engineering geological conditions. According to expert suggestions and the technical safety risk evaluation guide for high cutting slope engineering construction, different engineering protection measures should be adopted for slopes of different risk grades: frame beams or retaining wall engineering constructions are recommended for slopes of risk grade I; grouting engineering is recommended for slopes of risk grade II; anchorage engineering employing anchor cables is recommended for slopes of risk grade III; and anti-slide piles are recommended for slopes of risk grade IV. Furthermore, slopes of risk grades III and IV should be monitored more closely, and protective measures should be adjusted according to the monitoring results to ensure the safety and stability of colluvial slopes along the highway.
Slope grade distribution along the Xiaomengyang-Mohan highway.
Distribution of failure slopes along the Xiaomengyang-Mohan highway.
Evaluation results of typical colluvial slopes along the Xiaomengyang-Mohan highway
This paper presents an evaluation index system for colluvial cutting slopes and establishes a risk evaluation system for such slopes based on the FAHP and FCE methods. This evaluation system is then applied to evaluate the risks of 148 colluvial cutting slopes along the Xiaomengyang-Mohan highway. According to the result, some conclusions can be summarized as follows: In the process of evaluating the risk of a colluvial cutting slope, the weights of indices are decided by 10 experts; considering the subjectivity and variability of human judgment, the FAHP resolves this problem well. The system of colluvial cutting slopes is complicated, as it contains many influencing factors on the slope stability, and fuzziness and uncertainty are evident in the process of quantization during the evaluation. The three-level FCE applied in this paper works well for this evaluation. The evaluation results obtained in this paper are in good agreement with the actual slope instability states of real-world sites. These findings show that the risk evaluation system of colluvial cutting slopes established in this paper has a high efficiency and a high accuracy, and it can provide decision-making advice to engineers and guidance for supporting measures and construction management of colluvial cutting slopes.
The future work is to further discuss the advantages and disadvantages of the risk evaluation system established in this paper in detail by comparing it with other methods and investigate more effective methods to ascertain the main influencing factors and weight determinations to broadly adapt the risk evaluation system proposed herein to more types of engineering risk evaluations.
Footnotes
Acknowledgments
The work reported in this paper is financially supported by the National Natural Science Foundation of China (No. 51779250, No. U1402231, No. 51679232), the National Key Basic Research Program of China (973 Program) under Grant No. 2015CB057905, and the Traffic Science, Technology and Education Project of Yunnan Province [2017] No. 33.