



Abstract
The geometrical appearance of weld bead is critically important in terms of directly determining the quality and reliability of T-joints laser stake-welding process. In this regard, this paper puts forward an innovative hybrid modeling scheme integrating the adaptive neural fuzzy interface system (ANFIS) with three-dimensional numerical simulation to accurately characterize the weld bead appearance. First, an ANFIS-based model is developed to identify the weld characteristics by experimental observation and provide the key parameters of hybrid heat source involved in the weld numerical simulation. Second, the weld bead geometry, i.e., weld penetration depth, surface weld width and interface weld width are all computed utilizing the numerical simulation method. The proposed numerical model exhibits good agreements with the experimental results in regard to forecasting the weld characteristics. In the end, the role of various welding conditions on the formation mechanism and T-joints bead profiles of the laser stake-welding are elucidated through the simulation model. The simulated results would help provide a much better understanding of the critical factors which does affect the weld appearance, and lay a solid foundation for optimizing of welding parameters and obtaining a high-quality weld.
Introduction
Currently, the light-weight and space-saving of civil engineering, shipbuilding and automobile industries have become an inevitable trend and demand to address environmental degradation and energy shortage. With the advantages of high specific strength, specific rigidity and large carrying capacity, the metal sandwich panels can satisfy these requirements. In general, the laser stake-welding technique is widely applied to connect metal sandwich panels due to its high depth-to-width ratio, small deformation and less residual stress.
The most representative type is web-core sandwich panel (I-Type) which as shown in Fig. 1(a). The laser beam source can heat the horizontal face-plate and melt the upper parts of vertical web-plate, thereby forming an overlap T-joint weld (shown in Fig. 1(b)) after cooling solidification. As is well-known, weld appearance plays a decisive role on the fatigue strength, rotation stiffness and micro-structure/micro-hardness of laser T-joints. Weld appearance variables including weld penetration depth, weld width and weld height are significantly affected by the laser process parameters. In this regard, Meng et al. [1] investigated the effects of weld parameters, gap size, offset and work-piece thickness on weld quality and then achieved the desired T-joint weld by applying low welding speed, thin face plate, and small gap size. Zhang et al. [2] developed an electric current-aided laser-welding for aluminum alloy workpiece and analyzed the influence of welding parameters on weld geometry in detail. The experimental results showed that the electric current can produce an expected weld width at the faying surface, and the appropriate combination of laser power and welding speed can obtain an optimal penetration depth. However, selection of the most trial-and-error method is method is much difficult owing to the complex interdependence of above parameters on the laser welding. Hence, more researchers focused on some predictive models based on data-driven approach or numerical simulation to reduce the number of experimental trials and achieve the parameter optimization.
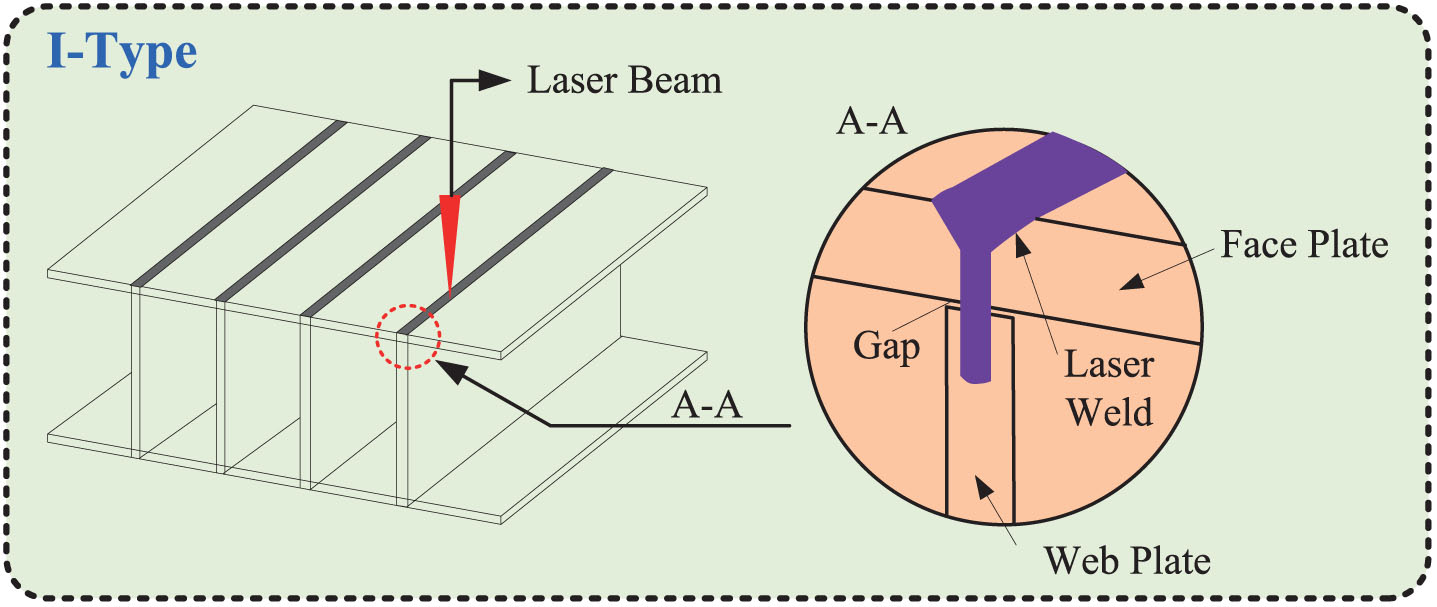
(a) Overview of I-Type sandwich structure (b) Laser stake-welded T-joints.
As a representative of the data-driven approaches, some traditional neural networks such as BPNN are widely used to evaluate the weld quality in recent years [3–5]. Lv et al. [6] proposed a typical BP neural network to predict the GTAW penetration status according to the features of acoustic signatures and the accuracy rate of prediction model could reach 80–90% using these penetration features. Buffa et al. [7] applied a dedicated neural network (NN) to correctly identify the different levels of linear friction welding quality including the non-penetrated weld, sound weld and over-penetrated weld. Unfortunately, these neural networks may have some disadvantages i.e., a low convergence rate, easily being trapped in local minima or difficulty of obtaining an optimal structure. Hence, an adaptive-network-based fuzzy inference system (ANFIS) has been developed to successfully estimate the weld geometry and optimize the welding parameters in a complicated and nonlinear welding environment. This is because the ANFIS model itself combines the benefits of both neural networks and fuzzy-logic system, which has a high adaptability and generalization capacity to deal with uncertain information. It has been widely applied in many industrial field such as the vehicle engineering [8], photovoltaic generation [9], urban transportation [10] and human resources [11] etc.
Especially for the complex welding process, Liu et al. [12] proposed a neural-fuzzy model to accurately identify the gas tungsten arc welding (GTAW) penetration status using measurements from a front side vision sensing system. The dynamic ANFIS model could predict the backside bead width nonlinearly using visual features with sufficient accuracy (less than 1 mm) during GTAW process. In addition, Wu et al. [13] proposed an ANFIS model to real-time recognize the variable polarity plasma arc welding (VPPAW) penetration using the backside keyhole characteristics. The research results indicated that the prediction model could establish an internal relation between the weld parameters and the final weld quality. Although the ANFIS model has been widely adopted in capturing the non-linear relation between the process parameters and weld attributes, it still cannot clearly elucidate the formation mechanism of welding process based on the observed experimental data.
The above limitation associated with the data-driven models may be partially overcome by employing the numerical analytical model. It could offer potential as an alternative to provide significant insight into the formation mechanisms governing the welding process. Koo et al. [14] simulated the coupled heat transfer/fluid-flow behavior during laser welding to discuss the internal connection between the laser welding parameters and the hourglass shaped welds. The simulation results further demonstrated that welding parameters played an important role on the formation of the hourglass shaped melt pool during laser welding. Based on the physical mechanism of heat transfer and keyhole behavior, Ai et al. [15] presented a 3D numerical model to simulate the formation process and evaluate the laser weld geometry including the width, reinforcement and penetration depth. The variation tendency of the weld profile affected by laser welding parameters could also be described by the numerical method. In addition, Zhao et al. [16] designed an adaptive heat-source model and considered the plasma gas, liquid metal and fluid dynamics to model the laser welding process. The predicted results of weld geometry are consistent with the actual results via the experimental verification. Nevertheless, rare attention has been paid to utilize a numerical simulation model to characterize the complicated T-joints laser stake-welding process, not to mention the analysis of relationship between different process parameters and corresponding weld appearance. Moreover, it is much difficult to determine the heat source model quickly and reliably due to large amount of expensive and time-consuming experiments or complex empirical equations.
To achieve accurate characterization and prediction of weld bead appearance under different welding conditions, this paper attempts to present a novel hybrid methodology framework based on the integration of ANFIS model and numerical simulation. In this study, Section 2 briefly introduces the laser stake-welding experimental system. Then Section 3 proposed an ANFIS model to identify the laser weld characteristics for determining the hybrid heat source model involved in the numerical simulation. Section 4 utilizes the numerical simulation to reveal the formation process and predict the geometry sizes of weld profiles. The comparison of the simulated and experimental results is evaluated by a series of welding experiments, and the variation trend of the weld appearance under different laser welding conditions are further investigated. Finally, Section 5 provides the conclusions.
Description of experiment system
As depicted in Fig. 2, the laser stake-welding experimental system mainly includes a laser control platform, a fiber laser system (IPG YLS-5000), a six-axis robot (KUKA KR60HA) and a specially designed fixture. As seen in Table 1, the fiber laser wavelength of 1070 nm and laser facula diameter of 0.5 mm was applied in the welding experiment. The maximum output power is 5 kW and the shielding gas is pure argon with a flow rate of 20 L/min. To simulate the actual T-joint laser welding situation, i.e., the surface irregularities or existing burrs of welded sandwich panels, the preset gap size was varied by inserting different feeler gauges between the face and web plates.
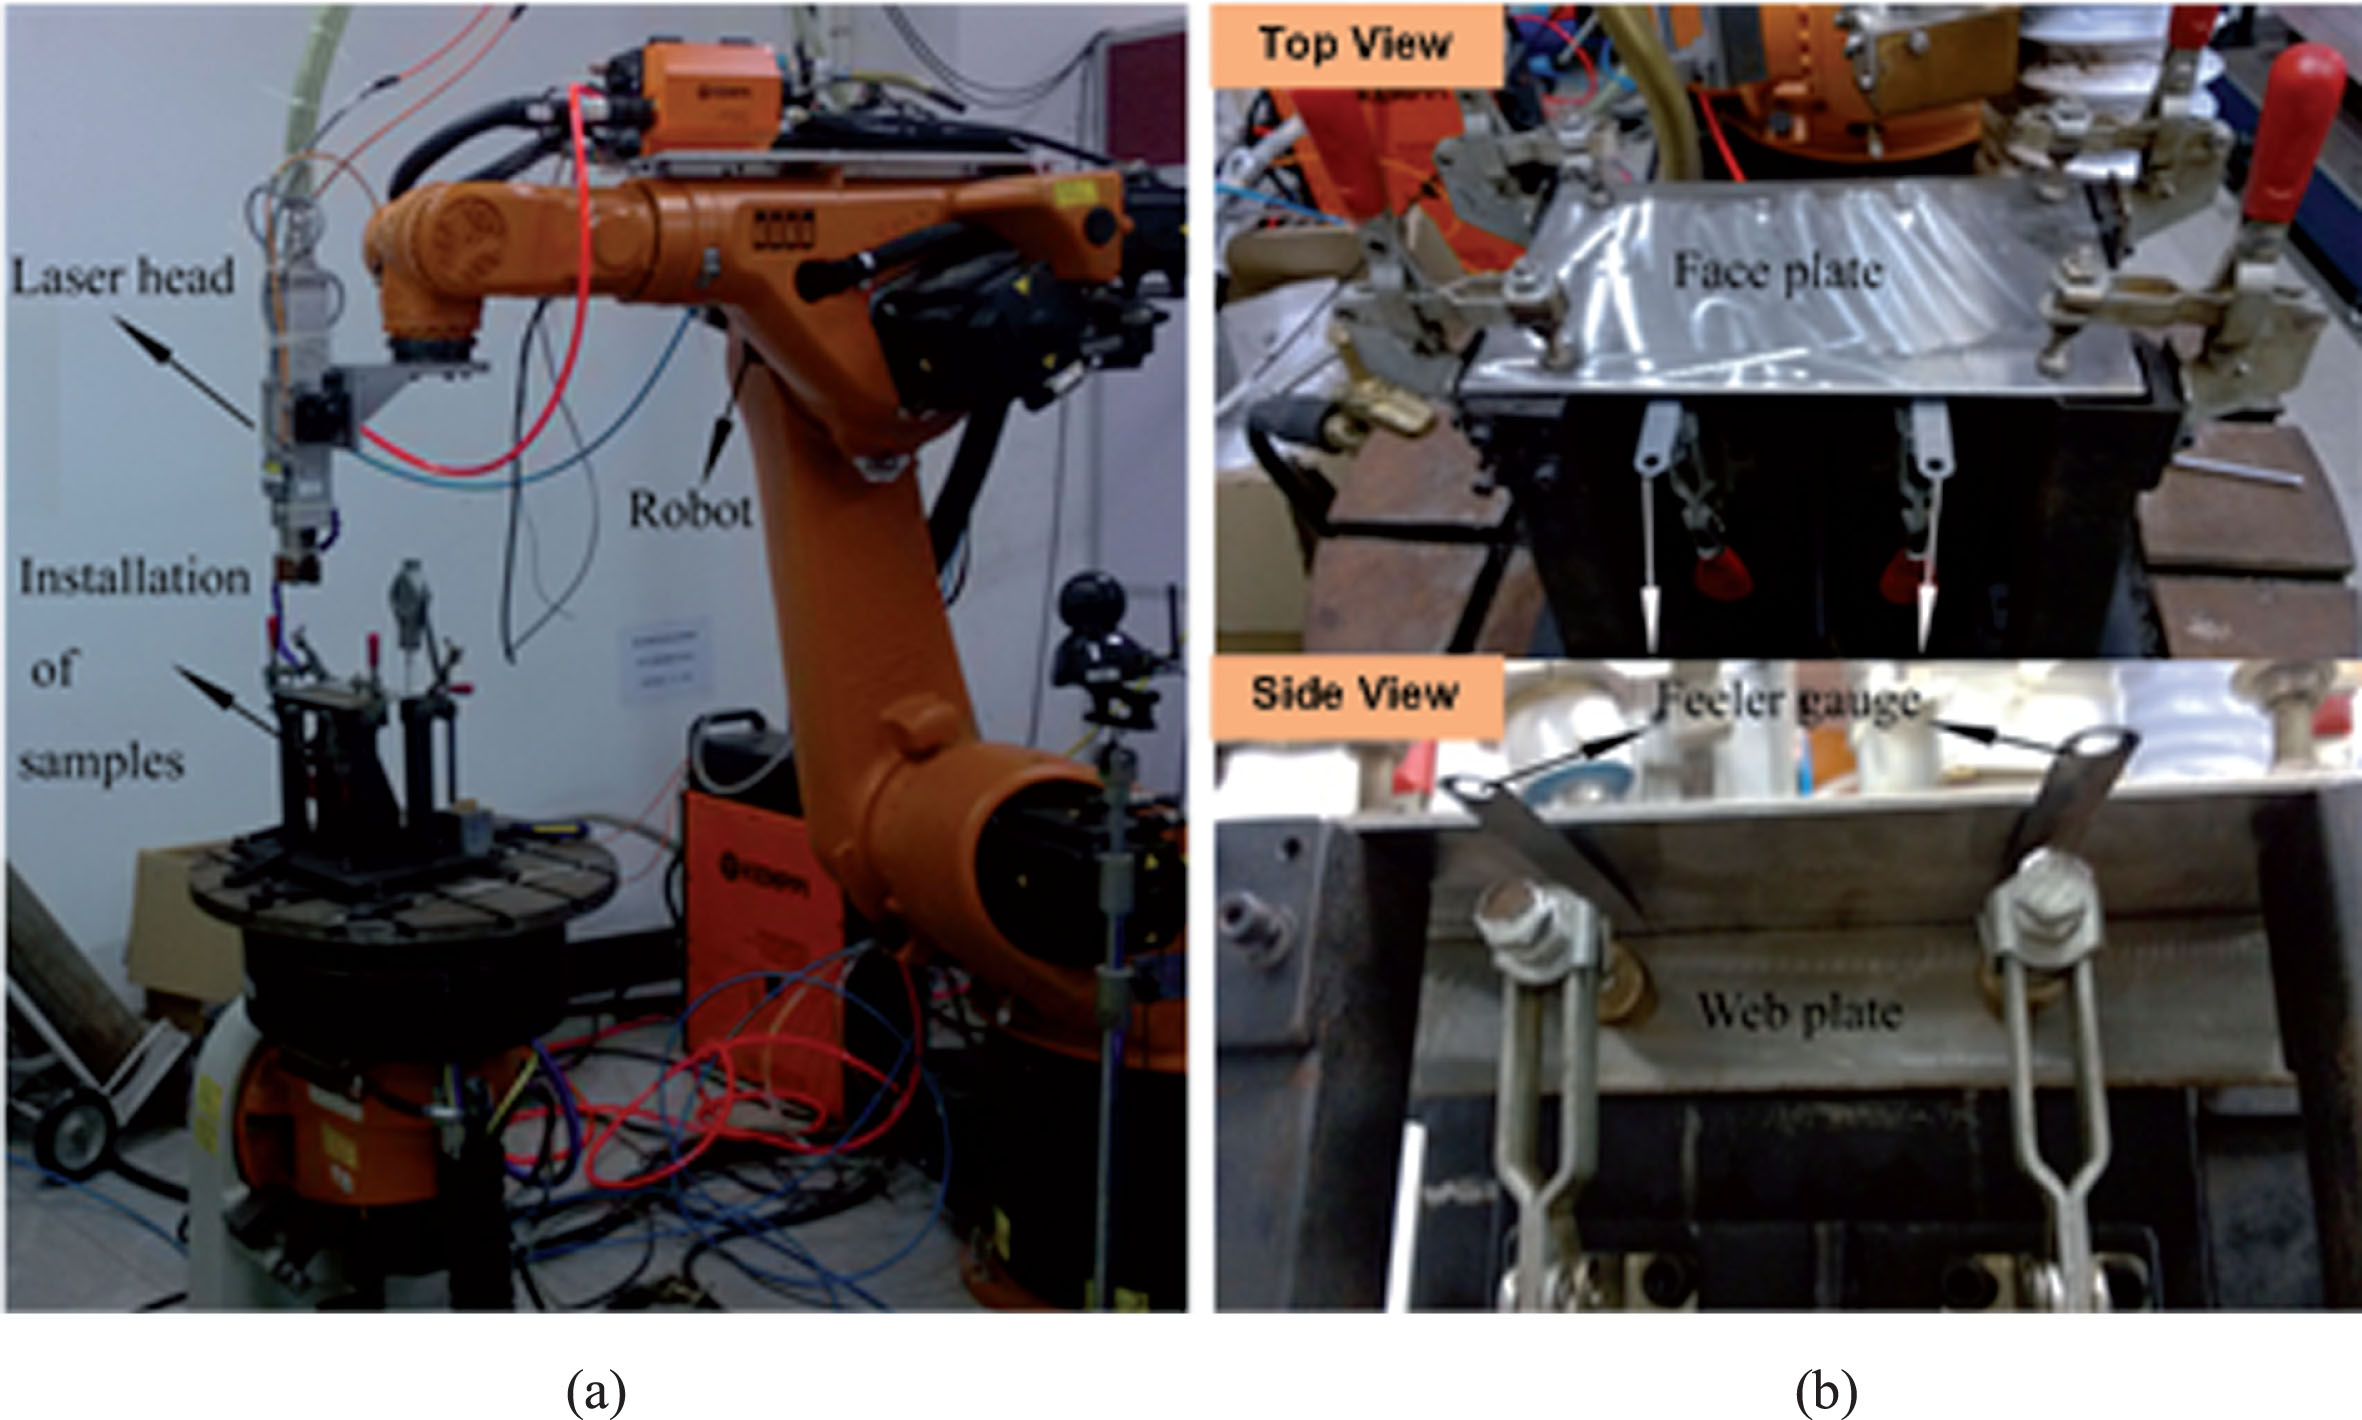
(a) The laser stake-welding system (b) T-joints workpiece and the designed welding fixture.
Detailed experiment parameters
In this section, autogenous laser-stake welds were made on 3-mm-thickness workpiece in the case of AISI304 stainless steel. According to Fig. 3, the main parameters including laser power P, welding speed V and gap size G are considered as the input variables. The resultant output variables including the weld penetration (WP), surface weld width (SW) and interface weld width (IW) are geometry sizes to quantitatively estimate the weld appearance.
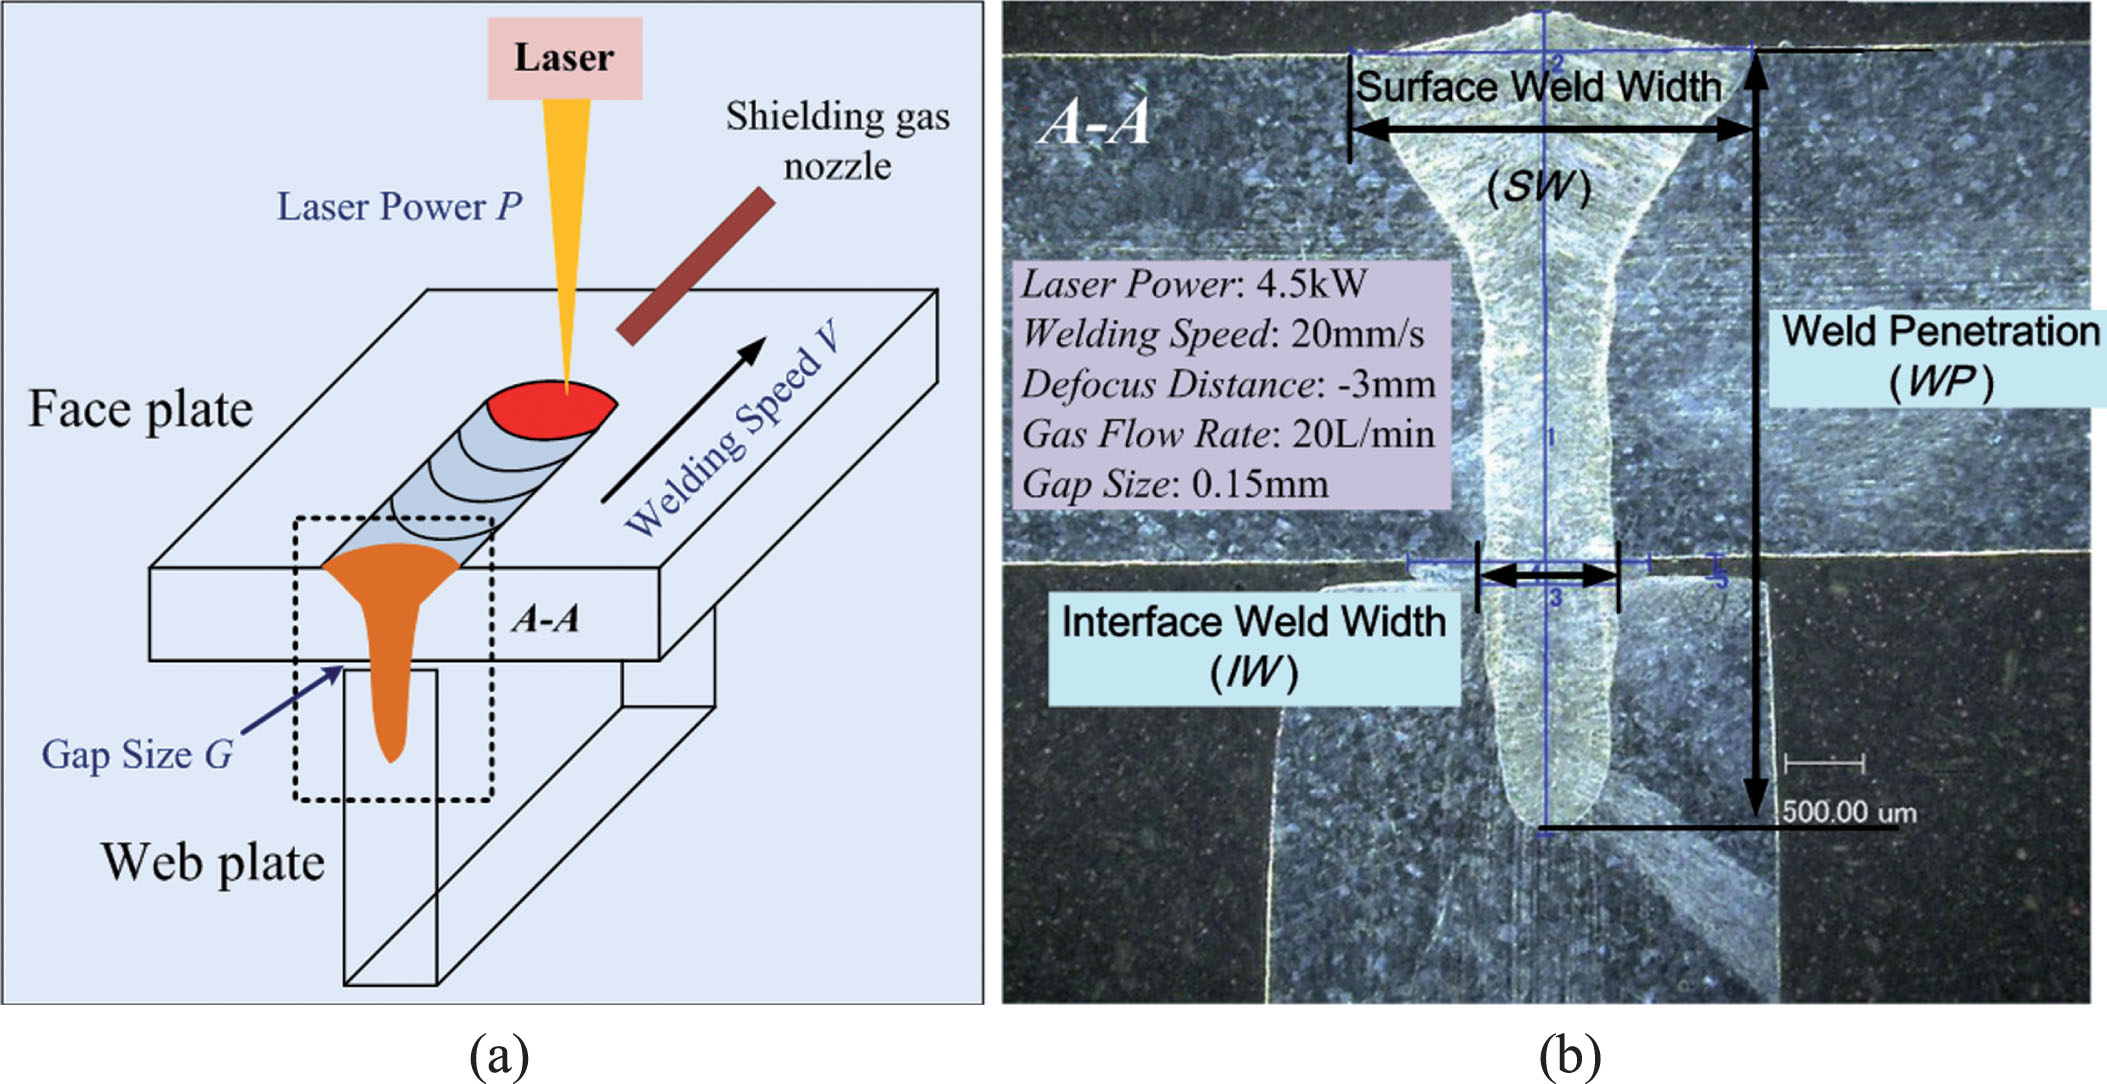
The schematic of laser stake-welding process and a typical macrograph of weld appearance.
To cover the typical welding conditions used in practice and identify the main effects on the weld characteristics, a Box-Behnken statistical design for three factors and three levels was applied in this section. It establishes a design matrix containing the input variables and output responses utilizing Design-Expert software. To ensure the rationality and validity of statistical data, the experiments under different welding conditions were conducted with full replication. The entire experimental dataset contained 40 sets of samples, and part sets of samples were recorded in Table 2.
Experimental results based on Design-Expert software
In this section, the response surface methodology (RSM) was first applied to build a regression model of the weld bead through the experimental data. In general, the response surface can be expressed as follows:
To verify the applicability of the statistical regression models, the other experiments were conducted under different welding conditions. As shown in Table 3, the regression model can approximately predict the actual weld sizes, and the maximum errors of the weld penetration (WP), surface weld width (SW) and interface weld width (IW) are 7.09, 10.95 and 11.90 respectively. The results indicate that the quantitative relation between laser welding parameters and weld sizes is not very well accommodated by the second order polynomial. Considering the laser welding being a highly complex and nonlinear process, it is essential to establish a more accurate model to predict the weld geometry. This would help provide the exact characteristic parameters of heat source model for the numerical simulation.
Confirmation experiments of WP, SW and IW responses
Detailed structure of proposed ANFIS model
Data-driven technique is another major tool that uses experimental data for modeling of laser stake-welding process. One of the principle advantages of data-driven model is its ability to map complex nonlinear relationship between multiple input variables and output(s). In this section, an adaptive neuro-fuzzy inference system (ANFIS) model has been developed to analysis the weld characteristic by utilizing experimental data. According to Jang [17], the ANFIS model is a class of adaptive networks functionally similar to the fuzzy inference systems. For the laser welding process, the independent ANFIS models have three inputs a, b, c (laser power, welding speed and gap size) and one output Y (weld geomtry). In this study, the Takagi-Sugeno fuzzy model with two if-then rules is described as following:
(I) Layer 1: fuzzification
Layer 1 implements the fuzzification of input variables and outputs the membership degree of fuzzy sets. As depicted in Fig. 4, a∼c are three input variables. A
j
∼C
j
(j = 1,2) are the corresponding fuzzy variables.
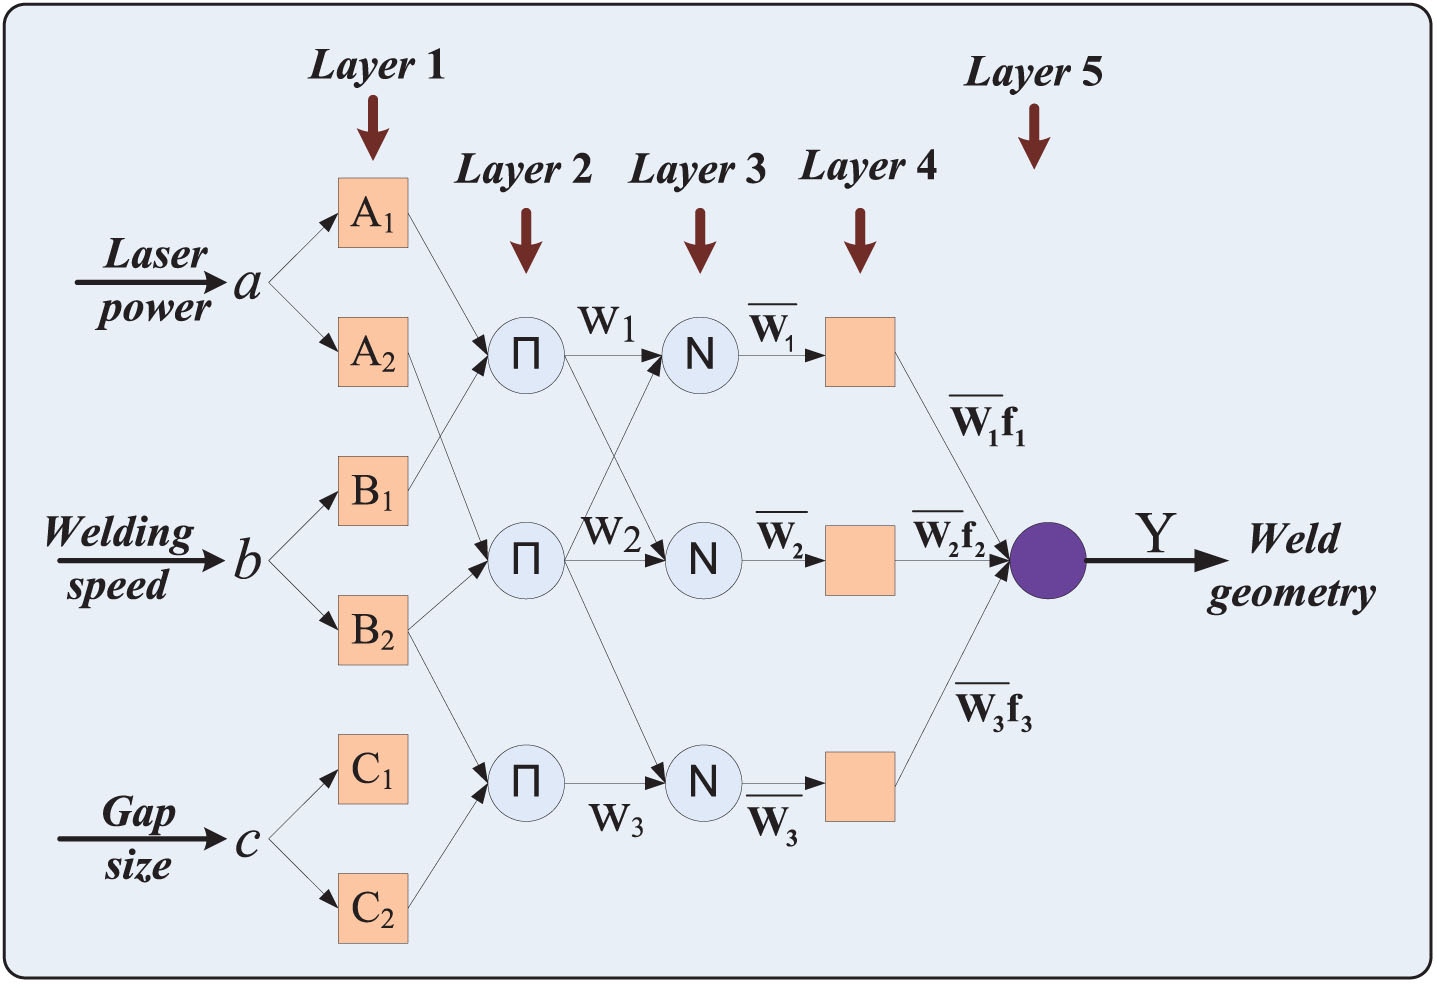
Schematic diagram showing five layer ANFIS structure for predicting the weld geometry.
(II) Layer 2: rule-based inference
Layer 2 calculates the incentive strength of different rules and the output expression can be described as in Equation (8):
(III) Layer 3: normalization
Layer 3 implements the normalization of the incentive strength, namely calculates the ratio of the incentive strength of each rule to the sum of all the incentive strength:
(IV) Layer 4: de-fuzzification
Layer 4 calculates the outputs of each rule which are expressed as:
(V) Layer 5: output
Layer 5 computes the final output of all rules after de-fuzzification process:
In this paper, a classics Takagi–Sugeno type of zero-order was selected in the FIS structure. The parameters of membership function, generalized bell (gbell) were initially assigned by ANFIS model utilizing MATLAB (R2016b) platform. Then the new FIS was generated implementing grid partitioning technique which clusters all the data sets and creates the rules accordingly. As shown in Fig. 5, the FIS model has three input variables and one output variable, and each input has three membership functions. The number of all fuzzy rules is 27 and the FIS model can calculate the final output after de-fuzzification process.
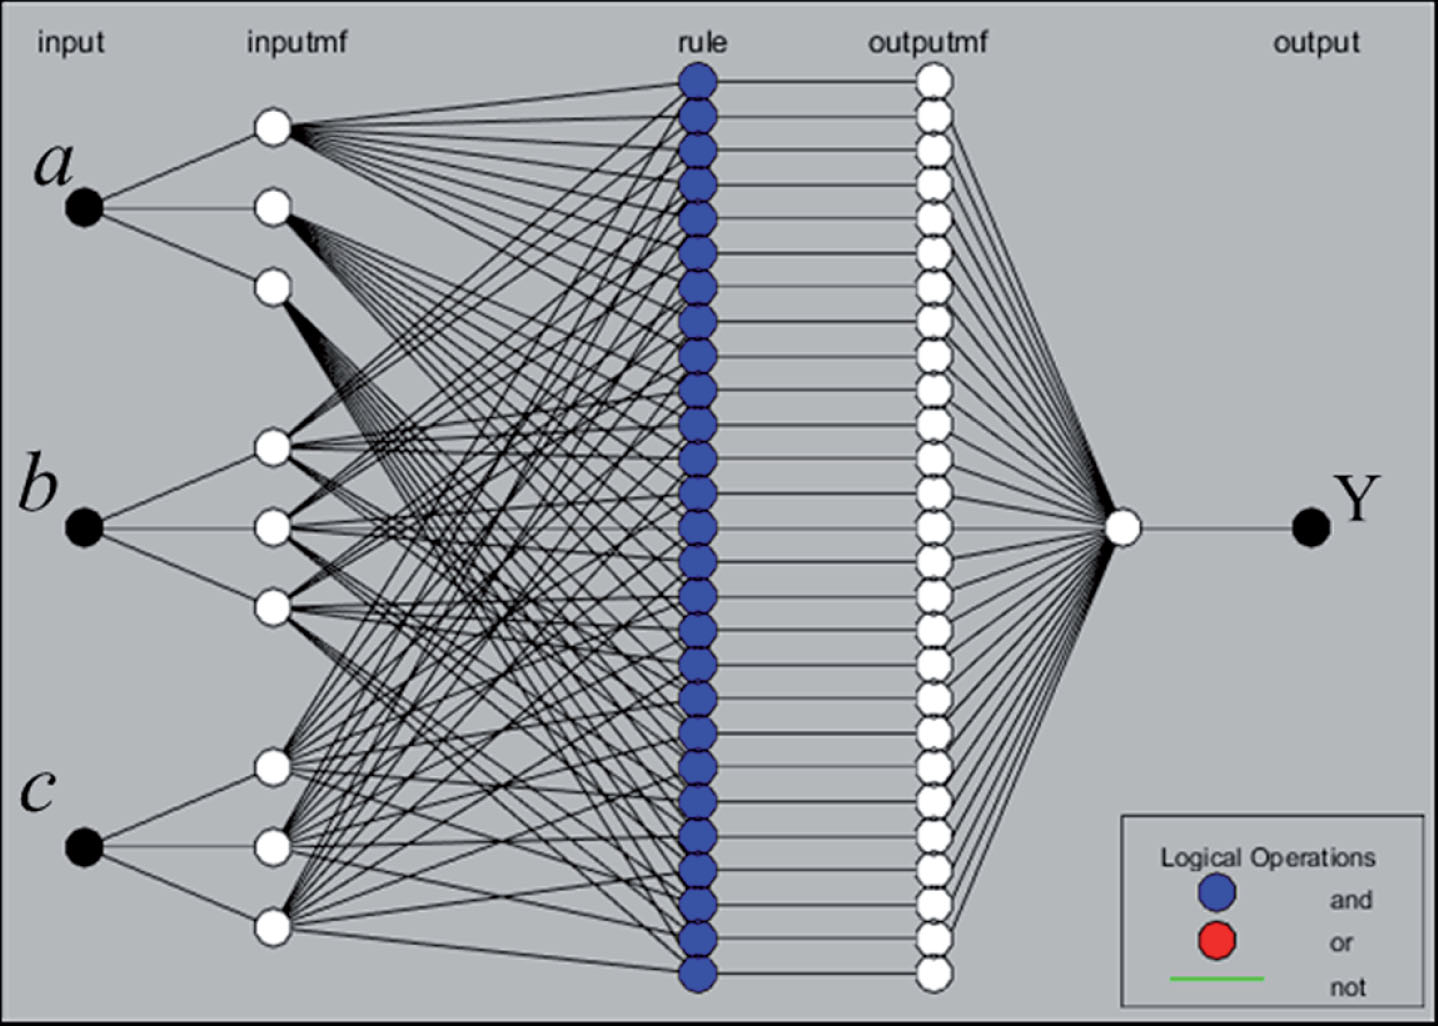
The structure of initial FIS model.
Comparison results between RSM and ANFIS models
The combination of back propagation and least square technique (hybrid optimization method) was applied for training the initial FIS structure, in order to yield a faster convergence and better results. The error tolerance value was fixed to 0.001. In order to obtain the optimized parameters of membership function, the data sets were trained through iterative training process (maximum epochs is 100) and the minimum error can reach 0.1044. Through the training of FIS model, the optimized ANFIS model could be used to predict the weld geometry subsequently.
Performance comparison between the predicted models
To evaluate the performance of ANFIS model in predicting weld geometry, the statistical model RSM was used for comparison simultaneously. The statistical indicators such as RMSE and MAPE were examined by Equations (12 and 13) respectively. According to the obtained 40 data sets (seen in Table 2), 30 training samples were randomly generated to train the model and then the rest 10 testing samples were applied to validate the prediction accuracy. In view of the randomness of experimental samples, different model were performed ten times, in order to calculate the mean prediction accuracy with the following assessment indicators:
Table 4 shows the comparison results between RSM and ANFIS models for estimating the weld attributes. It can be seen that the proposed ANFIS outperforms RSM in terms of weld sizes due to its lowest values of RMSE (0.414) and MAPE (6.232%). This is because that the intelligent nature of neural network and fuzzy-logic can make the ANFIS achieve very high prediction accuracy. Therefore, the obtained weld characteristics model based on ANFIS method can be adopted in the following numerical simulation analysis.
To further investigate the roles of welding parameters on weld appearance, a numerical simulation model was developed to accurately characterize the formation process of weld profile. Thus, a series of laser stake-welding experiments were conducted on the workpiece of thickness 3 mm and the section-macrograph of T-joint weld was obtained as shown in Fig. 3b. It is apparent that the obtained weld has the geometric shape of “inverted nail-head”, namely a large ratio of the weld penetration depth (WP) to surface weld width (SW). Besides, the interface weld width (IW) is also an important parameter determining the laser-stake T-joint quality.
Experimentation procedure
Through the analysis of heat transfer mechanism, the laser stake-welding process could be regarded as an issue of welding temperature distribution resulted from a heat source. Within a coordinate system displayed in Fig. 6(a), the heat source keeps moving from the starting point O to the ending point O’ in the direction of z-axis. Based on the differential equation of heat conduction, the temperature field of quasi-state stage during laser stake-welding is described as follows:
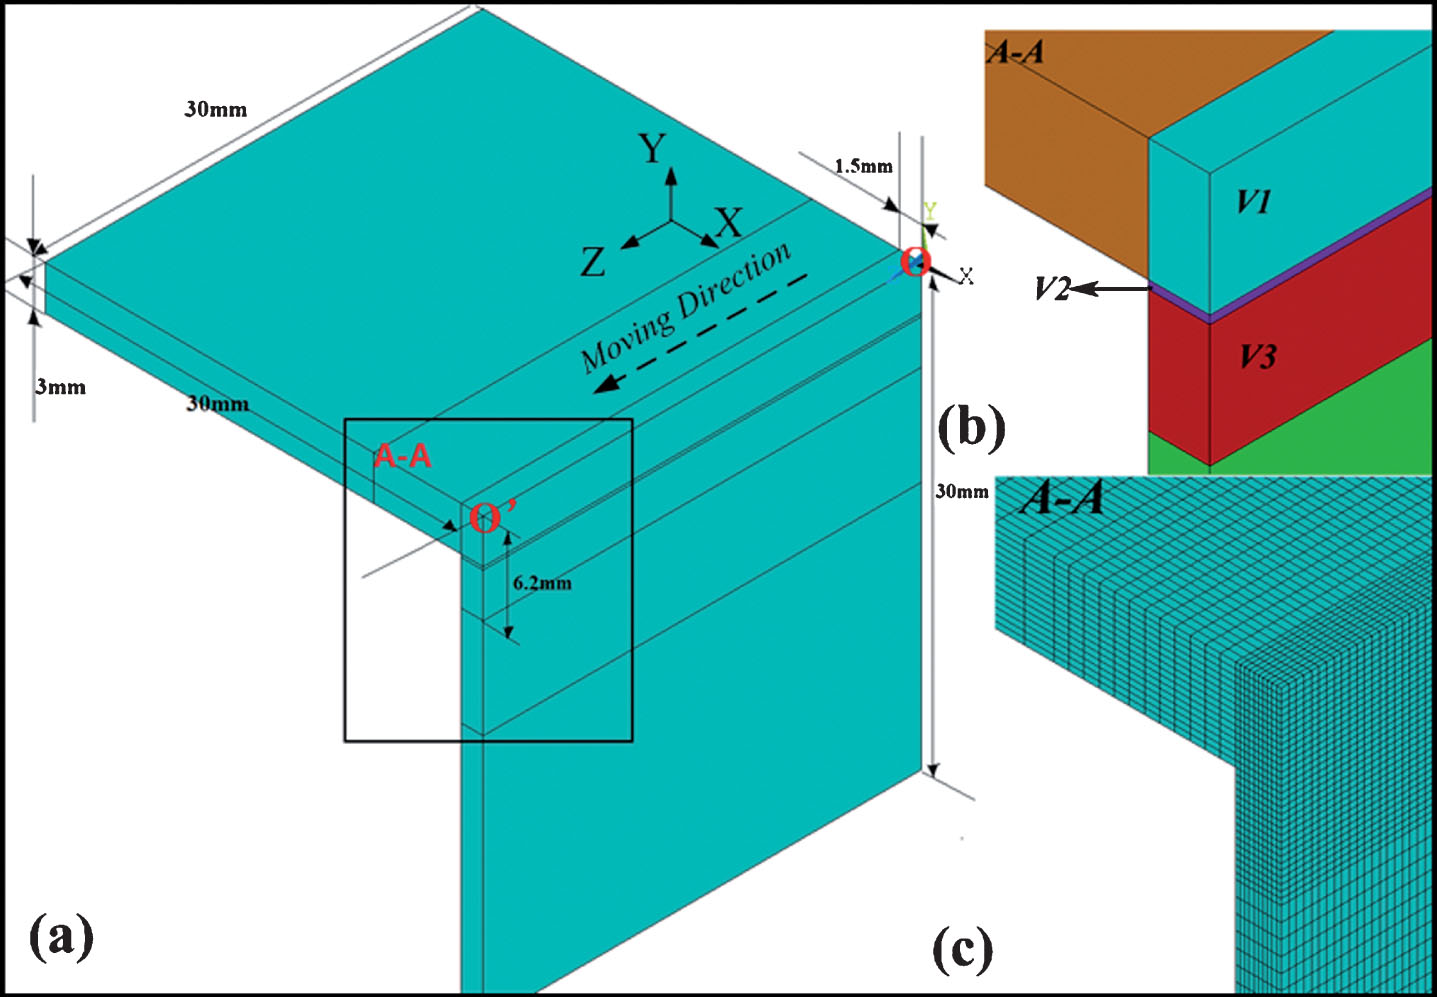
The finite element model of T-joint.
Because of the structural symmetry, half of the T-joint workpiece (Fig. 6a) was modeled for numerical simulation. The dimensions of the face and web plates were both 30 mm in length, 30 mm in width and height in 3 mm. To consider the assembly clearance between the face and web plates, a special air film layer (V2) in a certain thickness was designed. Besides, V1 and V3 denoted the weld zones of the face and web plates respectively (Fig. 6(b)). The domain was divided into a fixed number of 8-node 3D solid elements. The size of finer grids was 0.15×0.2×0.25 mm near the fusion center zone while the size of coarser grids was (1∼3)×0.2×0.25 mm away from it (Fig. 3c). The workpiece is AISI304 stainless steel and its chemical composition and thermo-physical material properties are shown in Table 5.
Chemical composition and material properties of AISI 304 stainless steel
(Note: TS: Solid temperature, TL: Liquid temperature, Tb: boiling temperature, ΔH: Latent heat).
In general, one key element of simulating the laser stake-welding process is to calculate the laser heat source Qlaser(x, y, z). To obtain a suitable and effective heat source, a series of available heat source models were applied in the laser welding. The temperature profiles utilizing finite-element analysis in the same laser stake-welding experiment were simulated to verify the validity of different models. In our study, the red region of the numerical simulation describes the shape of laser melted pool, namely the weld bead profile, because the liquid temperature of the workpiece is in the range of 1450∼2800°C. In addition, the gray center area represents the metal evaporation with the maximum temperature beyond 3000°C. As depicted in Fig. 7, some common heat sources e.g. double-ellipsoidal body, conical-Gaussian body and rotary-Gaussian body cannot predict the actual weld geometry accurately. The heat source of double-ellipsoidal body only produces partial penetration for T-joint weld, and the other two models can obviously improve the weld penetration, however the molten pool profile does not match the experimental result in Fig. 7(b) and 7(c).
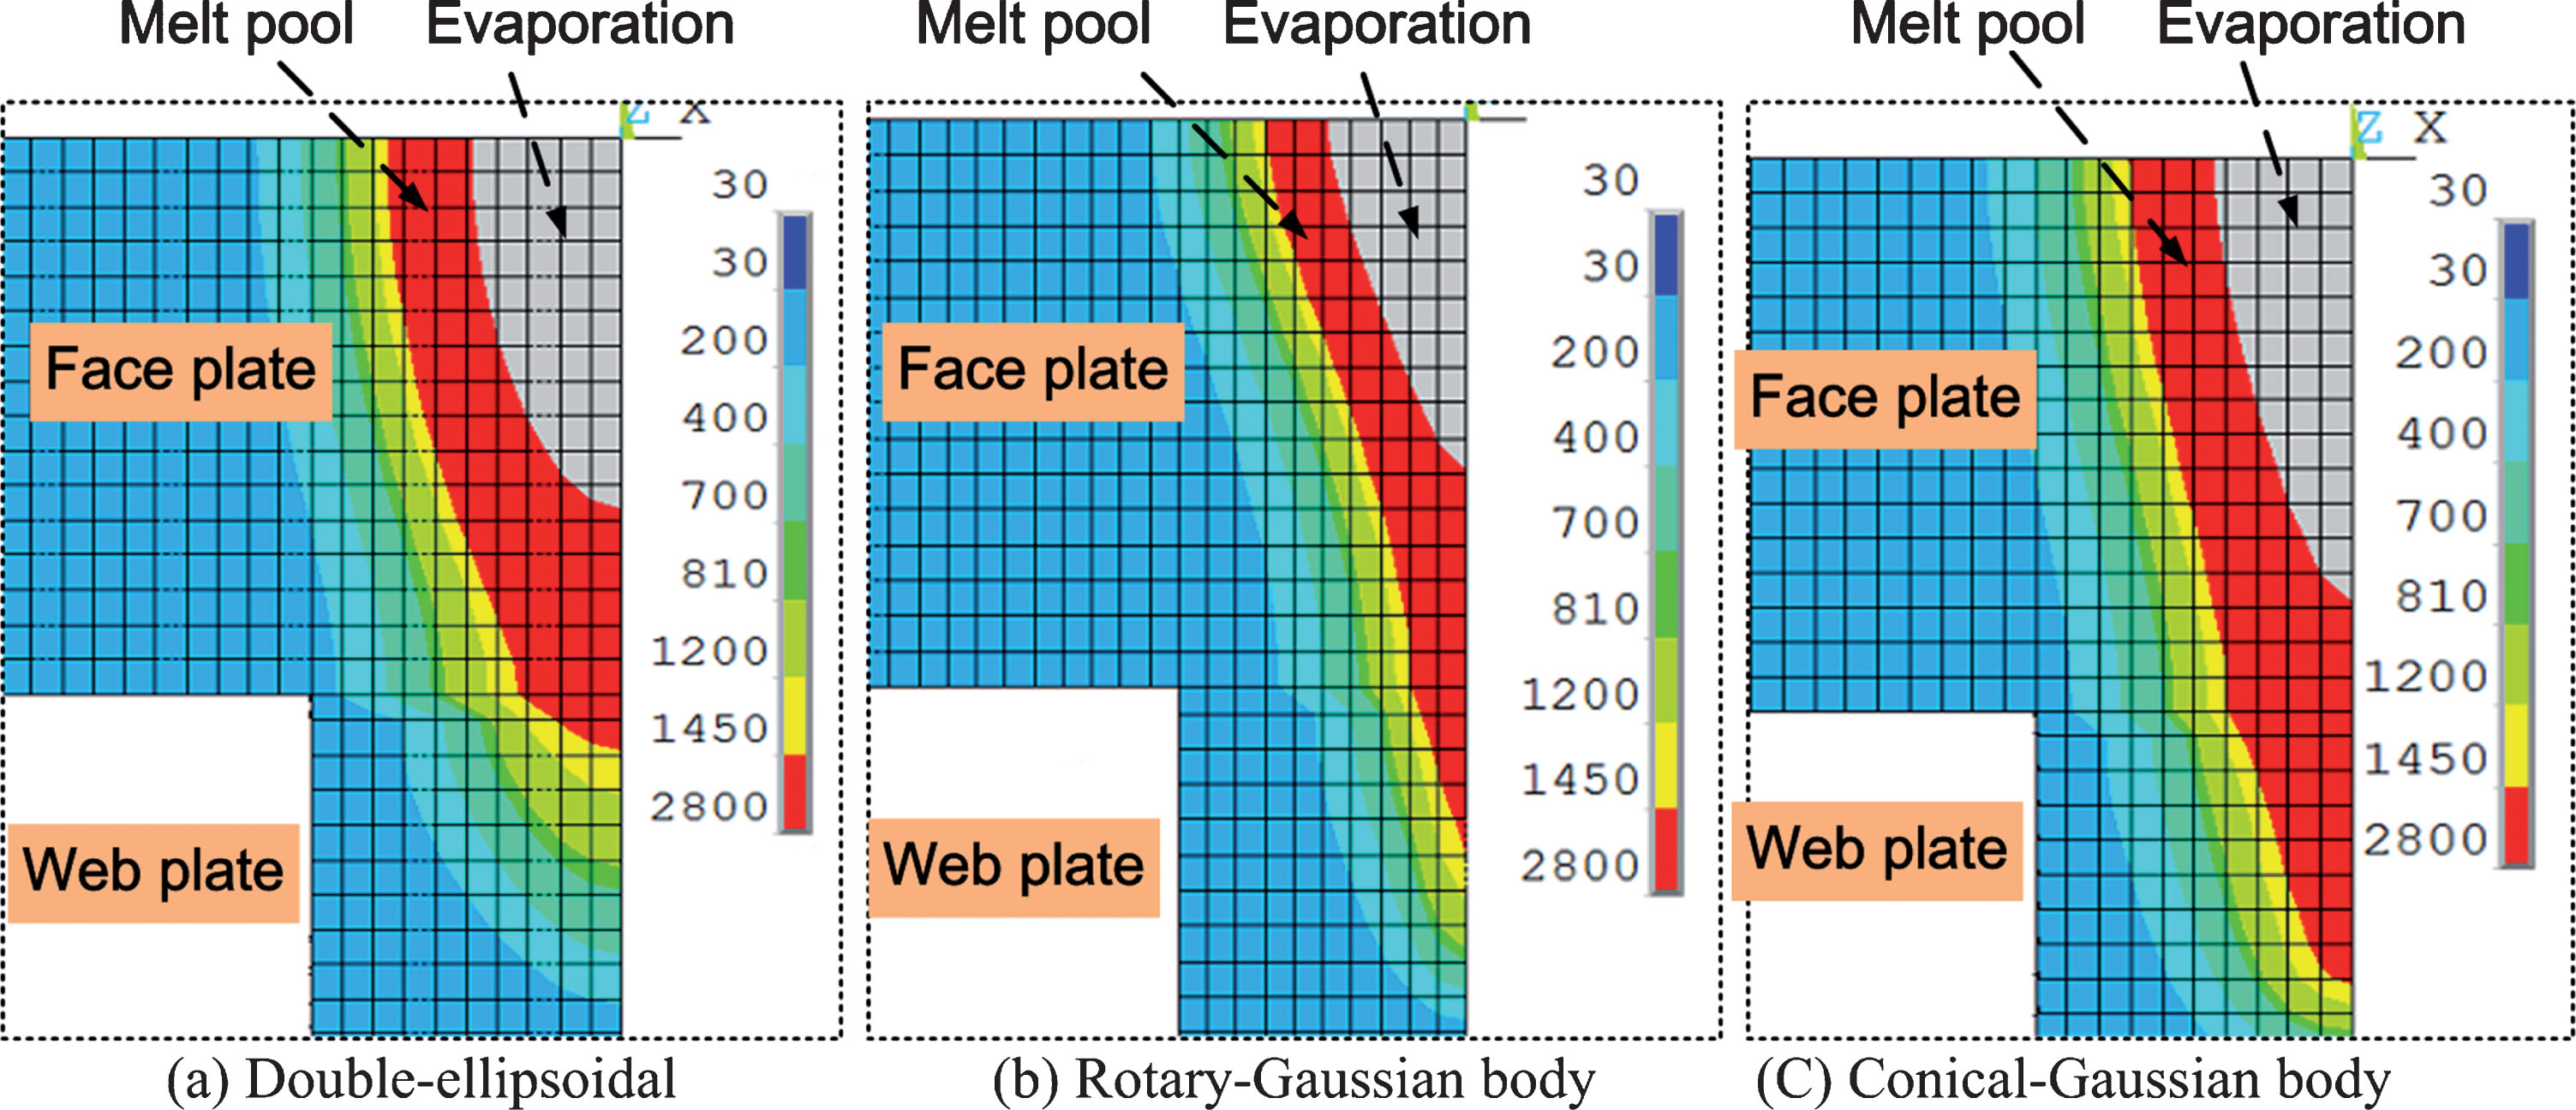
The simulated temperature field utilizing different types of heat source model.
As stated above, the laser stake-welding can obtain a resultant weld with a high aspect ratio, and the cross-sectional morphology of laser weld is in the form of “inverted nail-head” configuration. Considering the temperature profiles and weld pool shape are strong functions of the energy distribution of the laser beam, it is very critical to incorporate an exact definition of the heat source model. Therefore, we proposed a suitable three-dimensional hybrid heat source combing a rotary-Gaussian body with a cylindrical volumetric heat source to simulate the laser welding process. As illustrated in Fig. 8, the rotary-Gaussian body is set at the top of hybrid heat source model, and the cylindrical body is placed at the bottom along thickness direction. Then two individual heat sources are tightly coupled along the same centerline and move with the same velocity in the welding direction.
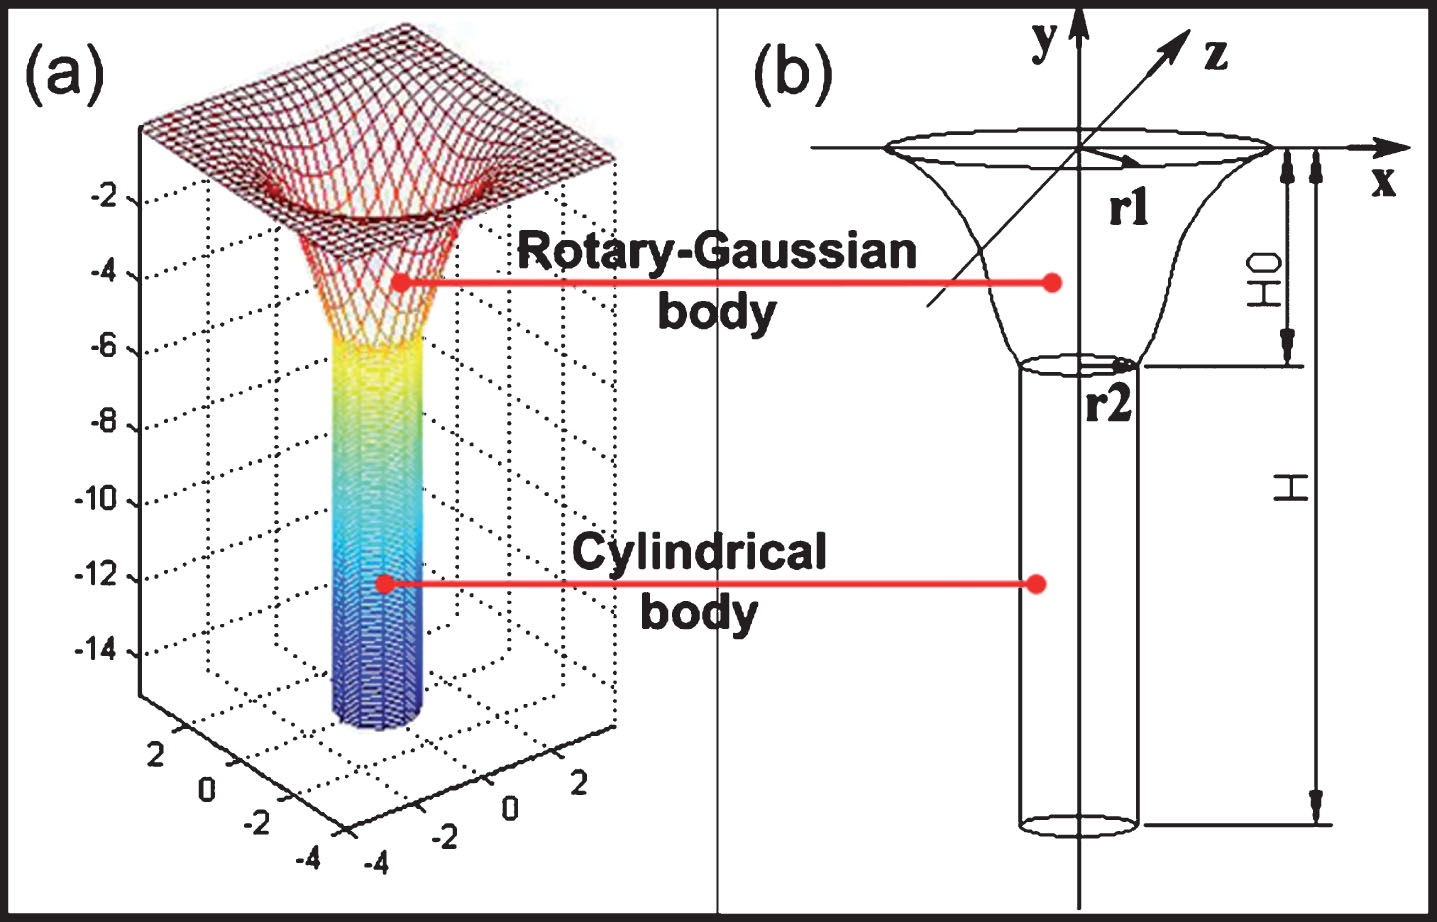
(a) Three-dimensional heat source and (b) characteristic parameters.
For the rotary-Gaussian heat source, the laser power density can reach the maximum value at the top surface and then decrease farther to the minimum value at the bottom of workpiece. The radius r of the power density distribution gradually decays to r2 from r1 according to Gaussian profile, and then keeps r2 constant. In the hybrid heat source model, r1 reresents the maximum radius of the rotary-Gaussian body and r2 denotes the radius of the cylindrical body. In addition, the laser heat density at the y-axis (central axis) keeps constant and the power density distribution at any plane perpendicular to the y-axis may be expressed as Equation (17):
Therefore, the characteristic parameter of heat source H1 can be expressed as (20):
For simplicity, the height of rotary-Gaussian body H0 was set as 1.2 mm. From the above analysis, the final hybrid heat source Qlaser(x,y,z) can be obtained as Equation (21):
The proposed hybrid heat source model will be applied to calculate the temperature field and weld profile in T-joint laser stake-welding. The commercial CFD software, ANSYS APDL technique was adopted to implement the numerical simulation. Figure 9 displays the contrast results between the numerical predicted and experimental weld profile under the different welding conditions (seen in Table 6). It is apparent that the predicted shapes of weld pool coincide with the actual shapes, and the difference error between them is around 3.21% ∼5.36%. Therefore, the proposed numerical model is quite satisfactory and effective to predict the weld profile and simulate the laser stake-welding process.
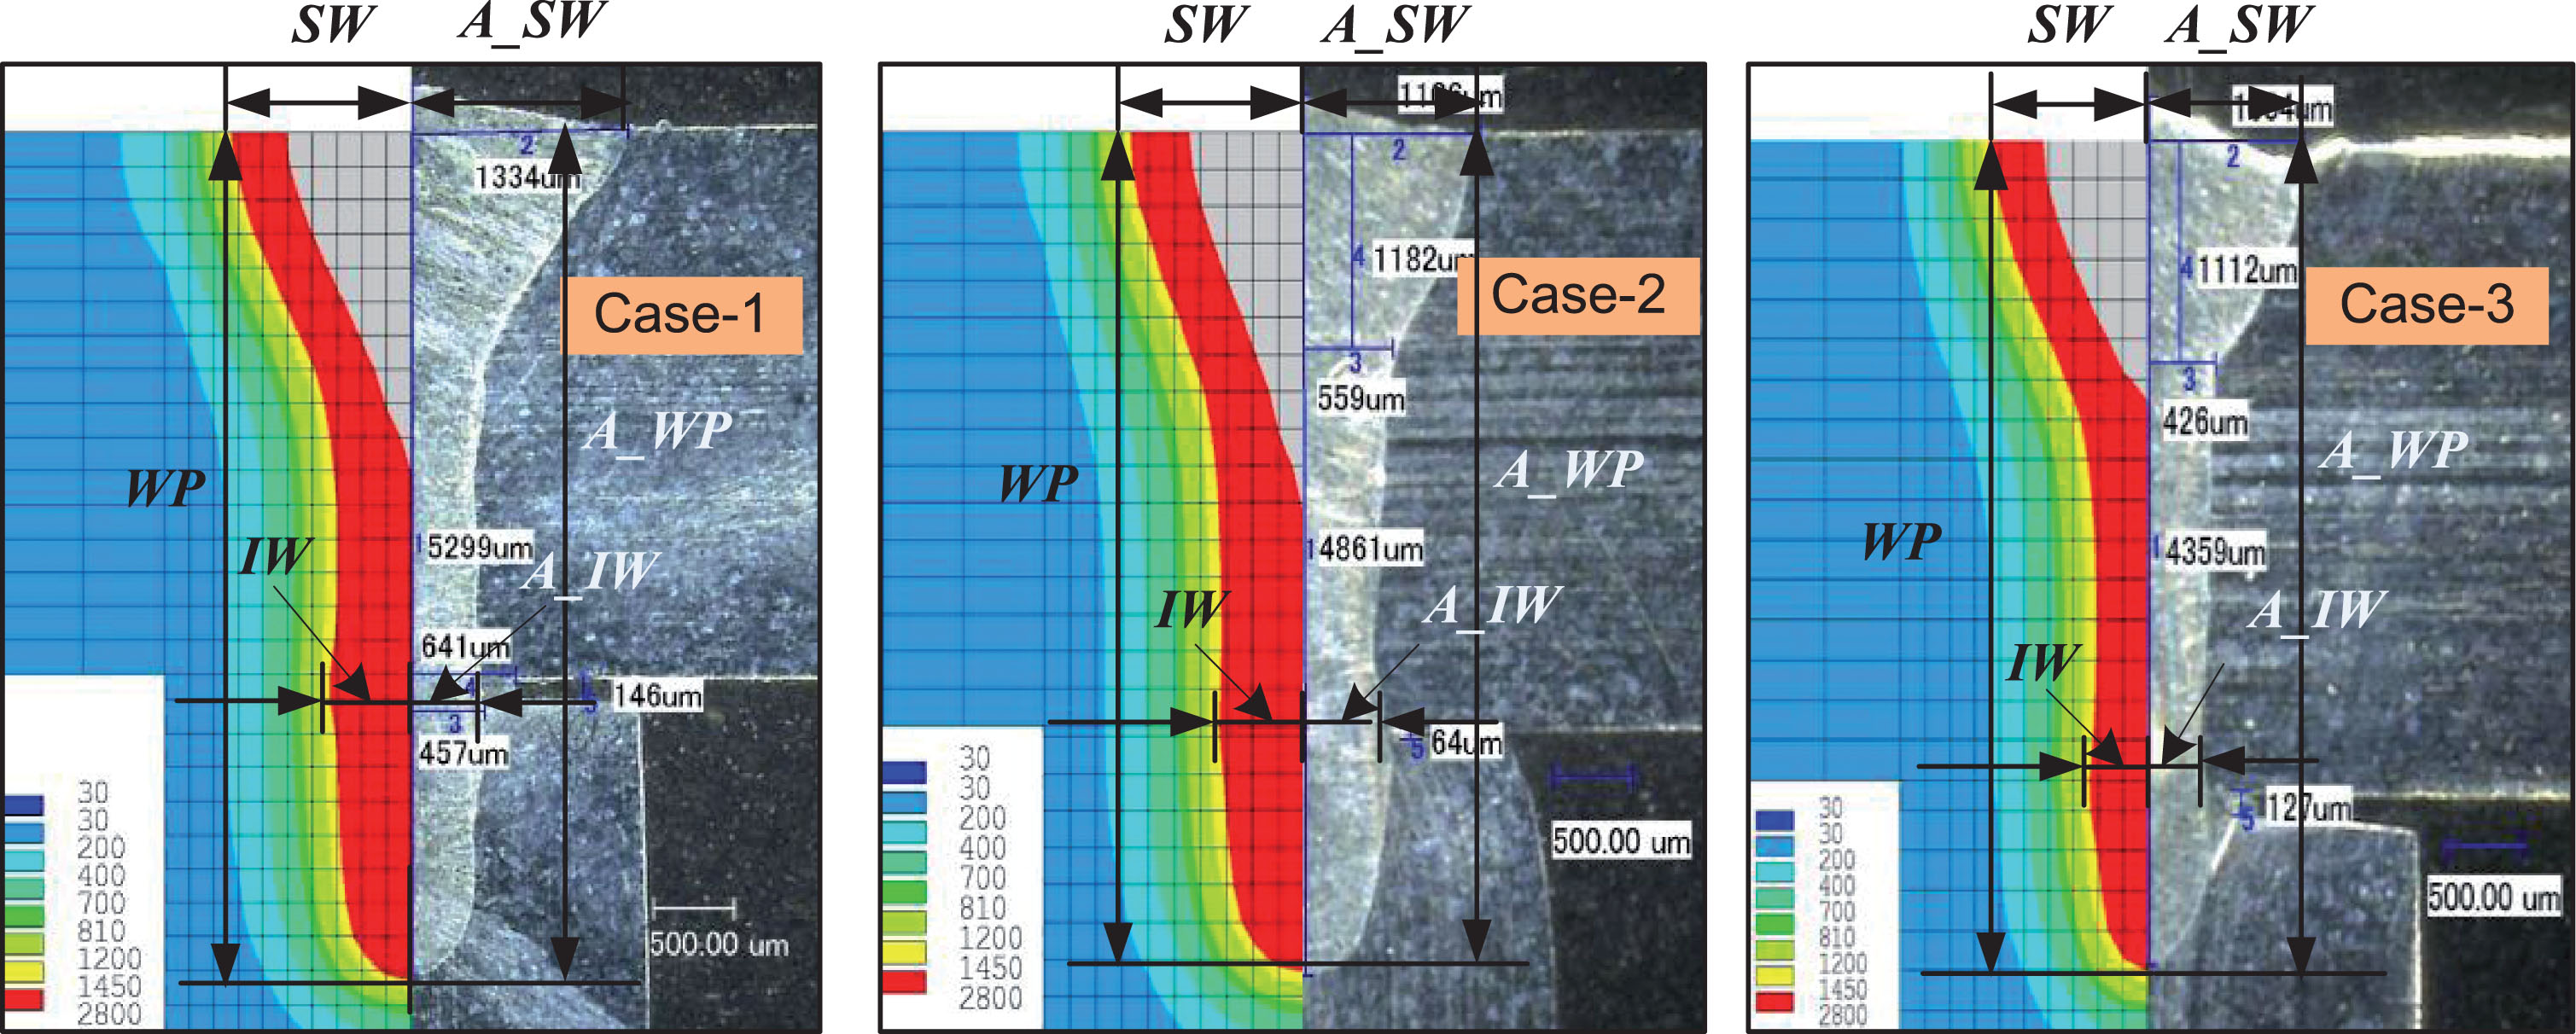
Results comparison between the numerical predicted and experimental weld profile.
Different parameters of laser welding process and the comparison results
In this section, the proposed numerical simulation model was applied to further analyze the influences of different technologic parameters on the weld profiles, which can better understand the formation mechanism of T-joints laser stake-welding process.
(1) Influence of laser power on the weld appearance
Figure 10 displays the variation of weld profiles which are produced by different laser powers and the other parameters keep constant. As the laser power increases from 3.0 to 4.5 kW, the higher laser power enhances the absorption of the plasma on the laser energy and produces abundant metallic vapor inside the keyhole, which will increase the weld penetration and weld width at interface consequently. Meantime, the weld width on top surface remains nearly constant. The results indicate that the laser power has a more a more evident impact on weld penetration (WP) and interface weld width (IW) comparing to surface weld width (SW).
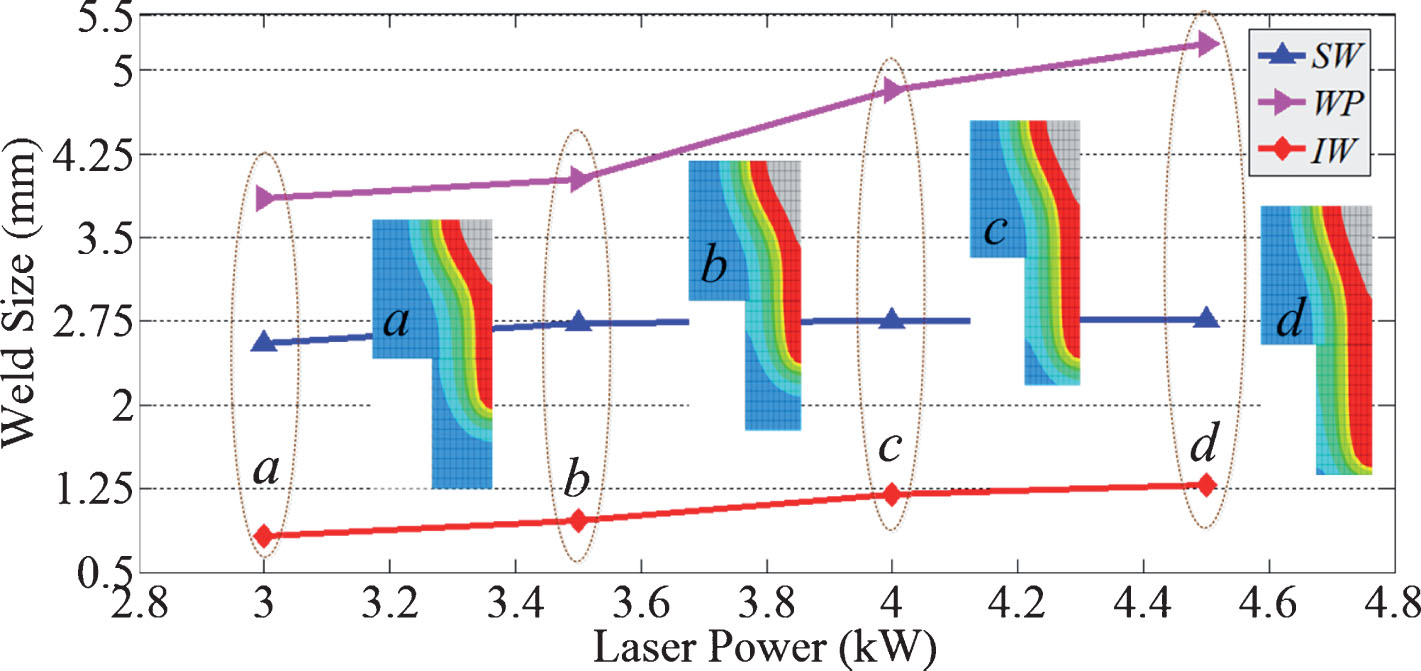
Effects of laser power on the weld geometry (welding speed V = 25 mm/s, gap size G = 0.15 mm).
(2) Influence of welding speed on the weld appearance
Figure 11 depicts the variation of weld profiles produced by different welding speed and other paramters keep constant. When the welding speed increases from 20 mm/s to 35 mm/s, the surface weld width (SW) has an obvious decreasing trend while the weld penetration (WP) and interface weld width (IW) show no remarkable change. This is because: with a decreasing of welding speed, large amounts of high-density plasma generates around the keyhole on the upper surface of face plate, and its absorbing effect of the plasma on the laser energy increases. It will form more molten metal at the top surface of face plate and increase the weld width subsequently. Therefore, the welding speed contributes more to the weld width (SW) compared to the weld penetration (WP) and interface weld width (IW).
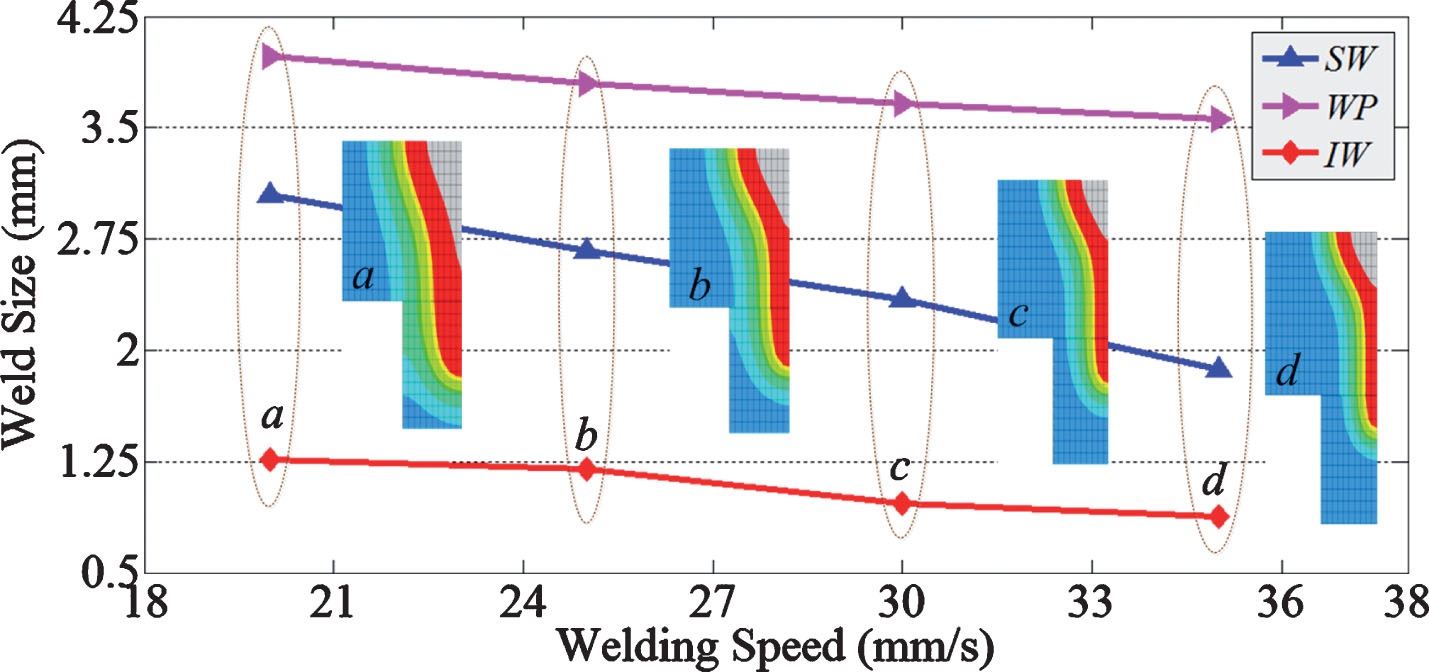
Effects of welding speed on the weld geometry (laser power P = 3.5 kW, gap size G = 0.15 mm).
(3) Influence of gap size on the weld appearance
In the practical production for metal sandwich panels, the gap between the face and web plates can easily existed due to some inevitable factors, i.e., the large dimension of welded sandwich panels, surface irregularities or burr on the panel surface. Thus, it is essential to take into account the influence of the gap size on the weld appearance. According to Fig. 12, as the gap size increases from 0 to 0.3 mm (the other parameters keep constant), it leads to wastage of laser energy at the gap and subsequent weakening of digging action of metallic vapor induced by the laser beam, which will make the final weld penetration (WP) decrease. Meantime there are more molten metal flow into the bigger clearance, the interface weld width (IW) exhibits a gradual increase accordingly, while the surface weld width (SW) shows little change. The results of detail view below clearly displays the molten pool at interface produces “drum-shaped” deformation, which further indicates that the interface weld width can be significantly affected by the gap size. When the gap size increases to exceed a certain critical value, the weld pool can hardly stably exist which may cause the defects of gas pore, surface depression etc.
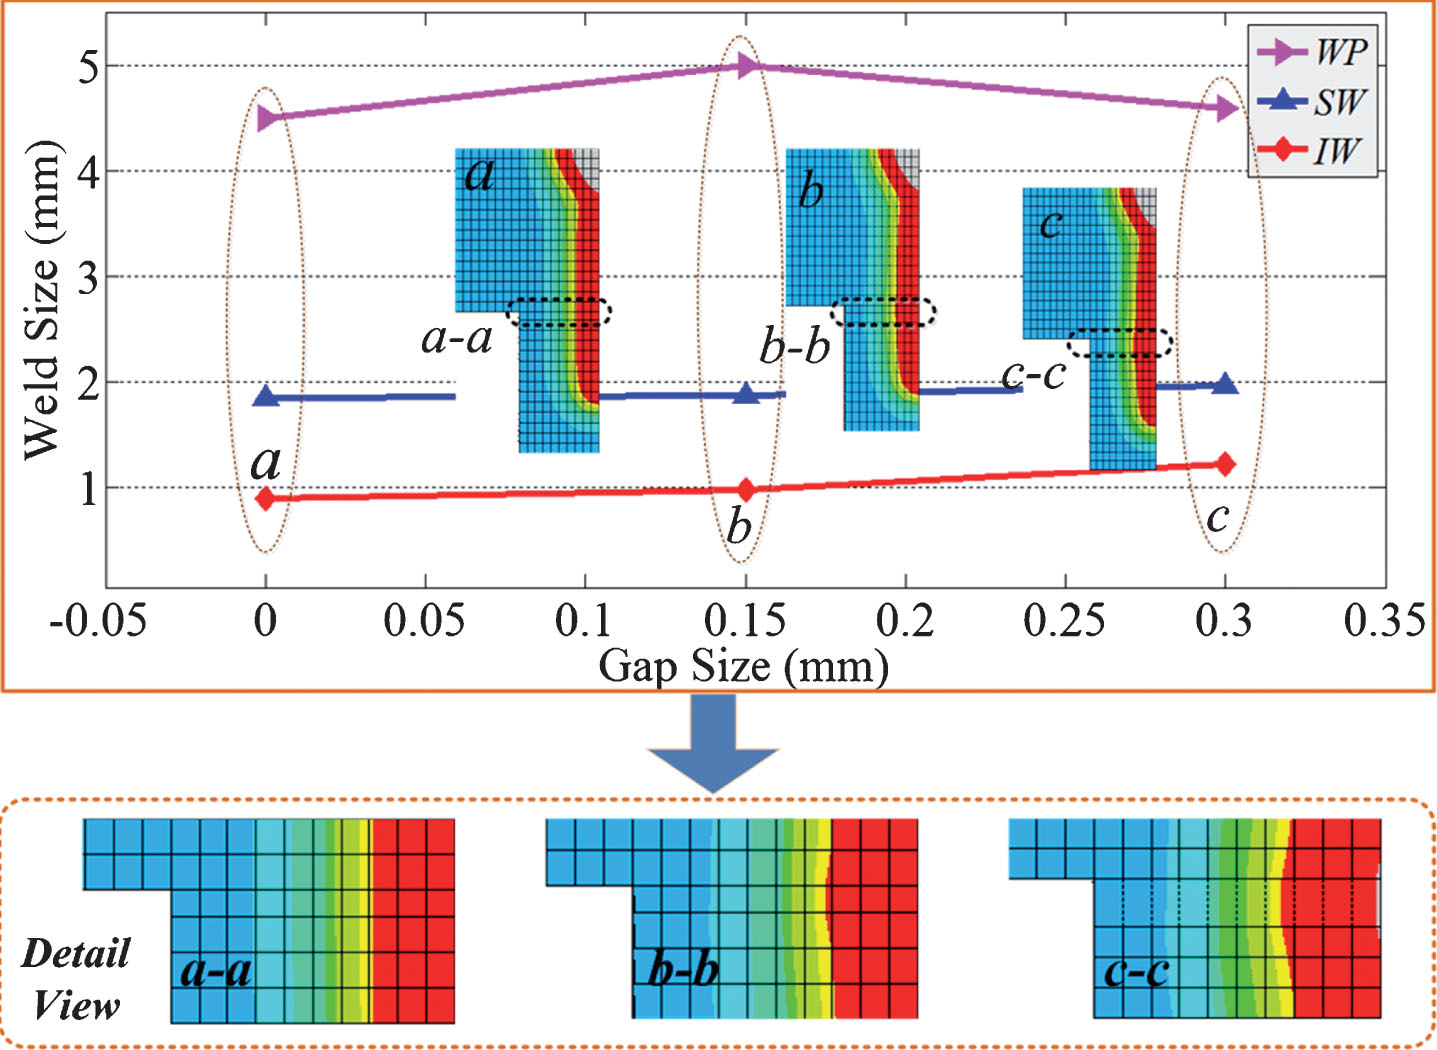
Effects of gap size on the weld geometry (laser power P = 3.5 kW, welding speed v = 30 mm/s).
Through analyzing above-mentioned aspects, it is apparent that the numerical simulation model can be utilized to accurately characterize and estimate the weld appearance during laser welding. The model and experiments show that the laser welding parameters have a considerable influence on the weld penetration, surface width and interface width. To further prove the adaptability and feasibility of the proposed numerical model, the effects of different plate thickness and weld offset size on the weld appearance will be considered in future research work.
In this study, a new hybrid methodology framework underlying the integration of ANFIS model and numerical simulation is presented to characterize and analyze the weld appearance. The conclusions can be drawn as follows: The developed ANFIS model can identify the relationship between the weld characteristics and process parameters, which outperforms RSM model in terms of the weld geometry with the lower values of RMSE (0.414) and MAPE (6.232%). Moreover, to obtain a more accurate ANFIS-based model for predicting the weld appearance, some heuristic algorithms such as artificial bee colony (ABC) and simulated annealing (SA) will be utilized to adjust the key parameters of ANFIS model in the future study. Based on the analysis of laser deep penetration stake-welding process, a suitable three-dimensional hybrid heat source is employed, which combines a rotary-Gaussian body with a cylindrical-shaped heat source. The critical parameters of the hybrid heat source can be accurately obtained via the ANFIS-based model; The temperature distribution as well as the weld geometric characteristics including the weld penetration, surface width and interface width can be described utilizing the numerical simulation. The predicted shapes of weld bead coincide with the actual shapes, and the difference error between them is around 3.21% ∼5.36%, which indicates the proposed numerical model is quite satisfactory to simulate the laser welding process. The influences of different technologic parameters upon the variation tendency of weld profiles are further characterized by the simulation model, which can achieve a more detailed understanding of generation characteristics of weld appearance.
Footnotes
Acknowledgments
The authors are grateful to the financial support of the National Natural Science Foundation of China under the Grant No. 51605276, 51805316, Shanghai Higher Education Young Elite Teacher Sailing-Plan (19YF1418100) and Zhejiang Key Project of Research and Development Plan (No. 2019C01114).