
Abstract
In this paper, a novel framework is proposed for fuzzy portfolio selection based on a combination between Data Envelopment Analysis (DEA) prospect cross-efficiency approach and the maverick index. Although DEA cross-efficiency evaluation is used to an effective tool for portfolio selection, no researcher has yet attempted to combine DEA cross-efficiency method with investors’ psychology in fuzzy portfolio selection. To address this problem, two novel prospect cross-efficiency models termed PCE (I) and PCE (II) are developed as the foundations for the construction of a novel fuzzy portfolio model. Because of the uncertain environment of financial market, the returns of assets are characterized as triangular fuzzy numbers. To make our models more comprehensive and practical, five criteria including mean, variance, semi-variance, skewness and entropy are employed in PCE models. Furthermore, based on the PCE evaluation, a novel mean-variance-maverick (MVM) framework is designed for fuzzy portfolio selection, in which the prospect cross-efficiency is viewed as return characteristic, maverick index and variance are considered as risk characteristics. The maverick index, as a novel risk measure, can be used as a good indicator for sensitivity to environment volatility in portfolio selection. Finally, a numerical example is provided to illustrate the effectiveness of our proposed models. The results show that our proposed approach can not only capture the risk attitudes of investors, but also permit well-diversified portfolios and higher risk-adjusted returns than other benchmark portfolios.
Keywords
Introduction
Portfolio selection involves the allocation of one’s wealth among different alternative assets to construct a satisfying portfolio. The mean–variance (MV) model originally proposed by Markowitz [1] has been accepted as the pioneer in the portfolio optimization problem. After Markowitz’s work, extensive works [2–5] have been done to improve and extend it, wherein the returns of assets are characterized as random variables. However, it is undeniable that there exist many non-probabilistic factors such as vagueness and ambiguity, which affect the financial market. Fuzzy set theory proposed by Zadeh [6] has been one of most powerful tools to handle the fuzzy uncertainty in portfolio problems. But one distinguished drawback of the theory is that the possibility measure is not self-dual. Liu and Liu [7–10] developed credibility theory in which the credibility measure is self-dual. Within the framework of credibility theory, many researchers developed different fuzzy portfolio models, such as fuzzy mean-variance model [11], mean-semivariance model [12], mean-variance-skewness model [13], and mean-variance- skewness-entropy model [14].
Alternatively, more and more attention has been paid to evaluating the performance of financial assets in recent years. There is an urgent demand to find a reliable tool to assess and distinguish different assets. Data Envelopment Analysis (DEA), as originally proposed by Charnes [15], is a non-parametric approach for evaluating the performance of decision-making units (DMUs), which has been widely applied in many fields [16–19]. In particular, the applications of DEA technique in portfolio efficiency analysis have attracted the attention of many scholars. Murthi et al. [20] first applied DEA technique to evaluate portfolio efficiency. Morey and Morey [21] proposed quadratic-constrained nonlinear DEA models, wherein the variance was regarded as an input and the mean as an output. Joro and Na [22] evaluated portfolio efficiency based on mean-variance-skewness framework. Branda [23] proposed the efficiency tests based on traditional DEA models and took into account portfolio diversification. Liu et al. [24] investigated the theoretical foundation of DEA models for portfolios, which further showed the classic DEA models could be an effective tool for portfolio performance evaluation. Zhou et al. [25] proposed a segmented DEA approach to evaluate the cardinality constrained portfolio performance. Banihashemi and Navidi [26] focused on portfolio performance evaluation by DEA approach in Mean-CVaR framework. Puri et al. [27] developed a new multi-component DEA approach using common set of weights methodology and imprecise data, which has been applied to evaluate banks in India for proving its effectiveness in the practical situations. Mehlawat et al. [28] employed DEA approach to develop a multi-objective portfolio model involving higher moments. Chen et al. [29] developed several DEA-based fuzzy portfolio evaluation models with different risk measures. Zhou et al. [30] proposed a DEA frontier improvement approach, which provided investors with a rebalancing strategy.
While DEA technique has the advantage in integrating multi-performance measures into a key index, weak discriminative power is one of the main drawbacks, wherein multiple DMUs may achieve the efficiency 1 and cannot be further discriminated. In fact, the traditional DEA models allow each DMU to evaluate its efficiency with favorable weights, which may result in unrealistic weight schemes. To address the problem of weak discriminative power, one of the most popular methods is the cross-efficiency evaluation, which was proposed by Sexton [31] as an extension to DEA. In cross-efficiency evaluation, the efficiency of each DMU is evaluated through two stages: self-evaluation and peer-evaluation. Numerous secondary goal models have been incorporated into the DEA cross-efficiency evaluation to improve the discriminative power. For instance, Doyle and Green [32] proposed the classical aggressive and benevolent models. Liang et al. [33] developed the DEA game cross-efficiency method. Wang and Chin [34] proposed four neutral DEA cross-efficiency models. Wu et al. [35] presented a cross-efficiency evaluation approach based on Pareto improvement. The above literature is based on the same assumption that the decision-makers (DMs) are completely rational. In fact, the idea that DMs’ psychology plays a critical role in the actual life has been accepted by the most people [36, 37]. Based on it, Liu et al. [38] investigated the cross-efficiency evaluation based on prospect theory proposed by Kahneman et al. [39], which first incorporated the risk attitudes into DEA cross-efficiency evaluation.
Due to the continuous development of DEA cross-efficiency evaluation and its own excellent characteristics, it has been extensively applied in many areas [40–43]. In particular, some scholars have studied the application of DEA cross-efficiency methods to portfolio selection. Lim et al. [44] developed a DEA mean-variance cross-efficiency model for portfolio selection. Mashayekhi and Omrani [45] proposed a novel multi-objective model, which incorporated the DEA cross-efficiency evaluation into Markowitz mean-variance model. That is, return, risk and efficiency were considered simultaneously. Essid et al. [46] developed a mean-maverick game cross-efficiency approach to portfolio selection, using the game cross-efficiency as return characteristic and the maverick index as risk measure. The maverick index, measures the deviation of (DMU) self-evaluation score from peer-evaluation score. It can be used as a good indicator for sensitivity to environment volatility. It indicates the index can be further used as a good indicator to measure the risk degree in portfolio selection. By incorporating the index into the traditional mean-variance framework, we can analyze the performance of financial assets more comprehensively and acquire a well-diversified portfolio.
Recently, the portfolio selection considering the behavior of investors has also received more and more attention. Tsaur [47] developed a fuzzy portfolio model that addressed different investor risk attitudes. Zhou et al. [48] also studied portfolio selection under different attitudes in fuzzy environment. Momen et al. [49] developed a behavioral portfolio selection model that used a robust estimator for expected returns. To the best of our knowledge, the existing cross-efficiency approaches applied in portfolio selection area generally fall in the expected utility theory, wherein the attitudes of investors are not considered. The utility theory assumes that investors are extremely rational in the decision-making process. However, this is not always true because of the significant influence of human psychological factors on the portfolio selection problem. The necessity for improved DEA cross-efficiency approach considering the attitudes of investors has been established. Therefore, to address the problem stated above, it motivates us to incorporate the DEA prospect cross-efficiency evaluation into the portfolio selection and construct a reasonable fuzzy portfolio selection model.
In this work, in order to incorporate the attitudes of investors into DEA cross-efficiency evaluation, we firstly focus on constructing two novel DEA prospect cross-efficiency models termed PCE (I) and PCE (II). These PCE models will serve as the foundations for the construction of a novel fuzzy portfolio selection model. By using the PCE evaluation, we can not only capture the attitudes of investors, but also evaluate the performance of financial assets more in line with the actual situation. Furthermore, to design a reasonable portfolio selection model, in addition to consider mean-variance framework based on the PCE evaluation, the maverick index is also used as a consistent risk measure to construct a well-diversified portfolio selection. As an illustration of our approach, an empirical case is provided and some comparative analysis with existing approaches is performed. On the one hand, compared with the traditional cross-efficiency models, the proposed PCE models can cover more possible cases and are consistent with actual preferences of investors. On the other hand, compared with other portfolios, the proposed mean-variance-maverick model permits more diversified portfolios and higher risk-adjusted returns.
The rest of the paper is structured as follows. Section 2 introduces preliminaries and basic knowledge concerning the credibility theory, DEA cross-efficiency evaluation and the prospect theory. Section 3 is devoted to constructing some novel prospect cross-efficiency models in which the risk attitudes of decision-makers are considered. Section 4 develops a novel mean-variance-maverick (MVM) framework for fuzzy portfolio selection based upon the prospect cross-efficiency evaluation. Section 5 provides a numerical example to demonstrate the effectiveness of our proposed models. The conclusion of this paper is summarized in Section 6.
Preliminaries
Credibility theory
In this section, some concepts and main results of credibilistic theory proposed by Liu [7–10] are reviewed.
In particular, if ξ has continuous membership function μ, we have
The expected mean:
The variance:
The skewness:
The semi-variance:
The fuzzy entropy:
and
As a good alternative to DEA self-evaluation, DEA cross-efficiency evaluation considers simultaneously self-evaluation and peer-evaluation, enhancing discriminative power. There are at least three major advantages of cross-efficiency evaluation: (1) ranking the DMUs in a unique order [50], (2) eliminating unrealistic weight without presetting any weight restrictions [51], (3) effectively distinguishing good and bad performers from the DMUs [52]. In this subsection, we briefly review the main principles of DEA cross-efficiency evaluation.
Self-evaluation (CCR model)
Suppose that there are n DMUs to be evaluated. DMU
k
(k = 1, 2, ⋯ , n) has a m - dimensional input vector
Where u
rk
and v
ik
are the output and input weights associated with DMU
k
under evaluation. When the above model is solved, the optimal weights and CCR-efficiency of DMU
k
can be obtained. Let
The cross-efficiency score of DMU
l
(evaluated by DMU
k
) is formulated as follows:
The average cross-efficiency of DMU
l
is calculated as follows:
In fact, one drawback of the above-mentioned methods is that multiple optimal solutions may appear in CCR model, which would result in non-unique cross-efficiency scores of DMU k . To remedy the shortcoming, two classical models were developed as follows [32]:
The benevolent cross-efficiency model:
The aggressive cross-efficiency model:
In the financial area, the maverick index is an effective tool for measuring the false positiveness of financial assets. Proposed by Doyle and Green [32], the maverick index is used to measure the degree of deviation between the self-evaluation score and the peer-evaluation score. The higher the value of the index, the more easily the DMU is treated as pseudo-effective. In contrast, the lower the value of the index, the more acceptable the final evaluation score. Under the framework of DEA cross-efficiency evaluation, the maverick index score of DMU
k
is defined as follows [46]:
It’s worth noting that some DMUs with the highest cross-efficiency scores do not always have the least maverick scores. Those DMUs with high maverick values only perform well on few of the agreed upon factors, which makes their scores and rankings very sensitive to the changes in the environment. As a result, those DMUs with high maverick values would suffer from greater risk and their evaluation results would be unreliable. From this perspective, the maverick index can be used as a good indicator to measure the risk degree. Essid et al. [46] showed that the maverick index is also an important factor to evaluate the overall performance of financial assets. Selecting a financial asset with a high maverick index may result in a portfolio that is highly sensitive to environmental changes. In other words, the higher the maverick index of a portfolio, the more risky is the portfolio. In this work, a novel mean-variance-maverick (MVM) framework of portfolio selection based on DEA cross-efficiency evaluation is constructed in the subsequent sections.
Prospect theory, as originally proposed by Kahneman [39], is a powerful descriptive theory, which effectively combines psychological research with economic research. It mainly involves the following three principles: (1) Reference dependence; (2) Loss aversion; (3) Diminishing sensitivity.
There are many forms of the asymmetric S-shaped value functions that conform to the above three principles. In the paper, we employ the prospect value function proposed by Kahneman [34] as the model construction foundation. It can be described as follows:
In this section, in order to incorporate the attitudes of investors into DEA cross-efficiency evaluation, we focus on constructing some novel DEA prospect cross-efficiency models based on prospect theory. As mentioned in Section 2.3, the prospect theory reveals that the selection of reference points has a significant impact on the prospect value function. Firstly, some special reference points are introduced to derive the prospect values of the DMU. Secondly, we would attempt to construct the basic framework of the prospect cross-efficiency (PCE) evaluation.
Improvements of different reference points and the prospect values
The above two definitions are described in the literature [38], which are two extreme situations of decision-makers’ psychology. The DM can be considered as completely positive when selecting the worse DMU as the reference point. On the contrary, he/she can be treated as thoroughly pessimistic when selecting the best DMU as the reference point.
However, some psychological studies have shown that the DM might hold positive and pessimistic tendencies simultaneously [53, 54]. Therefore, in this paper, we propose a novel definition to derive the prospect gain and loss values based on a different reference point, which is more consistent with reality.
Besides, the prospect loss values with respect to i - th input and r - th output of DMU k are defined as:
The novel general framework of the prospect cross-efficiency models
The DM always pursues a set of optimal input and output weights to maximize the gains while minimizing the losses of DMU
k
. The two objectives are formulated as follows:
Take the above two objectives into the DEA cross-efficiency model, and then a new model can be constructed as follows:
By the weighted max-min approach, we can convert the above two-objective model into an equivalent single-objective one as follows:
The model (33) is termed the general framework of the prospect cross-efficiency (PCE) model, where w represents the DM’s psychological preference satisfying 0 ≤ w ≤ 1. According to the different values of w, three different risk preferences of DMs can be characterized as follows: If 0 ≤ w ≤ 0.5, the DM will pay more attention to losses than gains. If w = 0.5, the DM will treat the gains and losses equally important. If 0.5 < w ≤ 1, the DM will pay more attention to the gains.
Because of the considerable consistency between prospect theory and the actual behavior of the decision makers, decision-making methods based on prospect theory have received more and more attention. In our work, we have developed an improved DEA cross-efficiency approach based on prospect theory. The prospect cross-efficiency (PCE) model can characterize the psychological factors in the DEA cross-efficiency evaluation process, which can be seen as an extension to the traditional DEA cross-efficiency models. In other words, the traditional DEA cross-efficiency models assume that decision makers (DMs) are completely rational and their decision-making process is not affected by psychological factors. It indicates that the PCE model is more consistent with the actual behaviors in the cross-efficiency evaluation process. Furthermore, the PCE model has strong power in discriminating among the DMUs by the secondary goal for cross-efficiency evaluation. In the meanwhile, due to no using the information of other DMUs, PCE model can maintain certain fairness and democracy. Therefore, it is more realistic to select PCE model to evaluate DMUs, which also avoids the difficulty of choosing the benevolent or aggressive models in some degree.
Particularly, we can derive some special prospect cross-efficiency models based on different reference points and prospect values mentioned in subsection 3.1.
According to the definitions of the prospect values in Definitions 3.1.1-3.1.2, we apply them to model (33), and then we can derive the prospect cross-efficiency model (I):
According to the definitions of the prospect values in Definition 3.1.3, then we can derive the prospect cross-efficiency model (II):
We have noted that the two PCE models can fully integrate the psychology of the DMs into the DEA cross-efficiency evaluation by setting four different parameter values α, β, θ, w . The first two parameters α and β are risk attitude coefficients, and α, β ∈ (0, 1) . The parameter α shows the concave degree of the value function within the gain region. Corresponding, β presents the convex degree of the value function within the loss region. The larger the values of α and β, the more the DM is inclined to risk-seeking. In this way, the evaluation results of PCE models are relatively adventurous. Conversely, when these two values of α and β tend to 0, the evaluation results of PCE models would be considerably conservative. The third parameter θ is the loss-aversion coefficient and θ > 1 . The larger the value of θ, the more sensitive the DM is to the loss. The fourth parameter w represents the DM’s psychological preference and 0 ≤ w ≤ 1. For convenience, we would explore the effects of different attitudes on the prospect cross-efficiency (PCE) evaluation results by altering the value of the single parameter w while fixing the values of other three parameters. This is because we can get similar conclusions when changing the values of other parameters.
To the extent of our knowledge, the application of DEA cross-efficiency technique in portfolio selection in existing literature is based on expected utility theory, ignoring people’s psychological factors. Therefore, this motivates our development of a novel framework of portfolio selection based on the PCE evaluation.
In this section, we would attempt to apply the PCE approach to the fuzzy portfolio selection. The previous literature [44] has shown that the simple use of DEA cross-efficiency evaluation in portfolio selection can lead to two problems: the first is the lack of portfolio diversification and the second is the ganging-together phenomenon. To address the above issues and take into account the DM’s different risk attitudes at the same time, we develop a novel mean-variance-maverick (MVM) framework for fuzzy portfolio selection based on PCE evaluation.
Some formulas for return and risk characteristics
For DMU
i
(Asset i), the return characteristic can be defined as its prospect cross-efficiency score
Suppose that there are n assets and the return rate of asset i is considered as a triangular number ξ
i
= (a
i
, b
i
, c
i
). Let x = (x1, x2, ⋯ , x
n
)
T
be the investment proportion vector. Then, the return characteristic for the portfolio Ω can be as follows:
Besides, let V
Ω
be the first risk measure for the portfolio Ω, the formula can be given by
As can be seen from the above formula (37), V Ω measures the overall risk for the portfolio Ω.
Moreover, we incorporate the weighted average maverick index into the proposed portfolio Ω as the second risk measure. ESSid et al. [46] pointed out that the maverick index is a good indicator to measure environment volatility in portfolios. The formula is given by
In this subsection, we construct a novel mean-variance-maverick (MVM) framework for portfolio selection based upon the PCE evaluation. We maximize weighted prospect cross-efficiencies (E
Ω
) while minimize the above two risk measures (V
Ω
andI
Ω
). The optimal portfolio Ω* can be determined by solving the following multi-objective optimization model:
The decision-maker’s risk attitudes are implied in the MVM model, which are embodied in the above three objectives. Before solving the MVM model, we need to determine the values of
To demonstrate the empirical effectiveness of the proposed method, we implement a numerical example in the section. Firstly, the PCE models developed in Section 3 are utilized to evaluate cross-efficiency within several selected financial assets. Secondly, we further compare the proposed PCE models with the traditional DEA cross-efficiency models. Thirdly, the evaluation results of PCE models with different risk attitudes are applied to construct the proposed MVM models. Finally, some comparative analysis with several benchmark fuzzy portfolio models is conducted.
Data collection and processing
We choose 10 assets from Shanghai Stock Exchange, whose codes are 600115, 600354, 600419, 600563, 600681, 600721, 601009, 601398, 601939, and 601988, respectively. For convenience of description, The 10 assets are denoted successively as Asset 1, 2, 3, 4, 5, 6, 7, 8, 9, and 10. The original data from weekly closing prices are collected in three years from January 2015 to January 2018. After simple processing, we convert the return rates of 10 assets into triangular fuzzy numbers in Table 2.
Cross efficiency matrix C = (e
kl
) n×n
Cross efficiency matrix C = (e kl ) n×n
Triangular fuzzy returns of 10 assets
Several studies [23–25] suggested applying deviation measures of assets as the inputs and return measures as the outputs. To analyze the performance of the10 assets, we have considered five important criteria: mean, variance, skewness, semi-variance and entropy of triangular fuzzy numbers based on credibility theory. Among these, mean and skewness are considered as outputs, while variance, semi-variance and entropy are considered as inputs. According to the calculation formulas (8–12), the corresponding results have been presented in Table 3.
Mean, skewness, variance, semi-variance and entropy of 10 assets
Mean, skewness, variance, semi-variance and entropy of 10 assets
It is worth noting that the negative data may arise based on the above input and output criteria in Table 3. It is well known that CCR model cannot deal with negative values directly. Therefore it is necessary to perform data transformation. Applying data transformation would retain the efficiency classification, which would not affect the model construction. The formula for negative data transformation can be defined as follows [41]:
In the above expression, V
k
is the original negative input or output variable k,
Converted inputs and outputs of 10 assets
Results of the PCE (I) model and PCE (II) model
In this subsection, we calculate the prospect cross-efficiency of 10 assets using the PCE (I) and PCE (II) model, respectively. The application steps of the proposed method are shown as follows:
Step I. Self-efficiency evaluation
According to the converted inputs and outputs of 10 assets in Table 4, the self-efficiency scores of 10 DMUs are calculated by CCR model, and the corresponding evaluation result is presented in the last column of Table 4. It can be seen that the self-efficiency scores of three assets (DMU2, DMU4 and DMU5) achieve the value 1, which indicates CCR model cannot effectively rank all the DMUs in a unique order. Therefore, as the next step, the PCE models are utilized to calculate the cross-efficiency score of each DMU and further distinguish the DMUs.
Step II. Prospect cross-efficiency evaluation
PCE models can fully integrate the psychology of the DMs into the DEA cross-efficiency evaluation by setting four different parameter values α, β, θ, w . In this work, different values of the single parameter w are considered to illustrate the characteristics of prospect cross-efficiency evaluation. Here we might as well assume that the values of the other three parameters α, β and θ are 0.8, 0.4, and 3, respectively. When the PCE models are solved, the optimal input and output weights can be obtained. Furthermore, the prospect cross-efficiency scores of DMUs can be obtained by the formulas (20)-(21). Tables 5-6 have shown the variations of evaluation results of PCE (I) and PCE (II) model under different psychological preferences of the DM.
From Table 5, we can find that the most efficient DMU in the PCE (I) model is DMU4 when the values of w are 0.0, 0.2, 0.4, 0.6 and 0.8, whereas it becomes DMU2 when the value of w is 1.0. The evaluation results seem less sensitive to the different values of w from 0.0 to 0.8 in Table 5. Except DMU2 and DMU4, the rankings of other DMUs remain unchanged under different values of w.
The evaluation results of PCE (I) model under different values of w
The evaluation results of PCE (I) model under different values of w
It can be seen that the evaluation results in Table 6 are more sensitive to the change of parameter w and the change tendency is more obvious. As the value of w increases, the evaluation efficiency score of each DMU in the PCE (II) model also increases. Moreover, the most efficient DMU changes from DMU4 to DMU2. When w takes 0.0 and 0.2, DMU4 is the most efficient, while w takes the values of 0.4, 0.6, 0.8 and 1.0, DMU2 is the most efficient DMU.
The evaluation results of PCE (II) model under different values of w
Here we briefly explain the results in Tables 5-6 from the perspective of the underlying meaning of w. It represents the DM’s psychological preference in the PCE evaluation. With the increase of the value of w, the DM would be more positive toward the outcomes. In fact, Table 3 has shown that DMU2 outperforms DMU4 in terms of mean, variance, semi-variance, entropy, which in general draw more attention from DM than skewness when DM becomes increasingly positive. Therefore, the change tendency is natural and reasonable.
In the meanwhile, to demonstrate the validity of the proposed PCE evaluation, we further implement some comparative analysis. The evaluation results of the traditional DEA cross-efficiency models (aggressive and benevolent) are compared with those of our proposed PCE (I) and PCE (II) models with different values of w, which are shown in Table 7.
The evaluation results and rankings of different models
The evaluation results and rankings of different models
Table 7 presents the evaluation efficiency scores and rankings of different models. It can be seen that DMU4 is evaluated as the most efficient asset in the CCR model, aggressive model, PCE (I) model (when w = 0.2, 0.8) and PCE (II) model (when w = 0.2), whereas DMU2 becomes the most efficient asset in the CCR model, benevolent model, and PCE (II) model (when w = 0.8). That is to say, the most effective asset is evaluated differently in the benevolent and aggressive models, which make it difficult for us to choose the benevolent or aggressive models in the actual decision-making. However, from the rankings in Table 7, we can draw some conclusions about the predominant characteristics of PCE evaluation. PCE models not only effectively rank all the DMUs in a unique order, but also distinguish the most efficient asset according to different psychological preferences.
Figure 1 shows the evaluation scores and ranking orders of seven different models intuitively, including CCR model, the benevolent model, the aggressive model, PCE (I) and PCE (II) models with two different values of w. Obviously, each DMU achieves the highest evaluation score in CCR model, followed by the benevolent model, while the lowest evaluation score of each DMU is obtained in the aggressive model. That is, the scores evaluated by our proposed PCE models are between the aggressive and benevolent models. From the perspective of the rankings of DMUs, except for the CCR model, the other models can effectively rank all the DMUs in a unique order. In addition, major DMUs are in the same order in different cross-efficiency models, except for DMU2 and DMU4. It is not difficult to find that the rankings of PCE (II) (w = 0.2) are consistent with the aggressive model, while the rankings of PCE (II)(w = 0.8) are close to the benevolent model. This is based on the fact that the PCE models can set different parameter values according to the psychological preferences of the decision makers, resulting in generating different evaluation results.
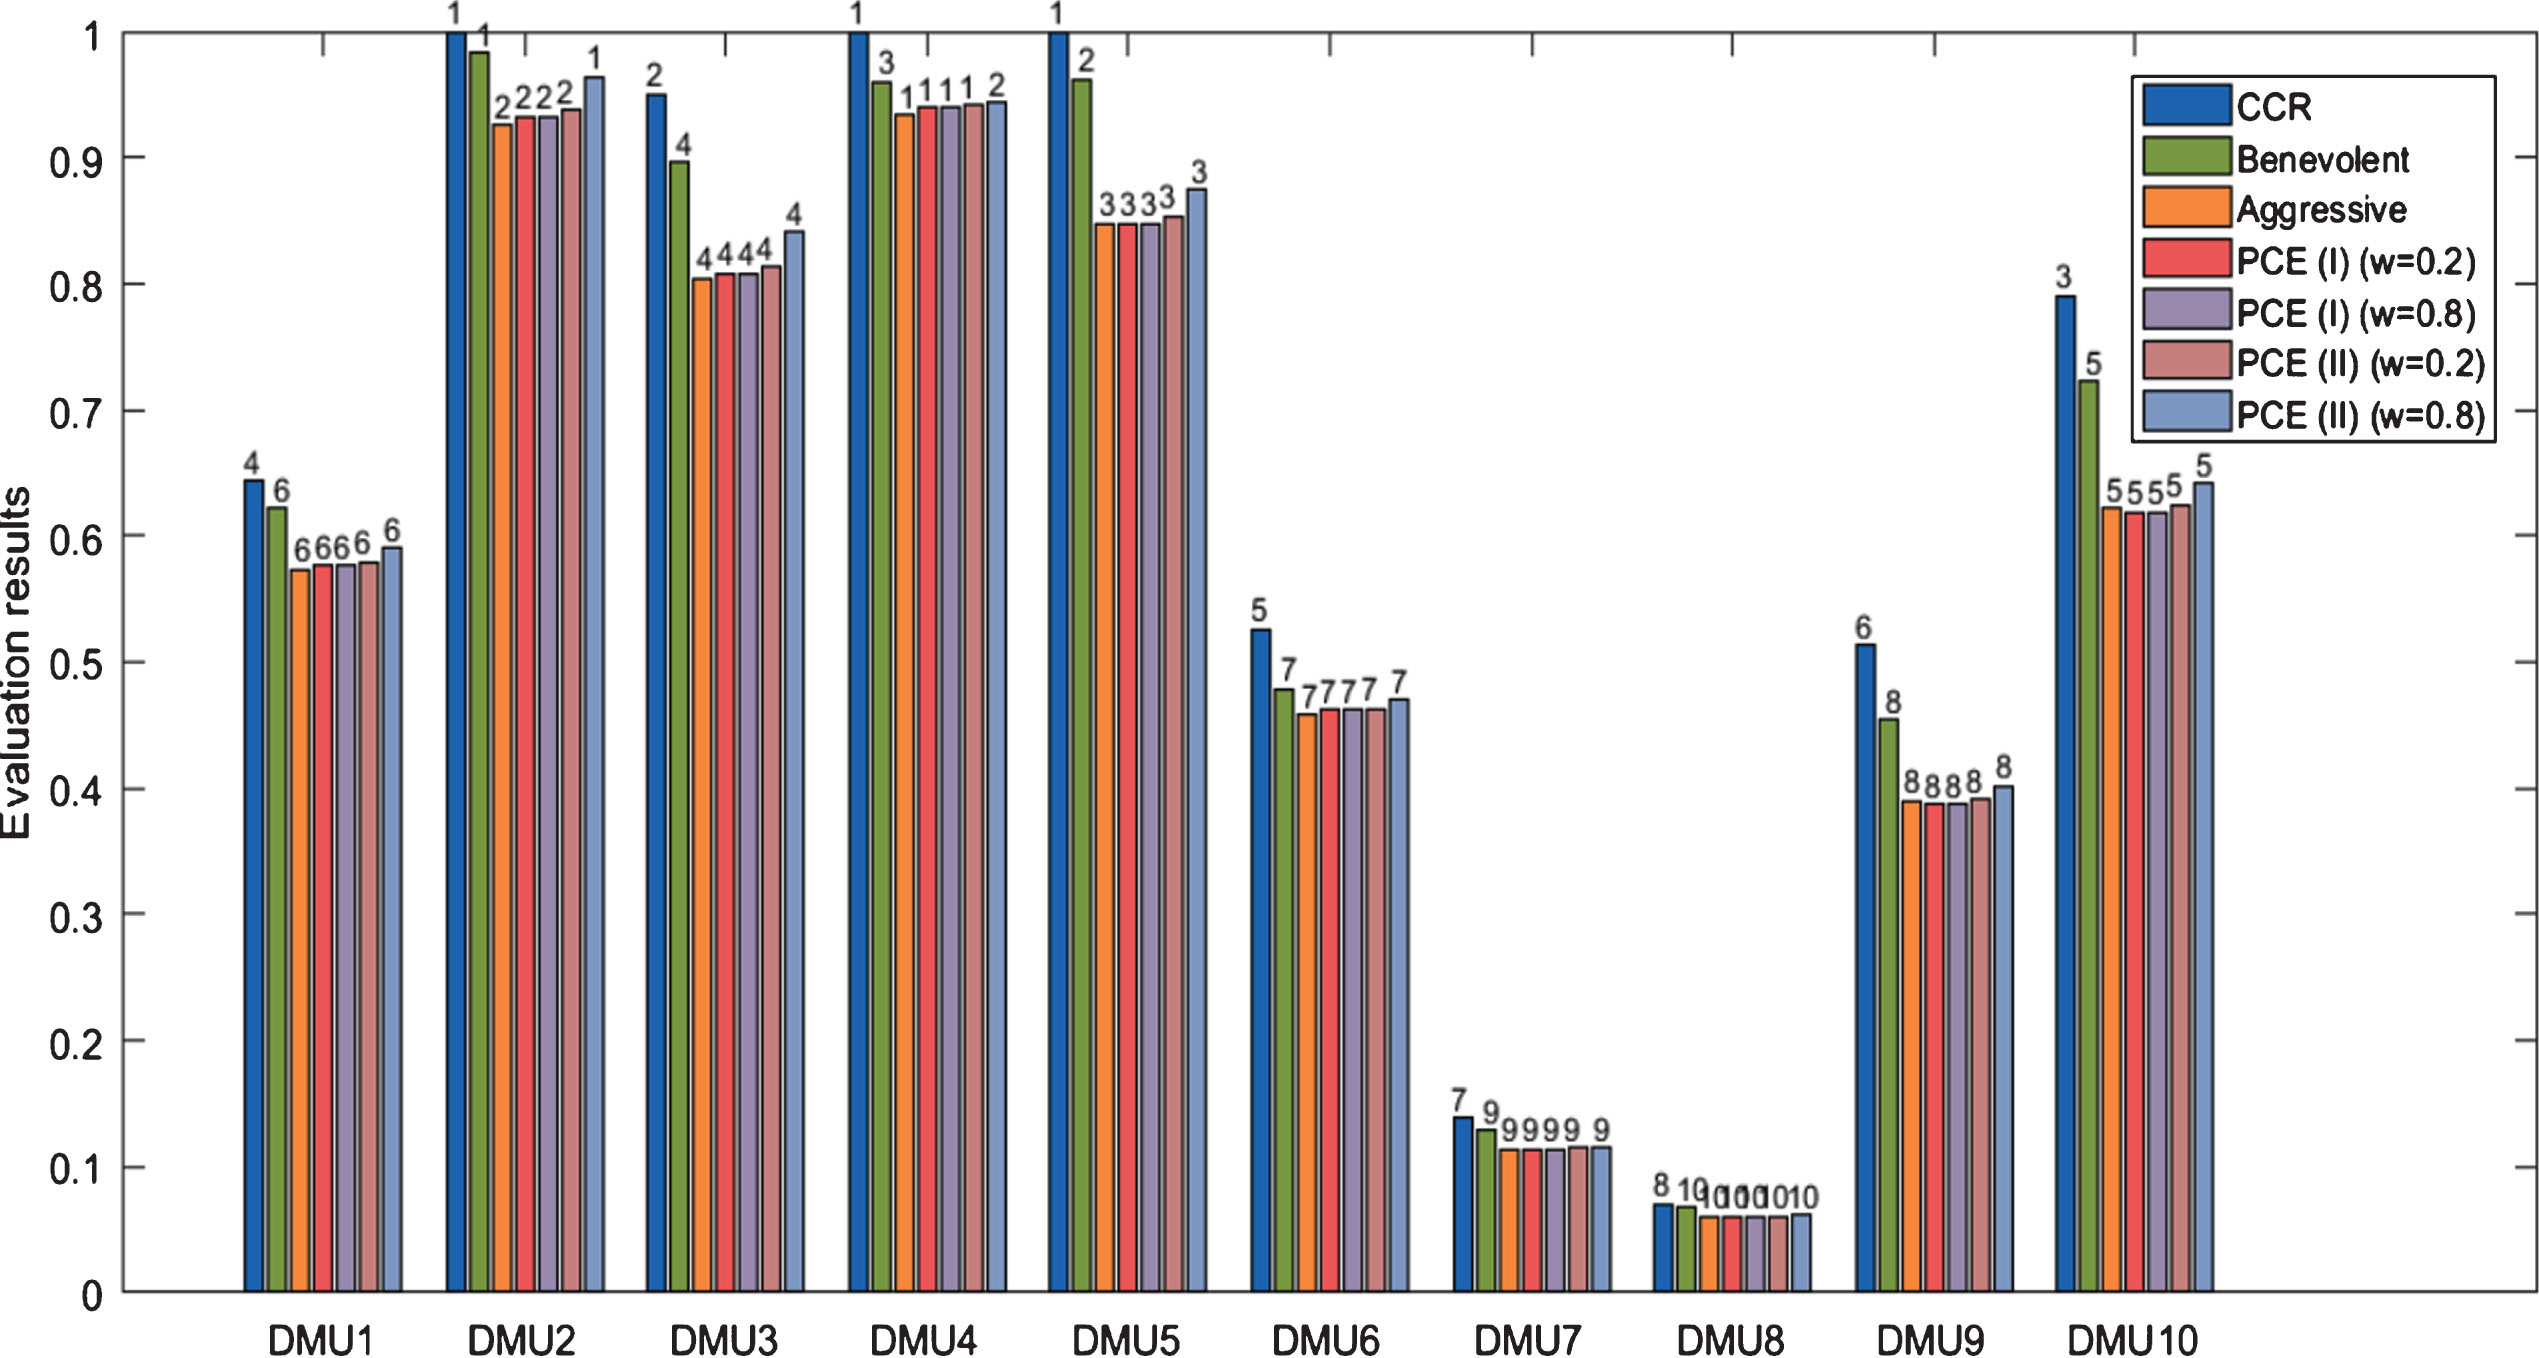
The evaluation results of different models.
To further demonstrate the effectiveness of our proposed PCE models, Figure 2 displays the comparison between the traditional cross-efficiency models and PCE (II) models with different values of w. When w = 0.2, the evaluation results of PCE (II) model are similar with those of the aggressive model. As w increases, the evaluation results of PCE (II) models have a tendency to approach those of the benevolent model. It can be implied that PCE (II) models with different values of w can not only consider the risk attitudes of the DMs, but also cover more possible cases instead of the only two extreme cases (aggressive and benevolent models). Therefore, the PCE models are more reasonable and consistent with actual preferences of the DMs.

Comparison between the traditional cross-efficiency models and PCE (II) models.
In the subsection, we would apply the evaluation results of PCE (II) models with different risk preference values of w to our proposed MVM model. For instance, MVM (w = 0.0) model indicates the evaluation results of PCE (II) (w = 0.0) are applied to the proposed MVM framework.
Table 8 presents the investment proportion allocations for the 10 assets based on MVM models with five different risk preferences of the DMs. It can be seen that the large investment proportions concentrate on the 2nd asset and the 4th asset, while those of other assets are relatively smaller. Besides, as the value of w increases, the proportion of the 2nd asset is correspondingly increasing, whereas the weight of the 4th is decreasing. The phenomenon is consistent with the evaluation results of PCE (II) models with different values of w in Table 6, in which the 2nd asset outperforms the 4th asset under large values of w.
The weights of the assets in the proposed MVM models with different risk preferences
The weights of the assets in the proposed MVM models with different risk preferences
Table 9 shows that the return and risk characteristics for the five MVM models, which are portfolio efficiency (E Ω ), variance (V Ω ) and maverick (I Ω ) respectively. In the MVM (w = 0) and MVM (w = 0.2), the portfolio efficiencies are relatively small, while the variances and mavericks are relatively large than other three cases. It indicates that the proposed MVM models with small values of w might have poorer performance.
Selected portfolios: Return, risk measures and Sharpe ratio
To further evaluate the risk-adjusted performance of the five portfolios based on MVM framework, here we introduce the Sharpe ratio of the portfolio Ω developed by Sharpe [2]. The Sharpe Index is a commonly used measure of portfolio performance, which reflects the expected excess return per unit of risk. Despite numerous alternatives have been proposed by researchers, the Sharpe ratio is still one of the most popular indicators for ranking portfolios and investment strategies. Its formula is given as follows:
From Table 9, it can be seen that the Sharp ratio (SR Ω ) increases with the value of w. The larger the value of w, the higher risk-adjusted performance in the proposed MVM framework. However, it is worth noting that we do not have sufficient evidence to conclude that the more positive attitude people hold (large w), the better the final investment result will be in this paper.
Since the proposed MVM model is a novel risk-return model based on the PCE evaluation, it is crucial to compare it to some benchmark fuzzy portfolio models, such as the mean-variance (MV) model, mean-variance-skewness (MVS) model, mean-variance-entropy (MVE) model and mean-variance-skewness-entropy (MVSE) model. The following multi-objective optimization model (42) is as follows:
Using the first two objectives, it will degenerate into the mean-variance model (MV); Using the first three objectives, it will be the mean-variance-skewness model (MVS); Using the first two and the fourth objectives, it will be the mean-variance-entropy model (MVE).
Table 10 shows the portfolio allocations for the four benchmark fuzzy models. It can be seen that these models prefer to a few parts of portfolios. In the MV model and MVE model, only the 2nd asset and 10th asset are selected, while the portfolio weights of other assets are negligible. The similar phenomenon occurs in the MVS model and MVSE model, in which only the 4th asset and 5th asset are selected. In fact, it should also be noted that concentrating the vast majority of portfolio weights on a few assets will generate the low diversity of the portfolios. As is shown in Table 8, there are at least four different assets invested in our proposed models. That is, from the perspective of portfolio diversity, our proposed MVM models with different risk preferences outperform than the four benchmark fuzzy models.
The weights of the assets in the four benchmark fuzzy models
Figure 3 shows the investment proportion for the MV model, MVS model and three proposed MVM models with different risk preferences (when w = 0.2, 0.5, 0.8). It can be seen intuitively that the proposed models can generate more diversified portfolios than the MV model and MVS model.

The investment proportion for several models.
To visually compare the performance of these portfolios, Table 11 presents some return and risk characteristics such as the mean, variance, skewness, entropy of selected portfolios. Besides, Sharpe index (SR) is also introduced to measure the risk-adjusted performance of these models.
Selected portfolios: Some return, risk characteristics and Sharpe index
From Table 11, it is clear that our proposed models generate larger mean than the four benchmark portfolio models. The values of mean in the MV, MVS, MVE, MVSE models are 0.0094, 0.0098, 0.0082 and 0.0092, respectively, while in the five proposed models almost exceed 0.0129. At the same time the proposed models are subjected to more risk than the four benchmark portfolios correspondingly, which generated larger variance and entropy. Moreover, it is worth noting that our proposed models yield higher risk-adjusted returns (SR) than other four fuzzy portfolios in Table 11, which illustrates the effectiveness of our proposed models in terms of SR performance measure. Therefore, in the analysis, the results show the proposed models can not only capture the risk attitudes of investors, but also permit well-diversified portfolios and higher risk-adjusted returns than other benchmark portfolios.
As an effective method for evaluating the performance of financial assets, DEA cross-efficiency technique has been applied in the portfolio management. However, none of the relevant literature combines the DEA cross-efficiency method with people’s psychological factors and applies them to portfolio area. Indeed, human psychological factors play a critical role in the actual investment decision-making process. In this sense, this work focuses on incorporating the DEA prospect cross-efficiency evaluation into the fuzzy portfolio selection under a novel mean-variance-maverick (MVM) framework. Firstly, to take into account the risk attitudes of investors, two novel prospect cross-efficiency models termed PCE (I) and PCE (II) are developed to evaluate the performance of the assets. Additionally, in order to demonstrate the validity of PCE evaluation, we implement some comparative analysis with the traditional DEA cross-efficiency evaluation. Furthermore, a novel MVM framework based on the PCE approach is constructed to determine the allocation of capital to each asset in the portfolio. Finally, a numerical example is presented to demonstrate that the proposed approach not only can consider the risk attitudes of investors, but also permit more diversified portfolios and higher risk-adjusted returns than some fuzzy portfolios.
In this work, the major novel contributions of the proposed method are reflected in two aspects. On the one hand, the proposed PCE models can be seen as improvements and extensions to DEA cross-efficiency evaluation. In the meanwhile, this is the first time that DEA prospect cross-efficiency approach is effectively applied to the portfolio management and would be a promising tool for evaluating financial assets. By using the PCE evaluation, we can not only capture the attitudes of investors, but also evaluate the performance of financial assets more in line with the actual situation. On the other hand, the present study provides a novel integrated framework that extends the mean-variance framework by considering an additional consistent risk measure based on the PCE evaluation. By incorporating the index into traditional mean-variance framework, we can analyze the performance of financial assets more comprehensively and acquire a well-diversified portfolio. Although the proposed approach has many advantages in portfolio management, there are still some limitations. For example, the construction of the proposed MVM model ignores the realistic constraints in real world such as transaction costs, maximal and minimal fraction of the capital and cardinal constraints.
For further research, to enhance the feasibility in the real world, some other variant objectives and real constraints can be incorporated into the proposed MVM model. Also the methodology can be applied to other asset allocation problems, mutual fund portfolio selection, multi-period portfolio problems and other case studies. Furthermore, the proposed model may be extended under the hesitant fuzzy environment.
Compliance with ethical standards
Footnotes
Acknowledgments
This research was supported by the “Humanities and Social Sciences Research and Planning Fund of the Ministry of Education of China, No. x2lxY9180090”, “Natural Science Foundation of Guangdong Province, No. 2016A030313545”, “Soft Science of Guangdong Province, No. 2018A070712002” and “Fundamental Research Funds for the Central Universities of China, No. x2lxC2180170”. The authors are highly grateful to the referees and editor in-chief for their very helpful comments and suggestions.