
Abstract
Wireless sensor networks (WSNs) found application in many diverse fields, starting from environment monitoring to machine health monitoring. The sensor in WSNs senses information. Sensing and transmitting this information consume most of the energy. Also, this information requires proper processing before final usages. This paper deals with minimising the redundant information sensed by the sensors in WSNs to reduce the unnecessary energy consumption and prolong the network lifetime. The redundant information is expressed in terms of the overlapping sensing area of the working sensors set. A mathematical model is proposed to find the redundant information in terms of the overlapping area. A combined meta-heuristic approach is used to achieve the optimal coverage, and the effect of the overlapping area is considered in the objective function to reduce the amount of redundant information sensed by the working sensors set. Improved genetic algorithm (IGA) and Binary ant colony algorithm (BACA) are used as meta-heuristic tools to optimise the multi-objective function. The objective was to find the minimum number of sensors that cover a complete scenario with minimum overlapping sensing region. The results show that optimal coverage with the minimum working sensor set is achieved and then by incorporating the concept of overlapping area in the objective function, sensing of redundant information is further reduced.
Keywords
Introduction
Random deployment of the wireless sensor in WSNs along with the sensor’s location information has made the localisation issue a critical challenge in WSNs. One of the proficient ways to deal with this type of problem is the meta-heuristic approach based on the simulation [1–4]. Several meta-heuristic approaches have been proposed in WSNs such as GA, ACO, Lion Optimization (LO), Particle Swarm Optimization (PSO), Support Vector Machines (SVM) Artificial Neural Networks (ANNs) etc. [5–10]. Along with these intelligent algorithms, and their modified versions are also used to deal with serious issues associated with WSNs [11–16].
Regardless of the benefits of such meta-heuristic approaches, its major weakness is the sensing of the redundant information and the presence of redundant sensors. Both these factors affect the lifetime of sensors in WSNs drastically. However, the sensors have a limited lifetime due to the limit of cost and volume [17, 18]. Energy to the sensors cannot be supplied once employed or regenerated, so the optimal coverage and the energy consumed by the nodes are the two critical problems in WSNs [2, 19]. In this paper, a novel approach has been proposed to deal with the sensing of redundant information. A mathematical model is proposed to find the redundant information sensed by the sensors using a combined meta-heuristic approach. The contribution of the authors in the paper is summarised as follows. A very effective combined meta-heuristic approach, IGA-BACA, is applied in WSNs for maximising the network coverage along with reducing the number of sensors required. A mathematical model is proposed for finding the redundant information sensed by the sensor node having a circular sensing area. Redundant information sensed by active nodes is expressed in terms of the overlapping area. Designing of a multi-objective function that incorporates the concept of the overlapping area.
In Section 2, the theoretical background and the related work have been presented. In which, the basics of heuristic techniques used has been discussed.
Theoretical background and related work
GA and Adaptive GA(or IGA)
GA is a global meta-heuristic random search technique, proposed in the early seventies by John H. Holland [5]. It follows three operators, namely reproduction, crossover and mutation. It can be considered as a biological evolutionary process in which a population of certain solutions evolves over a series of generations [20]. It retains a set of solutions known as chromosomes, which are obtained through fitness function in every generation. It is then shortlisted for reproduction according to their fitness value. The selection process follows the principle of survival of the fittest. Solutions having good fitness values are selected for reproduction whereas the bad solutions are rejected. The shortlisted solutions go through other two genetic operator crossover and mutation. Now crossover leads to the interchange of genetic-based material between solutions because crossed solutions can produce an individual with either best or worst fitness. It occurs only with some probabilityP c known as crossover probability or crossover rate. The mutation modifies a solution with probability P m known as mutation probability. The role of mutation probability is to explore the unexplored genetic material. GA finds a globally optimal solution or nearby solution and hence, reduces the chances of getting the local minimum.
In Adaptive Genetic algorithm (AGA), the crossover and mutation probability changes adaptively according to the different condition of the individuals which prevents the premature convergence [21]. Mathematical expression for P
c
and P
m
is given in equation 1 and 2.
Where P c is known as crossover probability, P m is known as mutation probability, f max is known as the highest fitness of population, f avg is known as the average fitness of the population, f′ is known as the higher fitness of two strings used for crossover, f is known as the fitness of the individuals to mutate. The constant k1, k2, k3 and k4 have to be less than 1, to restrict the value of P c and P m to the range [0,1]. Also, k1 and k3 are bigger than other two constants.
ACO is a kind of simulated evolutionary algorithm [22]. The basic concept in ACO is that an ant while searching for food releases a peculiar type of pheromone in its path, which makes other ants perceive a kind of oddity and tends to lean towards the route of higher intensity [20]. ACO evaluates the optimal route through a continuous process of accumulation and update of chemical released by them, pheromones, and it obtains optimised value by undergoing appropriate times of generation. Although ACO finds better solutions, gets good performance on parallel computing and can be easily combined with other algorithms, it still has some shortcomings. The initial stages lack pheromone as a result of which it searches slowly and results in the local optimal solution, i.e. premature convergence [23].
To overcome the above issue, BACA is used. BACA network is illustrated in Fig. 1. The work of ants is divided, and the same routine searches by a different type of ants, and pheromone is left on each edge. As an intelligent individual, each ant selects one edge out of two. The incidence matrix traversed by each kind of ant, needs only (2 × n) ′s space, which, up to some extent, solve the problem of reduction in solution quality. Hence, in the next iteration or experiment, the efficiency of the algorithm increases greatly [23]. The BACA make use of binary coding instead of decimal coding, and the binary coding has a better traversal search capability as compared to decimal coding.
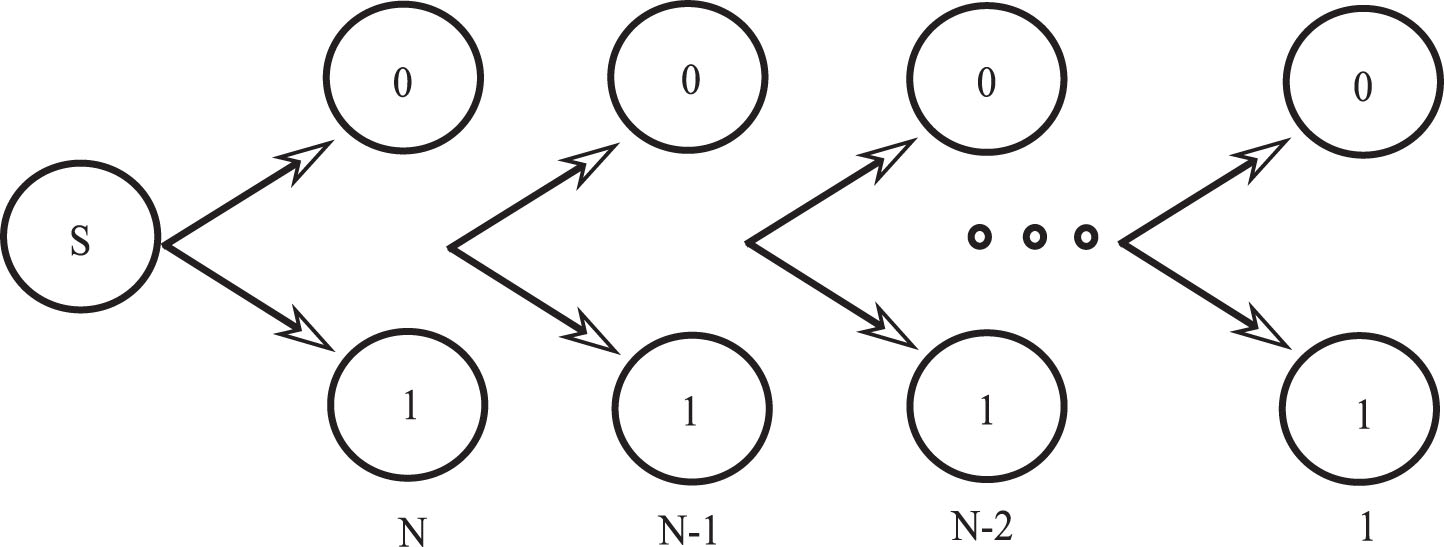
BACA network.
Define a direct graph, G = (V, R), where the node set V is
Where c
s
is the starting node,
In the initial stage, information associated to all path are equal, let it be τi,j (0) = C where C is a constant, Δτi,j (0) (i, j = 1, 2, . . . , N). During the operation of move, k number of ants determines the direction (where k = 1, 2, . . . , m) according to the info of each path and the probability of movement is define as
Where
Where
BACA finds the solution by taking the initial population from the GA. The initial population is generated randomly, which go through GA evolution. Simultaneously, the result obtained by GA is utilised to initialise the pheromones information of the network. If the last condition of the loop is met, then the algorithm will terminate; otherwise ants will traverse, pheromones update and reserve of optimal solution step is executed. Further, GA operators are operated to obtain a set of solution and retain the optimal solution. And lastly, the optimal updated pheromones are used to decide whether the termination is met or not. A one to one correspondence between IGA-BACA parameters and WSNs is given in Table 1.
Analogous parameters in IGA-BACA algorithm and sensor deployment
Analogous parameters in IGA-BACA algorithm and sensor deployment
Optimal coverage of WSN node is a multiple objective optimization problem, which can be represented as S = (s1, s2, . . . , s
i
, . . . , s
N
) is the set of existing sensors, the target is to get sensor node set S′, that provides utmost coverage rate with the lowest number of working sensors. If f1 (S′) represents maximal network coverage and f2 (S′), minimum working nodes. This conflict undermines them both, multiple objective optimisation models in WSN is changed to maximal objective function f (S′) given by
The completion of mapping from solution space to coding space of optimisation problem is a key problem. The control vector L = (l1, l2, . . . , l i , . . . , l N ) of wireless sensor node for random distribution of working sensor is expressed in form of binary coding, that represent the location of all sensor nodes. Here the value of l i can be either 0 or 1, which reflects the sleep or active state of the sensor node i. The initialisation of a gene in a chromosome in GA has one to one correlation with selection of nodes.
Initial solution and adaptation function
A total of 8 sensors are randomly distributed over a region, where the sensors (1, 2, 3, 5, 7, 8, 10, 11, 12) are working sensors nodes and the corresponding control vector is {111010110111} which is shown in Fig. 2. Equation 9 is used as adaptation function; the larger the value of the functions, the large will be selection probability of individual.
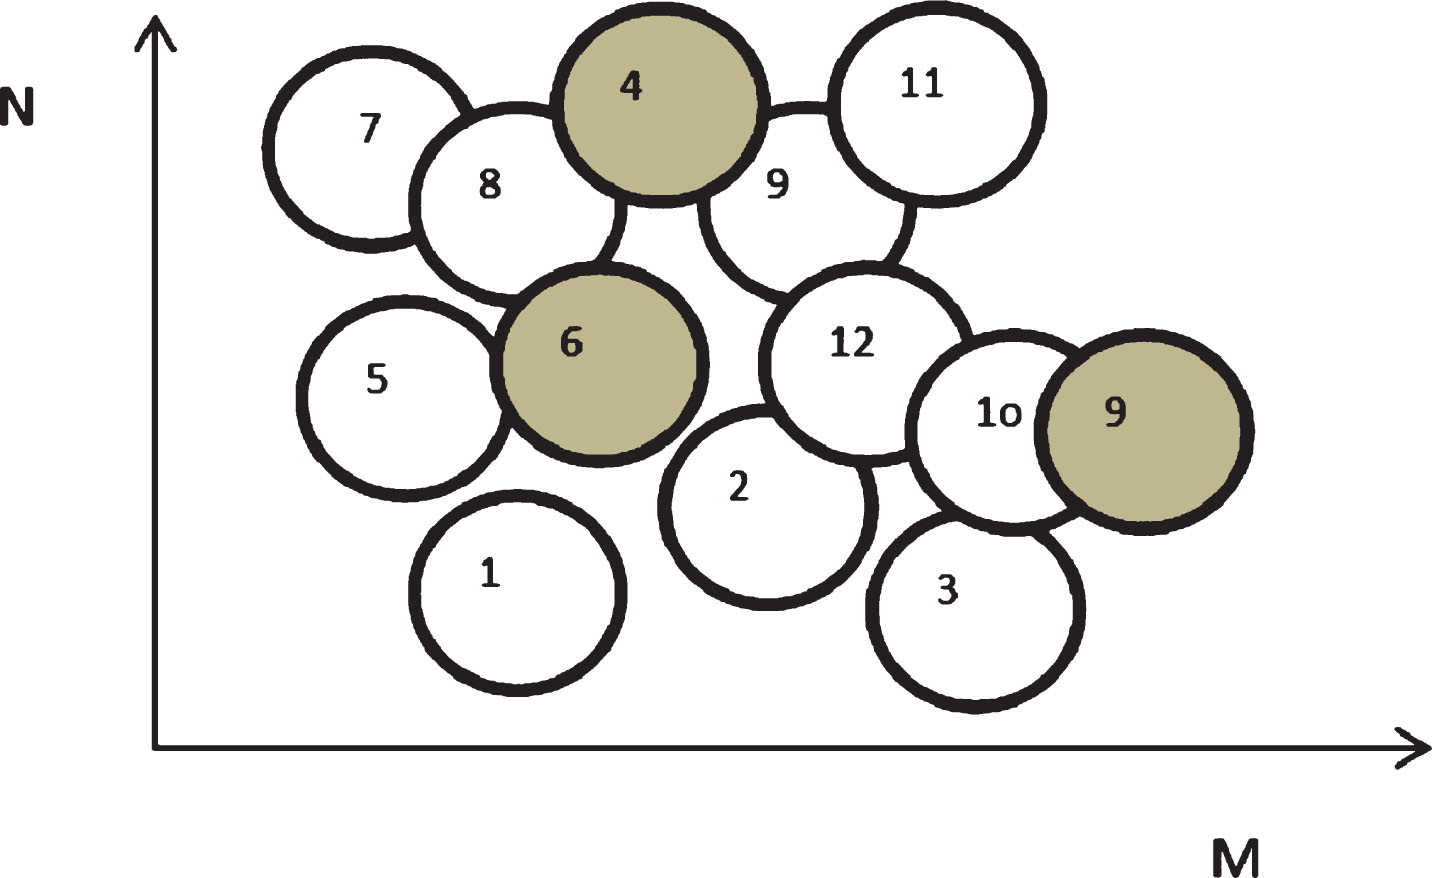
Control vector of 9 working sensors out of 12 is {1 1 1 0 1 0 1 1 0 1 1 1}.
It is a combination of GA and ACO operators. A total of four operators namely reproduction, crossover, mutation and lastly update pheromone operator are there in IGA-BACA. In IGA-BACA, the first operator reproduces offspring to the new colony depending on probability in a fraction to their adaptive value. After the first operator, the offspring with better fitness are retained, and inferior offspring are rejected or removed, and hence the average fitness value associated with the colony is increasing, however, in this process, the number of possible varieties is lost. The crossover operator selects a pair of individuals according to probability P c , and there may be a chance that crossed solutions can either produce ones with better or worse fitness value. The mutation operator modifies a solution or offspring with probability P m . The role of mutation operator is to explore the unexplored genetic material.
The update pheromone operator (T
g
) represent a mapping of update pheromone for optimal offspring selected through ant sequence. By Max-Min rule pheromones will be only released in the optimal ant traverse path, mathematically Δτ (i, j) =1/(f
best
(S)), f
best
(S) is the best-iteration cost or best global solution. The probability of update pheromone operator is given by
A diagrammatic representation of this section is illustrated in the flow chart in Fig. 8 [24].
The rest of the paper is structured as follows. An expression is derived for calculating the overlapping area in section III. The system model for the proposed approach is illustrated in section IV. The simulation results are discussed in section V. Finally, in section VI, the conclusion and future scope of the work is highlighted.
The overlapping area between the circles represents the redundant information, as both the sensor sensing the common information. A mathematical formulation to find the common area has been given below.
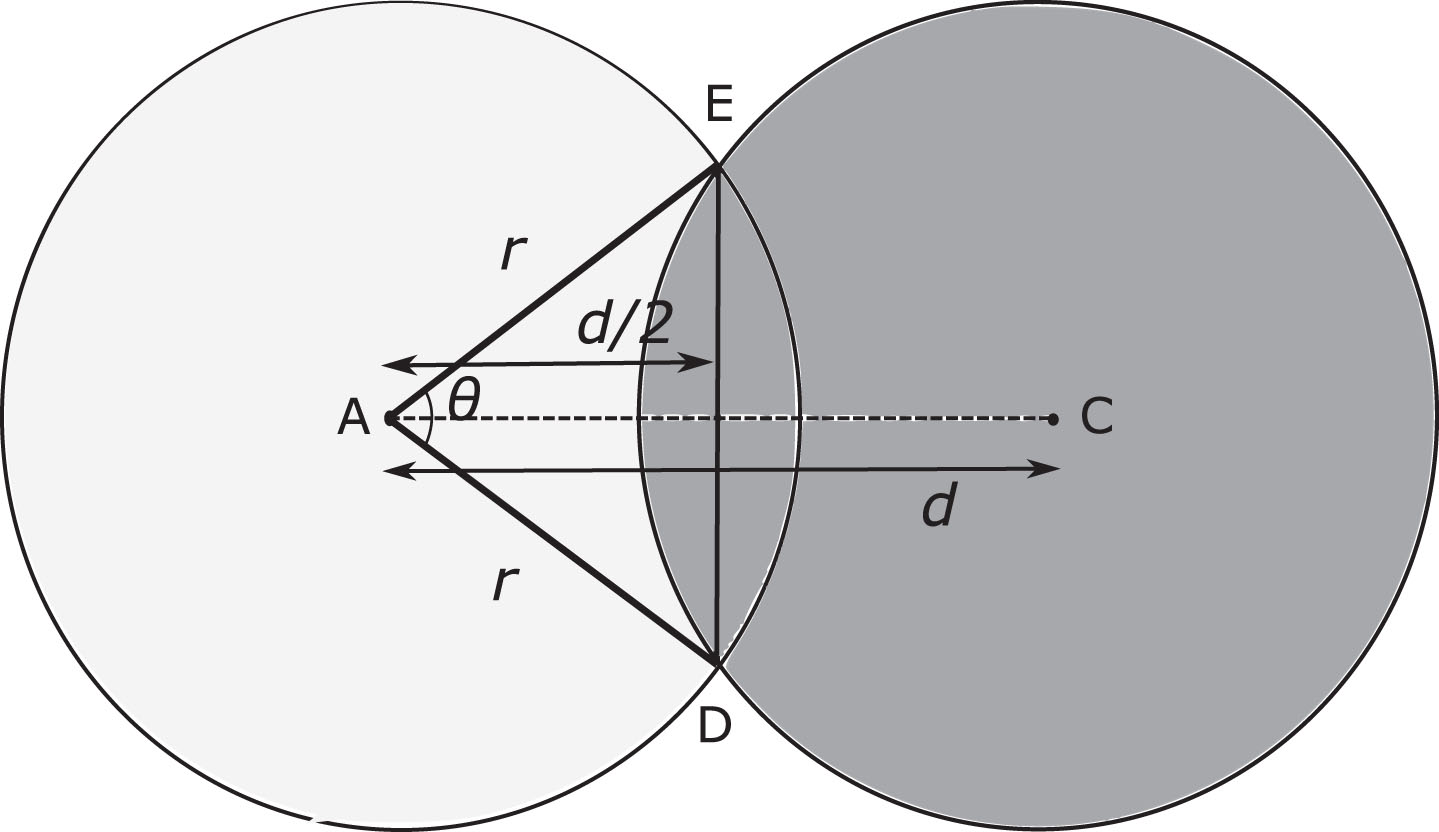
Let us assume that in the two circles, one with centre A and other as centre C have the same radius, r, overlapping each other. The distance between the centres, d affects the size of the overlapping area, as shown in Fig. 3. But at first, without going to mathematics, one can observe some of the points. First when d = 0 the overlapping area is πr2 and second when d ≥ 2r then the overlapping area is 0 [25].
Overlapping circles with centres A and C.
The common area is due to the overlapping sectors, as shown in Fig. 4. To find the overlapping area, first the area of the sector for one circle is calculated, then the area due to the segment of the sector is calculated indirectly by eliminating the area of its triangle. Then, it is multiplied by two to obtain the desirable overlapping area, as explained in Fig. 5.
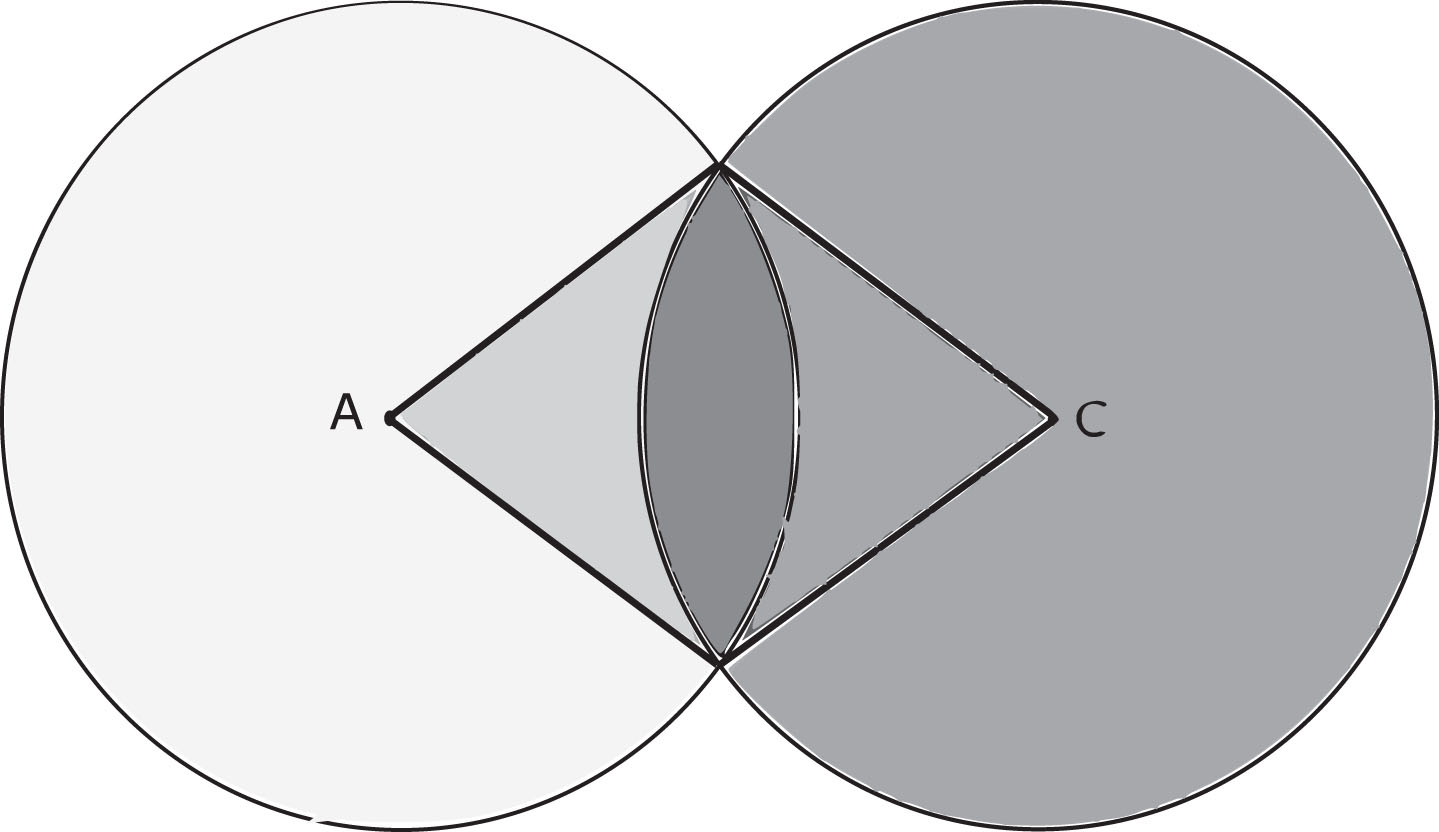
Overlapping sectors.
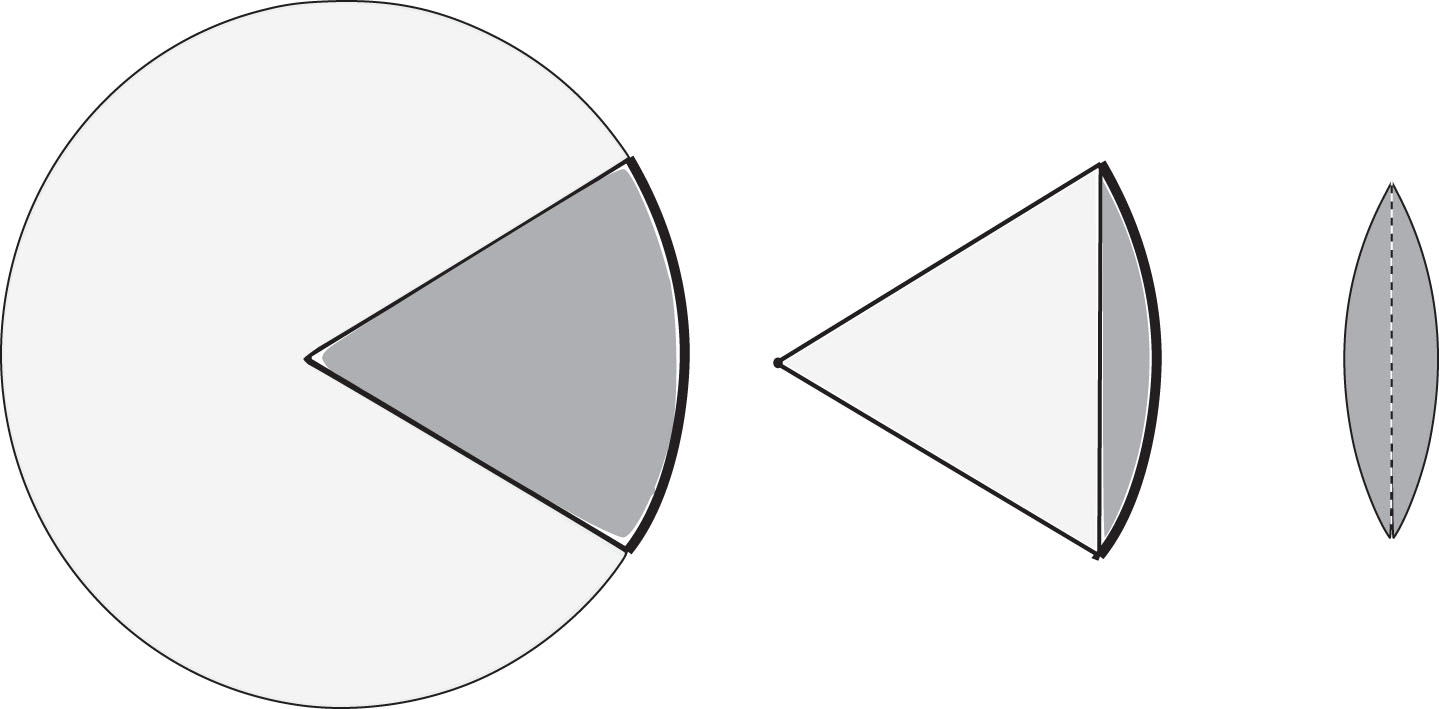
Segment of sector.
The area of the sector of a circle, Area
sector
= (θ/2) r2, where θ is the central angle in radian, of the sector. △AED is an isosceles triangle with points A (centre of the first circle), E and D (intersection point of the circle) shown in Fig. 6. The height of the isosceles triangle is d/2. To find the central angle of the sector θ, △AED is divided into two right angle triangles of height/2, hypotenuse r and angle between the hypotenuse and height θ/2 as shown in Fig. 7. From Fig. 7,
There are two methods to obtain the triangle area. In the first method Pythagoras theorem is used to get an expression for the base of the △AED, b in term of r and d. If b is the base of the △AED then b/2 is the base of the right angle triangles.
By the Pythagoras theorem, we have,
In the second method, the triangle area is expressed in terms of r and θ. For this, first b and h is calculated in terms of r and θ.
Network coverage is one of the critical problems in WSNs. The coverage should reach the maximum with a certain level of Quality of Service (QoS) [26–28]. Maintaining the required amount of QoS is achieved by measuring the WSNs coverage rate to check whether blind areas are present or not. Blind areas are regions which are not sensed by any of the sensors. The density of sensor nodes can be changed based on the requirement by keeping a total number of sensor nodes constant, i.e. one can deploy more sensors in more vital area to increase the reliability. There are two types of deployment viz. random coverage and certainty covering. In random covering sensors, deployment task is random, whereas in certainty covering the sensors deployment task is based upon specific algorithms. In the later certainty covering, if someones want to cover the area using a minimum working set of nodes, then determining the coverage area size is the first task that needs to be done. The certainty covering technique is adopted in this paper. In recent times, the method mentioned in [26] is widely used to find the minimum set of nodes that is enough to cover the given area and turn off the remaining nodes. In WSNs, with increase in the number of sensing nodes, the network cost also increases. The optimal set of nodes is the minimum working set of nodes that will not affect the network coverage.
Let us suppose that the total area to be monitored is A and is a 2D plane. Further, it is divided into mxn grids with each grid having unit area. A total of N sensor nodes are first distributed randomly in the given monitoring area A and sensor nodes set is represented by S = (s1, s2, . . . , s i , . . . , s N ). The sensor node s1 has a coordinate (x i , y i ) in the region A, coordinate of each sensor node is known and all sensor node have effective radii of r and s i = {x i , y i , r}. The sensing radius of node s i is consider to be circular region with centre, (x i , y i ) and effective radius, r. Let p be any arbitrary point in the region A where p ∈ A, and d is the Euclidean distance then d (p, (x i , y i )) ≤ r where i ∈ [1, N].
Each grids are target point (a1, a2, . . . , a j , . . . , am×n) and need to be sensed in the region A. Let the target point a j be in the sensing region of the sensor node s i then d (a j , s i ) ≤ r. For the sensor node s i the communication range is the circle with centre, (x i , y i ) and radius, r. Now if d (s i , s j ) ≤ r c then there will be direct communication possible between the sensor node s i and s j .
An undirected communication graph G, consisting of S sensor node is said to be connected if their exit a communicating path between any two sensor node which means d should be d (s i , s j ) ≤ r c where S is sensor node set. If any point in the region A is sensed by a sensor node of S, then S is called as the covering set of A, and if the communication graph G is connected then S is called as the connected covering set of A. Let S′ be the minimal subset of S, and if S′ covers the monitoring area completely then one can conclude that communication diagram extracted from S′ is connected. The goal of optimisation should be such that each grid in A should be at least sensed by a sensor. For connectivity to exit the communication range r c , it should be at least twice as that of sensing radius r, means r c ≥ 2r. So by maintaining this relation one can ensure that connectivity is there and we have to only deal with the coverage problem in the network [24].
The aim of WSNs is to maximise the network coverage while minimising the node uses. This is a multi-objective optimisation problem whose coverage model for WSNs is represented by equation 26. In a nutshell, the above problem can be represented as follows:
N: number of sensors S
j
: sensor node set for j (j = 1, 2, . . . , N) i.e. S = (s1, s2, . . . , s
i
, . . . , s
N
) r: effective radius of all sensors r
c
: communication range, so that for connectivity between two sensor r
c
≥ 2r A: monitoring area W, L: represents the width and length of the monitoring area, A
2 - D sets of coordinates values for all N sensors. redundant information in terms of overlapping area
First objective is to maximize the coverage i.e.
Second objective is to minimize the no. of sensors i.e.
Third objective is to minimize the overlapping sensing area between sensors. Obviously, the less the overlapping coverage area, the more will be the coverage within A. Based on this observation a new objective function is designed which is given by
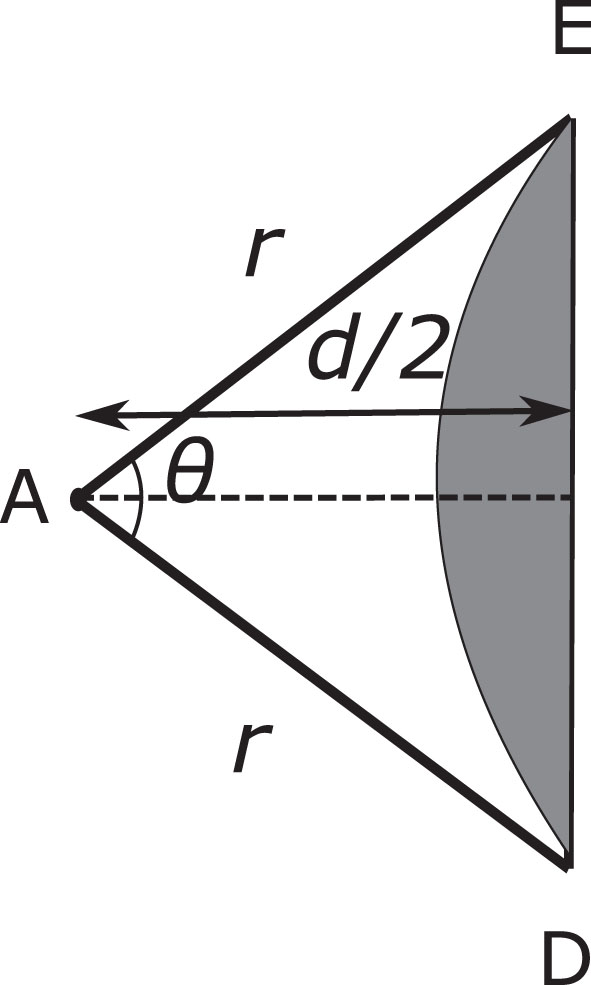
Isosceles triangle obtained from segment of sector.
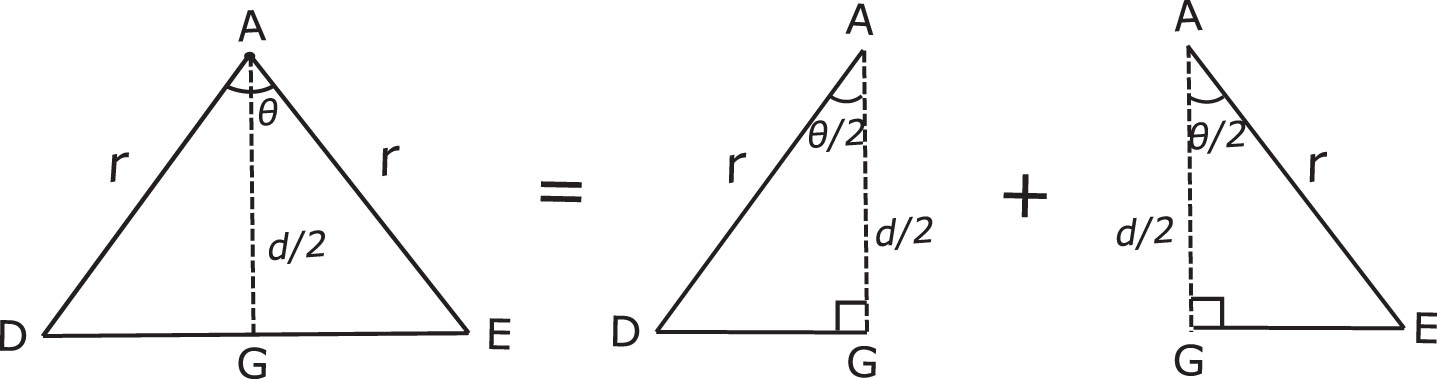
Splitting of △ AED.
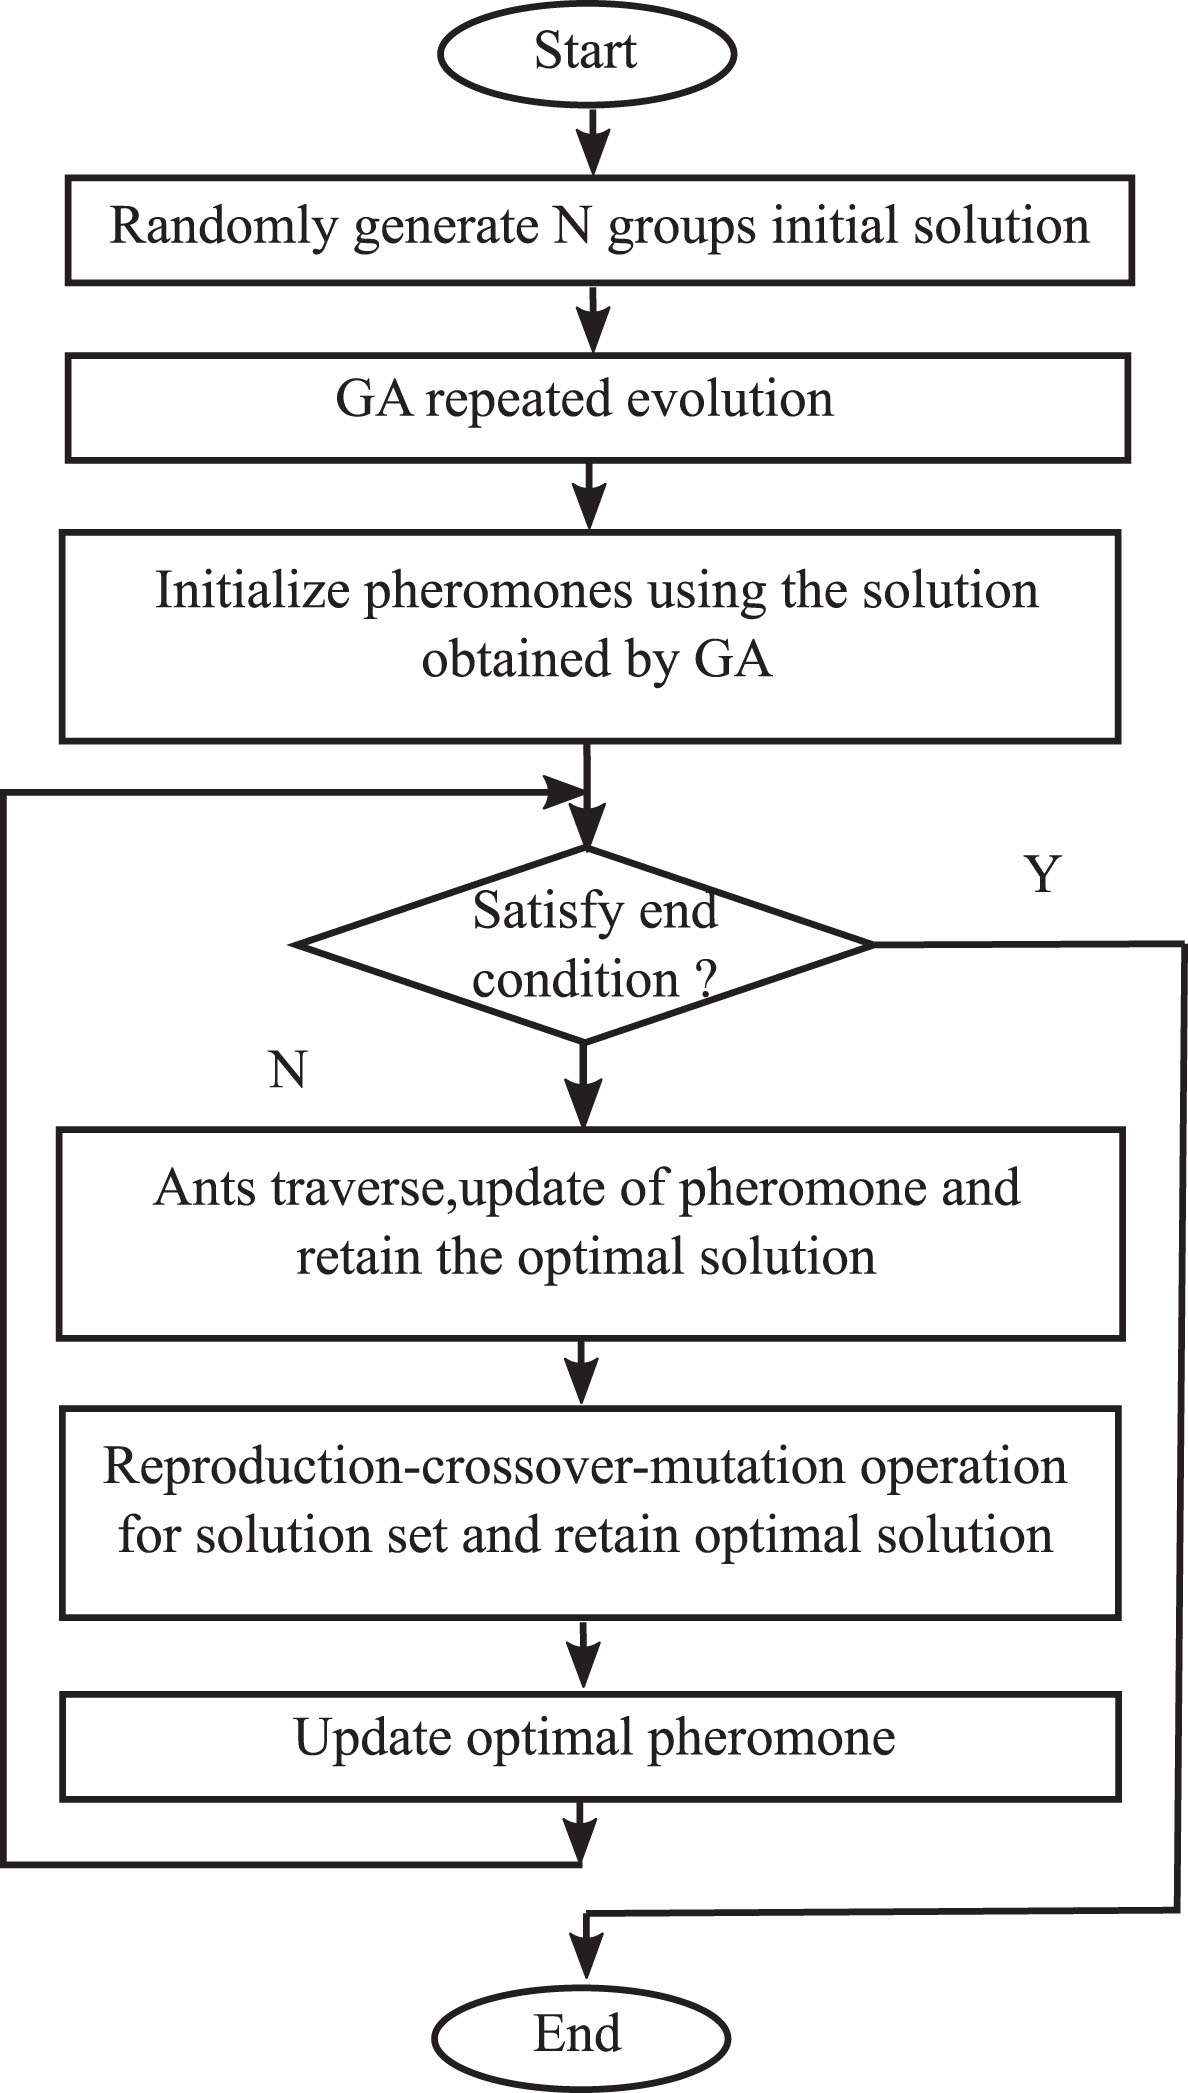
Flow chart for IGA-BACA.
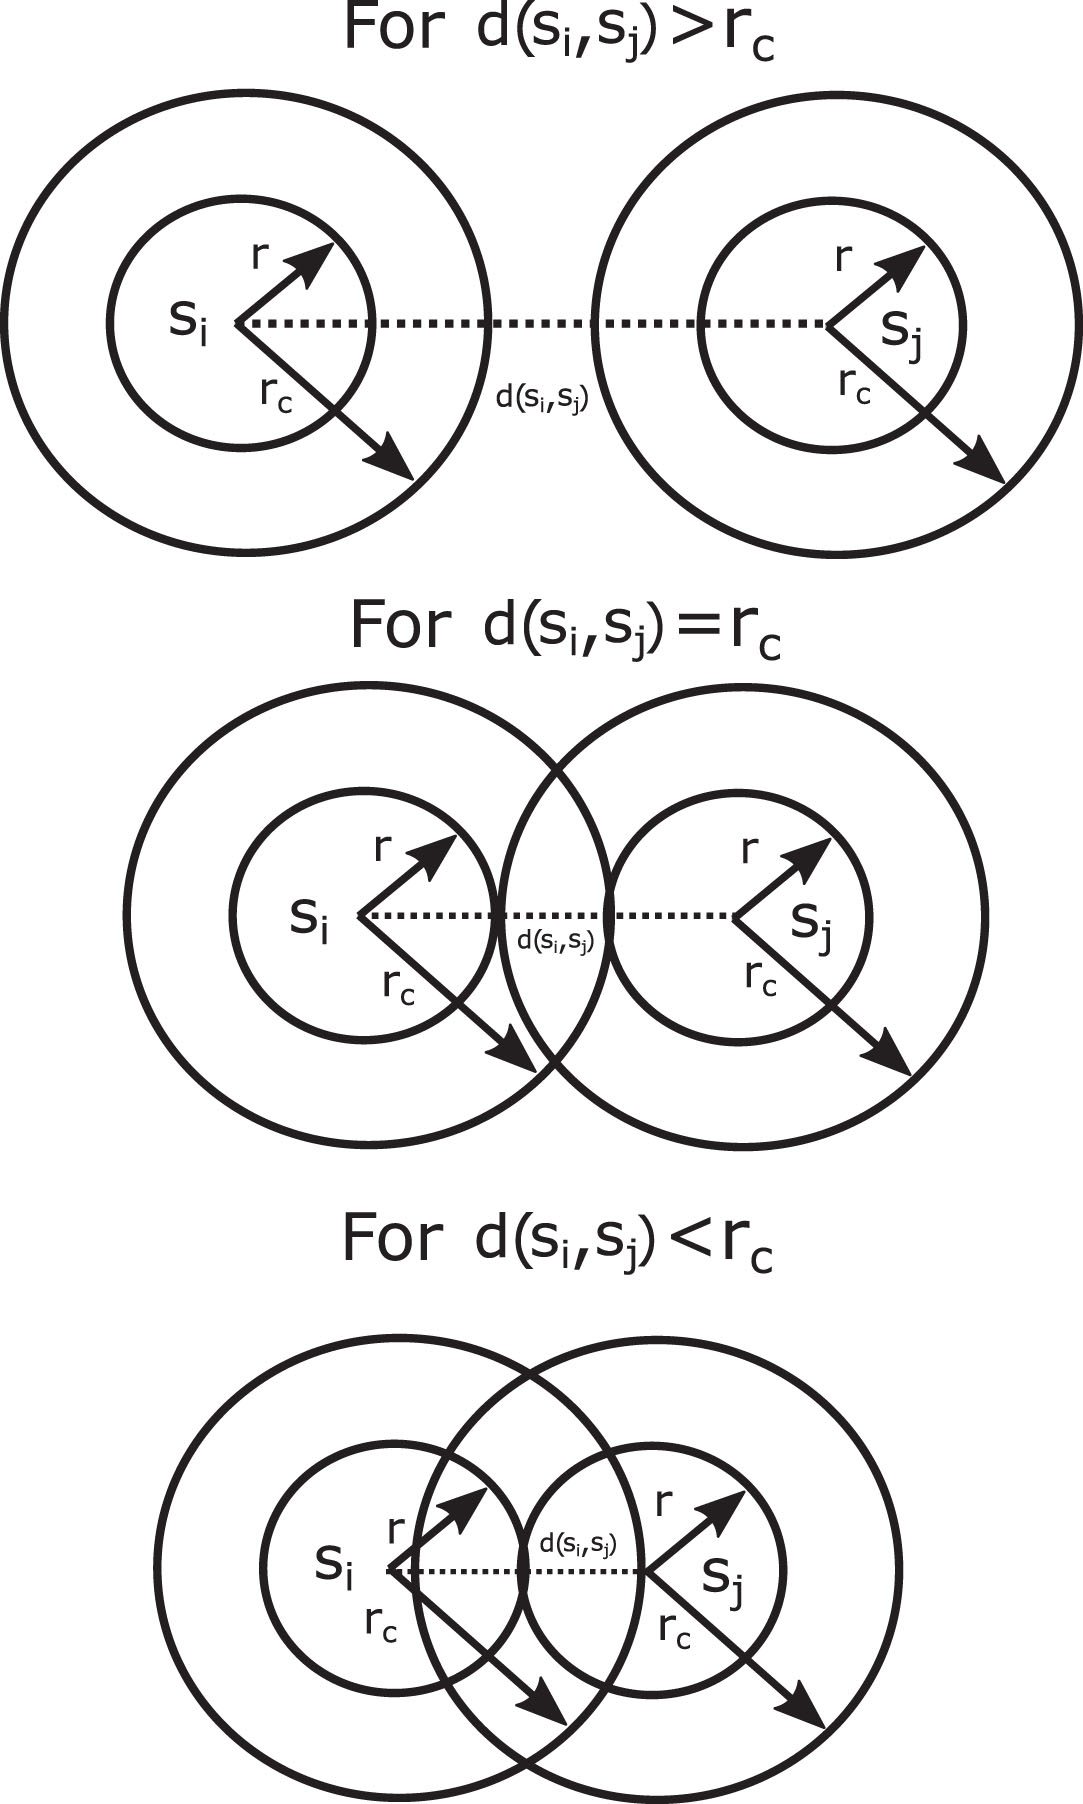
Overlapping criteria.
In a nutshell, the complete objective is to maximize the
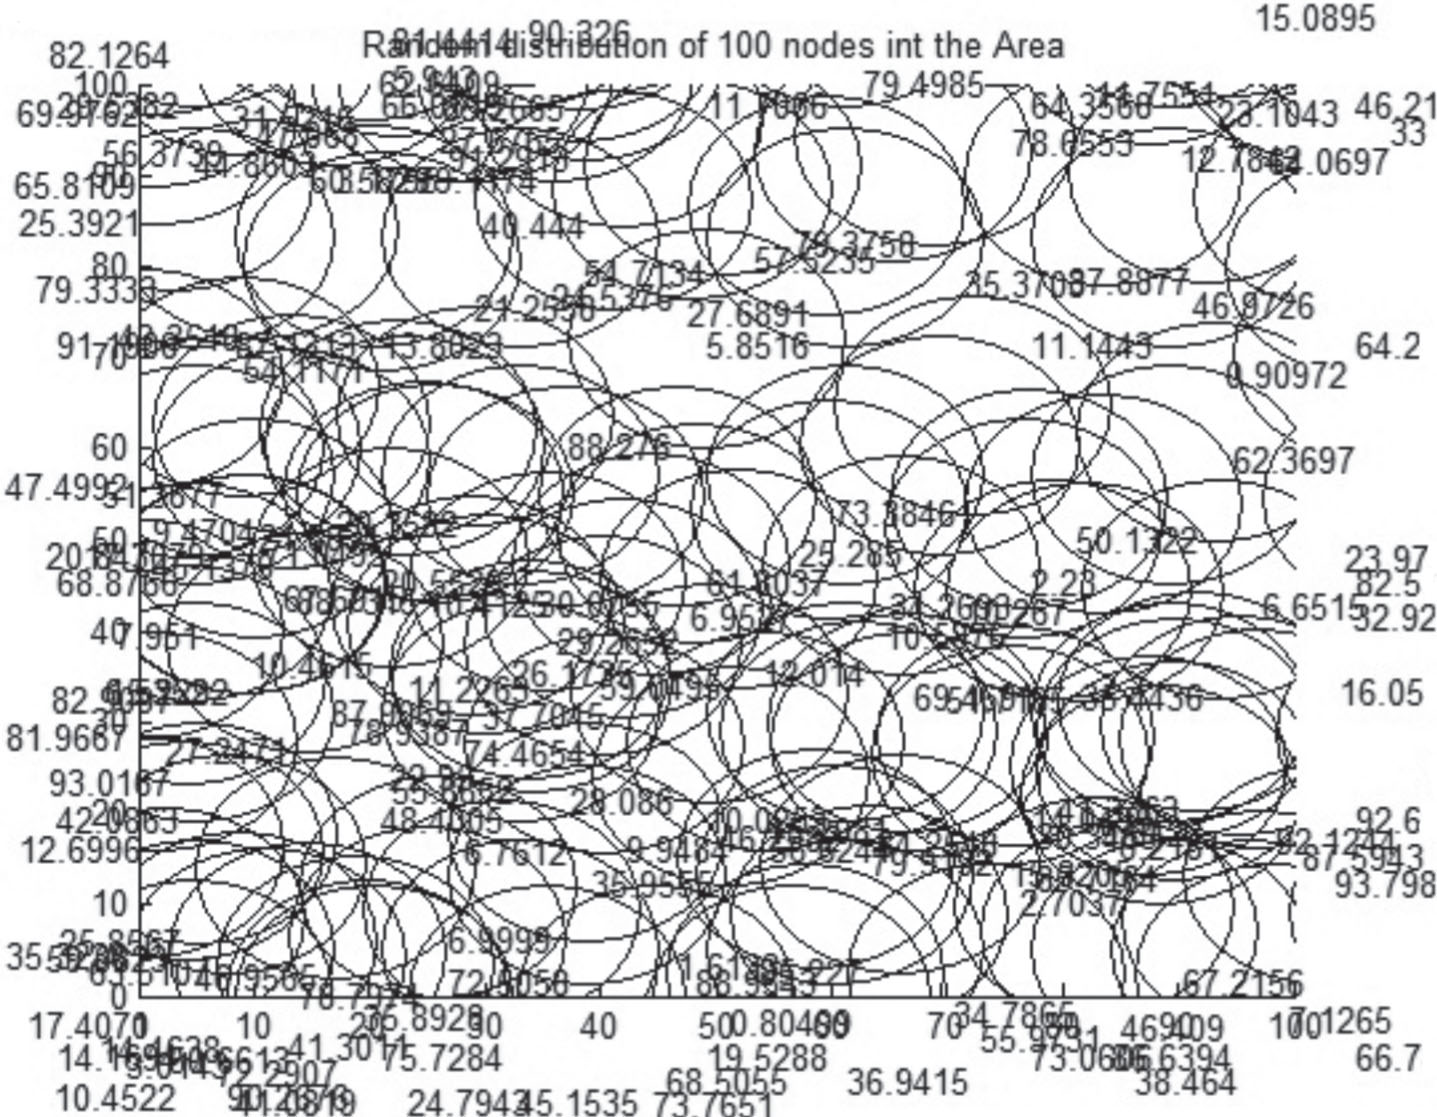
The monitoring area, A under considering is 100m times 100m with a perception radius, r, of the sensor nodes equals to 10m. A set of 42 working sensor node optimally covers the monitoring area A, as shown in Fig. 10. It is obtained for 300 iteration of IGA-BACA. It is also used as the benchmark for further comparison. The complete algorithm is implemented in MATLAB 2017b. A total of 100 nodes are randomly distributed in the monitoring target area, as shown in Fig. 11.
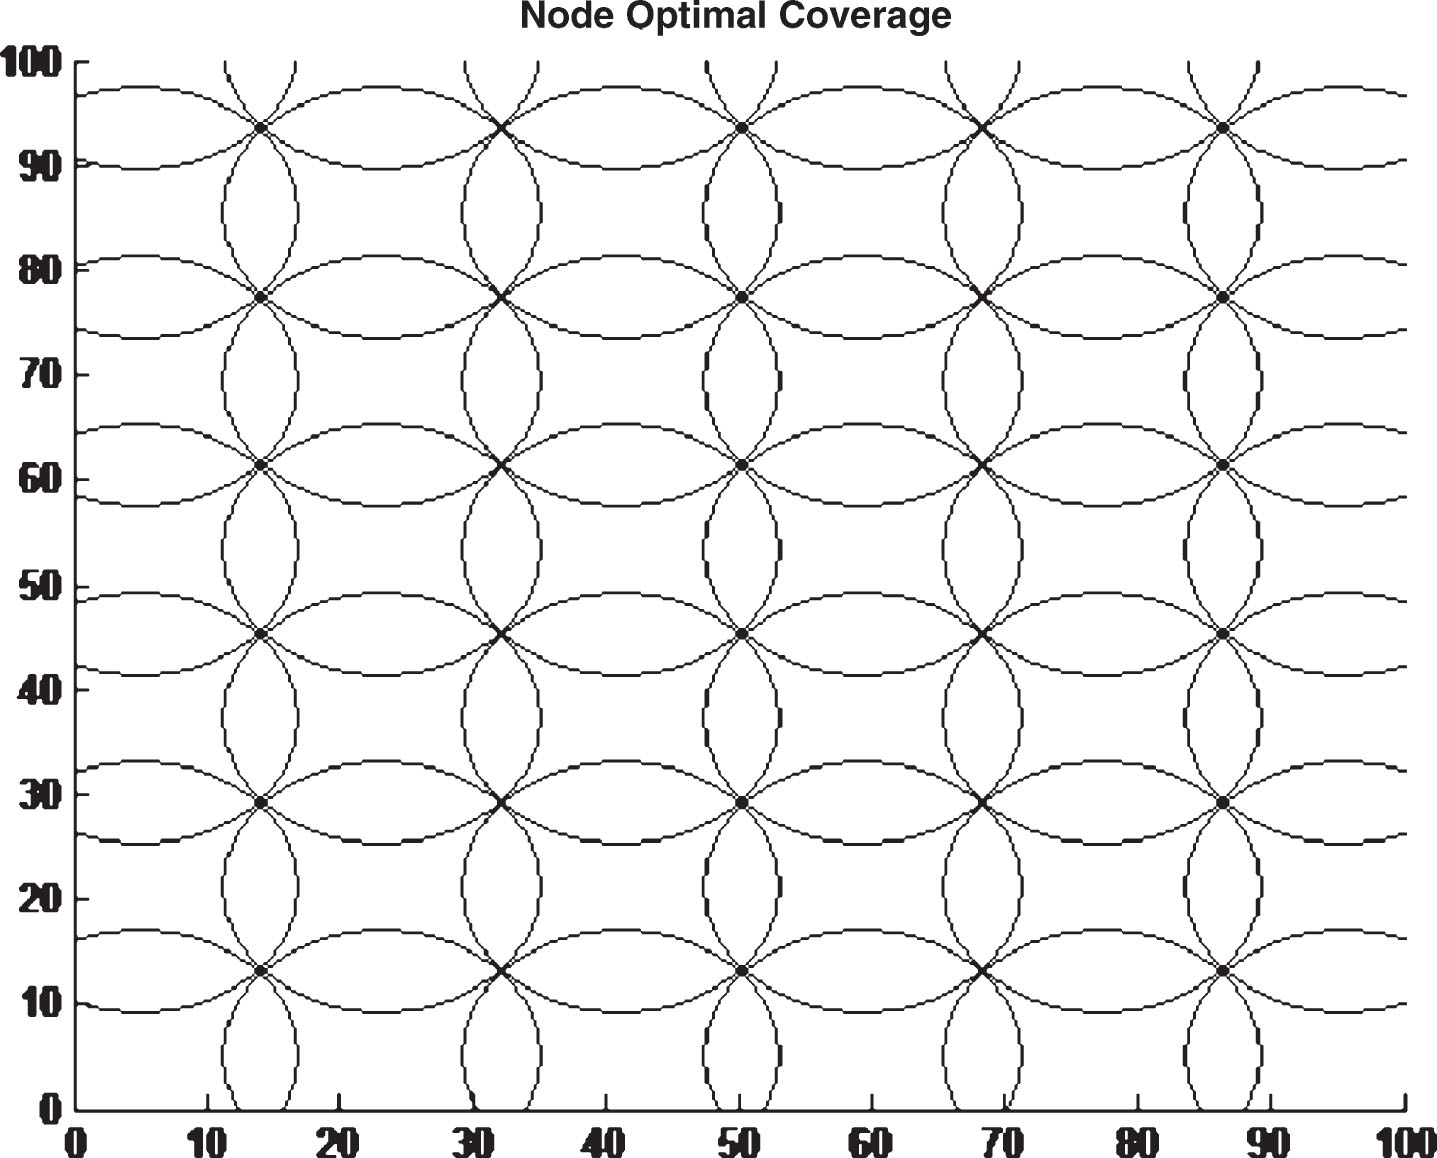
Optimal network coverage.
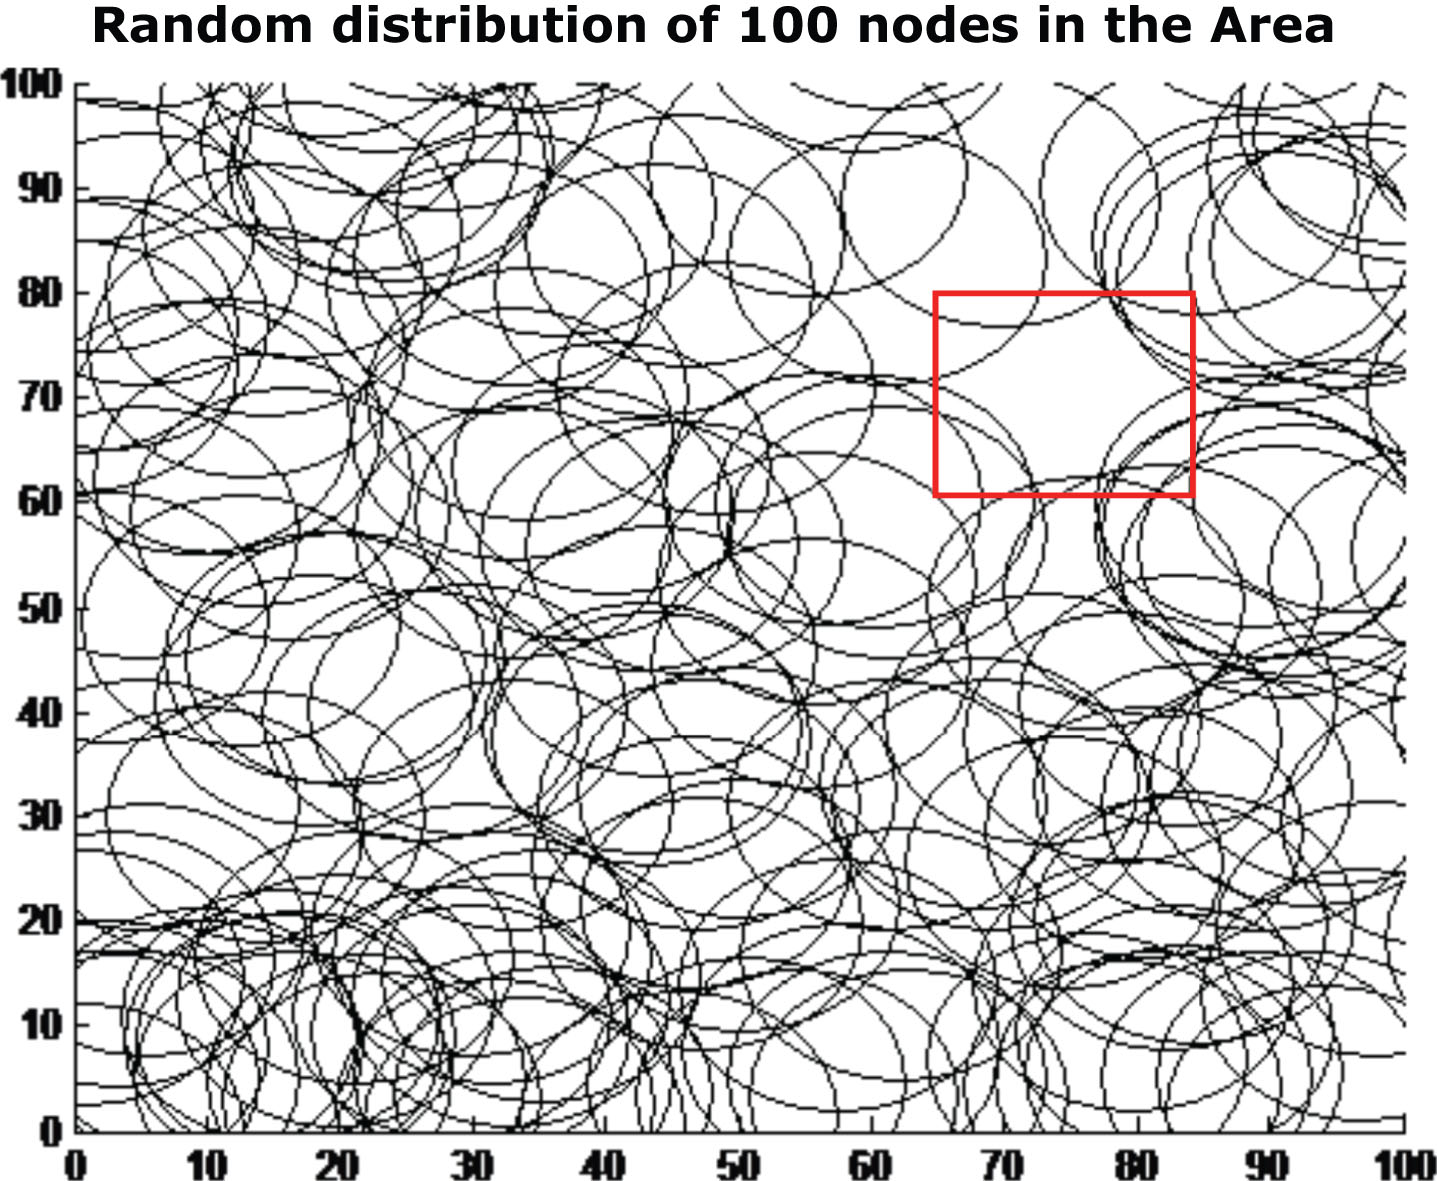
Random distribution of 100 nodes.
Although the area is covered completely, there exist a lot of redundant nodes which are sensing redundant information. The uncovered areas in A are termed as a coverage hole and in Fig. 11, one can easily detect such coverage holes or blind areas (indicated in red boxes for reference). As compared to the optimal coverage, randomly distributed scenario senses a huge amount of redundant information. Once, the redundant information is expressed in term of the overlapping area, then the overlapping areas is more for the randomly distributed case and minimum for the optimal case. This is illustrated in Figs. 12 and 13.
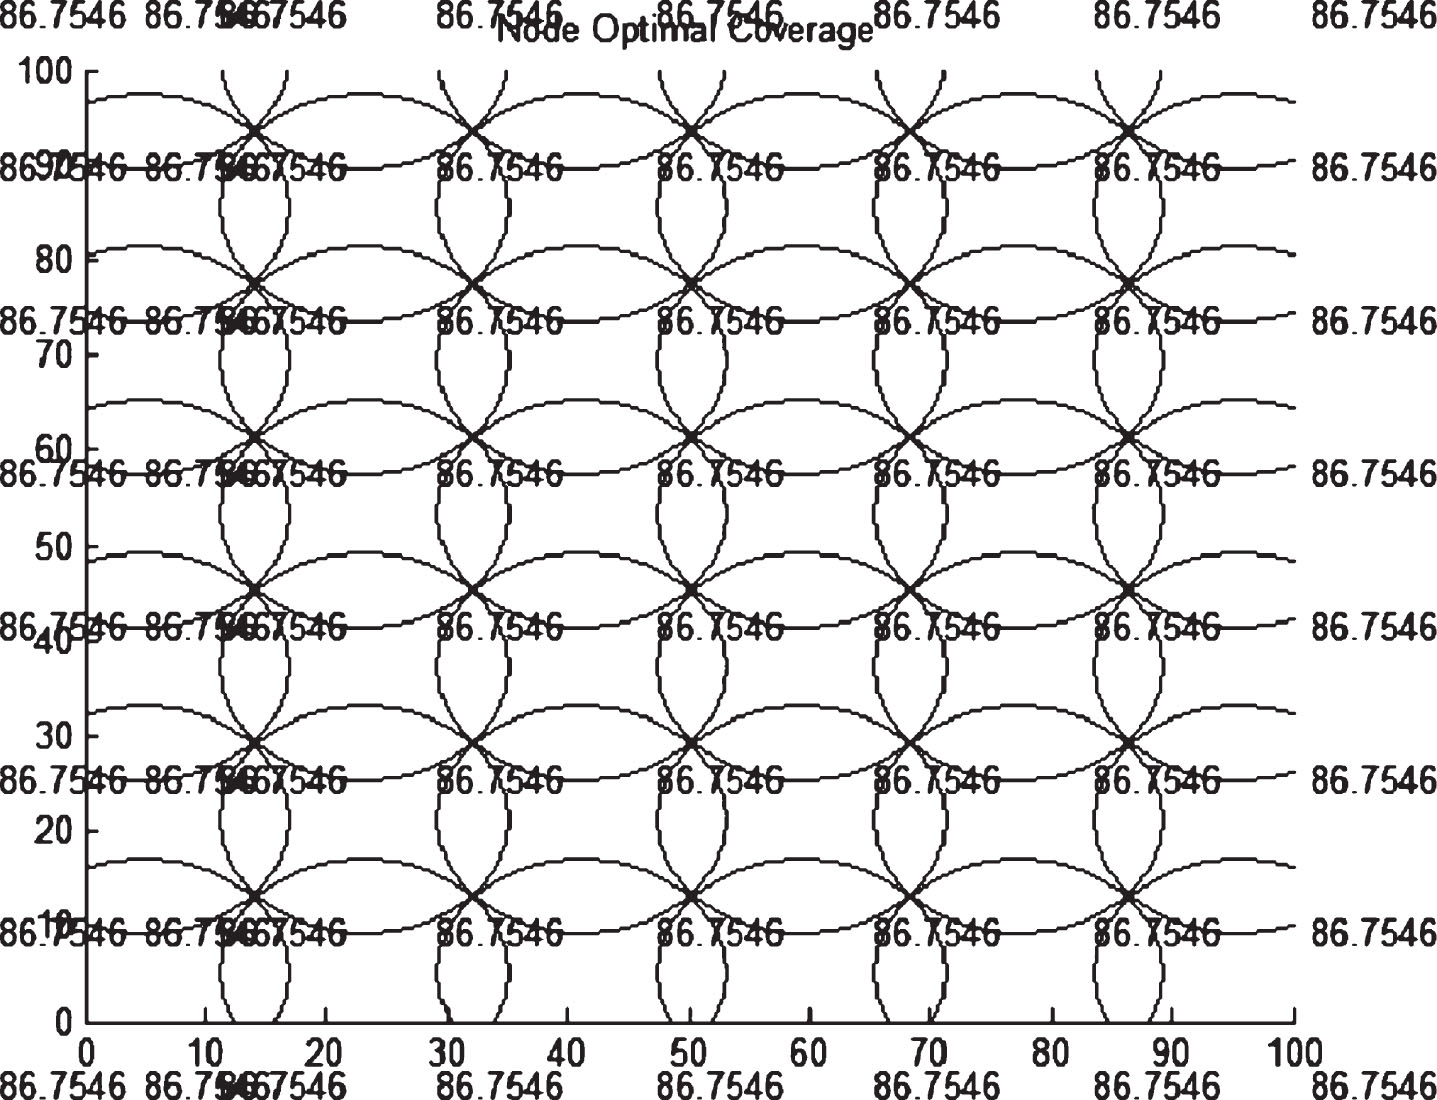
Optimal network coverage with overlapping area.
Random distribution of 100 nodes with overlapping area.
Figure 12 indicates that the overlapping areas of each sensor are equal, which is 86.7546 sq. unit. This concludes that the redundant information sensed by each of the sensors are equal. In contrast, Fig. 13 indicates that the overlapping areas are different for a randomly distributed case, which means each sensor are sensing the different amount of redundant information.
Figures 14–17 shows the coverage using the IGA-BACA algorithm for 50, 100, 150, 200 generations respectively. As the number of generation is increasing from 50 to 200, the coverage tends towards optimal coverage and hence, the number of redundant nodes decreases.
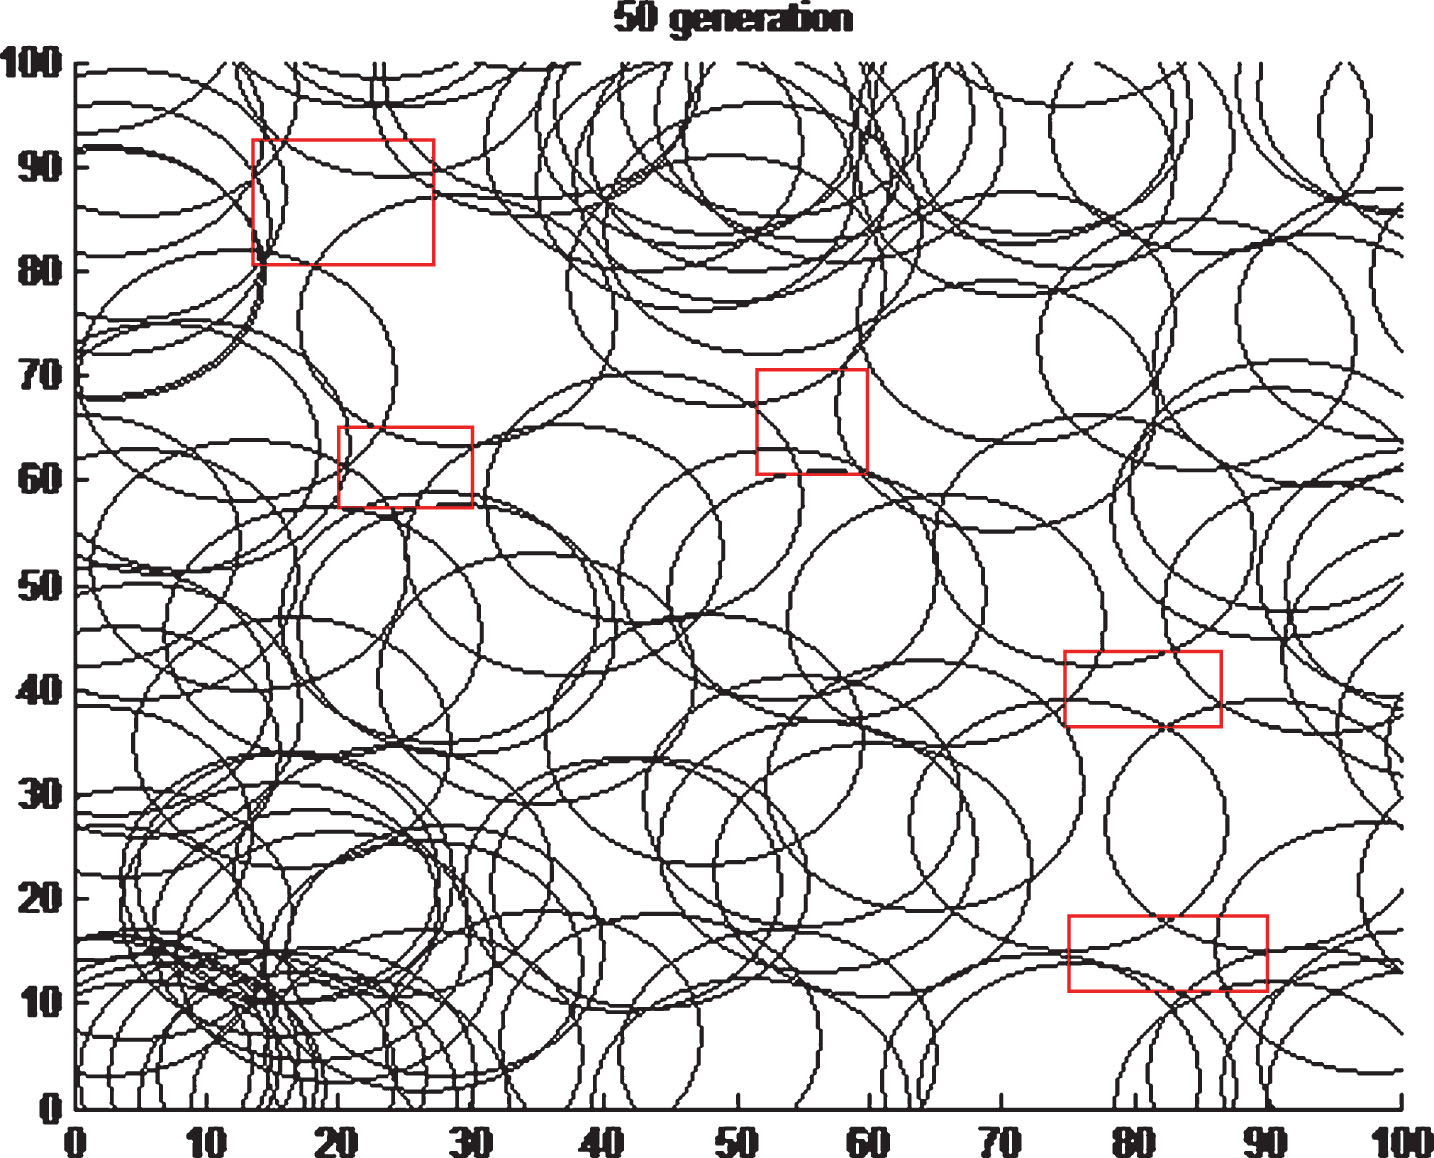
50 Generation of IGA-BACA.
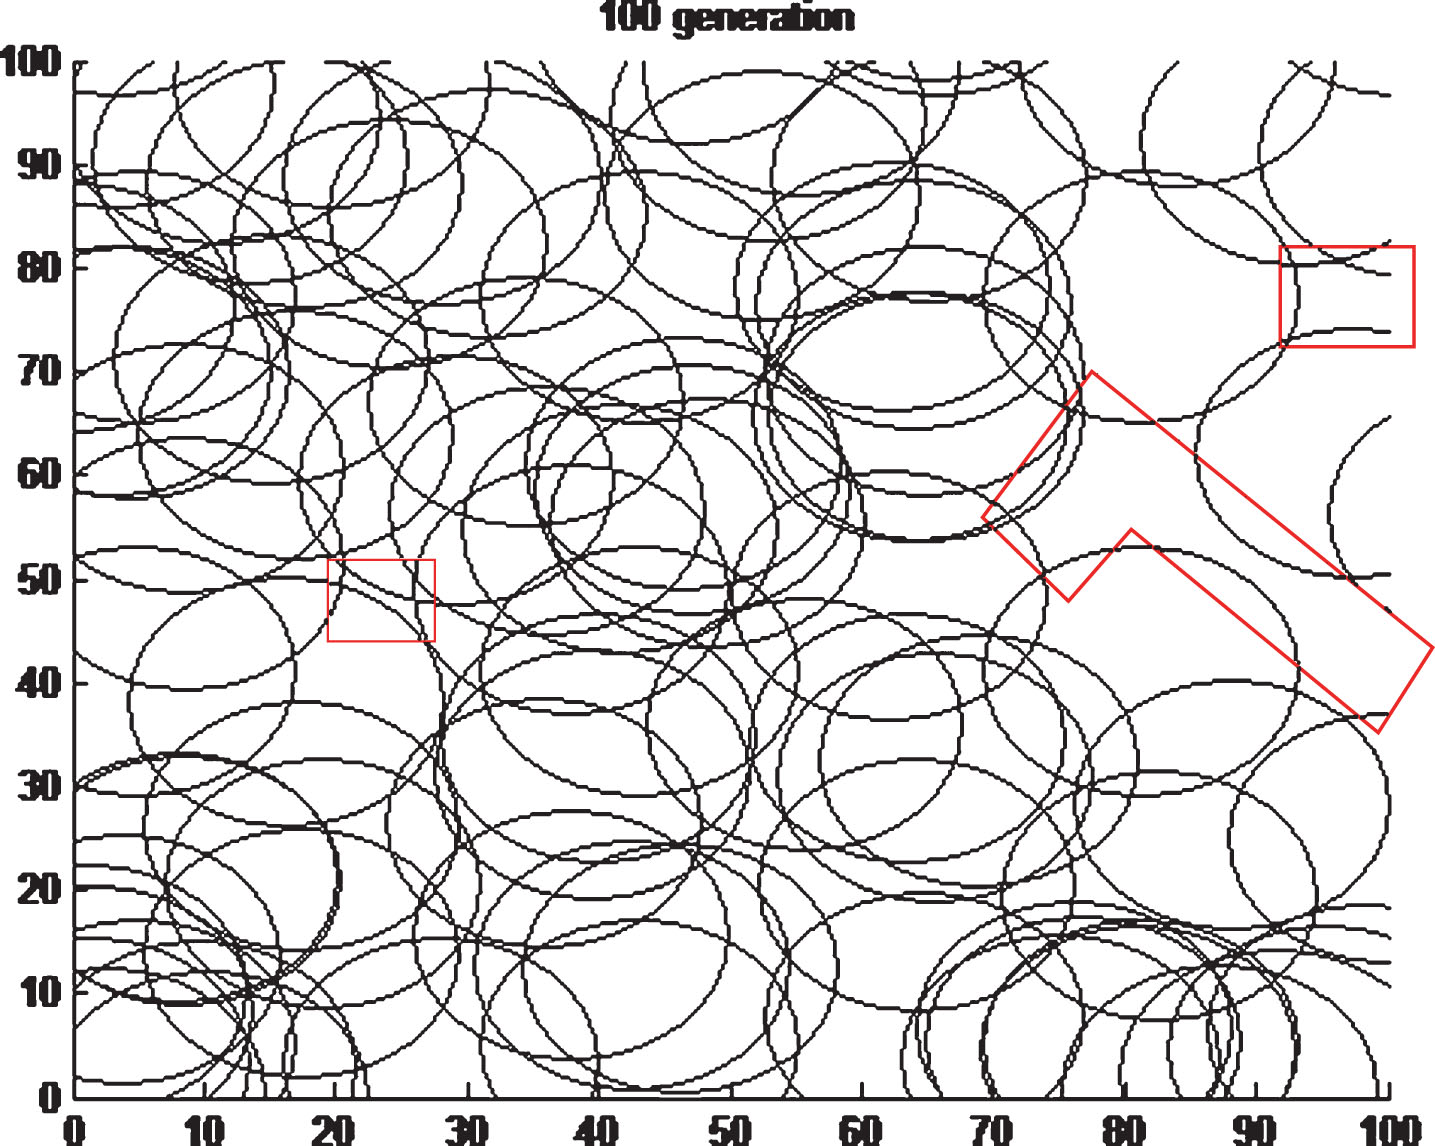
100 Generation of IGA-BACA.
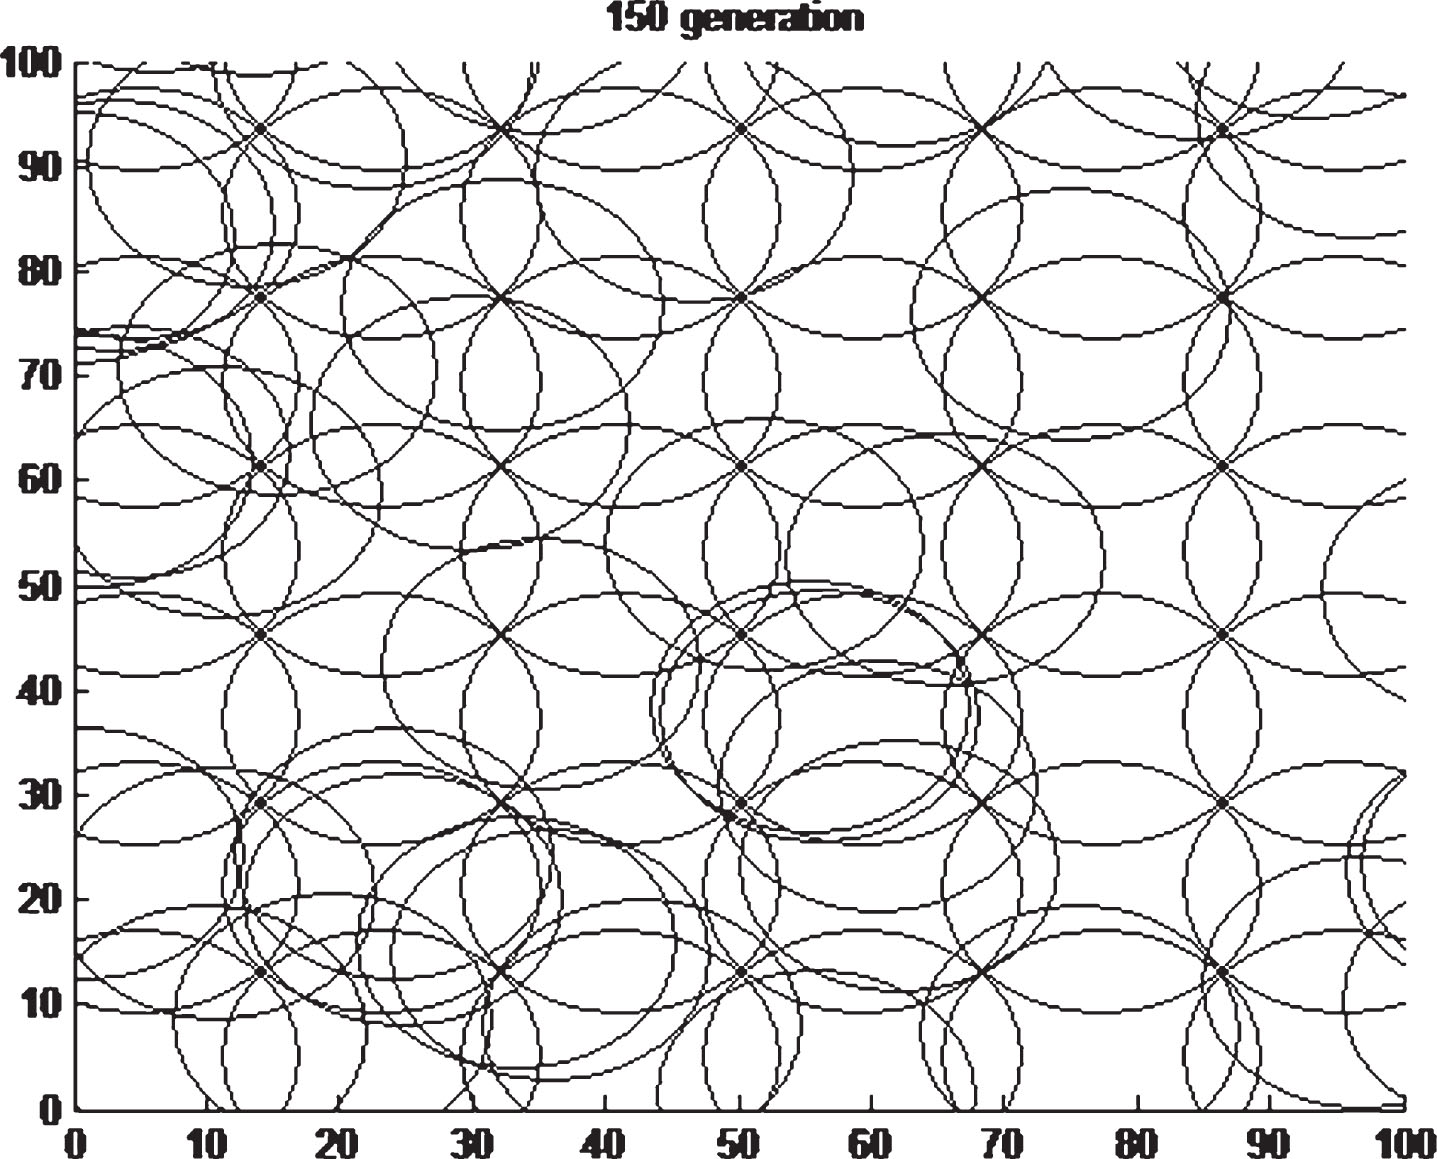
150 Generation of IGA-BACA.
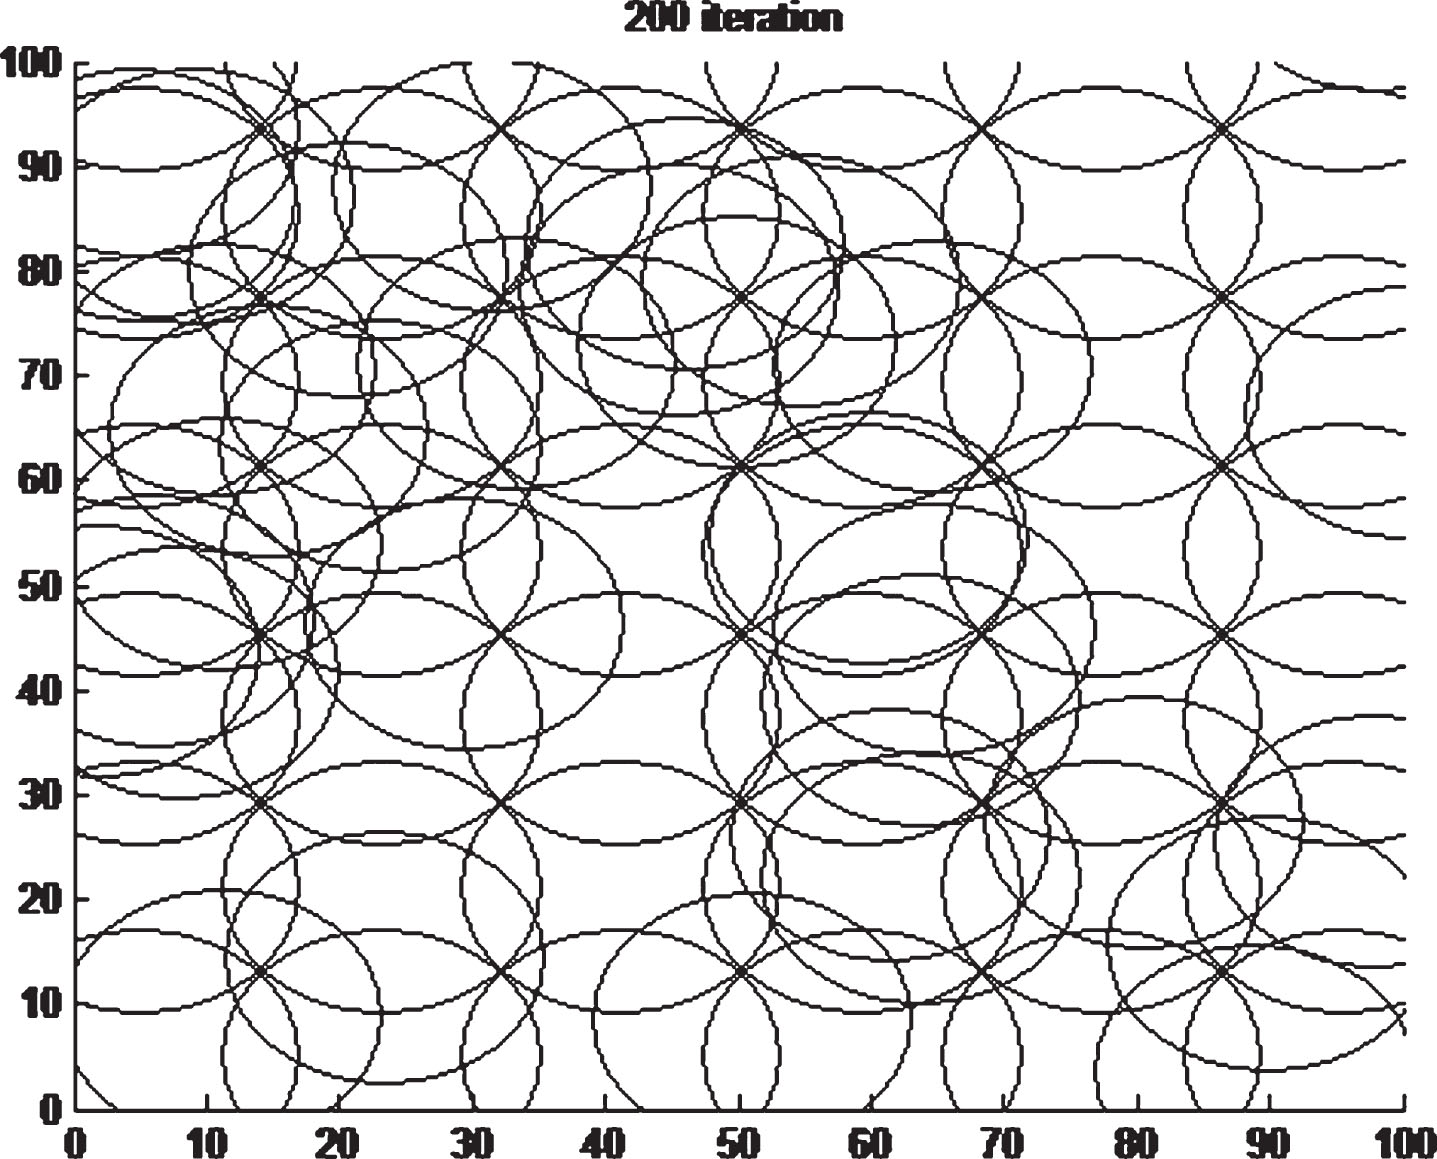
200 Generation of IGA-BACA.
To quantify the redundant information relatively, a graph is plotted between the amount of redundant information sensed by the sensors to the no. of iterations or generations, as illustrated in Fig. 18. It has been noticed from Fig. 18 that as the number of iterations is increased, i.e. as the network coverage tends towards the optimal coverage the amount of redundant information sense by the sensor decreases, and also the slope of decrements also increases for higher values of iterations. To evaluate the performance of the combined meta-heuristic over WSNs, the relative redundant information is compared with the existing meta-heuristic approaches, namely GA and ACO.
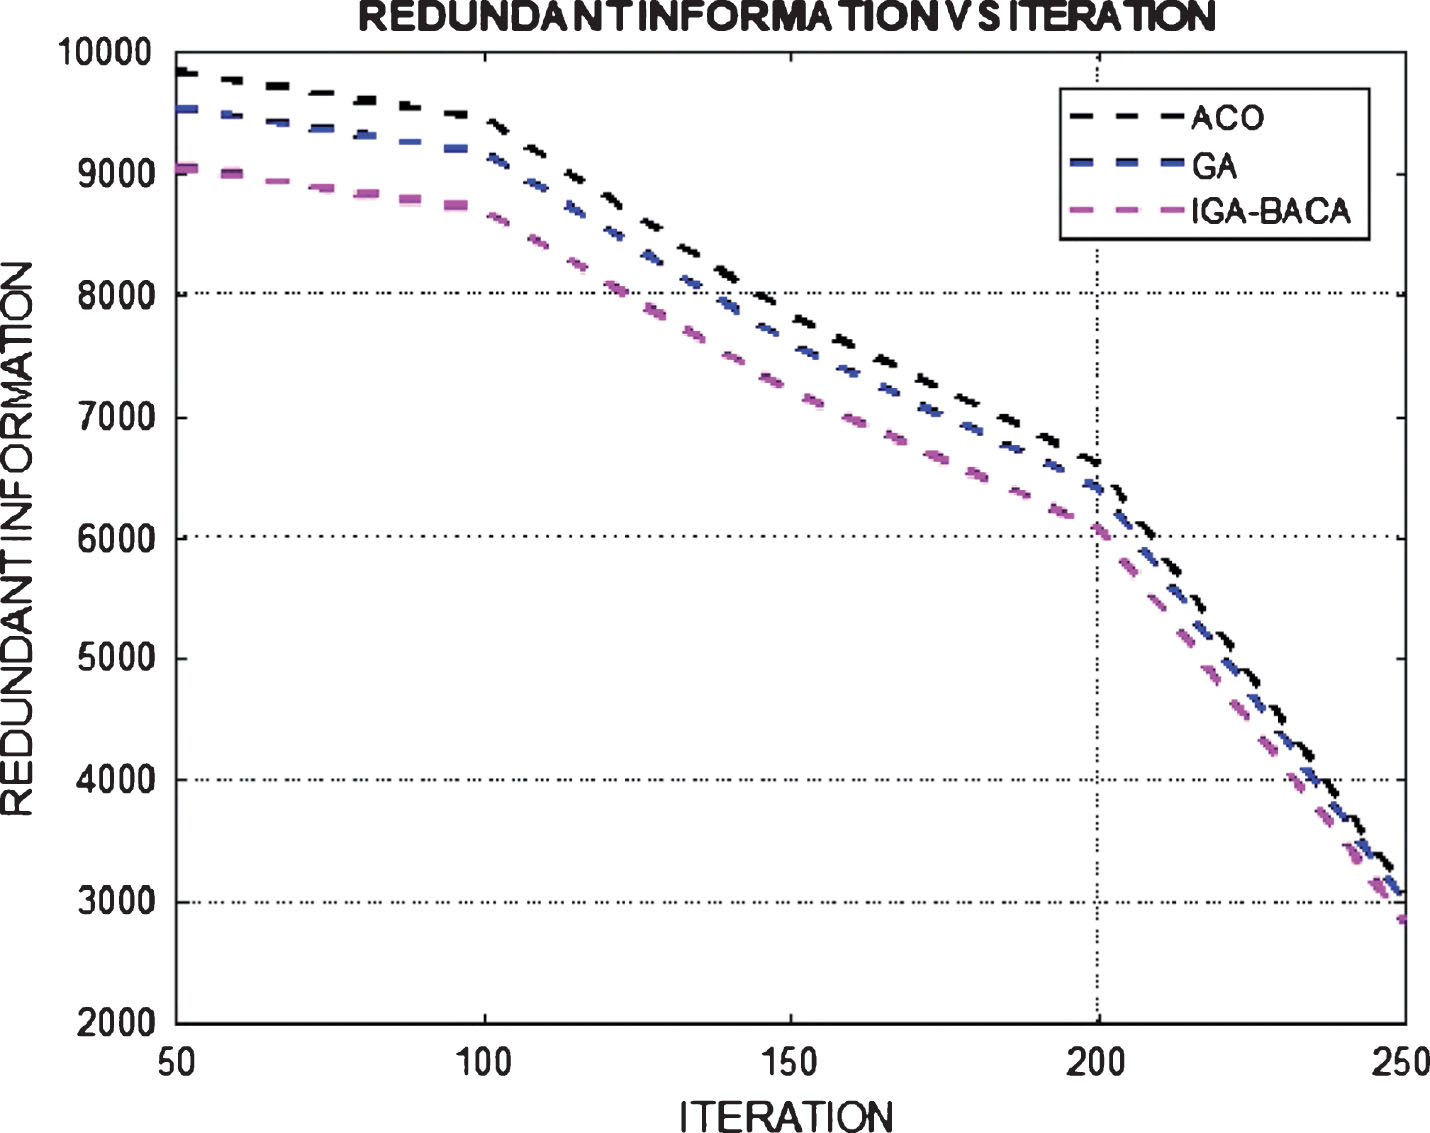
Redundant information vs iterations.
In this paper we propose an effective way to compute and reduce the redundant information sensed by the sensors in WSNs. It is essential to reduce the overlapping sensing regions as sensing the same set of information results in loss of time and limited energy of the sensors. The optimal coverage is achieved using the combined technique of IGA-BACA. It has been observed that as the number of iterations is increased, the network coverage tend towards optimal coverage. With optimal coverage, the redundant information sensed by the sensors gets reduced to its lowest possible value. Although this approach gives better performance but, much is yet to be explored, especially if one can use other combined meta-heuristic such as lion optimisation, ant lion optimisation etc. to reduce the redundant information.
Footnotes
Acknowledgments
The authors would like to thanks the editor and reviewers for their valuable suggestions.