
Abstract
The study presents Proposed Data Envelopment Analysis (DEA) approaches for intelligent business analytics of the US Airline industry to gain more knowledge, control, flexibility and trade-off among various inputs to the system/industry. Three new proposed DEA models are presented. The results obtained provide credible data analytics and intelligent business suggestions. Firstly the proposed input oriented and the proposed output oriented DEA models are formulated. The proposed input oriented DEA model suggests how resource utilization can be minimized while operating in with the same output level. Further, the proposed output oriented model suggests how output efficiency can be increased to a benchmark level while keeping the input at the same level. Then the proposed Slack Based DEA model SBM is formulated. The proposed models are then solved with the DEA Excel Solver for finding the efficient points in the Pareto Frontier. Representing the Pareto Frontier as a function of total system revenue gives necessary information about the inputs growth and their trade-off with the output. Furthermore, the proposed Slack Based DEA model (SBM) intelligently measures the technical efficiency of each airline. The results show that three airlines namely American, United and Jet Blue are weakly efficient operating below the proposed SBM efficient frontier. Furthermore, the results intelligently suggest the possible inputs reduction and outputs increases to get to the efficient frontier for the management of the concerned airlines. The proposed SBM slacks suggest the possible areas of improvement for future planning and optimal operating input/output levels for the top management of the weakly efficient airlines.
Keywords
Introduction
Quite a reasonable source of literature is available studying the efficiency of airlines. Some of the studies like [1–3] employed a parametric test for measuring the efficiency of the airlines, but most of themproposed a non-parametric approach. Data envelopment analysis (DEA), a non-parametric approach, based on the linear programming model, gives an efficient frontier for evaluating the performance of homogeneous Decision Making Units (DMU) [4–7]. It is assumed that each DMU uses a specific number of inputs producing a certain quantity of outputs. DEA determines the DMUs that are categorized more efficient than the other operating units. Furthermore, it helps identify reference set of DMUs as role model operating units for each inefficient DMU. Generally DEA uses an input oriented or an output oriented modeling approach.
Most of the studies concerning DEA for performance evaluation in airline industry focus on finding efficiency/productivity of airlines within a specific period of time. In this study we propose a DEA approach to find the operational performance of thirteen US airlines and the trade-offs among the inputs. An overview of the literature concerning DEA in airline industry is given in Table 1. Majority of the studies considered Passenger-Kilometers (RPK) and another Freight Tonne-Kilometres (FTK) or Non-Passenger Revenue (NPR) as a measure of revenue. Generally the inputs considered are the Labor, Fuel and Material costs or total Operating Costs (OC), Capital stock or Flight equipment and Non-Flight Assets (NFA), and in some cases Available Seat Kilometres (ASK) or, often, Available Tonne-Kilometres (ATK). Some researchers have considered service quality as an input measure. Regarding the DEA approach, these studies are based on either Constant Returns to Scale (CRS) or Variable Returns to Scale (VRS). Some of the studies considered input oriented while others considered output oriented approach. Most of them use a radial measure. Some of them proposed an additive, hyperbolic and cost or profit efficiency DEA models.
Overview of the literature concerning DEA in airline industry
Overview of the literature concerning DEA in airline industry
The operational performance of airlines was studied in Schefczyk [8]. Due to different accounting and taxation rules and the non availability of financial data, the operational performance paradigm gives a better performance indicator for benchmarking airlines Schefczyk [8]. To optimize the airline revenue, Ryzin and McGill [9], investigated a seat protection adaptive approach using the relative frequencies of certain seat-fillings. Instead of a deterministic linear programming model for airlines revenue management, Yu-Hern and Chung-Hsing [10] used a multi objective approach to evaluate the competitive performance of Taiwan’s five major domestic airlines. The results identified an airline competitive advantage over its competitors. The proposed approach was applicable in cases where subjective judgments on performance ratings were not reliable. Gallego et al., [11], proposed a choice-based deterministic linear programming model (CDLP). Thomas and Belobaba [12], studied the pricing and revenue management strategies for low fair airlines. They showed that with the entry of low-fare carriers, the revenue of existing carriers was significantly affected. Qain and Ryzin [13], proposed optimal offer sets by extending the notion of “efficiency” developed in Talluri et al., [14], to address a single-leg, choice-based revenue management problem. They showed that while scaling demand and capacity, these efficient sets offer optimal policy.
Cristina et al., [29], used data envelopment analysis and then total factor productivity for airline performance evaluation, and compared the results of both techniques. They investigated that low-cost carriers are generally more efficient than full-service carriers. Dipasis [30], used data envelopment analysis to investigate inter-temporal and peer group efficiency, for US airlines for 1985–2006, concluding that airlines efficiency is robustly affected by block hours and decreasing them increases efficiency. Carlos et al., [31], applied a B-convex model to investigate the technical efficiency of a sample of US airlines from 1998–2010, revealing that US airlines’ efficiency can be influenced by the size, mergers and acquisitions, and time. Stefan et al., [32] studied the effects of deregulation, privatization and strategic alliances on the productivity of international airlines. The research revealed that deregulation increases aggregate productivity, strategic alliances have an ambiguous effect, whereas, state ownership has no effect. Lee and Worthington [33], pointed out that the period of (2001–2005), was a period of financial turmoil for the US airline industry, opening opportunities for low-cost carriers to become more competitive. The paper measures the technical efficiency for 42 national and international airlines in 2006 using the data envelopment analysis (DEA) bootstrap approach. Carlos and Nicolas [34] used data envelopment analysis (DEA) for the performance evaluation of a sample of Association of European Airlines for the period 2000 to 2005. In their research, the authors used a two-stage DEAprocedure.
Rai [35] applied data envelopment analysis to US airlines industry for the period of 1985–1995 to determine technical efficiency of each airline for each year. Jain and Natarajan [36] used DEA to study the technical and scale efficiencies of all airlines across service type, size and ownership structures operating in India during 2006 to 2010. In studies like [37, 38] various methods including Data Envelopment Analysis (DEA) method to analyze the productivity of airlines over the past three decades. The authors of [39] used DEA and proved that 40% National airlines operating in Europe were effective, whereas 34% were nearly effective, in the year 2013. Rubem et al., [40] uses DEA and dynamic clusters to analyze the operational performance of Brazilian air carriers from 2007 to 2010.
J.-Li et al., [41] applied DEA to the Association of Southeast Asian Nations airlines and deduced that aircraft efficiency, operating cost efficiency, and available seat efficiency are the lowest, better and the best, respectively. Closed loop constrained performance based adaptive fuzzy controlled nonlinear system dynamics were studied in [42, 43].
This study proposes input/output and Slack Based DEA models for the operational performance, efficiency, productivity and business analytics of the thirteen US airlines. Business analytics can be defined as a scientific process used to transform data into insight to help make better decisions. According to this definition many research areas fall under the umbrella of intelligent business analytics, such as are the techniques of operations research, management sciences, statistics, economics, information technology, efficiency and productivity analysis [44]. Data envelopment analysis is one of the main approaches to efficiency and productivity analysis. In this research the intelligent business analytical strengths of the data envelopment analysis technique are exploited to draw insight from the data of major US-Airlines to comment on the efficiency and productivity of the various actors in the airline industry. In this regard, first of all the input oriented model is proposed, intelligently suggesting the possible inputs decreases for an inefficient airline to come to the efficient frontier and become productive. This is followed by an output oriented model, suggesting the possible outputs increases for an inefficient airline to come to the efficient frontier and become productive. Finally, the SBM envelopment model suggests the possible inputs decreases and outputs increases simultaneously for an inefficient airline to move to efficient frontier and become productive. The input and output oriented DEA models are first formulated and then solved with the help of the DEA Excel Solver. In addition, the input and output slacks projecting the weakly efficient DMUs are proposed. In this line the Slacks-Based DEA Model (SBM) by Tone [45], for efficiency will be employed. The resulting SBM efficient DMUs are unit-invariant and the technical efficiency of the target operating units are guaranteed. The SBM slacks analytics intelligently suggest the possible operating input/output, decrease/increase for the inefficient airlines; enable the top management better plan and operate the weakly efficientairlines.
The objectives of the research are given below: To propose input oriented DEA model for competitive performance of the US airlines. To propose an output oriented DEA model for performance evaluation of the US airlines. To propose a slack based DEA model (SBM) for competitive performance of the USairlines. To make intelligent business analytic based on the results to benchmark and sort out possible efficient performers for the inefficientairlines. To solve the proposed input oriented DEA model, output oriented DEA model and SBM using DEA Excel Solver.
This research is structured as follows. Section 2 presents the proposed input oriented DEA model, proposed output oriented DEA model and the proposed Slack based model. It also review of the performance of the US Airlines, the inputs and outputs specifications and the operating financial data corresponding to thirteen US airlines. After proposing the models the formulated models are solved with the help of the DEA Excel Solver. Section 3 presents the results and business analytics of the models developed in Section 2. This is followed by a comprehensive business analytics discussion in Section 4, where, the results are analyzed and elaborated. Finally, Section 5 gives summary and concluding remarks of the research.
The primary aim of the paper is to propose a DEA model for the operational performance of major US airlines. In addition to a return to scale (RTS), we propose a slack based DEA model SBM for checking the technical efficiency of each airline. The proposed SBM proposes possible reductions in inputs (costs) labeled as total fuel expenses (TFE), total labour, management and cockpit cost (TLM&CC) and total non labour and maintenance expenses (TN&ME) for the weakly efficient airlines. The input/output dataset (for the year 2010) used in the study is obtained from the airline data project (ADP) powered by Massachusetts Institute of Technology (MIT) based on US Department of Transportation Form 41 (US DOT Form 41), Bureau of Transportation Statistics and Securities and Exchange Commission (SEC). The US Dot Form 41 is a credible document used for analysis aircraft and employee productivity, operational performance and the related statistics. The SEC filings provide primary financial airline statistics. Although the ADP project consisting of the data for about 15 US airlines, our sample take into consideration only 13 airlines because of the unavailability of data for some airlines.
Our research is mainly on the operational costs/revenues of the airlines, thus we take into consideration the inputs/outputs that are important from the operational point of view. One such important input is the total fuel expenses in million dollars. Another such cost (TLM&CC) is a grand sum of the total labour, management and cockpit costs incurred in the operation of the individual airline. The third important input consisting of the total non labour and maintenance expenses denoted as (TN&ME). A total system revenue as a single output is composed of the system total passenger revenue, system total cargo revenue and the ancillary fee revenue. The input/output data is presented inTable 2.
Input–output data for US airlines
Input–output data for US airlines
Based on Table 2, the proposed input oriented DEA model for the system is formulated asmodel (1).
The input oriented envelopment model has the capability of suggesting the possible input decreases, keeping the current output level, to move the inefficient airlines to the efficient frontier.
Where the subscript o denote the DMU underevaluation.
The symbols used in (1) are explained as below.
θ = Input oriented efficiency measure.
ɛ = Weight the inputs/outputs slacks/surplus can be decreased/increased.
λ j = Return to scale measure for airline “j”.
J = 1,2,3, ... ,13.
The proposed output oriented DEA model follows as (2). The output oriented envelopment model has the capability of suggesting the possible output increases, keeping the current inputs level, to move to the efficient frontier.
Where the subscript o denote the DMU underevaluation.
φ = Output oriented efficiency measure.
The proposed Slack Based DEA Model (SBM) determines the technical efficiency of the airlines [45]. The proposed SBM efficiency accounting for a complete business analytics and inputs/outputs slacks provide a more complete and accurate framework. Moreover, SBM is units invariant and more intelligent deductions can be drawn from its results. The SBM efficiency depends on the ratio of the average amount of input decrease to the average amount of output increase. A score of “1” for the SBM efficiency indicates a situation whereby none of the inputs can be decreased and none of the outputs can be further increased. The proposed SBM for the airlines is presented in (3).
The SBM intelligently identifies the weakly operating airlines. Furthermore, it helps suggest all the possible inputs reductions and output increases for each individual airline to become efficient.
The results obtained from the solutions of the proposed DEA models formulated are used to analyze the business and performance of the airlines. The proposed DEA models formulated for the performance evaluation of the US airlines are solved by using the DEA Excel Solver. The proposed input and output oriented DEA score are recorded in Table 3. The input oriented model suggesting the possible decrease in the input level, keeping the current output level. Table 4 gives input oriented VRS efficiency along with the reference set for the inefficient airlines. Three airlines namely American, United and Jet Blue are operating inefficiently for which the reference set is given in the last column of the table and visualized in the Figure 1.

Efficient RTS Frontier for Proposed Input Oriented Model.
Proposed input and output oriented DEA scores
Proposed input oriented VRS efficiency and reference set for inefficient airlines
This suggests the three airlines American, United and Jet Blue should decrease their inputs as its reference to come up to the efficient frontier.
The proposed input oriented CRS efficiency and the reference set for the inefficient airlines is given in Table 5 and visualized in Figure 1. The business analysis suggests that five out of thirteen airlines lie on the input oriented CRS frontier as shown in the Figure 1 and efficient.
Proposed input oriented CRS efficiency and reference set for inefficient airlines
The proposed output oriented model suggesting the potential increases in the output level while keeping the current level of the inputs used. Table 6 presents the output oriented VRS efficiency of the airlines along with the reference set for the inefficient airlines as visualized in Figure 2.
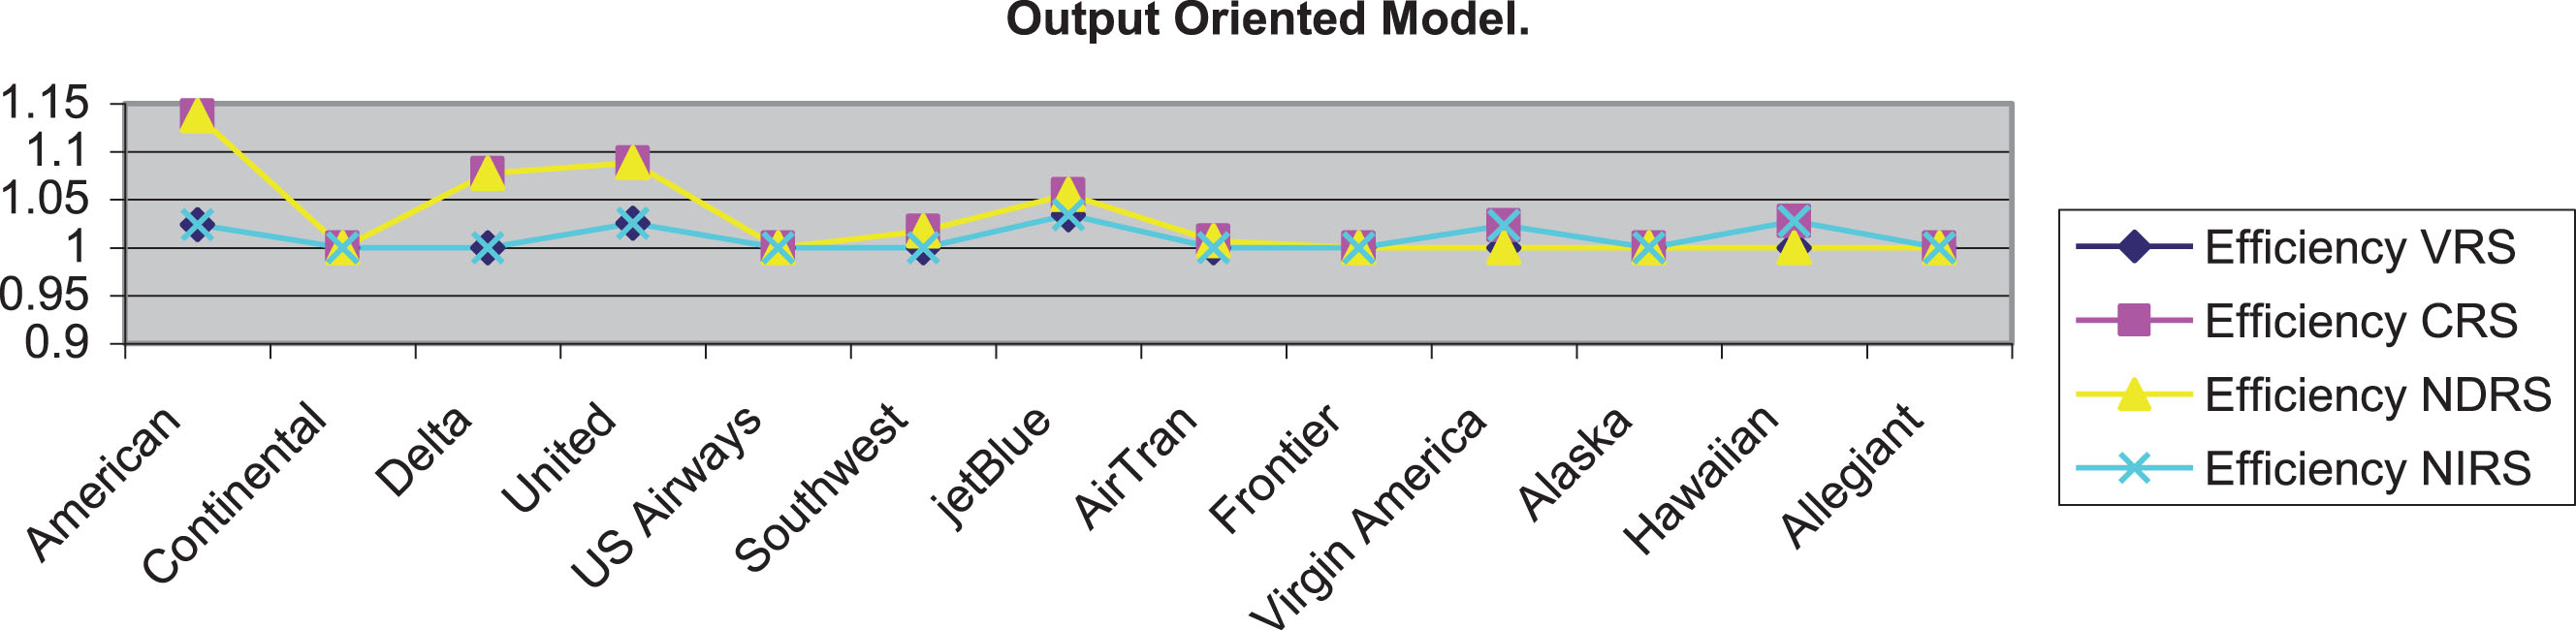
Efficient RTS Frontier for Proposed Output Oriented Model.
Proposed output oriented VRS efficiency and reference set for inefficient airlines
Again according to the output oriented CRS model three airlines American, United and Jet Blue are operating inefficiently. The output oriented CRS efficiency presented in Table 7 and visualized Figure 2. Five out of thirteen airlines are on the output oriented CRS frontier and the situation is visualized in Figure 2.
Proposed output oriented CRS efficiency and reference set for inefficient airlines
The analysis of the SBM efficiency considers the input reduction as well as the output augmentationsimultaneously to come to the efficient frontier. Table 8 presents the possible input reduction and output increase for each airline. The airlines with non zero slacks are inefficient.
Input/output slacks for the proposed slack based model
In this section, the results presented in Section 3, are comprehensively analyzed and useful deductions are drawn. The results of the input oriented model, output oriented model and SBM DEA models are elaborated in subsections, 4.1, 4.2 and 4.3, respectively.
Discussions on proposed input oriented model
The analysis of the input oriented model suggests the possible input decreases, keeping the current output level, to move the inefficient airlines to the full efficient frontier. The business analysis of the input oriented VRS model suggests three airlines namely, American, United and Jet Blue operating inefficiently. The reference set for these airlines are given in Table 4 and can be illustrated as:
American Airlines should decrease its inputs levels to Continental, Delta or South West, while operating at the same output level, to become efficient.
United Airlines should decrease its inputs levels to Continental, Delta or US Airways to become efficient.
Jet Blue should decrease its inputs levels to Continental, South West, Air Trans or Alaska, while operating at the same output level, to be on the input oriented efficient frontier.
The input oriented CRS model suggests only five airlines are operating efficiently. The reference set for these airlines are given in Table 5 and can be illustrated as:
American Airlines should decrease its inputs levels to Continental, Frontier or Alaska, while operating at the same output level, to become efficient.
Delta should also decrease its inputs levels to Continental, Frontier or Alaska, while operating at the same output level, to become efficient.
United Airlines should decrease its inputs levels to Continental, US Airways, or Alaska, to become efficient.
US Airways should decrease its inputs levels to Alaska or Allegiant, while operating at the same output level, to become efficient.
South West should decrease its inputs levels to Alaska or Allegiant, while operating at the same output level, to become efficient.
Jet Blue should decrease its inputs levels to Alaska or Allegiant, while operating at the same output level, to become efficient.
Virgin America should decrease its inputs levels to Frontier or Allegiant, while operating at the same output level, to become efficient.
Hawaiian should decrease its inputs levels to Continental, Frontier or Alaska, while operating at the same output level, to be on the input oriented efficient frontier.
Discussions on proposed output oriented model
The analysis of the output oriented model suggests the possible output increases, keeping the current input levels, to move to the efficient frontier.
A comprehensive business analytics of the output oriented VRS model suggests three airlines namely, American, United and Jet Blue operating below the output oriented VRS frontier. The benchmark airlines for these airlines are given in Table 6 and can be illustrated as:
American Airlines should increase its output level to Continental, Delta or South West, while operating at the same input levels, to become efficient.
United Airlines should increase its output level to Continental, Delta or US Airways to become efficient.
Jet Blue should increase its output level to Continental, South West, Air Trans or Alaska, while using the same inputs, to be on the output oriented efficient frontier.
The output oriented CRS model suggests only five airlines are operating efficiently. For the inefficiently operating airlines, possible benchmark airlines are given in Table 7 and can be elaborated as:
American Airlines should increase its output to Continental, Frontier or Alaska, while using the same inputs, to become efficient.
Delta should also increase its output to Continental, Frontier or Alaska, while operating at the same input levels, to become efficient.
United Airlines should increase its output to Continental, US Airways, or Alaska, to become efficient.
South West should increase output to Alaska or Allegiant, while operating at the same input levels, to become efficient.
Jet Blue should increase its output to Alaska or Allegiant, while operating at the same input levels, to become efficient.
Air Trans should increase its output to Alaska or Allegiant, while operating at the same input levels, to become efficient.
Virgin America should increase its output to Frontier or Allegiant, while operating at the same input levels, to become efficient.
Hawaiian should increase its output to Continental, Frontier or Alaska, while operating at the same input levels, to be on the output oriented efficient frontier.
Discussions on proposed slack based model
The most intelligent analytics proposed by the Slack Based DEA model (SBM) suggests the possible inputs decreases and output increases, simultaneously, to move to the inefficient airlines to the efficient frontier. The input reduction and the output increase are imposed simultaneously in the SMB model, making the model more powerful and credible. Moreover, it intelligently suggest the possible reductions in inputs and increases in the outputs level to come the SBM efficient frontier.
The SBM suggests three airlines namely, American, United and Jet Blue operating below the efficient frontier. The results are given in Table 8 and can be explained as:
American Airlines should decrease its Total Fuel Expanses (TFE) by 245.5 million dollars and Total Labour Maintenance & Cockpit Cost (TLM&CC) by 1362.4 million dollars, to become efficient.
United should decrease its Total Labour Management & Cockpit Cost (TLM&CC) by 357.7 million dollars, Total Non Labour & Maintenance Expenses (TN&ME) by 788.53 million dollars and increase its revenue by 127.25 million dollars to become efficient.
Jet Blue should decrease its Total Fuel Expenses (TFE) by 22.33 million dollars and Total Labour Maintenance & Cockpit Cost (TLM&CC) by 202.82 million dollars, to become efficient.
Conclusions
This research proposes input/output oriented Data Envelopment Analysis (DEA) models for evaluating the business analytics and the operational performance of US Airlines. Three DEA models are proposed and then data is simulated on the proposed models. The results obtained provide credible data analytics and intelligent suggestions. The results show that three airlines namely American, United and Jet Blue lie below the input oriented VRS, output oriented VRS, and SBM efficient frontiers. Three inputs and one output dataset is used for this purpose. In addition to the input and output oriented models a slacked based model is also proposed to identify weakly efficient airlines. The linear programming model for each DMU is solved with the DEA Excel Solver. The business analysis and the results show that five out of thirteen airline lie on the input/output oriented CRS frontier. The proposed input/output oriented VRS model suggests that three airlines namely American, United and Jet Blue are below the input/output oriented VRS frontier. In addition to this a more credible proposed SBM identify the possible inputs reduction and output increments for the weakly efficient airlines suggesting the future operating guideline for these airlines. The analysis and results of the proposed SBM closely agree with the proposed input/output oriented VRS model, suggesting American, United and Jet Blue as lying below the proposed SBM efficient frontier. The findings of the proposed SBM are particularly important, for to identify the possible areas of improvement for the inefficient airlines and intelligently operating the future airlines. The research is significant for it further lead to the future needs, planning and guidelines for operating the inefficient airlines. The proposed models give more knowledge, control, flexibility and trade-off among various inputs to the system/industry.
Author conflict of interest statement
The authors acknowledge no conflict of interest in publishing this manuscript.
Footnotes
Acknowledgments
The authors are thankful to the respectable reviewers for their valuable reviews, suggestions and views.