
Abstract
Learning from high-dimensional imbalanced data is prevalent in many vital real-world applications, which poses a severe challenge to traditional data mining and machine learning algorithms. The existing works generally use dimension reduction methods to deal with the curse of dimensionality, then apply traditional imbalance learning techniques to combat the problem of class imbalance. However, dimensionality reduction may cause the loss of useful information, especially for the minority classes. This paper introduces an ensemble-based method, HIBoost, to directly handle the imbalanced learning problem in high dimensional space. HIBoost takes into account the inherent high-dimensional hubness phenomenon, i.e., high-dimensional data tends to contain the singular points (hubs and anti-hubs) which frequently or rarely occur in k-nearest neighbors of other points. For the singular hubs and anti-hubs induced by high dimension, HIBoost introduces a discount factor to restrict the weight growth of them in the process of updating weight, so that the risk of over fitting can be reduced when training component classifiers. For class imbalance problem, HIBoost uses SMOTE to balance the training data in each iteration so as to alleviate the prediction bias of component classifiers. Experimental results based on sixteen high-dimensional imbalanced data sets demonstrate the effectiveness of HIBoost.
Introduction
The learning of high-dimensional imbalanced data is encountered in many important real-world classification problems, such as text classification, image classification, cancer diagnosis using gene expression data. In high dimensional feature space, most learning algorithms do not work effectively and efficiently due to the curse of dimensionality [1], while the imbalanced class distribution, where some classes (the majority classes) possess much more samples than other classes (the minority classes), can result in that the learned classifiers have the prediction bias towards the majority classes, eventually damaging the classification accuracies on the minority classes [2]. Both high dimension and class imbalance are the significant factors for aggravating the difficulty degree of learning.
When class imbalance is intertwined with the problem of high dimension, the classification performance can be greatly depreciated [3, 4]. Particularly, high dimension can further exacerbate the problem of predicted bias in learning algorithms [3], because the distinction between the majority class samples and minority class samples is weakened in the high dimensional space, and the risk of misclassifying the minority samples as the majority classes will be increased. The most straightforward way on handling high-dimensional imbalanced data is reducing the dimension of data, and then applying imbalance learning techniques to solve the class imbalance problem [4]. However, dimensionality reduction methods may lead to the information loss of data. Moreover, the new feature subset (or space) produced by dimensionality reduction may less relevant for the identification of minority class samples due to the use of improper loss function or feature evaluation metric in the context of class imbalance [5, 6].
Recently, some research explores a new perspective, that is, different from avoiding the curse of dimensionality by dimensionality reduction, it embraces dimensions to directly deal with the high-dimensional data learning by utilizing the inherent high-dimensional phenomenonhubness [7]. The phenomenon of hubness refers to: as the dimension of data increases, some points (termed hubs) will frequently occur in the k-nearest neighbor lists of other points. Among them, hubs which often appear as a neighbor of label mismatch are called bad hubs. It has been found that the phenomenon of hubness can significantly affect a series of machine learning algorithms [1]. For instance, in kNN classification, bad hubs may frequently appear ink-nearest neighbor members of test samples and provide incorrect class recommendation information, which causes the deterioration of classification performance.
Although many hubness-aware learning algorithms have been proposed in learning paradigms such as nearest neighbor classification, clustering, outlier detection [1], there are few works involving to take hubness into account in ensemble learning algorithms, i.e., hubness-aware ensemble, to the best of our knowledge. Standard ensemble learning methods aim to boost the prediction accuracy by training several different component classifiers and combining their decisions [8, 9]. In the past few decades, ensemble learning methods have demonstrated their great successes and led to significant improvements in a wide range of classification problems [10]. It also has been shown that ensemble algorithms such as boosting, and bagging can combine with some imbalance learning techniques to produce the hybrid solutions addressing the class imbalance problem, with positive results [11].
Therefore, this work devotes to take into account the influence of hubness on the boosting ensemble [9], and then integrate with Synthetic Minority Oversampling TEchnique (SMOTE) [12] to directly deal with the imbalanced learning problem in high-dimensional space. Specifically, given that both hubs and anti-hubs in high-dimensional space are two kinds of singular points (samples) [1], the weight updating mechanism of boosting ensemble may make the sample weights to be centralized on these singular points, which prevents component classifiers from learning normal samples. This paper proposes a hubness-aware ensemble algorithm HI Boost. For the hubs and anti-hubs induced by high dimension, HI Boost introduces a discount factor to slow down the excessive growth of their weights in the process of weight updating, so that the risk of over fitting can be reduced for component classifiers. With regard to the class imbalance problem, HI Boost performs SMOTE on the training data in each boosting iteration. By leveraging SMOTE to create new minority synthetic samples, it mitigates the prediction bias of component classifiers and increases the diversity among component classifiers.
In summary, this work makes the following contributions: (1) We analyze the impacts of hubness phenomenon for boosting ensemble methods, so that more promising ensemble algorithms can be developed in terms of handling the classification of data with high dimension. (2) A hubness-aware ensemble method HI Boost is exclusively proposed to combat high-dimensional imbalanced problems. In HI Boost, a hubness-aware discount factor and the SMOTE oversampling are integrated into the framework of Ada Boost to respectively overcome the problem of singular samples (including hubs and anti-hubs induced by high dimension) and the class imbalance problem. (3) Extensive experiments on sixteen high-dimensional imbalanced datasets have been conducted to compare HI Boost with existing typical ensemble approaches.
The rest of this article is structured as follows: Related works are provided in Section 2. Section 3 describes the details of the algorithm. In Section 4, experimental results and analysis are presented. Finally, Section 5 concludes the paper.
Related work
The hubness phenomenon and hubness-aware approaches
The hubness phenomenon was first documented by Aucouturier in 2004 [13]. He found a strange phenomenon in music field that certain songs often appear in the recommendation list,and prevent other songs from being recommended. Similar phenomena have been reported in other fields, such as image [14], text retrieval [1], voice. Afterwards, Radovanovic et al. demonstrated that hubness is closely related to the distance concentration phenomenon caused by high dimensionality, and is regarded as an inherent characteristic of data in high-dimensional data space [1].
Below some definitions and terms about discussing the phenomenon of hubness are presented. Assuming that D is a data set, the number of times that x appears in the k nearest neighbor lists of other points in D is termedits k-occurrences (denoted by N
k
(x)). N
k
(x) can be further divided into “good” k-occurrences (represented by GN
k
(x)) and “bad” k-occurrences(represented by BN
k
(x)). GN
k
(x) refers to the number of times that x becomes the k nearest neighbors of the samples having the same class label with x. On the contrary, BN
k
(x) is the number of times that x belongs to the k nearest neighbors of the samples that have different class label from x. Obviously, N
k
(x) = GN
k
(x) + BN
k
(x). In general, those samples with high N
k
(x), GN
k
(x) and BN
k
(x) are called hubs, good hubs, and bad hubs in sequence (consider Fig. 1 where the samples A and B are a good hub and a bad hub respectively). To quantitatively measure the severity of hubness phenomenon for a dataset, the following formula is used:
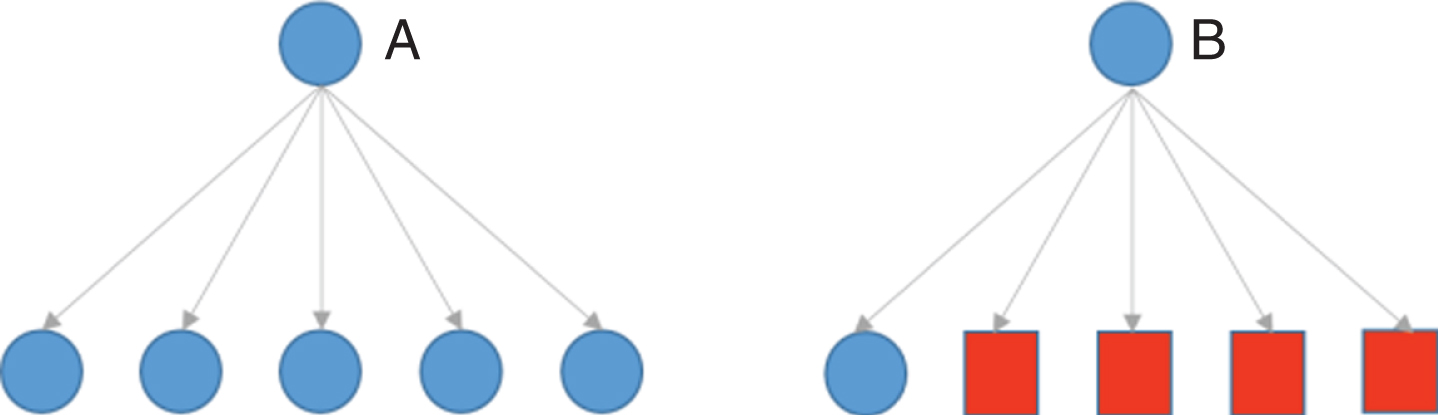
Good hubs and bad hubs.
Where μ N k and δ N k are the average value and standard deviation of k-occurrences of all samples respectively. Obviously, the larger SNk is, the more severe the hubness phenomenon of the data set is.
Since hubness can affect a series of machine learning algorithms including clustering, kNN classification, and support vector machines [15], many hubness-aware algorithms have been developed [1, 7,16]. The work [7] shows that in high dimensional data clustering, hubness is a good measure of point centrality, thus put forward several new clustering algorithms by using hubs as cluster prototypes. Tomasev et al. [16] developed a new probabilistic kNN classification approach, which utilizes hubness to compute class likelihood estimates. In addition, there are lots of other hubness-aware algorithms that consider hubness information in gene drug research [17, 18]. These studies show that hubs can provide valuable information which can be used to improve existing algorithms or develop new methods.
Most of standard classification algorithms are designed to minimize the training errors. This criterion can lead to a poor prediction performance of the resulting classifier on the minority classes [20]. To solve this problem, a large number of solutions have been designed. They can be roughly divided into three categories, i.e., cost sensitive learning [21], data resampling [12, 22], and ensemble learning [23].
Cost sensitive learning
The objective of cost-sensitive learning methods is to minimize the total costs of misclassification. By assigning higher misclassification costs to minority class samples than to majority classes samples, cost-sensitive methods can correct the problem of prediction bias to a certain extent [19, 21]. Existing cost-sensitive algorithms can be categorized as two types. One is the based on training data modification. These methods are equal to modify the decision threshold of classifier [24] or assign different weights to the samples from different classes when resampling the training data according to the costs of classes [25]. The other one is based on changing the learning process or training objective to construct cost-sensitive classifiers. For example, Wu et al. [26] modify the objective function of SVM/ELM by applying a weighting strategy depending on the class costs; Krawczyk et al. apply the strategy of minimizing misclassification costs to build the decision tree ensembles [27]; the work [28] embed cost factors into the framework of boosting learning for yielding cost-sensitive boosting algorithms.
However, cost-sensitive methods have been shown less popular than other class imbalance learning techniques [29]. One main reason is that the true costs of classes are usually unknown. It is hard to set appropriate misclassification costs for all the classes, especially in the case of multiclass classification.
Data resampling
Data resampling is to rebalance the imbalanced class distribution by discarding some majority class samples (under sampling) or adding new minority samples (oversampling). In data under sampling, Random Under Sampling (RUS) is the simplest method. It discards the majority class samples by using random way. Given that a number of useful majority samples may be removed, more advanced under sampling methods are designed to delete the majority samples on the premise of retaining as much useful information of majority classes as possible. Fu et al. [30] developed a principal component analysis guided under sampling algorithm. This algorithm removes the redundant majority samples, while retains the most representative majority samples by using a comprehensive assessment model. Ha et al. [31] proposed a genetic algorithm based under sampling method. The objective is to minimize a loss function between the distributions of original majority samples and under-sampled majority samples. In addition, there are lots of other under sampling approaches that employ data clean techniques to discard the uninformative majority samples for learning [32].
With respect to data oversampling, the most straightforward way is Random Over Sampling (ROS) which randomly duplicates original minority samples to introduce minority class samples. A significant drawback of ROS is that it can increase the risk of over fitting due to the possible creation of very specific decisions [12, 33]. Aim at this problem, Chawla et al. proposed synthetic minority oversampling technique, i.e., SMOTE, to generate synthetic samples in feature space. By interpolating between two adjacent original minority samples, the created new minority samples will different from existing minority samples, and can enlarge the minority class regions [33]. SMOTE has proven successful in various real-world applications, and inspired many new SMOTE-based methods to deal with the class imbalance problem. The innovations of these methods mainly come from: selecting which minority samples to oversample [34]; the adopted ways of interpolation [35]; and how to integrate with filtering techniques or under sampling techniques [36].
Ensemble learning
Ensemble learning is intended to improve the accuracy of ensemble classifier by combining multiple component classifiers. Standard ensemble learning algorithms are not suitable for class imbalance learning due to their accuracy-oriented design. They often combine with data resampling methods such as ROS, RUS, SMOTE to develop ensemble-based solutions addressing the class imbalance. Boosting is one of the most widely used ensemble methods. The positive synergy between boosting and resampling algorithms has been demonstrated in many literatures [11, 38].
SMOTE Boost [37] is the first boosting-based method to combat class imbalance problems. In SMOTE Boost, SMOTE is incorporated into the learning framework of AdaBoost.M2 [39] (a member of boosting family) to implicitly increase the weights of minority class samples by generating new synthetic samples. SMOTE Boost compels AdaBoost.M2 to pay more attention on the learning of minority classes, thus improves the prediction performance of minority classes. RUS Boost [38] is another boosting-based method that integrates AdaBoost.M2 and RUS. Although RUS can cause the information loss of majority classes, the combination of RUS and multiple boosting iterations can greatly alleviate this drawback as the discarded majority samples in certain iteration may be included in other iterations. In addition, given that the diversity of component classifiers is a crucial factor to form an accuracy ensemble, several recent boosting-based ensemble algorithms propose different ways to manufacture the diversity among component classifiers [40, 41]. RB Boost [42] is a newly advanced method which integrates AdaBoost.M2 and Random Balance. This combination involves enforcing random class proportions in addition to instance reweighting. Each member of the Random Balance ensemble is trained with data sampled from the training set and augmented by artificial instances obtained using SMOTE. The novelty in the approach is that the proportions of the classes for each ensemble member are chosen randomly. These methods generally manipulate the training data before learning component classifier through using resampling techniques, and then reach as much diversity as possible.
However, all the above mentioned methods are proposed for low-dimensional imbalanced data. High dimension can introduce additional learning difficulties, such as the emergence of singular hubs and the problem of over fitting.
Method
To the best of our knowledge, there are few works to consider the hubness phenomenon in the process of developing ensemble algorithms. In this paper, a hubness-aware ensemble method was presented, and then combine it with SMOTE to exclusively deal with high-dimensional imbalanced data classification. Ada Boost algorithm (a version similar to AdaBoo-st.M2) was introduced in Section 3.1. Section 3.2 describes how to take the phenomenon of hubness into account in AdaBoost, and presents a hubness-aware ensemble algorithm, HBoost. Then, the combination of HBoost and SMOTE is given in Section 3.3. Finally Section 3.4 summaries the proposed algorithm HI Boost.
Ada Boost algorithm
Ada Boost [39] is the most representative algorithm of boosting family. Its main idea is to iteratively train multiple weak classifiers on the same training data but with different distributions of sample weights, and then combine these weak classifiers to construct a strong ensemble classifier. The complete process of Ada Boost is presented in Algorithm 1. Instep 1, all the training samples are given the same weight, i.e., 1/m (m represents the number of samples in the training set). In step 2, training a weak classifier h t , and calculating its pseudo-loss ɛ t with respect to the current weight distribution D t . Step 3 computes the weight updating factor β t . In step 4, the weight distribution of samples, Dt+1, is updated and normalized by using β t and the prediction results of h t . The purpose is to increase the weights of the samples that are wrongly classified, so that the latter weak classifiers are much more focused on learning hard-to-classify samples. Finally, after repeating step 2, 3, 4 for T times, T trained weak classifiers are combined into the ensemble hypothesis H (x) by the weighted majority voting rule.
HBoost: a hubness-aware Ada Boost
Ada Boost is quite sensitive to outliers [43]. Since outliers are more easily misclassified, they will tend to be assigned large weights according to the weight updating mechanism of Ada Boost. It can result in that Ada Boost focuses on learning these abnormal samples (outliers) and repeatedly fits them in the following iterations, which deteriorates eventually the generalization performance of Ada Boost.
In high-dimensional data, there are two different types of outliers, i.e., probabilistic outliers (hubs) and distance-based outliers (anti-hubs) [1]. Given that the probability of a sample resided in the center of data becomes close to zero with the increase of dimensionality, hubs can be regarded as probabilistic outliers as they are nearer to the center (mean) than other samples (that is, they lie in low-density regions of high-dimensional feature space) [1]. In contrast to hubs, anti-hubs are those samples which occur in very few in the k nearest neighbors of other samples. In other words, anti-hubs are far away from other samples in distance.
In order to alleviate the harmful effects of anti-hubs and hubs for Ada Boost, this work first detect hubs and anti-hubs in the training data, then use different weight updating schemes for these two types of outliers and other normal samples. The purpose is to obtain more smooth weight distributions by slowing down the weight growths of anti-hubs and hubs. The hubs and anti-hubs are respectively identified as those samples whose k-occurrences are two standard deviation higher and lower than the average value of k-occurrences of all the samples, i.e., if the k-occurrences of a sample x i is larger than μ N k + 2δNk this sample is categorized into hubs; if its k-occurrences is smaller than μ N k - 2δ N k , it is classified into anti-hubs; otherwise, it belongs to normal samples. In the experiments, neighborhood size was set to k = 10 [7].
For hubs and anti-hubs, this work introduces a discount factor into the weight updating of Ada Boost (i.e., Eq (4) in Algorithm 1). Assuming that x i belongs to hubs or anti-hubs, N k (x i ) and BN k (x i ) are its times of k-occurrences and bad k-occurrences, respectively. The discount factor in x i is defined as:
BN k (x i )/N k (x i ) measures the degree of bad k-occurrences for x i . This value is larger, the higher non-matching degree between the labels of x i and its neighboring samples, which indicates that x i is more prone to be noisy hubs. a is a scaling factor, its value should be negative in order that p (x i ) is smaller than 1. Equation (6) shows that if a sample has the higher degree of bad k-occurrences, its discount factor will be a smaller value.
However, two additional points must be pointed out. First, given that anti-hubs have very few k-occurrences, BN k /N k will be meaningless in statistics. The degrees of bad k-occurrences of all anti-hubs are simply assigned a value of1. Second, for imbalanced data, due to the lack of representative samples in the minority classes, the majority class samples are likely to appear frequently in the k-nearest neighbor lists of minority samples. It means that the hubs of minority classes naturally tend to have high degrees of bad k-occurrences, which will be conflictive with the requirement of highlighting the learning of minority class samples. Therefore, for the hubs from the minority classes, we abandon measuring the degree of bad k-occurrences by BN k /N k , their degrees of bad k-occurrences default to 0.
By introducing Equation (6). into Equation (4)., the weight updating scheme of outliers and anti-hubs can be presented in Equation (7). Then, using Equation (7). to update the weights of outliers and anti-hubs, a hubness-aware Ada Boost algorithm, i.e., HBoost, was eventually developed.
It should be noted that the weight updating mechanisms of HBoost do not treat the majority classes and minority classes differently. It suggests that HBoost may favor the majority classes when data is imbalanced, because the majority class samples can take up most of the weights. In order to migrate this problem, the class distribution was modified by SMOTE which introduce new synthetic minority samples in each round of HBoost iterations. Then, the new modified training data is fed to the classification algorithm for training component classifier. The introduction of SMOTE has two main advantages. One advantage is that the problem of prediction bias in component classifiers can be corrected to some extent, since they are trained from balanced training data. The other advantage is that different synthetic samples sets are created in the HBoost iterations. It benefits the increase of the diversity among component classifiers.
The combination of HBoost and SMOTE leads to an ensemble algorithm for addressing high-dimensional imbalanced data classification, HI Boost. And the process of data processing is shown in Fig. 2.
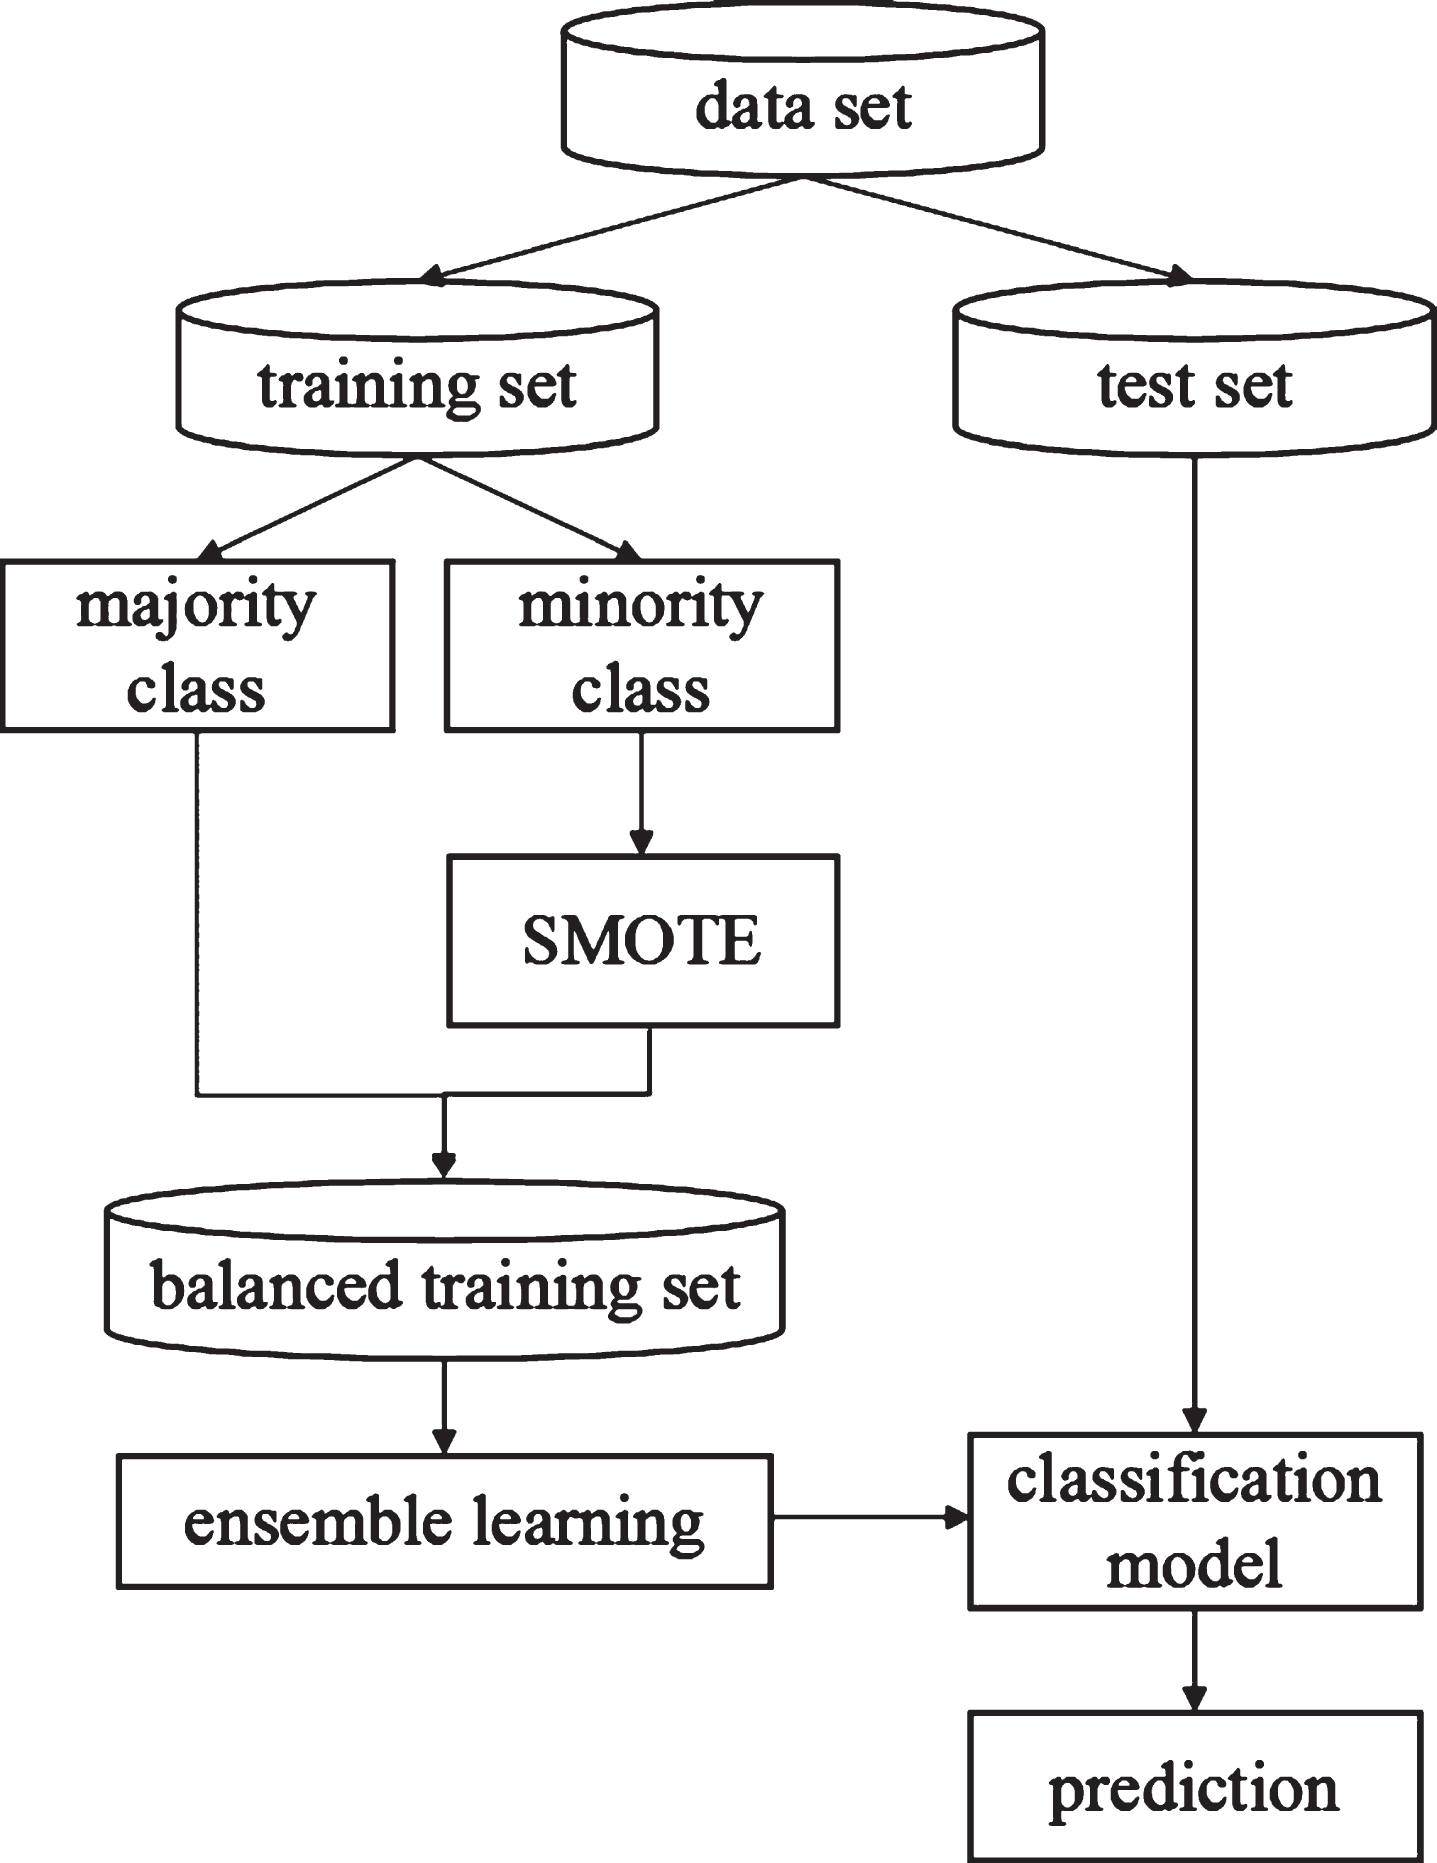
SMOTE with boosting for classifying imbalanced data.
Algorithm 2 describes the complete process of HI Boost. It includes an additional pretreatment process which detects hubs and anti-hubs, and then computes the discount factors for them (Step 1–3 of Algorithm 2). The core algorithm process is briefly summarized as follows: Before each round of training, HI Boost uses SMOTE to create synthetic samples from minority classes so as to obtain a balanced distribution S t ′ and D t ′. Then, it feeds S t ′ and D t ′ into the weak classifier for training. The loss function of weak hypothesis is calculated based on the original training set S t , and the weight update factor is calculated. Then, HI Boost updates the sample weights for the next iteration. If the current sample points are hubs or anti-hubs, it uses the optimized formula (7) to update their weights; Otherwise, the original weight updating formula of Ada Boost algorithm are used. After T rounds of iteration, T trained weak classifiers are combined into the ensemble hypothesis H (x) by the weighted majority voting rule.
There are two points that should be underlined for HI Boost. First, instead of directly applying to the original sample set S, SMOTE is performed on the data set S′ which is sampled from S with the weight distribution D t (lines 1–2). The purpose is to let S′ reflect the current weight distribution D t . A sample with high weight will be likely to appear in S′ with high frequency, so that the difficult samples can be received more attention in the following iterations. Second, for hubs and anti-hubs HI Boost uses a customized weight updating scheme by intruding a discount factor (line 6). If a sample belonging to hubs or anti-hubs has higher degree of bad k-occurrences, its discount factor will be a smaller value, which pulls down its weight in the process of weight updating. This can prevent the weights from overly concentrating on hubs and anti-hubs.
Experimental results and analysis
Experimental datasets
In order to verify the performance of HI Boost, sixteen high-dimensional imbalanced datasets from UCI [44] and Open ML [45] are selected as the experimental data. The detailed characteristics of them are summarized in Table 1. As is shown in Table 1, these datasets show different sample sizes and feature dimensions, where the number of features varies from 136 to 1777. In addition, it should be pointed out that these data sets come from different fields such as text classification (cnae-9), image recognition (mount, sea, sunset, trees, field, beach), speech recognition (speech, isolet5), handwritten recognition (mfeat, semeion), and several classification problems in biological and medical sciences (micro, clean1, phpisie, dna, biolo). This paper follows the suggestion of [33], the classes whose sample sizes are greater (/smaller) than the average number of samples (the overall sample size/the number of classes) are treated as the majority (/minority) classes.
Dataset basic information
Dataset basic information
*|Num|, |Attrib| and |Distrib| denote the number of samples, attributes and distribution of each class in the dataset, respectively.
Traditional Ada Boost (ADB), two popular boosting-based ensemble methods RUS Boost (RUB) and SMOTE Boost (SM Boost/SMB), and a recently proposed ensemble approach RB Boost (RBB) are chosen to compare with HIBoost (HIB). RUS Boost and SM Boost are specially designed for class imbalance problems. Galar [11] compared1 cost-sensitive boosting algorithm, 3 boosting-based ensemble methods, 10 bagging-based ensemble approaches, and 2 hybrid ensemble approaches on a large number of low-dimensional imbalanced two-class datasets. The experimental results show that RUS Boost is one of the most robust methods. Moreover, in order to better investigate the role of considering the hubness phenomenon, HBoost (HB) is also added into the experimental comparisons.
Assessment metrics
To evaluate the performance of classifiers in two-class imbalance problems, 4 counts are often required according to the predicted results: TP (actually a minority class, classified as a minority class), FN (actually a minority class, predicted as a majority class); TN (actually a majority class, predicted as a majority class), FP (actually a majority class, predicted as a minority class).Based on the above four counts, the following assessment metrics can be derived, including:
SE (sensibility) and SP (specificity) measure the completeness of prediction on the minority class and majority class, respectively. G-mean is used to evaluate the overall performance of a classifier across all the classes. A high G-mean indicates that the classifier can achieve a good performance on both the minority class and majority class. Another popular comprehensive performance metrics is AUC (the area under the ROC curve). Different from G-mean, AUC is independent of the decision threshold of classifier.
Accmin, Accmaj, G-mean, and AUC can be extended to fit multiclass imbalanced scenarios. They are de-fined as follows in multiclass scenarios, respectively.
where minC, majC, and C respectively denote the sets of the minority classes, the majority classes, and all the classes; Acc
c
i
is the prediction accuracy on class c
i
; MG and MAUC are the extensions of G-mean and AUC in multiclass problems, respectively.
All the experimental programs of this paper run on Windows platform (CPU: Intel (R) i7-4710HQ @2.50 ghz, 64 GB DDR4 of memory, GPU: NVIDIA GeForceGTX 860M) and are implemented by Python 3.5.6 and Anaconda 4.2.0 (64-bit). The invoke packages include but are not limited to sklearn, numpy, and pandas.
For all the compared methods, CART tree is chosen as baseline classifier, and the depth of cart tree is set to 3 [1]. The number of iterations is set to 40 [14]. The number of nearest neighbors is 10 (i.e., k = 10 in SMOTE) [46]. In addition, for the compared ensemble methods combined with oversampling, the minority class was oversampled to match the size of the majority class [37]; for the ensemble approaches integrated with under sampling, the size of the majority class was reduced to match the size of the minority class [38]. In other words, the data is under sampled (or oversampled) into a balanced training data before feeding it to train component classifier in each iteration (except RB Boost, in which the class distribution is constructed randomly in each iteration).
In the experiment, a holdout stratified way was employed to divide the dataset 30 times, using 70% samples for training and the remaining 30% samples for testing. In order to reduce the random error during the experiment, the performance results of each dataset are obtained from the average of 30 independent runs.
Experimental results and analyses
The experimental results on all the datasets are shown in Tables 2–5, where the best results are high-lighted in bold. It can be noticed that standard Ada Boost obtains the best performance of Accmaj on almost all datasets (Table 3), while the proposed HIBoost acquires the best performance results in terms of Accmin, G - mean/MG, and AUC/MAUC (Table 2). This result suggests that HIBoost has the maximum level of performance improvement for the minority classes, and leads to the best comprehensive performances (i.e., G - mean/MG , and AUC/MAUC ) in comparison with other compared methods.
Accmin results of all the compared algorithms
Accmin results of all the compared algorithms
Accmaj results of all the compared algorithms
G-mean/MG results of all the compared algorithms
AUC/MAUC results of all the compared algorithms
In order to observe the experimental results more intuitively, the mean rankings of all the compared algorithms across all the datasets are summarized in Table 6 and Fig. 3. According to above experiment results, the following conclusions can be drawn.
The mean ranking results
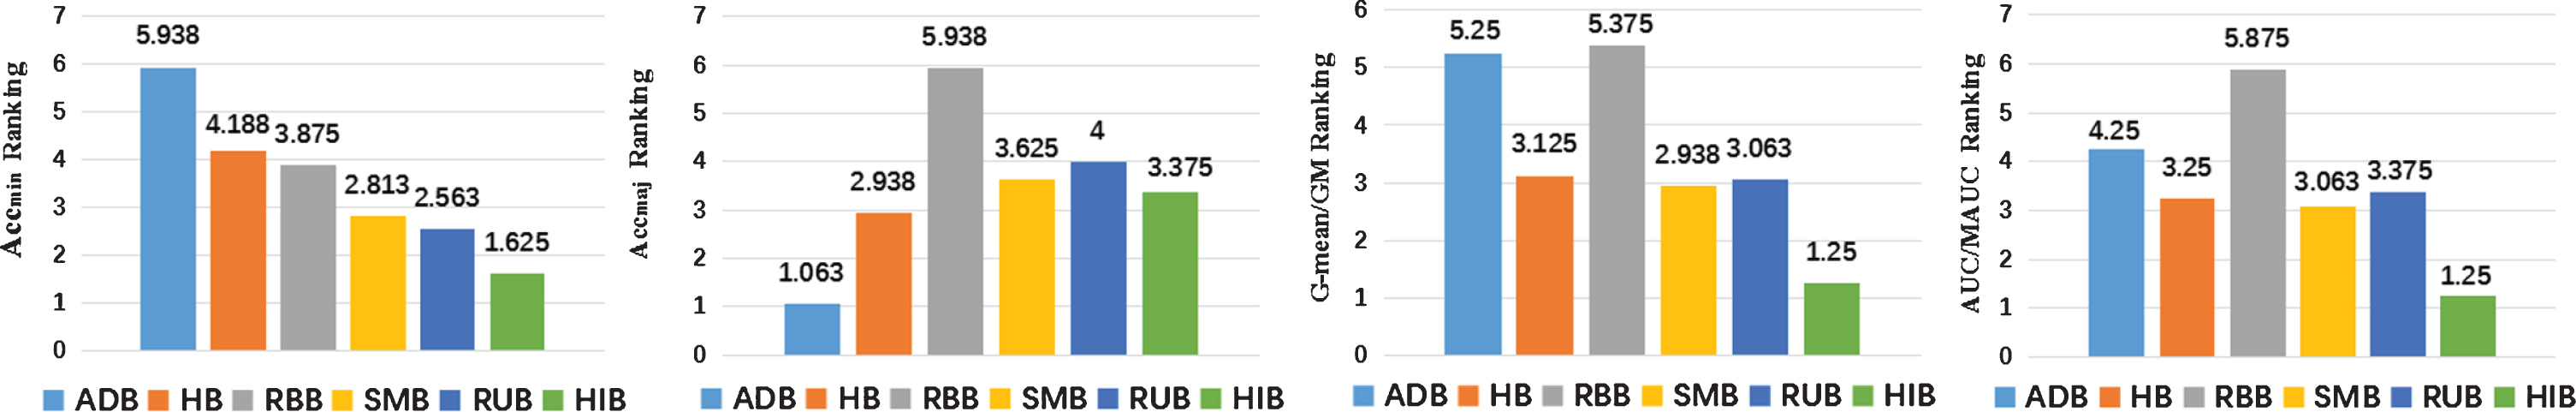
The mean ranking.
First, compared to AdaBoost, the other methods perform the better mean Accmin rankings (Table 6), but the worse Accmaj rankings, which shows that they can improve the classification accuracy of minority classes, at the cost of sacrificing the performance of majority classes to some extent.
Second, HBoost has significantly improved mean ranking compared to AdaBoost addressing class imbalance problems in terms of Accmin (Table 6). It indicates that restricting the weight growth of majority class hubs can enable component classifiers to pay more attention on learning minority class samples, and thus improve the prediction performance of minority classes.
Then, HIBoost acquires the best mean rankings in the comprehensive assessment metrics of G-mean/MG and AUC/MAUC. This is because HIBoost dramatically improve the prediction accuracy of minority classes (reflected by a significant better mean Accmin ranking in Fig. 3), but does not cause obviously more damage to the classification performance of majority classes as compared to HBoost, RBBoost, SMBoost, and RUSBoost (a moderate mean Accmaj ranking as shown in Fig. 3).
At last, it can be found that whether considering the phenomenon of hubness (i.e., HBoost) or the use of SMOTE (i.e., SMBoost) all can boost the classification accuracy of minority classes, and lead to a better comprehensive performance than AdaBoost. When they are combined (i.e., HIBoost), the performances can be further improved in terms of Accmin, G - mean/MG, and AUC/MAUC. It indicates that the combination of them has the effect of positive synergy for handling high-dimensional imbalanced data classification.
Furthermore, Wilcoxon signed-ranks test [47] was conducted to evaluate whether HIBoost can statistically outperform the other compared algorithms. The results are provided in Table 7. The symbols “++”(/“––”) denote that HIBoost is statistically better (/worse) than the considered algorithm at the significance level of 0.05 and 0.1, respectively; “+” signifies that HIBoost is only quantitatively better, whereas “–” implies the contrary. As shown in Table 7, HIBoost often significantly outperforms the other algorithms in terms of Accmin, G - mean/MG, and AUC/MAUC.
Significance tests results
HIBoost has a parameter a. In experiment studies, its default value is set to –0.8. This value is not meant to be optimal for each dataset. To help selecting the appropriate values for a, some experiments are conducted to show how the settings of different parameter values impact the performance of HIBoost. According to Table 8, a reasonable value for a can be around –0.8.
G-mean values of HIBoost for varying parameter a over 6 selected datasets
G-mean values of HIBoost for varying parameter a over 6 selected datasets
*Best results are highlighted in bold.
Learning from high-dimensional imbalanced data is a very challenging task in real-world applications. This work introduces a new boosting-based ensemble method HIBoost to specially deal with high-dimensional imbalanced data classification. Given that the hubs and anti-hubs induced by high dimension can trigger the over fitting problem of Ada Boost, HIBoost introduces a discount factor for these two types of samples to explicitly restrain the growth of their weights in the process of weight updating. In addition, since class imbalance distribution can result in that component classifiers produce the prediction bias towards the majority classes, HIBoost uses SMOTE to balance the training data before learning each component classifier. Experimental results show that HIBoost is superior to classical comparison algorithms in terms of Accmin, G - mean/MG and AUC/MAUC, and is an effective method for handling high-dimensional imbalanced problems.
In the future work, we intend to combine hubness with under sampling to deal with the high-dimensional unbalanced data with large volume. In addition, we try to design a general discount factor for all the samples, rather than judging whether the samples are hubs or bad hubs in advance.
Footnotes
Acknowledgments
This work is supported in part by the Open Research Fund of Hunan Provincial Key Laboratory of Network Investigational Technology (project No.2018WLZC007).