
Abstract
Crack detection has drawn much attention in the last two decades, because of dramatic bloom in monitoring images and the urgent need of corresponding crack detection. However, recent methods have not taken advantage of structure information effectively, resulting in low accuracy when dealing with crack-like noises. In this paper, we propose a novel crack detection framework, which is able to identify cracks from noisy background. The main contributions of this paper are as follows: (1) giving a new edge-based crack detection framework to improve the detection performance; (2) proposing a novel mid-level feature, named Crack Token, which captures the local structure information of cracks; (3) introducing a new evaluation strategy for crack detection task, which provides a comprehensive system for approach evaluation and comparison in this area. In addition, we provide a novel definition of pavement crack and verify our framework and evaluation strategy in this real world application. Extensive experiments demonstrate the state-of-the-art results of the proposed framework.
Introduction
Crack detection is of great value in road pavement, tunnel and precision instrument maintaining and real time crack detection has draw much attention. Recently, image-based crack detection techniques have been dominator due to the low cost and high efficiency compared to traditional human inspection. Despite the advances achieved by existing crack detection methods, local structure information of cracks has not enjoyed in-depth study, leading to unsatisfactory results when dealing with noises. Unlike conducting noise removal step after detection of cracks in the previous methods [2, 56], in this paper we made efforts to build a robust crack detecion model by introducing the mid-level structure information of cracks.
In recent years, computer vision has been promoted by machine learning techniques in many applications [18], such as font recognition [49], gesture recognition [31], image classification [54] and obstacle detection [23]. In the existing crack detection approaches, local features including brightness and texture are still dominating, following the basic assumption that the cracks are continuous and darker than background. However, Dollar and Lim have shown that mid-level structure information can lead great improvement in edge detection [16, 26]. Motivated by this, we propose a supervised mid-level features based crack detection framework, which introduces the local structured information of cracks. This framework consists of two processes: mid-level feature based edge detection and crack recognition. In edge detection process, we first train the mid-level feature directory for image patches with a fixed size centered on cracks. Every dimension of the directory represents a class of local structure and the K-means clustering algorithm is used to train this directory. After that we use random forests to train an edge detection model, which predicts the probability of every point that belongs to each local structure class. In crack recognition process, we make use of Support Vector Machines (SVMs) to discriminate cracks from other edges. In this model, mid-level features are utilized to represent areas. This framework is efficient in real road crack data set and the detection results are state-of-the-art. The general procedure and effectiveness of the proposed framework in pavement crack detection application can be seen in Fig. 1, and the PR-curves of proposed framework and baselines are shown in Fig. 7, demonstrating the state-of-the-art of Crack Token. Overall, the main contributions of this paper include: An edge-based machine learning framework for crack detection, in which local information and mid-level feature are both made use of. This framework can be regarded as a general object detection framework and crack detection is only one specific application of it; A novel mid-level feature, named Crack Token, which captures the local structured information of cracks. Extensive experiments demonstrate the state-of-the-art accuracy and efficiency of the proposed feature; A new evaluation strategy for crack detection task. And we provide a toolbox and benchmark for approach evaluation and comparison in crack detection.

A workflow of the proposed crack detection framework. The original image is (a), the edge detection result is shown in (b), the possible crack areas as shown in (c), and (d) is the final detection result.
The rest of this paper is organized as follows:
In section 2, we give a brief review of the recent advances in edge detection and crack detection. We investigate the existing approaches and introduce the motivation of this paper. The proposed mid-level feature based machine learning framework for crack detection is given in section 3. As there is no unified definition of road cracks, we introduce a description definition to fit the machine learning framework. The main parts of this section are the two steps of crack detection: mid-level feature based edge detection and crack recognition. We elaborate the procedure and feature we used in both steps. The experiments are given in section 4, including description of the evaluation strategy, an brief introduction of used raod crack detection data set, and experimental results. We conclude this paper and discuss the future work in section 5.
In recent years, the importance of distress detection has drawn increasing attention and several lines of approaches have been proposed to discover cracks. Here, we first give a brief review of the recent advances in crack detection, after that the related edge detection methods are provided.
Crack detection
Thresholding methods
Following the assumption that crack points are darker than the surroundings, many early pavement crack detection methods are proposed based on the thresholding of intensity related statistics of pixels in a pavement image [22, 25]. The gray-level histograms based method is first proposed to conduct image segmentation [38], in which zeroth- and the first-order cumulative moments of the histograms are used. After that entropy of the histogram is also introduced to achieve better segmentation performance [20]. Inspired by the efficient thresholding based image segmentation, the first thresholding method in crack detection is given in [22] to sense cracks in ’tile’-based scheme, in which the statistical moments are used to make final decisions. After that, neighboring difference histogram method (NDHM) [25] is developed to detect cracks by maximizing the difference between cracks and background, and the results show it more effective than classical thresholding based discriminant analysis methods [38] and [20]. In order to conduct adaptive detection, dynamic thresholding is introduced [35, 36], in which the image is first divided into non-overlapping blocks and then statitical features such as entropy, mean, standard and variation are prepared to discriminate cracks from background. Although the thresholding methods can be conducted efficiently, the thresholds are often not reliable when facing crack-like noises due to the lack of variety of features used in this scheme. Furthermore, as thresholding features are usually abtained in block level and no structure information are used, the results are very sensitive to the division step, and the improper size or location of blocks can greatly reduce the detection accuracy.
Morphology
In order to address the shortage of thresholding methods, researchers makd efforts to exploit the morphology structure to identify cracks robustly and accurately. In [11], the authors build a noval data structure called PVDUs (Pavement Distress Units) which can generate new features to analysis and classify pavement distresses. Considering the irregular texture of pavement surface, in [45] a Wigner model is introduced to identify cracks in the complex texture pavements, in which textural background are learnt before detection. Except for the basic understanding that a crack is darker than the background, [48] proposes several additional assumptions that crack is a succession of saddle points and it has linear feature and directionality, with which basic four morphological operators and top-hat transform operation can be conduct to identify cracks. However, the results are only evaluated in image level but not the cracks. In [47], a pavement crack identification algorithm based on mathematic morphological is proposed. The key step of the proposed algorithm is extracting the ’ideal’ cracks by utilizing multi-scale morphologic edge detection method. The morphology based methods often capture the overall structure of the cracks to improve the detection accuracy. However, the construction of the desired structures usually requires pre-made human designs, which can be barriers to broad application as the specific morphology structure vary from all kinds of pavement environments.
Wavelet transforms
Wavelet transform techniques have also been a powerful means in crack detection because of the robustness to noises. Continuous wavelet transform has been used to process the original image in order to reduce the noisy texture [46], and multi-scale complex coefficient maps with significant information kept are built and wavelet coefficients maximal values are used to detect cracks. In [9], the authors introduce a new 2-D matched filter in Markov Random Field (MRF) to detect fine structures and apply it to crack detection, which ahieves more robustness to the sunlight and makes less false detections. [19] make use of wavelet analysis for distress detection and proposes several criteria for detection evaluation. Fractional Differential and Wavelet Transform (FDWT) [27], which can handle the smooth pavement and weak cracks, has also been used in crack detection.
Machine learning
The early efforts of combining machine learning and pavement crack detection start in early 1990s. A comparison analysis of Bayes classifier, KNN classifier, multilayer feed-forward neural network and two-stage piecewise linear neural classifier in crack detection application is proposed in [21]. The results indicate the superiority of neural networks in indentifying cracks in the non-overlapping blocks. As block level detection is not sufficient for severity estimation and further maintaining instruction, some machine learning based pixel level crack identification methods have been developed, such as Bayesian quadratic classifier [33] and discriminate classifiers [34]. However, the used features are naive pixel intensity statistics such as mean and variation, which retains no structure information. In [12], the authors make use of fuzzy sets theory to obtain features for different types and neural network classifier for modeling. Another fuzzy logic based method presented in [10] tries to determine the membership value of pixel belonging to every crack domain and achieves good results for very thin cracks detection.
Edge detection
As we know, edge is considered as sketch of objects in an image, which captures location and shape information about the objects. When the background keeps in a certain pattern or the target objects remain in the same type, human can easily recognized the object type in the image. Following this line, some specifically designed and trained models have shown that supervised learning strategy can also successfully find the edges of given object type just like what human does [14, 53], as shown in Fig. 2. In crack detection problem, we can treat cracks as an interesting type of objects that need to be indentified, and it is promising to combine the advanced edge detection algorithms and supervised machine learning models.
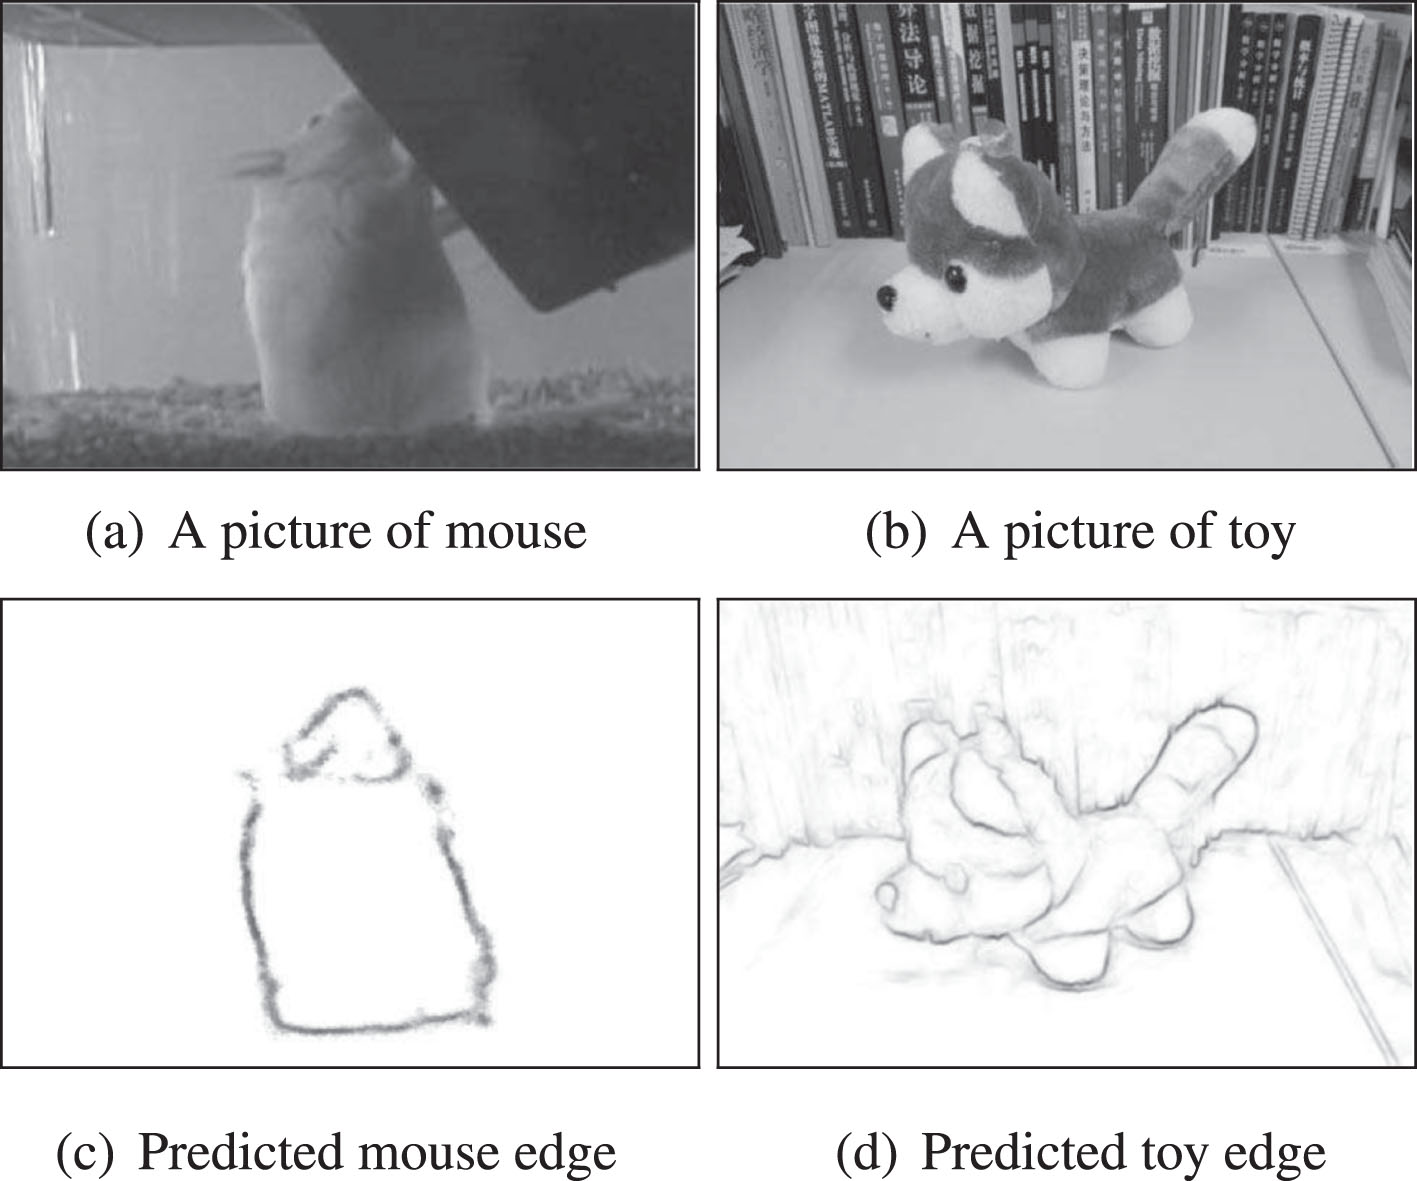
Demostraion of supervised edge detection. (a) and (c) come from [14], while (b) and (d) from [30]. (a) and (b) are original images contain certain targets, which are mouse and toy respectively. And (c) and (d) are the predicted edge of targets. In (c) the mouse edge result is suggested effectively by Boosted Edge Learning (BEL) in [14]. While interested in toy edge, a specified learning setting can also lead successful result as shown in (b) and (d)[30].
Edge detection techniques have experienced a rapid development these years. The early approaches provide many easy and efficient result [6, 39]. After that some sophisticated features such as Histograms of Oriented Gradients (HOG) [13], Harr-like [50] and integral channel features [15] are developed to improve accuracy. Recently, learning strategy is introduced and sigificant improvements are achieved [14, 53]. From the research line we can find that Boosting Edge Learning [14], which builds probabilistic boosting tree as an edge classifier for patches, is the most successful framework.
In order to take global information into account and boost accuracy, a highly efficient contour detector named gPb is proposed [1]. In gPb, spectral clustering [32] is introduced to modeling global information and gPb beats all the previous methods. However, high computational complexity of gPb makes it hard for real-time detection. Except for spectral clustering, learning the structure of the edges directly is also a straightforward way to capture structure information. In this direction, there are two successful methods proposed recently: Structured Forests [16] and Sketch Tokens [26], both of which benefit from structured learning and integral channel features. In [16], an inner-trained intermediate mapping is combined with Structured Forests to make fine prediction for the masks of each pixel. On the contrary, in [26] the masks, called Sketch Tokens, are trained beforehand, and by utilizing the Sketch Token label for each patch a random forest model is used to predict masks. These two methods are both highly effective and efficient in edge detection. Furthermore, in [26], Sketch Token also shows outstanding object detection results. Recently, some deep learning based edge detection has emerged [3, 43]. Deep models usually reach good performance, but it will suffer from high computation cost and model volume, making it hard to be applied in a broad application areas.
In this paper, we introduce Sketch Tokens to crack detection problem, because the pre-trained mid-level features are more stable and understandable. And also the fixed mid-level features dictionary can make the subsequent crack indentification convenient and efficient.
Although many crack detection algorithms and systems have been proposed, the exact definition of pavement crack is still not given. Instead, existing researches often conduct crack detection based on some basic assumptions of the shape or intensity of cracks. This situation may be caused by the high complexity of the crack characteristic and the inconsistency of the difference between cracks and background. As we solve crack detection problem in a machine learning way, we first introduce a detailed understanding in the context of edge detection as the basis of the proposed framework. After that, we provide the mid-level feature based pavement crack detection framework, consisting of two main steps: mid-level feature based edge detection and crack recognition. In the first step, we build a mid-level feature dictionary and a random forest as predictor. From that we can achieve the probability of the center point standing on an crack-like edge and construct the mid-level feature of the center point of the patch. In the second step, we construct a possible crack area set based on the probability map generated in the first step, make use of the mid-level features and train an area level classifier to discriminate cracks from ordinary edges. The proposed framework is shown in Fig. 1.
Understanding of cracks
We begin with the assumptions for crack detection in the literatures. In most of the previous researches, the assumptions are usually about the intensity, texture and morphology. The most popular assumptions are as follows:
These assumptions are suitable for a large amount of cracks, but there are still some cracks conflicting with these assumptions, as shown in Fig. 3. Besides, these assumptions are not clear enough. There are no unified criteria describing to what extent should a crack be darker than the background, how thin should a crack be or how to measure the linearity and directionality. So it is suggested that these assumptions are just a general understanding of what a crack should be like, rather than a proper definition. As the result, these assumptions cannot provide a precise description of the cracks. Because of the limitations on description range and incompleteness on aspects, the crack detection methods following these assumptions may suffer from a high mis-detection rate when the assumptions are violated.
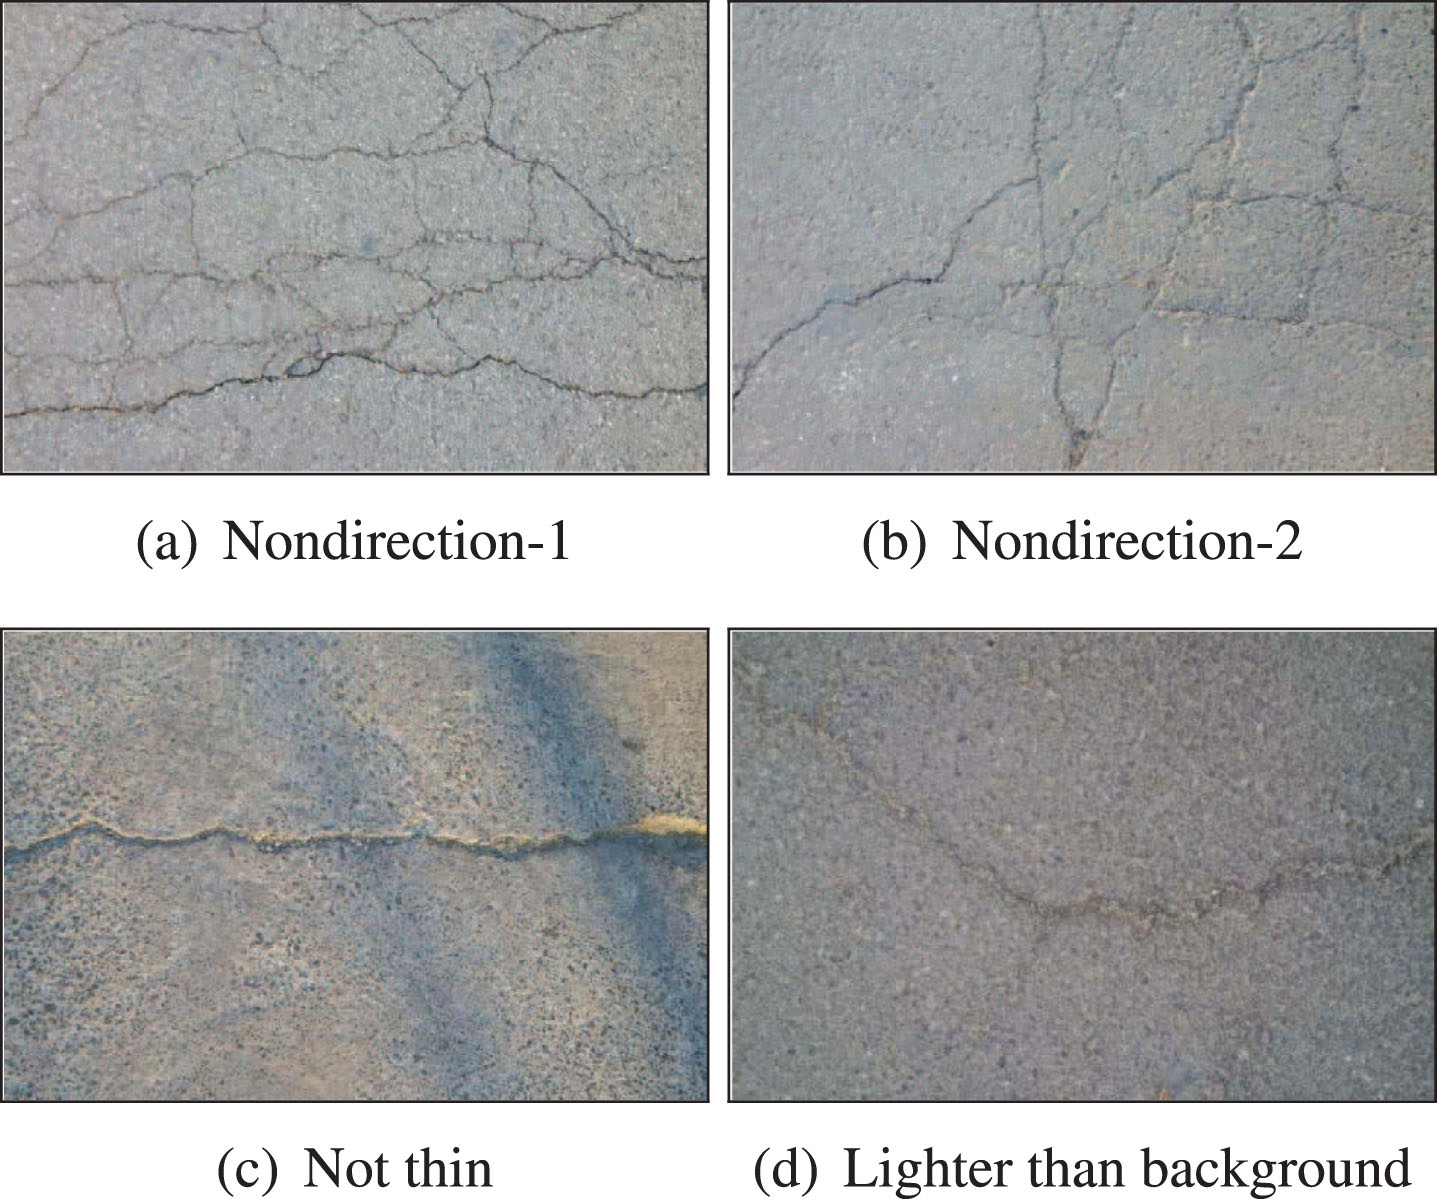
Examples of cracks that violate the assumptions in the literature. In (a) and (b) the cracks have no consist direction. In (c) the crack is not thin as in the previous assumption. In (d) the part of the crack is lighter but not darker than the background.
To address the drawback of the existing methods, we reconsider crack detection as an edge-based object detection problem and make use of the most advanced featurese and dge detection strategy to improve accuracy and efficiency. From the edge detection view, we describe cracks from the content and structure instead of simply from intensity or shape. The main understandings of cracks are as follows: A crack is a specific type of object on surface. The boundaries of cracks are edges and a crack can be and only can be determined by its boundaries. A crack has a certain local structure which can be captured by its boundaries. Note that we don’t limit the shape or type of a crack, which is different from assumption in [48].
Based on these understandings, we can give a descriptive definition of crack in an edge detection way: A crack is a set of continuous edges with a specific structure different from the background.
Although the commonly used features like mean and variance in popular channels such as intensity and brightness can describe an area in a statistical way, the ability of these features to capture the structure is indeed doubtful. Recent researches in edge detection have shown that local structure information is of great use in edge detection [16, 26]. Motivated by [16, 26], we introduce the structure information into crack detection to promote the performance. Following the understandings and definition above, we suggest that given a set of edges, it is the structure of the edges that determines whether they are cracks. The proposed crack detection framework is on the basis of these understandings and definition, and the model is to find the special structure of crack boundary that makes crack different from other objects including background and noisies like oil stains and shadows. Specifically, we make use of the local structure information by a mid-level feature called Crack Token to identify cracks. The rest of this section will elaborate the proposed framework and show how we exploit the structure information.
It is suggested that mid-level feature is powerfull in sophisticated visual recognition [4]. In this subsection we will give the mid-level structure learning based edge detection. By the combination of the mid-level feature and supervised scheme, we are able to predict a crack possibility map to indicate the possible crack location and intensity.
According to the above understandings, cracks can be considered as a certain type of object defined by their edges, and from the emperical analysis we can conclude that the structure of crack edges are markedly different from the common object edges, as shown in Fig. 4. It is shown that in most cases cracks are thinner than common object and as a result most crack edges are in parallel pairs. Meanwhile edges of other type of objects often appear in single line form. This further verifies the understanding that the local structure has the potential for object type discrimination. So in our framework we learn the mid-level structure of the crack edges first.
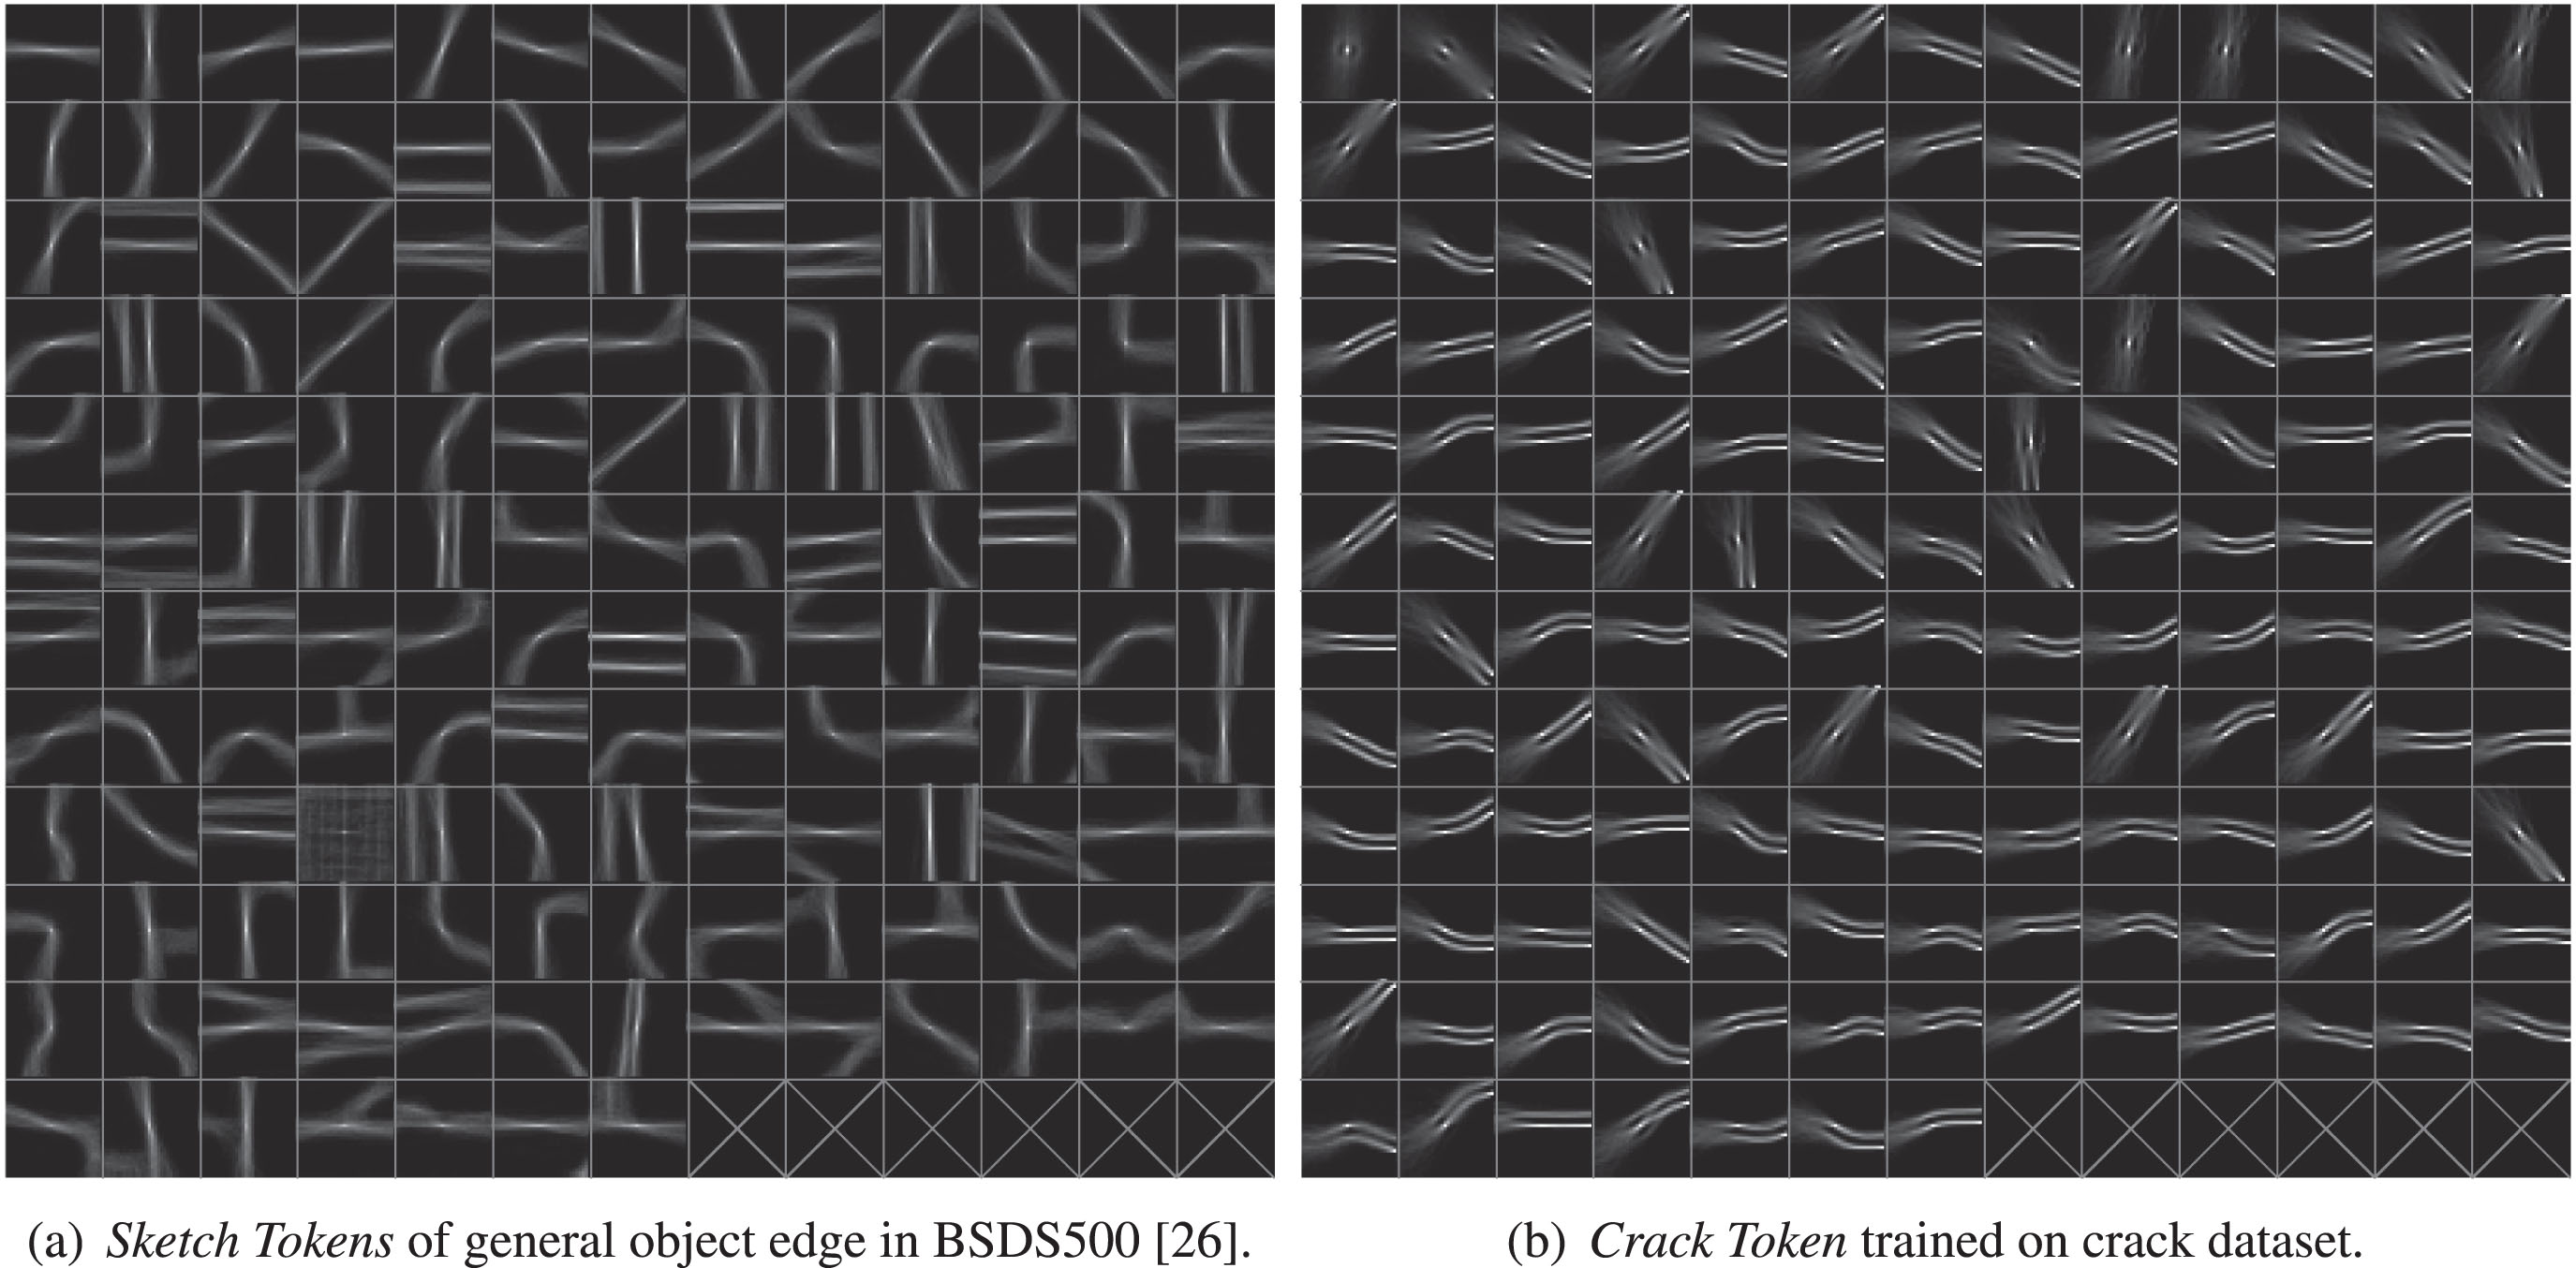
The most represent edge tokens of general objects and pavement cracks. Note that general edge tokens are most single lines and curves, and crack tokens often appear in parallel.
Because of the variety of crack shapes and directions, there are vast possible structures of crack edges. It is impractical or even impossible for human to design the structure manually. Instead, clustering method is introduced into this task, as it is able to automatically find the most representative local structures of crack edges.
Suppose we have a crack image set I with a groundtruth set G in which the cracks have been manually labeled in the binary image corresponding to the original image. Then we can learn the most representative local structure by clustering patches whose center point is just on the cracks. We call this type of patches crack patches. To represent the crack patches efficiently, we compute the Daisy descriptor [52] of each patch center in which the radius has been set equal to the half of the side length. The cluster centers, called Crack Token are shown in Fig. 4. We can see that most of crack edge structures contain parallel edges and the directions vary, each of which can be seen as a certain type of local structure. The set of classes are regarded as the mid-feature directory.
Pixel representation using mid-level feature
We regard the cluster centers as the most possible occurrence of crack edges. By integrating crack patches with the local structure label and other patches which are not centered on a crack with an additional class label, we can build a classification model to decide the structure label of a new patch. Given a trained model, the most intuition ways to represent each center point is to aggregate possibility of all patch tokens as the likelihood of the pixel on a crack. However, this means may loose much information. It indeed can indicate the totally chance of the pixel to belong to a crack, but it makes no use of the distribution information of the possibility over all token classes. In this paper, we represent the every pixel with a vector, size of which is one more than the number of pre-trained clusters and each dimension of the vector represents the likelihood that the point belongs to the corresponding token class, so that we can exploit as much the information as we obtain in the classification model, and provide a comprehensive expression of the pixel.
Edge prediction using structure information
Predicting the likelihood of all possible tokens is a multiclass problem with high computational density, since we want to calculate the possibility for every pixel in an image. In this paper we make use of random forests model [5, 16], as it has intrinsic advantages in handling complex classification problem, including high-dimensional and multi-class classification. A detailed empirical evaluation of random forests can be found in [7], which suggests that random forests perform consistently well across low and high dimensions. In order to capture a rich set of information, several channels and features have been employed in this paper motivated by [15, 26]. Specifically, we make use of three color channels in CIE-LUV color space, three gradient magnitude channels with Gaussian blur σ = 0, 1.5 and 5 pixels and eight oriented gradient channels, which derive from splitting each of the gradient magnitude channels at σ = 0 and σ = 1.5 into four orientation. The visualization of the 14 channel features are given in Fig. 5. To utilize the structure information of each patch, self-similarity features [42] have been used in every channel. Given a patch with fixed size of 35 * 35 in this paper, we generate 35 * 35 * (3 + 3 +8) =17150 channel features, and by dividing each patch into 25 tiny ones of 7 * 7 pixels and calculating the similarity of each tiny patch pair, we obtain binom252 * 14 = 4200 self-similarity features. Overall, 21350 features are exploited to capture each of the patch and the features can make great use of local structure information of the corresponding patch.
Demonstration of the 14 channel features we introduced in crack detection. (a) and (b) are the original crack image and groundtruth, and the randomly selected crack patch and corresponding groudtruth are marked with red rectangular in (a) and (b), respectively. The detailed visualizations of the crack patch and its 14 channel features are shown in (c) with a 3 by 5 chessboard in grey level. From northwest to southeast by row, the subfigures are crack patch, 3 color feature channels, 3 gradient magnitude channels and 8 oriented gradient channels. Note the richness of aspects captured by the channel features.
In summary, the input of our model are crack pathes and randomly selected other patches represented by feature vectors of 21350 dimensions, and the output are probability vectors indicating the likelihood that the patches belong to each of the pre-trained token classes. This vector is mid-level representation of the center point of the given patch and the sum from the first to the last but one components is the probability that this point is a crack edge point.We train our random forest with an advanced image toolbox provided by Dollar [16, 55], which is highly efficient and accurate.
After we obtain the possible crack edges and the mid-level feature, we next recognize real cracks from crack edges. As some of the crack edges may be discontinuous, we first employ graphical operation to acquire continues possible crack areas, and then we design an area-level feature to represent the areas. Finally, random forest model is used to distinguish cracks from other edges.
Crack area generation
Suppose the number of clusters we used in training of mid-level feature directory is 150. Then random forest provides 150 probability maps for a given image indicating the probability of each pixel that belongs each of the 150 pre-trained crack tokens, and the sum of all the probability maps can be seen as the likelihood that the pixel that is a crack edge point ranging from 0 to 1. The points with low possibility are not likely to be on a crack, so we first conduct thresholding method to obtain the points that are more likely to be on a crack, and the thresholding value is called degenerate threshold δ in this paper. In the early approaches thresholding method are most used [22, 36]. However, it may aggravate the discontinuity of cracks. To address this issue, in this paper closing operation [41] is conducted to before further recognition. Closing operation consists of two steps of erosion and dilation. Specifically the closing of a binary image A by a structural element B is the erosion of the dilation of that A. It can be expressed as Equation (1)
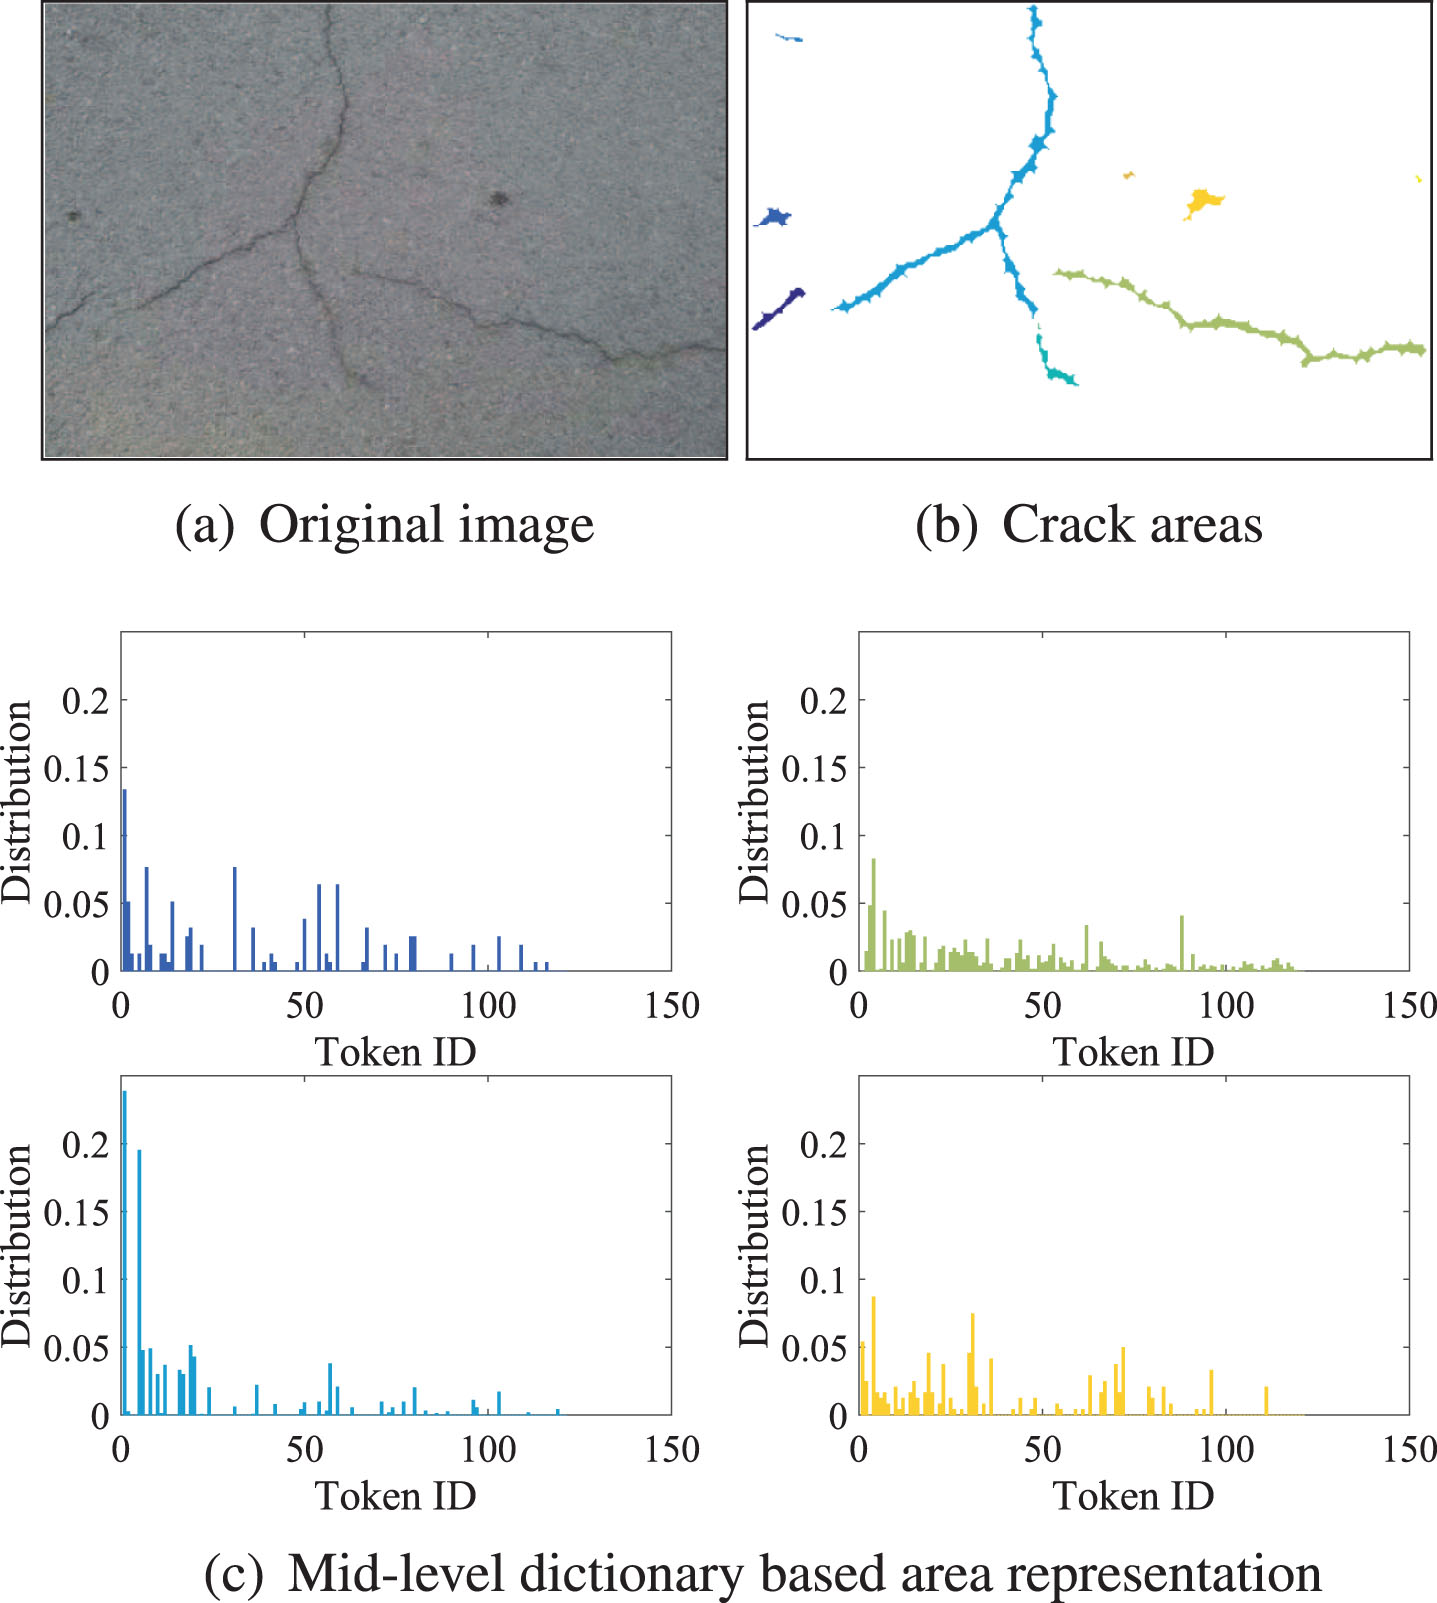
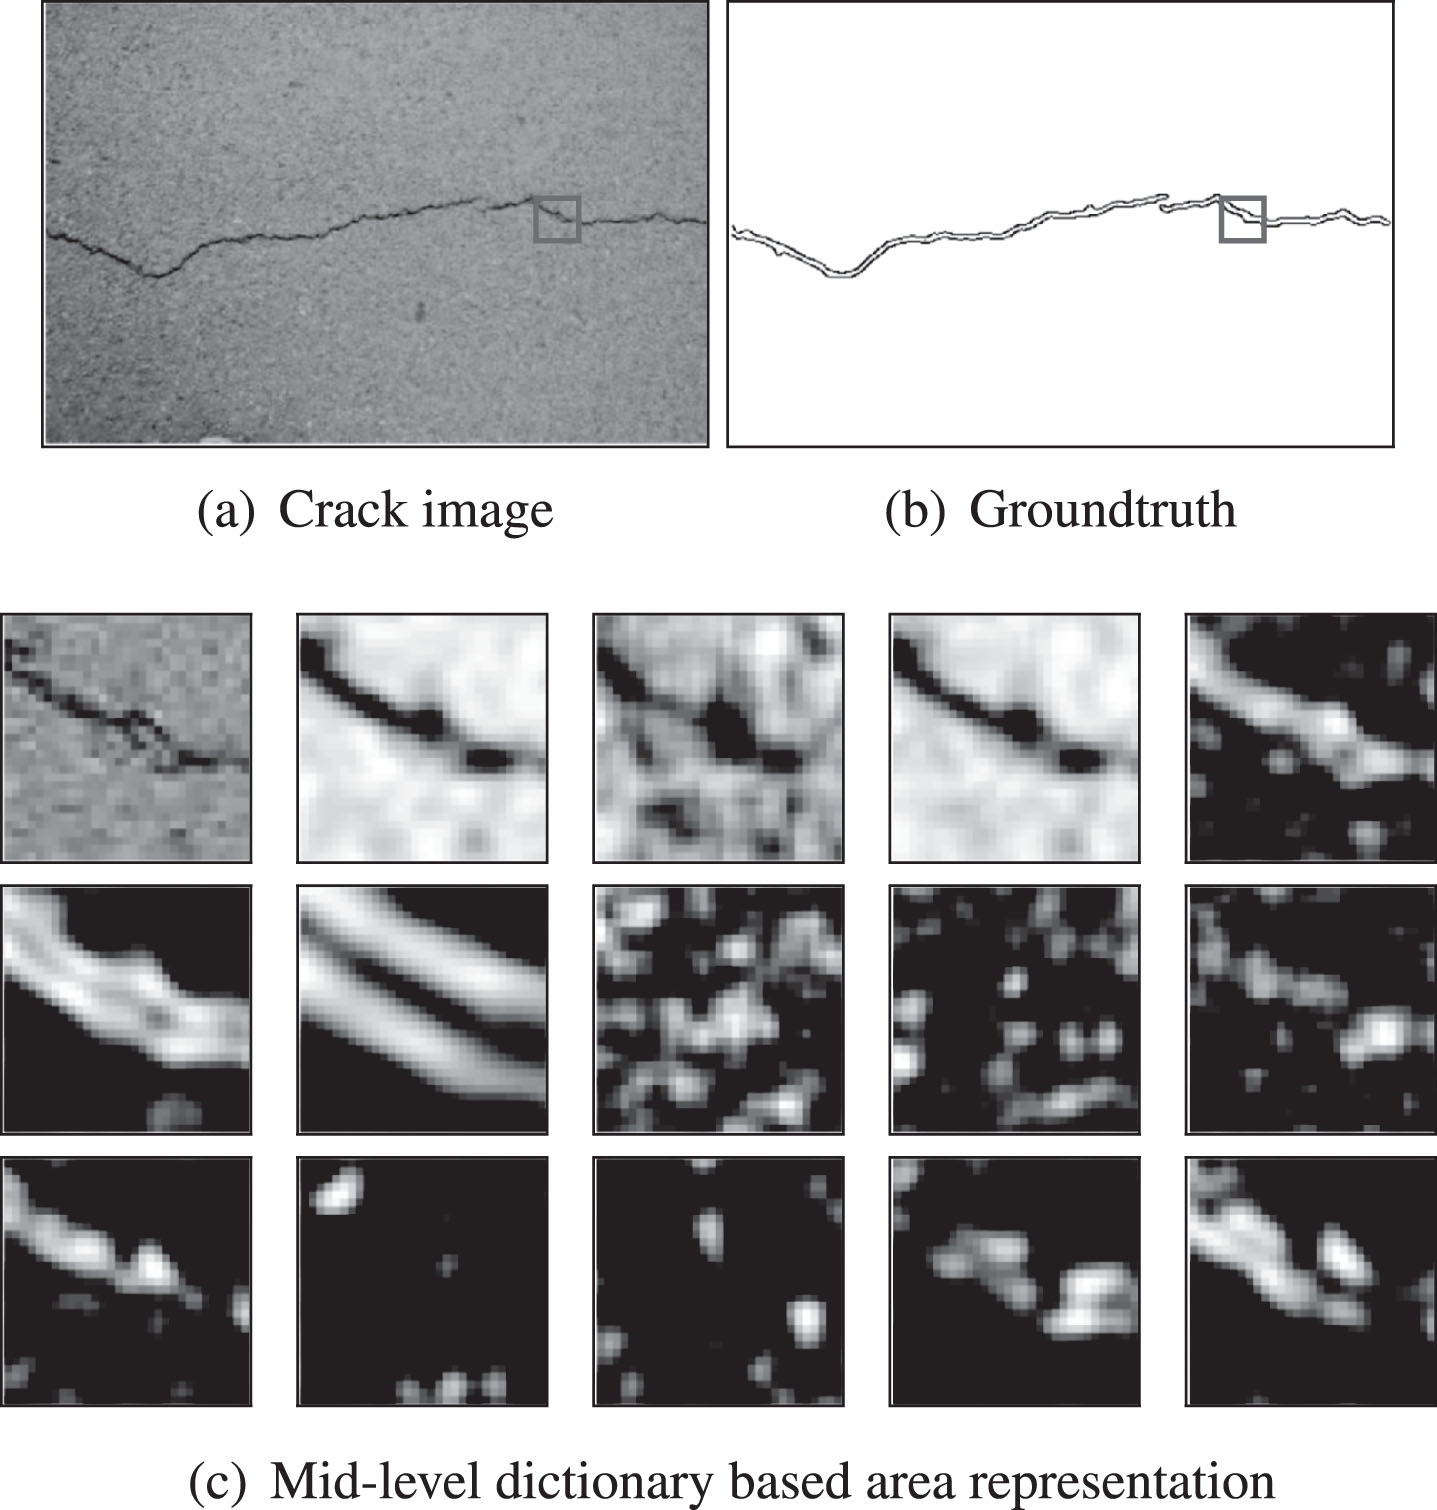
Examples of crack areas and corresponding mid-level dictionary based area representations.
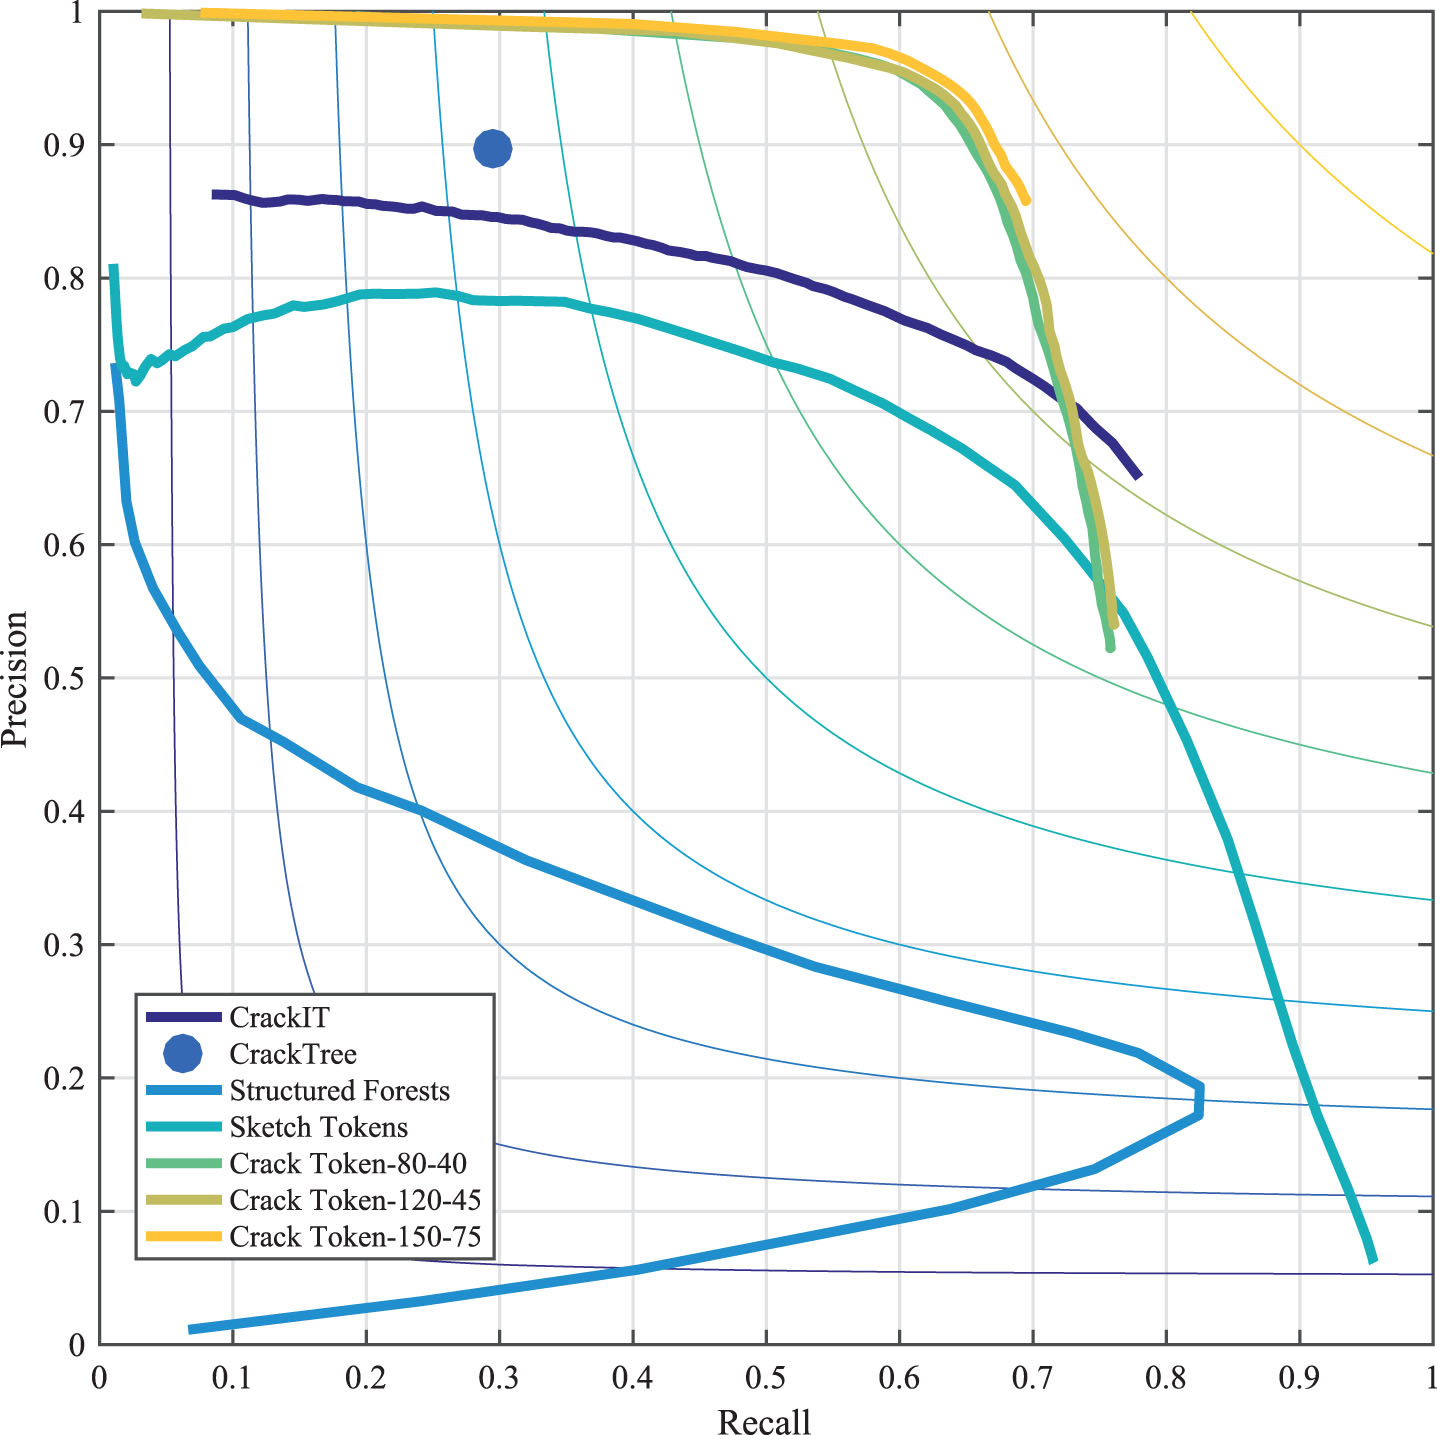
Precision-recall curves of CrackIT [36], CrackTree [56], Structured Forests [16], Sketch Tokens [26] and Crack Token.
In this step we design an edge level representation of potential crack areas to capture the edge level structure information. After the crack areas are constructed, we calculate the token class distribution of the most possible ones of each pixel in this area to capture the area. Specifically, each area is represented by a 150 dimensional vector. This resembles the popular histogram methods in the existing researches, however, it is the structure information that is depicted by the histograms. Examples of crack area features are shown in Fig. 6.
Crack recognition
We use a supervised machine learning strategy to train classification models that divide edge areas into cracks and other edges. Support Vector Machines (SVMs) are most popular discriminate models in the last several decades, due to the simplicity and effectiveness. So we use SVM classifier to accomplish this task. The inputs of SVMs are the designed edge-level areas representations and the outputs are the labels indicating whether this area is a true crack or not. And this area labels are determined by the corresponding area in the groundtruth set G.
Experiments
In this section we conduct comparion between Crack Token and other popular approaches to demonstrate the effectiveness of our framework. We introduce a novel evaluation strategy of crack detection and apply it on a real world crack dataset [44]. Extensive experiments demonstrated the outstanding performance of proposed framework.
Dataset
The dataset we used consists of 118 images of pavement distress along with manually annotated crack groundtruth for every image. Note that the dataset contains both noise free crack images and noisy ones. For performance evaluation, we randomly sampled 97 images as training set and the others as testing set.
Evaluation strategy
Performance evaluation of crack detection result has always been a critical part of crack detection applications. Existing researches usually make use of R (Recall of crack pixel), P (Precision of crack pixel), and F (F-measure of R and P) [36, 56], which are good choices inspired by edge detection area. However, these papers only report the static R, P and F, without any dynamic evaluation when thresholding is applied to the crack possibility map. The static R, P and F are able to report the best results under specific parameters, including the threshold, but they tell quite little about overall performance of the approach when the parameters vary. In the real world applications, the pavement situation may be far different from which we train the models with. As the result, the prior models, especially for the best parameters, probably need slight revision to adapt to the new situation. And this leads to consideration about the sensibility to parameters. In this paper, we introduce the most popular strategy in the edge detection field, including possibility map and precision-recall curve, to conduct the sensibility analysis. Furthermore, we report precision, recall and F-measure on both fixed contour threshold (ODS), per-image best threshold (OIS) [1].
Result
In this paper, we choose the most advanced crack detection approaches (CrackIT [36], CrackTree [56]), and state-of-the-art edge detectors on BSDS500 [1] (Structured Forests [16], Sketch Tokens [26]) for comparison.
The detection results of CrackIT come from CrackIT toolbox [36, 37], and the results of CrackTree are provided by the authors of [56]. We build the Crack Token model based on the training set. As number of clusters (#Clusters) determines the richness of the mid-level feature directory and degeneration threshold controls the merits of pixel to construct area, which are the most important parameters of the proposed framework, we tune these two parameters in experiment. Specifically, the #Clusters is set in {80, 100, 120, 150, 500} and degeneration threshold δ is climbing from 0.4 to 0.8 by 0.05.
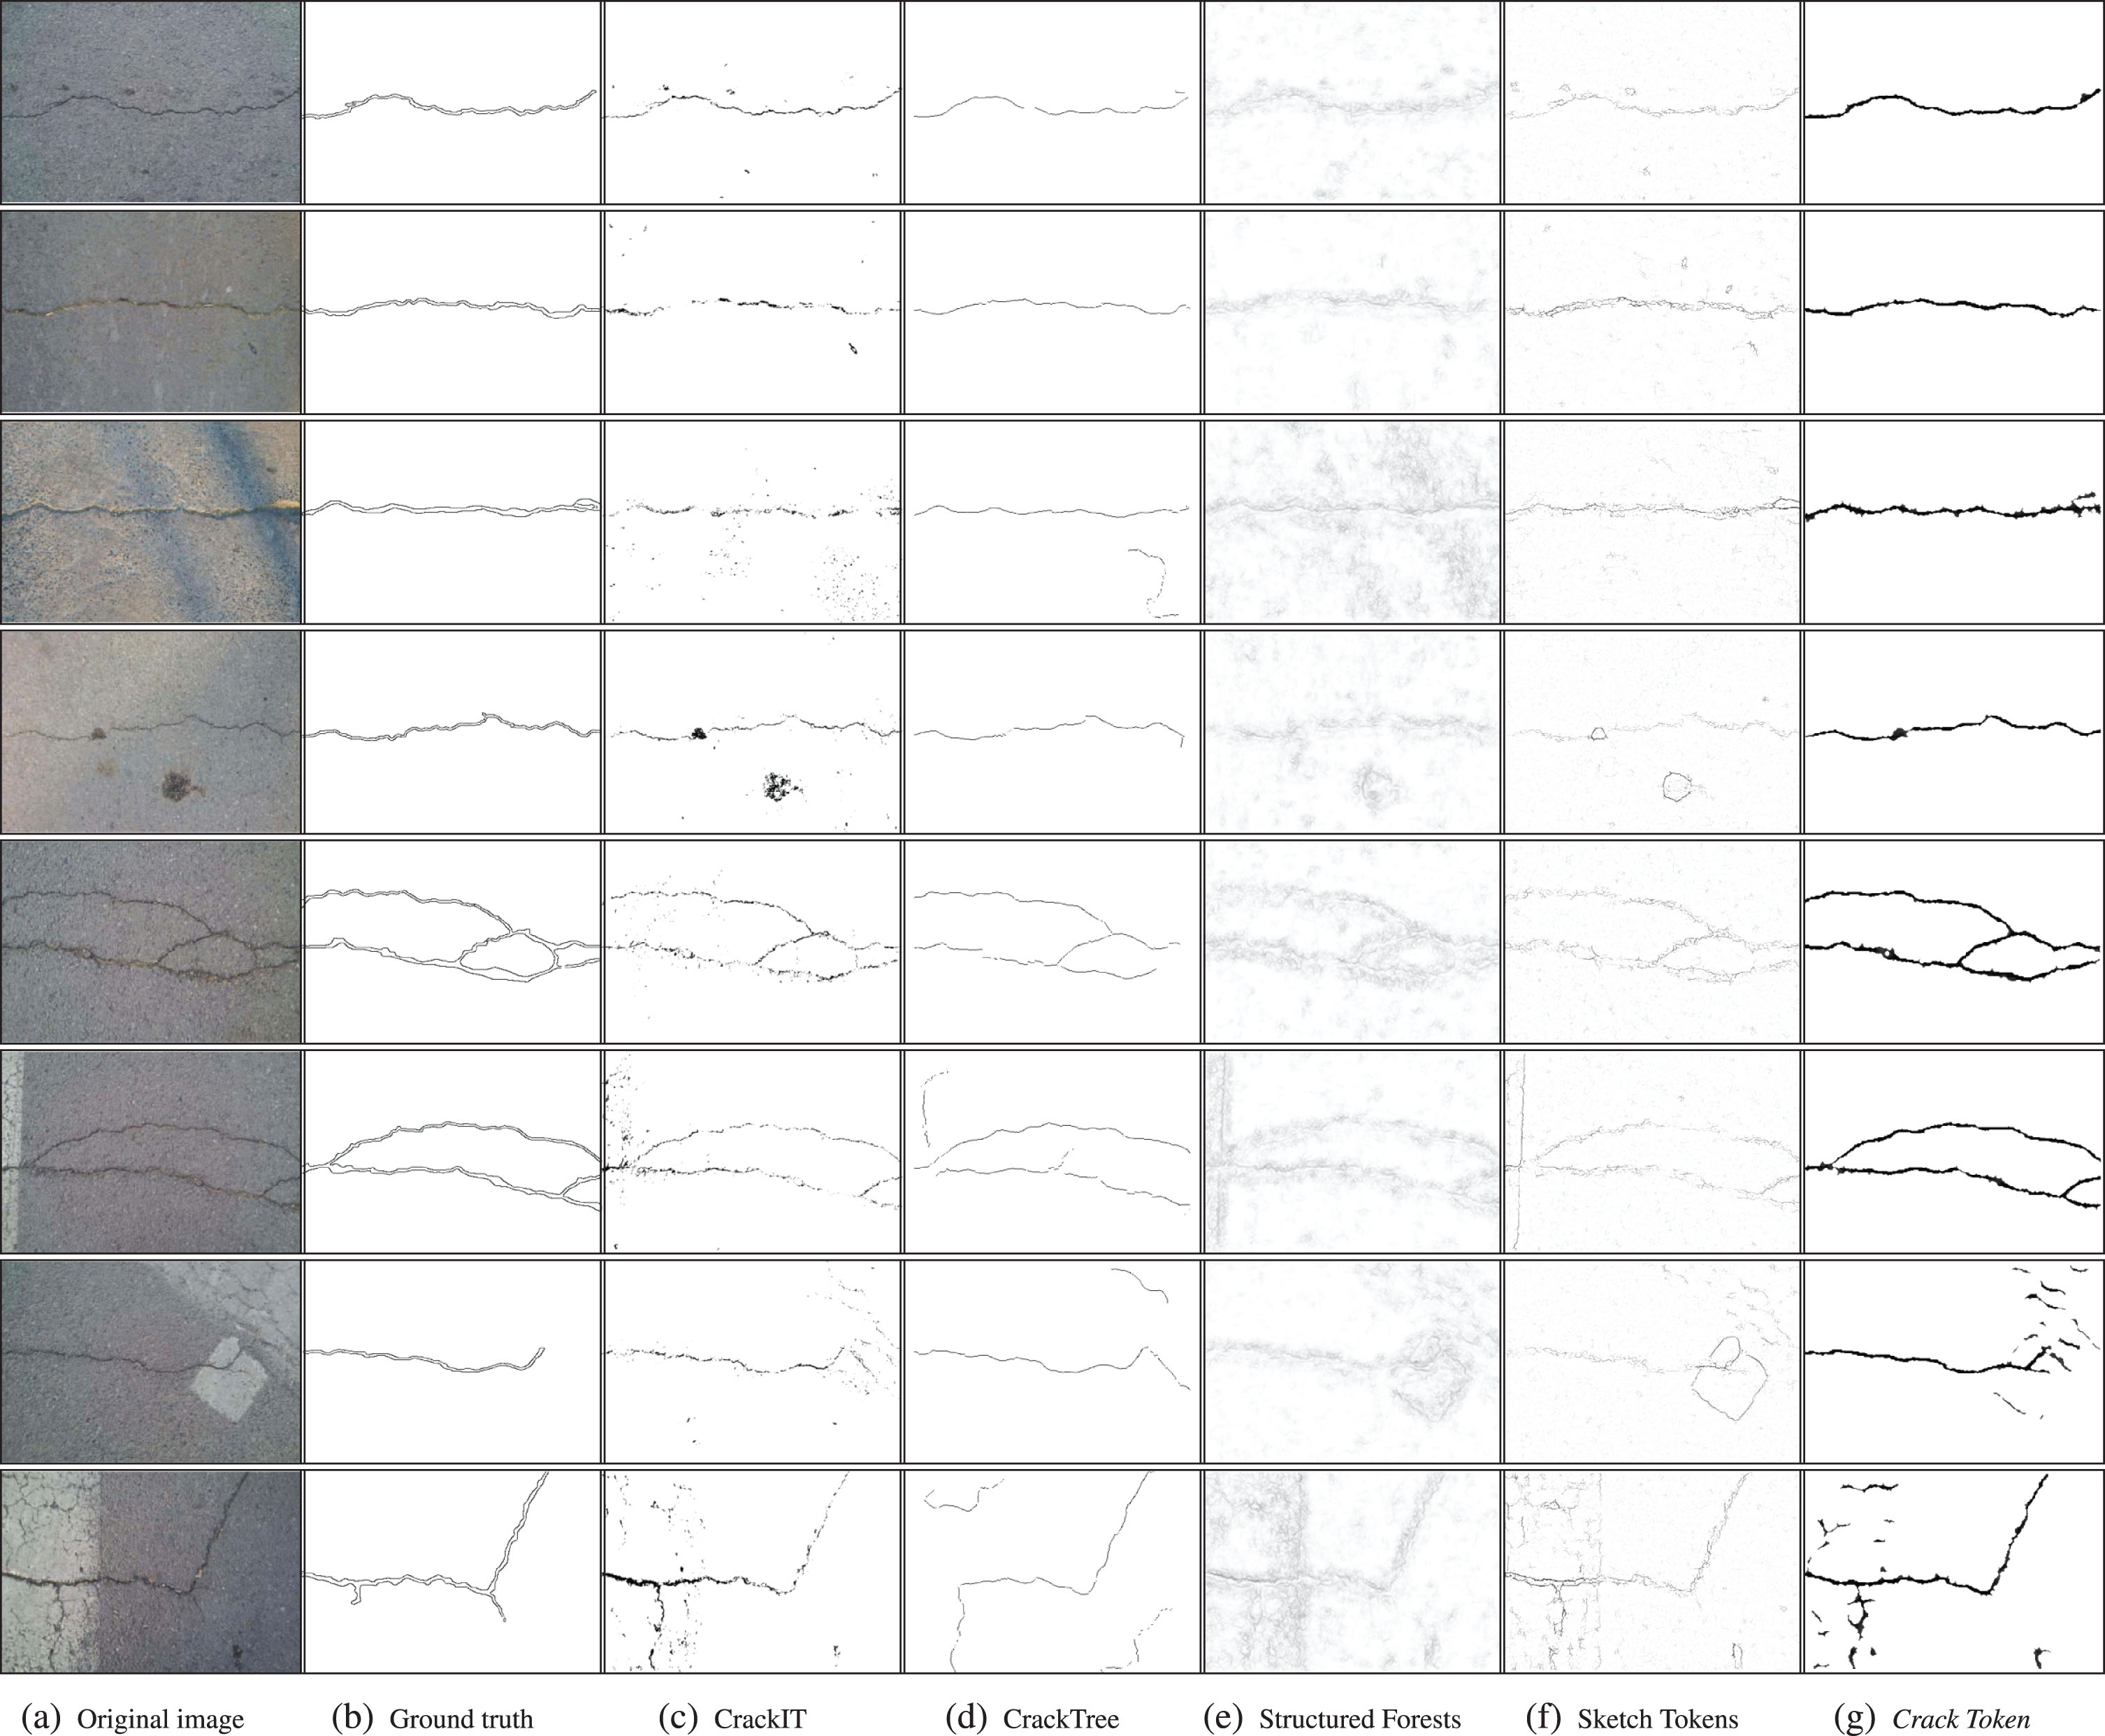
The comparison of all the methods are demonstrated in Fig. 8. It is obvious that CrackIT, CrackTree and Crack Token achieve better results than pre-trained Structured Forests and Sketch Token significantly, and the proposed Crack Token remarkably outperforms all the other methods. Specifically, CrackIT can find the location and width of crack in satisfactory level. However, it is sensitive to noises such as oil stains and shadows, as shown in rows 3 and 4 in Fig. 8, which may caused by low feature variety. CrackTree can remove most of the noises due to the post hoc shadow-removal algorithm and indentify the fine location and shape of cracks. But as we can see, the detection results are only a sketch rather than intact cracks. This obviously limits the ability for severity estimation. Structured Forests [16] and Sketch Tokens [26] are state-of-the-art edge detectors, and they are taken into account to show the power of supervised learning scheme and necessity for specified design. The performance of pre-trained Structured Forests and Sketch Tokens obtain unsatisfactory compared to that they achieved in edge detection problem on BSDS500. It can be seen that these two approaches tend to recognize general object edges rather than cracks. By utilizing proposed framework, Crack Token can detect cracks effectively and find slight cracks which are even not labeled by human, seen in the last two rows. Compared to CrackIT and CrackTree, we can tell that mid-level structure features in Crack Token contribute a lot on crack detection. When compared to Structure Forest and Sketch Tokens, it is suggested that crack detection can benefit much from supervised strategy and task oriented training combined with mid-level area representation.
The detailed results on crack dataset are give in Table 1. To conduct a fair comparison, the results of Crack Token in Table 1 are the average over all the results in searching of best parameters of #Clusters and δ. It is shown that Crack Token achieves the best result of precision and F-measure on both ODS(0.764) and OIS(0.800), and largest area under PR-Curve(0.631), indicating the state-of-the-art results of Crack Token. In addition, we provide the best results and parameters of Crack Token in terms of the three most important criteria: F on ODS, F on OIS and Area-PR, as it is shown in the last three rows in Table 1. The best F on ODS can reach 0.770 with #Clusters= 150 and δ = 0.75, best F on OIS can reach 0.807 with #Clusters= 120 and δ = 0.45, and best Area-PR can reach 0.715 with #Clusters = 80 and δ = 0.4. Notice the best values of the criteria are very close to the average level, suggesting the great robustness of Crack Token over parameters. The PR-Curve of these methods are presented in Fig. 7. As CrackTree reports a binary map of predicted cracks, we can only plot a point for in this figure. Note the pre-trained Structured Forests model is not quite suitable for this specific task. Obviously Crack Token consistently holds on the top, indicating the significant superiority over other method, except for CrackIT when precision is lower than about 0.7. Although degeneration step in Crack Token may result in a decrease of recall, we can take it as a worthwhile compromise to acquire decent P and F.
Crack detection results of on crack dataset. Our Crack Token achieves top performance. The #Clusters and degeneration threshold δs for best F ODS , F OIS and Area-PR are also reported in this table
Although there are only slight differences between the Crack Token results when parameters vary, it is still interesting and practical to examine the impact of #Clusters and degeneration threshold δ. As mentioned above, we summarize the R, P and corresponding F when #Clusters in {80, 100, 120, 150, 500} and δ varies from 0.4 to 0.8 by 0.05. The results are shown in Fig. 9. We can find that there are obvious trends on OIS, but no on ODS. With respect to OIS, as δ increases, recall goes down and precision up. F-measure remains relative stable when δ is in [0.4, 0.7], and decrease sharply when δ is increasing greater than 0.7. This trend can be explained straightforward from intuition: when δ increases, more real crack pixels are removed due to low predicted likelihood to be on a crack, which leads to the decrease of recall, meanwhile more false crack pixels are kicked out, resulting in less false positives and higher precision. Regarding to the situation on ODS, when δ increases, the only trend we can tell is that the F-measure increases slightly. This may be caused by the complex background and noises over the data set. To provide an empirical value, we suggest #Clusters as 80 and δ as 0.6 to 0.7.
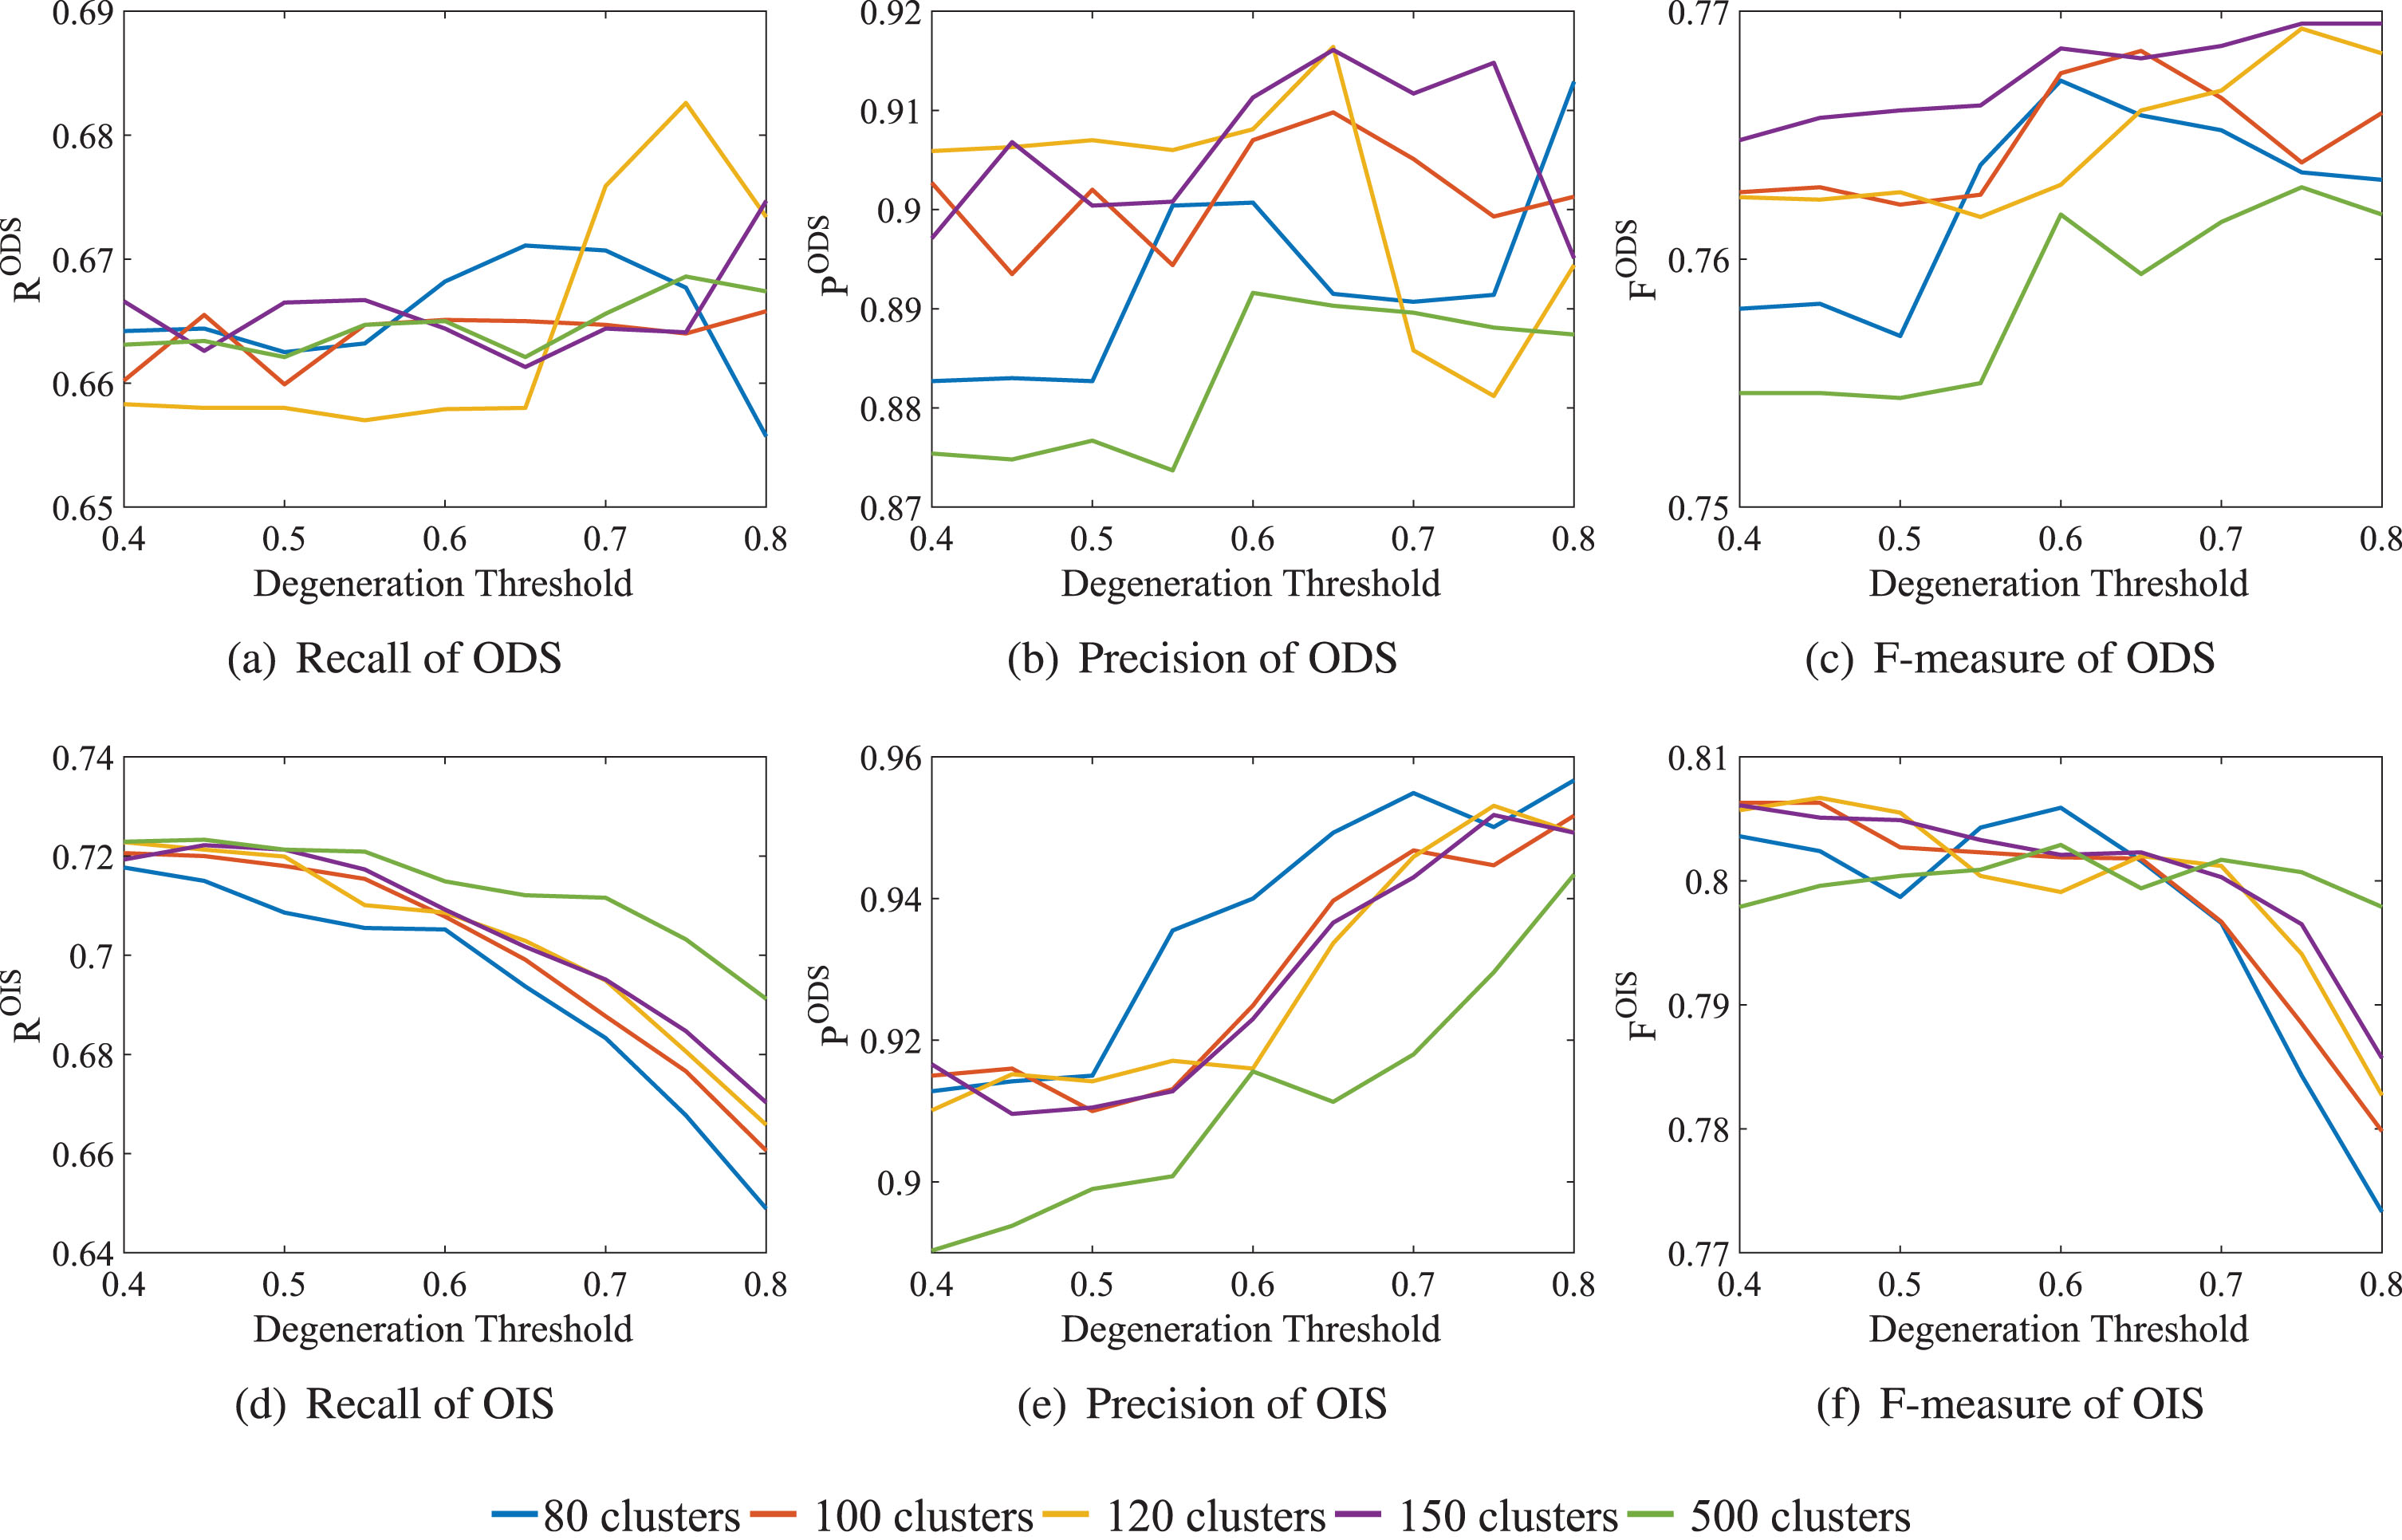
Comparison of Crack Token results on ODS (a-c) and OIS (d-f) over different #Clusters and degeneration thresholds.
In this paper, we propose a novel framework and an effective detector for crack detection based on mid-level features Crack Token. The detector and framework achieve the state-of-the-art results. The main contributions of this paper are as follows: (1) We propose a new edge-based crack detection framework to improve the detection performance. It can be applied with any advanced edge detectors, which may promote the research in this field. (2) We provide a novel mid-level feature, named Crack Token, which captures the local structure information of cracks and contributes much on complex noises removal and machine learning based crack definition. (3) We also introduce a new evaluation strategy for road pavement crack detection task, which provides a comprehensive means to capture the robustness and overall performance of crack detectors when parameters vary. Furthermore, parameter settings are examined and empirical values of parameters are given, which provide valuable guidance for real world applications. In the future, we would like to make effort on the development of other suitable degeneration means and area generation approach.
Footnotes
Acknowledgment
Our deepest gratitude goes to the anonymous reviewers for their careful work and thoughtful suggestions that would help improve this paper substantially. This work was supported by the National Natural Science Foundation of China (NSFC), CUFE Youth Researcher Development Foundation [grant number QJJ1704], Program for Innovation Research in Central University of Finance and Economics and Beijing Natural Science Foundation [grant number 9182015].