
Abstract
Digital Bibliography and Library Project dataset is a collection of bibliographic records of computer science publications of various authors and co-authors. It contains approximately 1.5 million bibliographic records. An algorithm for an author’s information retrieval is developed to retrieve details of specific author publications and correlation among authors. Further performance of an author is measured with parameters like consistency, contribution factor, stability, cooperativeness, and solidity. The work presented is tested on the DBLP dataset. Experimental results clearly support the claim that it works efficiently for retrieving specific author-publication records and its analysis with respect to suggested parameters.
Introduction
Worldwide every year exponential growth is witnessed in research publications. Publications contribute highly to quantifying the researcher’s innovations, impact, and experience. Further, it plays an important role in person carrier, appraisals, and financial grants. The total count of publications is becoming a prime factor of the researcher’s curriculum vitae (CV). It has become a trend to amplify count of publications by various tactics to keep oneself in the race or various local compulsions. It further results in being co-author either to the publication of papers with negligibly important scientific content or being co-author to the publication without contributing significantly [19, 20]. This results in more than 3 authors for one publication. Count of such multiple authors is observed up to 8 authors. “Editors, researchers, and others in scientific publishing have raised concerns about the increasing number of authors being listed per article, the practices of honorary and ghost authorship, and the danger of the dilution of responsibility when many authors are involved”[20].
Popularly, the quality of research contribution of the researcher is measured in terms of three parameters- the number of research publications, citations for the work, and measures like, h-index, i-index, r-index and similar [18]. We feel that by using these measures we cannot analyze authors profile in terms of his cooperation, consistency, and contribution factor. In this work, we present additional parameters to analyze the profile of the researcher. DBLP is a computer science bibliography dataset. DBLP has a collection of more than 3.66 million journal articles, conference papers, and other publications on a computer. Like DBLP, there are many such resources are available providing author publications. Extracting, processing and analyzing these publication records can assist in measuring the quality of the researcher’s profile. DBLP XML file contains details of publications, each node from XML file represent a single article or publication and attributes of this node provide various detail of an article. It is quite difficult to process this record as a whole. Hence this large dataset needs to partition into smaller sub-graphs and process further for author co-author relationship visualization and to measure the author’s performance [13].
In this paper, we present algorithms to retrieve related information from DBLP and measure the performance of an author in order to analyze the authors’ profiles. The novelty of the work presented includes i) retrieval algorithms for retrieving author information from the publication database. ii) Introduction of parameters- contribution factor and consistency. iii) visualization of the author and co-author cooperativeness. Literature reveals that minor work is dedicated for such author analysis. Researches in [12] have presented a system that uses silver light and works on windows platform only. There is a need to develop a browser-independent system for analysis with some precise performance measure parameters.
The paper is organized as follows: Section II reviews related work for this paper. Section III provides details of system architecture and the author’s information retrieval algorithm. Section IV presents experimental results. Section V concludes the paper.
Related work
Substantial number of researchers has contributed to the domain of graph partitioning and visualization. Literature available assists scientists in working in the domain. Many papers have focused on the study of various aspects of authorship, publications, and its quality. A wide number of resources like DBLP are available providing publication database to researchers. A rare number of papers perceived processing of publications database and its quantification for analysis of researchers contribution. Social network analysis and author information retrieval algorithms developed by various researchers include the focoa.net system, which mainly uses graph- partitioning algorithms like spectral bisection, Kernighan lin refinement, and geometric partitioning. A graph partitioning problem is defined as- for a graph G (V, E) where V is set of vertices and E is set of edges, partition in k roughly equal subsets (partitions) such that the number of edges to be removed should be minimum. Let P denote a set of partitions obtained after partitioning a graph G into k number of partitions, such that P = { p1, p2, …… p k |p i , p j ⊆ V, p i ∩ p j = Φ and i ≠ j } [2–8]. Some of the techniques proposed by various researchers for social network analysis using graph partitioning are explained in detail as follows.
Researcher Liu et al. provided social network analysis, co-authorship networks and their combination [9], which mainly contributed to computing page rank, authors’ rank and some coefficients of an author. Han et al. Performed analysis of the DBLP dataset to find the supportiveness of the author [10]. The value of supportiveness is based on co-authorship ties in a non-symmetric ways. Ergin Elmacioglu and Dongwon Lee proposed six degrees of separation in DBLP –DB by elaborating bibliometric study on the DBLP community [11]. Zdenek Horak and Milos Kudelka developed FORCOA.net as an interactive tool for exploring the significance of the authorship network in DBLP data [12]. This tool mainly focuses on the analysis and visualization of the co-authorship relationship based on their joint publication and intensity of the author. The analysis is performed using a forgetting function, which holds publication information relevant to the selected date. The existing techniques are dedicated servers designed for the DBLP data set to retrieve the author’s performance measure parameters which need the support of silver light and browser- dependent systems [13–16]. There is a need to develop a browser-independent system for analysis with some precise performance measure parameters. Work presented here efficiently satisfies these needs.
Author information retrieval algorithm
System architecture for analysis of bibliographic records is discussed as shown in Fig. 1. It consists of major two blocks such as DBLP pre-processing and DBLP processing and visualization.

System Architecture for Author Information Retrieval.
All important journals and proceedings papers on computer science are tracked (http://dblp.uni-trier.de/xml/) [17]. The file dblp.xml contains all bibliographic records, which builds DBLP. It is accompanied by the data type definition file dblp.dtd. Auxiliary file is needed to read the XML file with a standard parser [1]. The file, dblp.xml has a simple layout: record1, record2... recordn. DBLP XML file contains details of publications, each node from XML file represent a single article or publication and attributes of this node provide various detail of an article. One sample node from DBLP XML file is shown as below [1]-
<article key = ”journals/jmm2/PatilKBK10” mdate = “2017-05-26”>
<author>Varsha H. Patil< /author>
<author>Gajanan K. Kharate< /author>
<author>Dattatraya S. Bormane< /author>
<pages>71-78< /pages> <title>Super Resolution for Fast Transfer of Graphics over Internet.< /title>
<year>2010< /year>
<volume>5< /volume>
<journal>Journal of Multimedia< /journal>
<number>1< /number>
<ee>https://doi.org/10.4304/jmm.5.1.71-78< /ee>
<url>db/journals/jmm2/jmm5.html#PatilKBK10< /url>
< /article>
Various attributes of Record are-
•key: key is a unique key of the record. It shows UNIX file system with slash separation. The subtrees in the key namespace are for papers published in journals, transactions and magazines. The second part of DBLP depicts conference series or periodicals. The last 45 part of the key contains sequence of alphanumeric characters with ids formed from authors names and year of publication[1].
•Mdate: Mdate is the last modification of the record. The format of the date is YYYY-MM-DD. It provides the facility of loading recent additions into an application. It contains old versions of records [1].
•Title: This is one of the important elements that have to exist in every DBLP publication record. It has sub-elements for subscripts, sup elements for superscripts, i element for italics, and tt for typewriter text style [1].
•Pages: It indicates the length of the paper. For a single page paper, page number without a hyphen is written. For articles in magazines, a comma-separated list of page numbers of page ranges is used [1].
•Years: A year element is a four-digit number interpreted according to the Gregorian calendar. For journal articles, it is assumed that the date of publication of the issue is definite. For conference proceedings, the specification of year becomes tricky because sometimes proceedings are not published in the same year in which the conference held. Hence year in which the conference is held considered a year in a record. For journal articles, the volume and number field are used to specify the issue in which paper listed [1].
•URL and ee: DBLP record contains two URLs under this field. URLs are of two types, local and global. Global URL is the standard internet URL that starts with protocol specification of the form letter +: (http:, ftp:,.). Local URLs do not start with the protocol name. ee indicates the position of the electronic edition. ee contains the required link information of ACM and IEEE papers. Usually, the ee fields are global URLs [1].
DBLP dataset is provided as an input where bibliographic records are stored as XML nodes. As XML is very concrete and highly canonical, it is less suitable for the representation of multiple interactions between two or more nodes as compared to a network of vertices and edges (graph). To increase the efficiency of analysis, the DBLP dataset is transformed into the number of N graphs.
DBLP dataset pre-processing is performed in two steps- author list generation and partitioning of a publication record in a quantum of specified years. These two operations are simultaneously performed in cooperation to generate a unique list of authors and the number of vertexes- edge sub-graphs where each sub-graph contains publications published within the quantum of specified years.
Author list generation
In the DBLP dataset, each node symbolizes a publication and attributes signify details of publication. A node may have more than one author attributes, in such a case, the first author attribute represents the main author and further author attributes represent co-authors. From the DBLP dataset, all unique authors are retrieved and a unique id (author_id) is assigned to each author. author_id, author_ name and partition_labelrepresent unique vertex in a graph as shown in Fig. 2.
Specified Author Representation in Each Partition.
Let P = Set of Partitions in span of 5 years
Pa = p|p ∈ P and an author is active in p.
The detail of each author including author_id, author_name and partition_label L (Pa) ∈ l (p) in which an author is active are stored in RDBMS.
A fixed span of a year (quantum) is considered successively from the year of first publication to the current year for creating partitions (P). Partition p ∈ P is a sub-graph (a network of author and co-authors). The process of partitioning is discussed in detail in section 3.3.3.2.
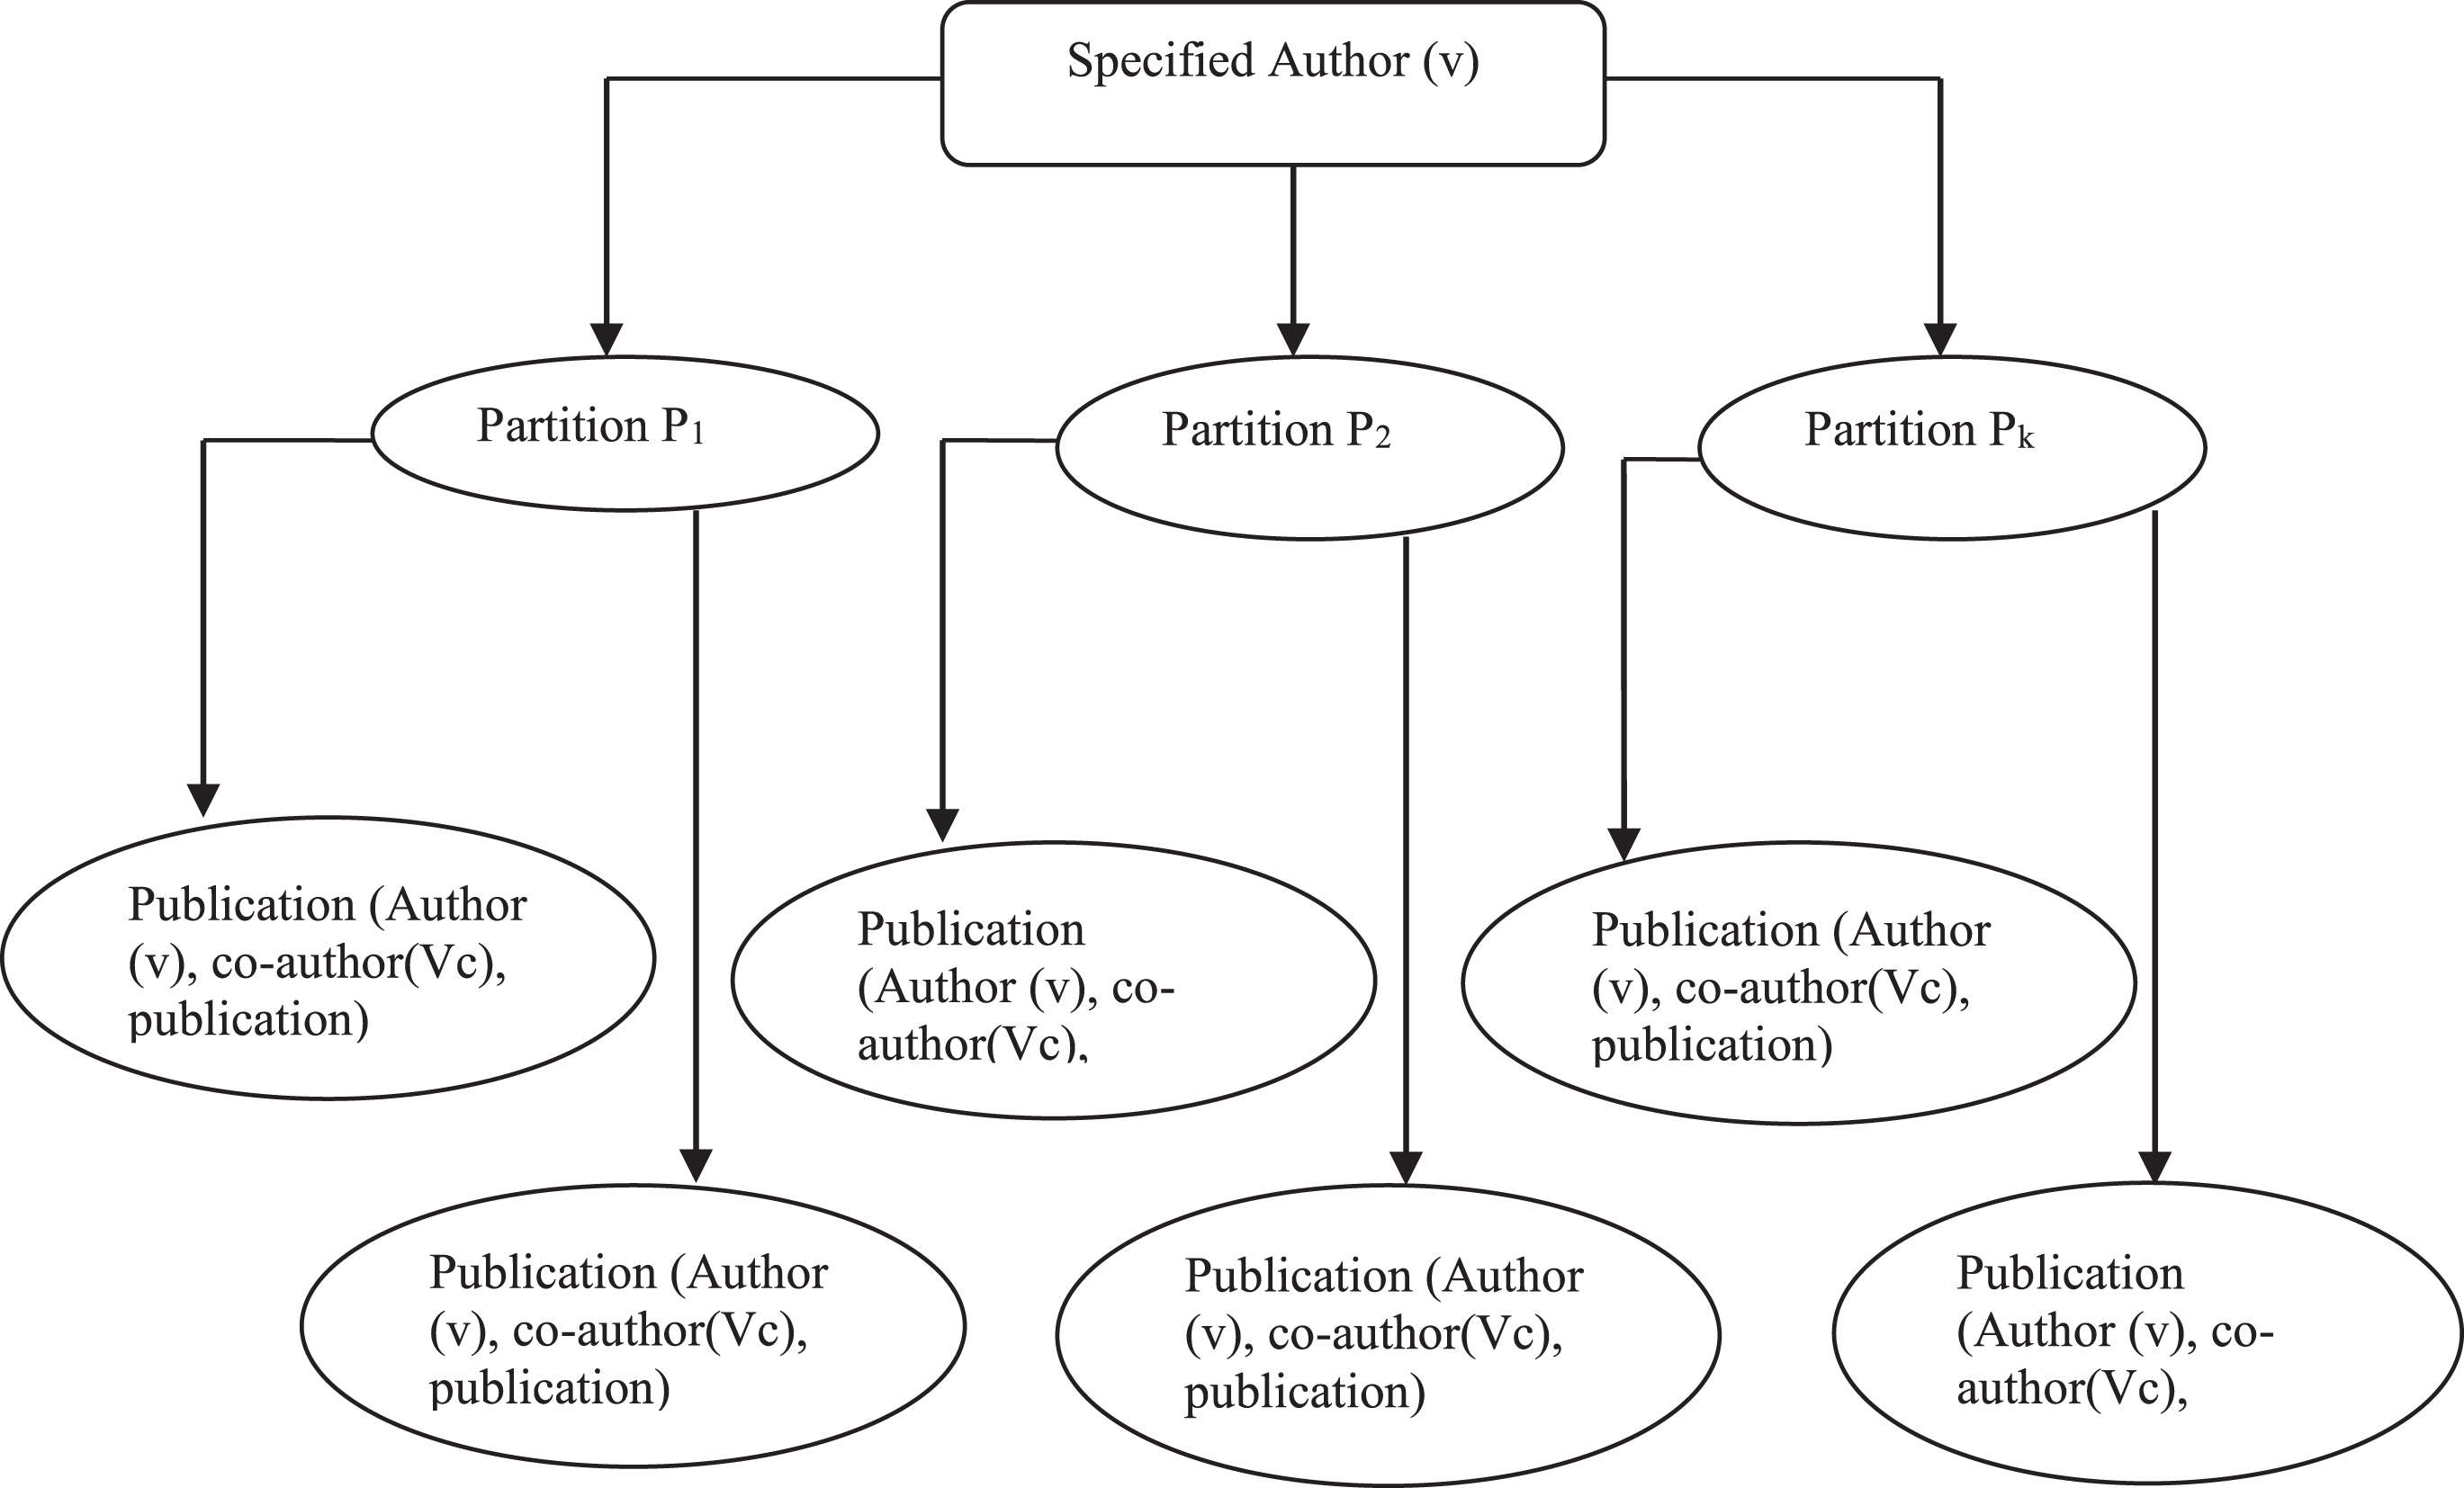
3.1.1.1Partitioning of Publication Records in Specified Span: As DBLP Dataset is flooded with millions of publications, it is not feasible to store and process all publications in a single graph due to memory limitations and processing issues. This limitation is overcome by producing an N number of sub-graphs of the DBLP dataset based on the specified quantum of the years. A quantum of 5 years is considered for the partitioning of the DBLP dataset into partitions (P). Each publication in the DBLP dataset is placed in a suitable partition based on its publication year. Each partition stores publication in the form of a network of vertices and edges (G (V, E)) where vertices represent author and edges represent an interaction between authors. Edge label, L (e) where e ∈ E, signifies publication details between two authors. Figure 3 shows the specified author’s representation in each partition.
Author Publication Information Retrieval.
DBLP processing comprises major blocks as - retrieve publication details of author, co-author list generation based on the publication, computation of author performance measure and visualization of the author’s publication as shown in Fig. 2.
Publication details of specified authors are retrieved and the performance of the author is measured in terms of parameters such as stability, cooperativeness, consistency and contribution factor. The significance of each parameter is explained in section 3.3.2.4.
Retrieve publication details of author
Name of author (selected_author) of whose details are to be searched and performance to be measured) is provided as an input. The specified author name is searched in RDBMS to obtain authors unique id and partitions in which he/she has published articles. If the specified author exists then, articles published by an author are retrieved from all partitions in which, he / she is active.
Author list generation based on publication
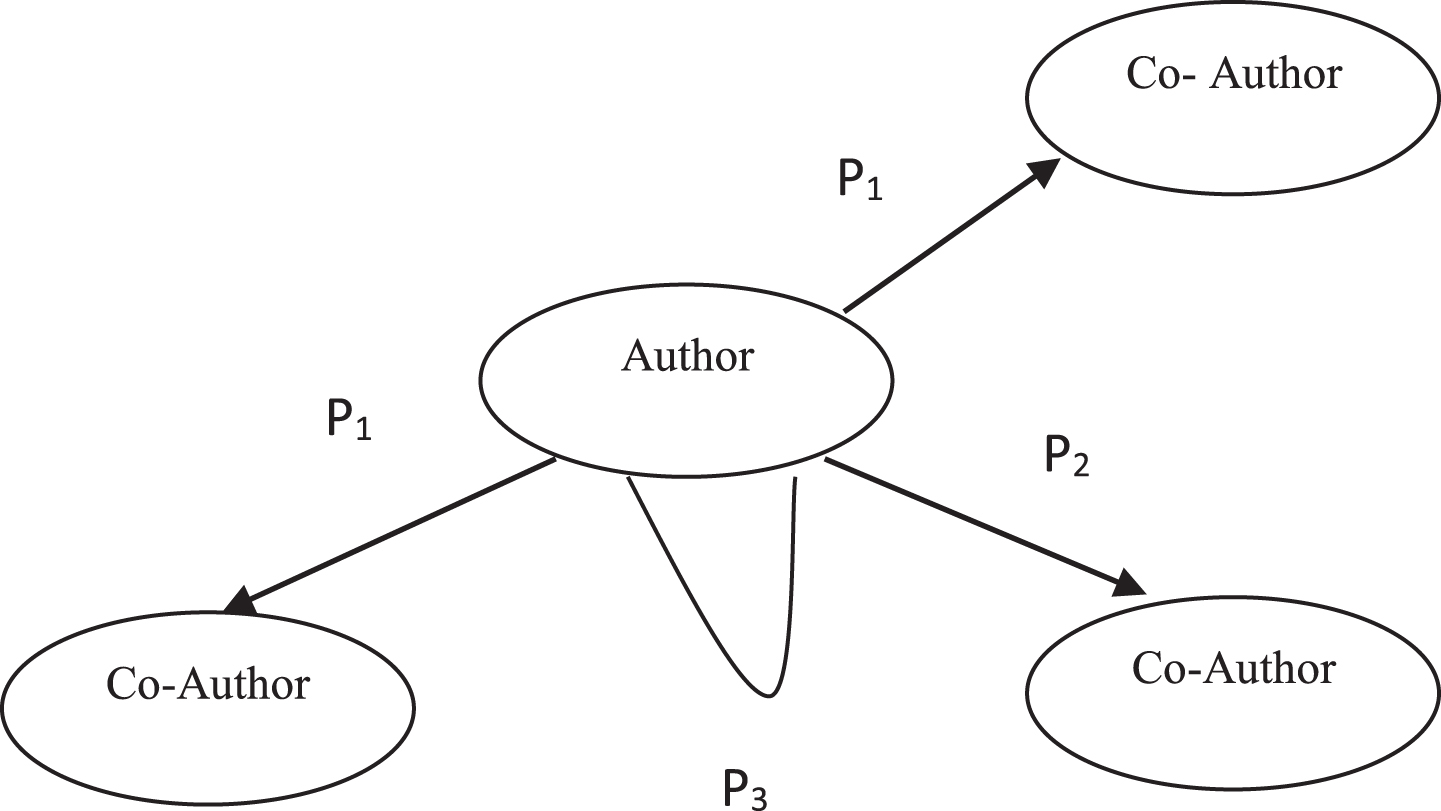
All publications ofselected_author (the selected author is source node) are obtained from all partitions Pa, then all co-authors of selected_author are determined for all publications as shown in Fig. 3 where p1, p2, and p3 indicate publications.
Visualization of authors publication
For visualization of partitioned sub-graphs and publication details of selected_ author, a vis Javascript-based network graph visualization library is used [12]. The author’s publication details are transformed in a form required for the vis library to visualize a network graph.
Computation of author performance measure
Depending upon the author’s information retrieval, the performance of an author is measured in accordance with various parameters as stability, cooperativeness, solidity, consistency, contribution factor and n number of most influential authors in a quantum. Forcoa.net system computed stability, cooperativeness, and solidity, rest of the parameters such as consistency, contribution factor and n number of most influential authors in quantum are the contributions of research work. The computation details of each parameter are discussed below.
1. Stability: The details of publication published together by two authors are represented by an interaction between two vertices in a network. As two authors may have more than one publication together, it leads to multiple interactions between these two vertices. If the number of interactions between two vertices is more, then these vertices are considered more stable and the tie between them is stronger [3, 15].
For each vertex and tie, two times changing characteristics are defined as [3] - Edge stability: Edge stability ES is the time span for which tie between two vertices remains active since first interaction such that ES > 0. Vertex stability: Vertex stability Vs is a time period for which vertex remains active since first publication such that Vs > 0. Self- stability: Self- stability is self- loop (self- edge) which stores information about publication where no co-author is involved.
2. Cooperativeness: It mainly describes the relationship of vertex v with other vertices having interactions with it. As vertex stability is independent of the number of ties. Hence, in this case, important interactions are considered in which adjacent vertex has higher stability [3, 16].
Cooperativeness for vertex v is computed using Equation 1.
Where v i and e i are vertices adjacent to vertex v
Algorithm 1: Computation of Cooperativeness
1.for each adjacent vertex v i of v
begin
1.1 Calculate vertex stability of v i , VS(vi)
1.2 Calculate edge stability of e i , ES(ei) where ei = (v, vi)
1.3 Cooperativeness of(v) + = sqrt (Vs (vi) . Es (ei))
2. end for
3. Solidity:
The basic motivation is to select strong ties having at least one interaction in a specific period. Solidity considers only ties having at least some minimal stability (stab). Here we have considered stab = 1 month that is tie should have minimum one interaction in the period of a year [3]. Solidity is measured by using Equation 2.
4. Consistency:
Author’s consistency measures variation in the number of the interaction of author v in the surrounding in each successive span of y years. The author is said to be consistent if publications are nearly equally distributed in the span of publication years. For example, author A has 20 publications in span of the year 1995–2000. If of 20 publications, each year around 4 to 6 publications noticed each year, then it is said that the author is consistently publishing the papers. Conversely, if of 20 publications, 15 are published in a year say 1998 and the remaining 5 are published in another span of years, then we can say that the author is not that consistently publishing the papers [3, 16]. Compute the arithmetic mean by using Equation 3.
x = Total number of publications of author v in the span of y years
n = Total number of spans in specified time period t.
5. Contribution Factor:
Popularly, the order of authors on publications indicates their contribution and responsibility. Unless alphabetical order for author list is not followed, then the order of the name of the authors clearly indicates the contribution. When the second author is a mentor, then generally the first author contributes the most and the second author is the driving force intellectually behind the research [21]. As discussed in the introduction section, in a rare number of cases, all authors contributed equally. The contribution factor is the measure of the author’s contribution to the publication. If more than one author is involved in a publication, then it is essential to measure and distinguish the contribution of the main author and his all co-authors. The value of contribution ranges between 0-1. If the author is the only author with no co-author who has assisted, then his contribution is maximum and it is assumed as 1.
If two authors are associated with a paper, then the first author’s contribution is assumed as 0.6 and the second author’s contribution is assumed as 0.4.
If more than two authors are associated in a publication, then the first author’s contribution remains the same as 0.6 and the remaining authors’ contribution is equally divided of value 0.4.
For particular publication, Contribution factor of an-author and is computed as,
Where N = Number of authors associated in a publication
The total contribution of author is computed by using Equation 7.
Where i is s number of publications in which author is active.
This algorithm accepts an author_ name as input whose publication details and performance to be measured. This author information retrieval algorithm comprises the following major steps.
1. DBLP Pre-processing
2. DBLP Partitioning and Visualization
DBLP pre- processing algorithms perform partitioning on bibliographic records and generate the partition of articles published in the span of 5 years along with it generates author vertex having attributes and unique id and publication label using algorithm 2.Based on partition label generated, the specified author is searched for finding its co-author and publication information in all partitions using algorithm 3.
Algorithm 2: Find Authors and Co-Authors Information
Input: DBLP dataset in xml
Output: Partitions of articles published in the span of 5 years, list of authors.
Q = set of quantum’s as {q1, q2, q3… q n } where q i is fixed span of specified successive years, v = main author for publication, v c = co- author of, e= details of tie- up between v and v c , author_ list =Φ
r ← publication record (node)
a ← author in r
y ← Extract year of publication
1.
2.Extract all attributes of r
3.
4.Extract author_name for a
5.a. author_id = unique integer number
6.
7.add a to author_ list
8.Extract y for r
9.Determine partition label l (p) = q i such that q i ∈ Q and q i contains y
10.Add r to graph having label l (p), in form of (v, v c = { vc1, vc2 … v cn } , e)
11.
12.
Algorithm 3: Extract Co-authors (Selected_Author)
Output: co-authors of
1.
2.
3.Set selected_author.publications =Φ
4.
5.
6.
7.add r to selected_author.publications
8.selected_author.publications [r]. co-authors =Φ
9.
10.add a to selected_author.publications[r].coathors[]
11.
12.
13.
14.
15.
Algorithm 4: Author Information Retrieval
Input: Partitions, author_ list, author (author_name) whose details to be searched
Output: Details of Articles published by specified author
1.Accept author_name whose details to be searched (selected_author)
2.Retrieve the id (author_id) of selected_author from authors_list
3.Set selected_author.publication_count = 0
4.Extract_ Coauthors(selected_author)
5.
5.1 compute Cooperativeness
5.2 compute Solidity
5.3 Find yearly publication details
5.4 compute consistency
5.5 compute contribution factor
6.
We have implemented and tested our algorithms on 1 GHz, single-core CPU; 512 MB RAM. Performance of Author Information Retrieval Algorithm is tested on DBLP Bibliographic record data set [17].
DBLP bibliographic record is provided as input to author information retrieval algorithm and results obtained are discussed in further sections.
Author list generation
All unique authors are identified and a unique id is assigned to each author, which is used to represent the author as a vertex while storing a record in a graph. Total 10,37,449 numbers of authors are obtained in the DBLP dataset. Based on Author_ id, author_ name, and span_ of_ quantum are in which the author has published a paper, his/ her publication details are found out. The span in which authors published a paper is called an active span. Table 1 shows the randomly selected authors and their active spans.
List of Authors and Their Active Spans
List of Authors and Their Active Spans
It is noticed that author Umeshwar Dayal is active in 7 spans, author Brian Alspach is active in 9 spans, author Marcus Brazil is active in 5spans and author Paolo Rocchi 5 is active in 5 spans. The count of spans in which author is active or has published the papers is directly proportional to consistency of author. If author’s number of spans is more, then his consistency find increased.
For a particular author, his/her publication record is retrieved. A tie between author and co-author for particular publications is represented in the form of vertices and edges.
Author Umeshwar Dayal whose active spans are shown in Table 1 is selected to find his publication details. Figure 4 shows publications record of an author Umeshwar Dayal represented by the vertex, which is centrally placed and his co-authors are represented as adjacent vertices. Edges between central vertex and adjacent vertices represent interaction (publication details) between author and co-authors as p i , where p i is ith publication of author. It is observed that interactions between co-authors Stefan Krompass, Archana Ganapathi, Janet L. Wiener and Harumi A. Kuno of Umeshwar Dayal having label p1 which indicates that p1 article is published in an association with all of above mentioned co-authors. Likewise his all 11 publications and their respective co-authors can be observed in the Fig. 4. Self-loop represents that no co-author for an author for publication.
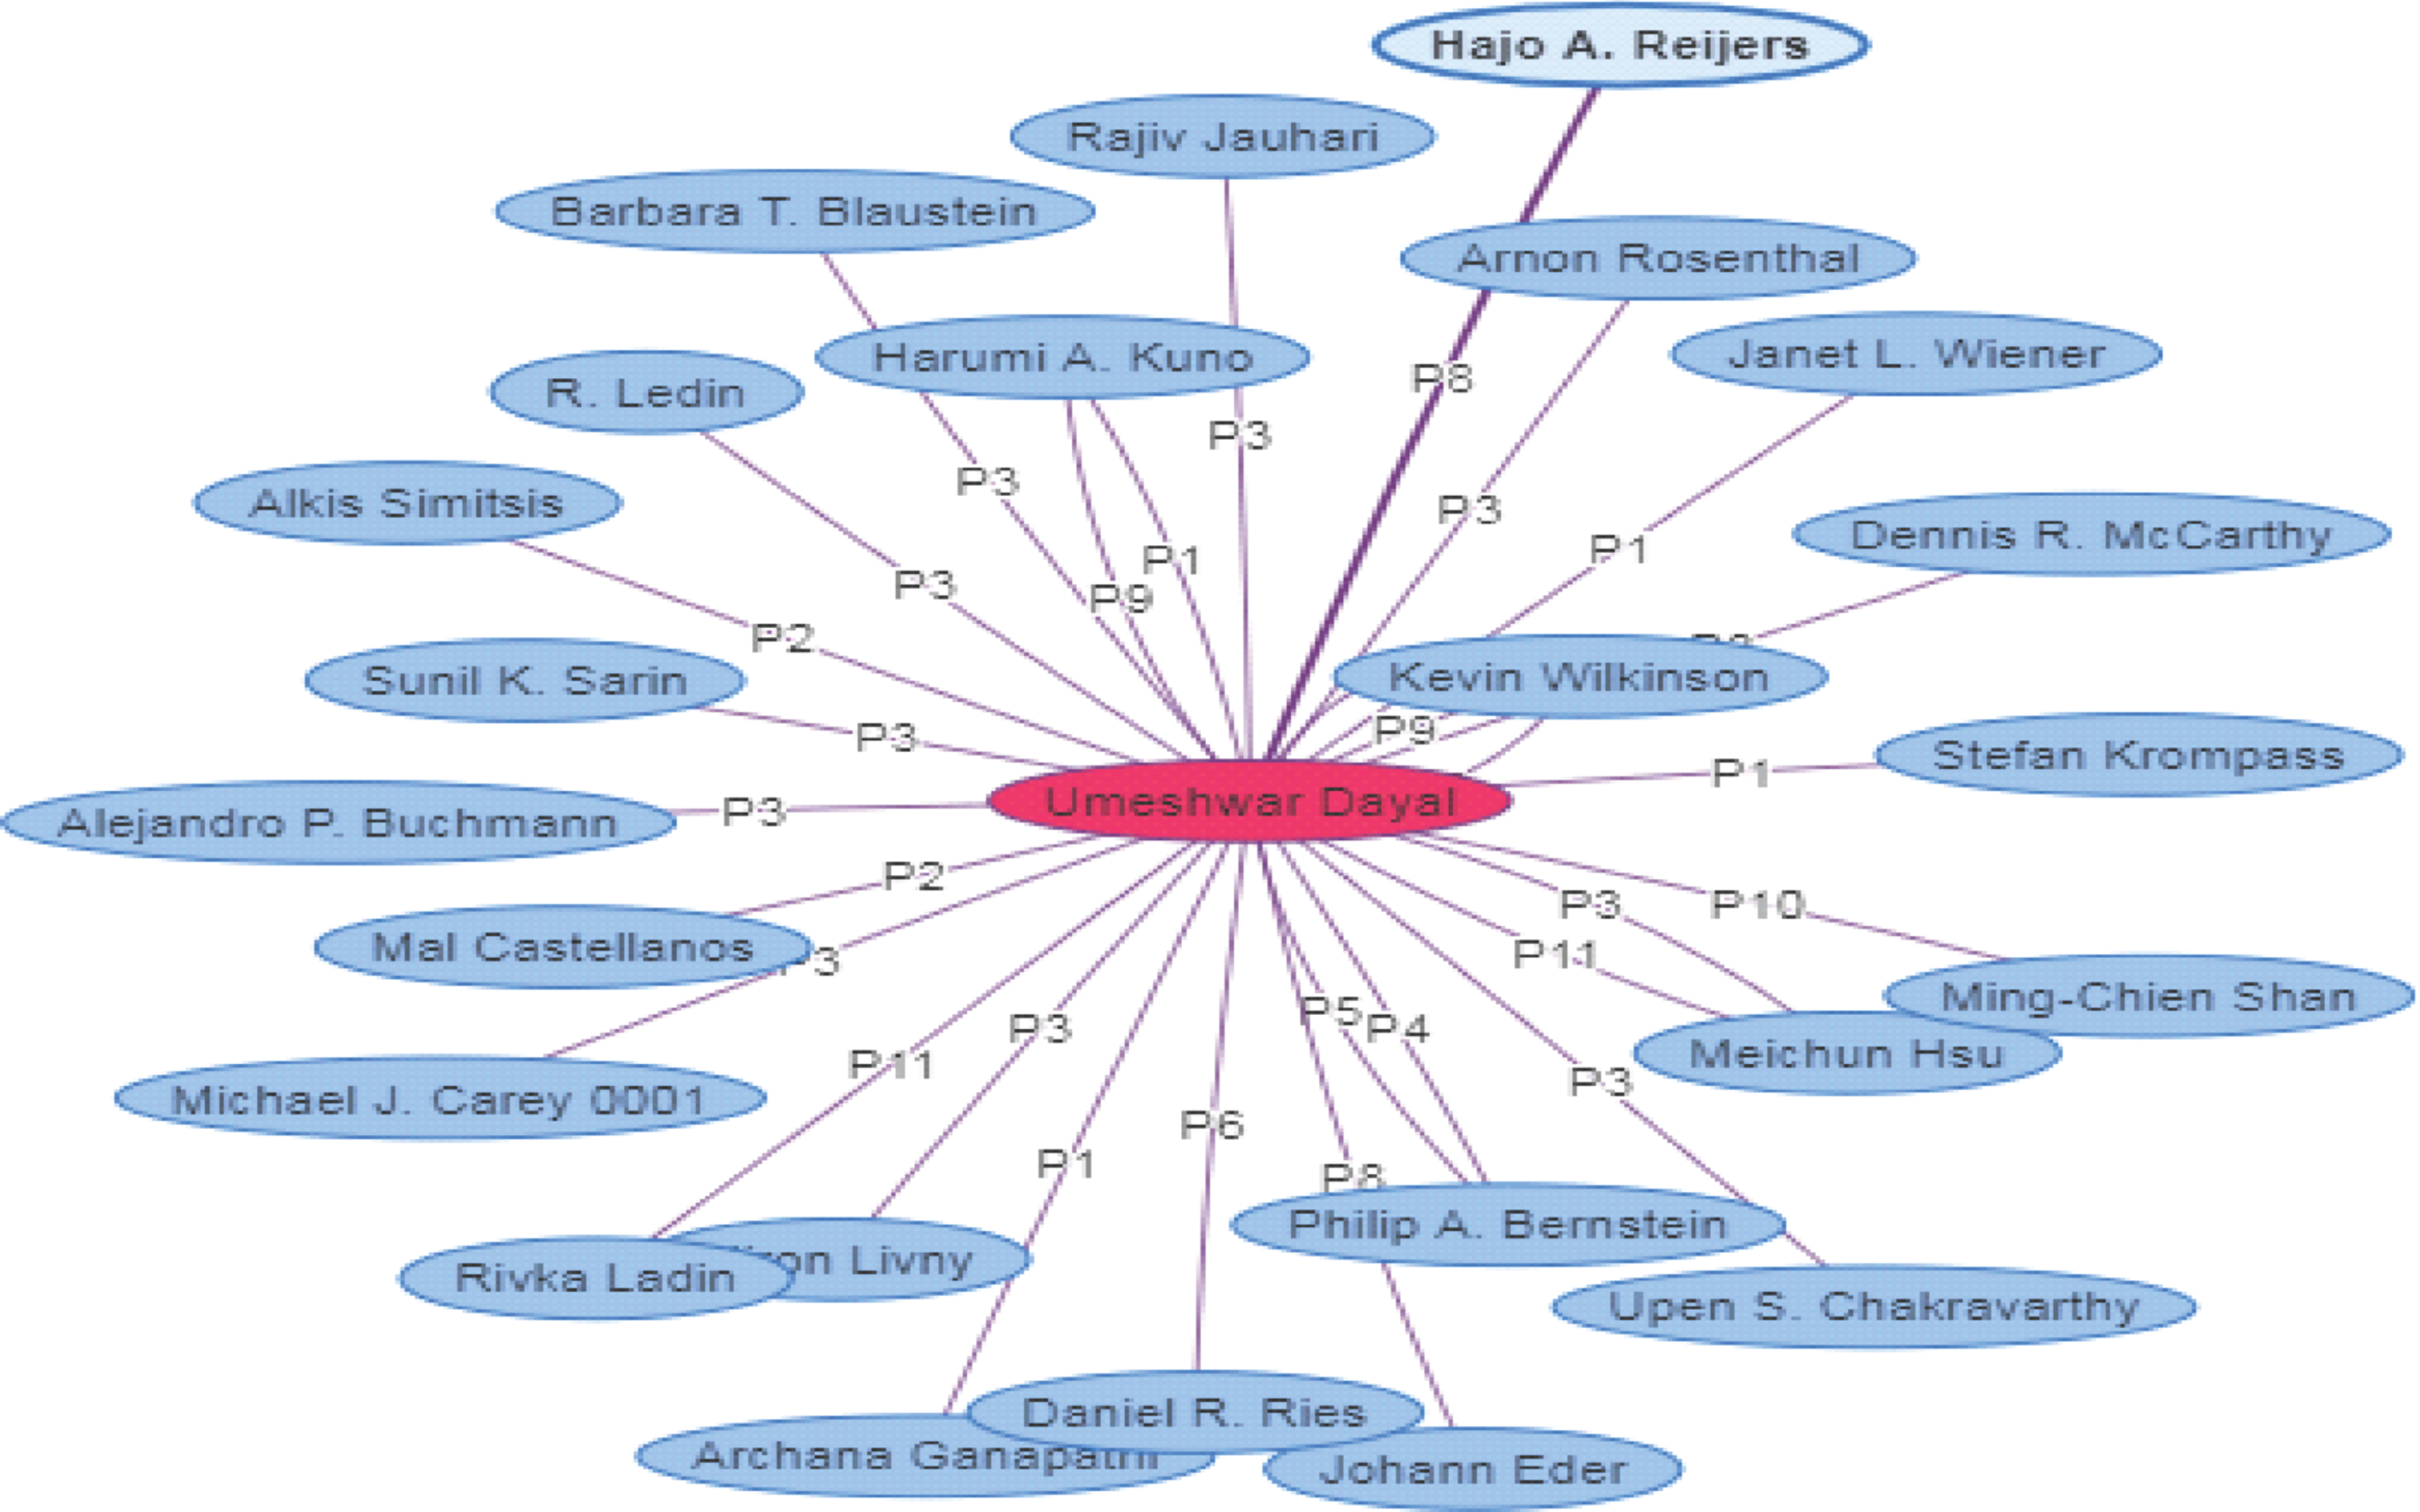
Co Authors of Selected Author: Umeshwar Dayal.
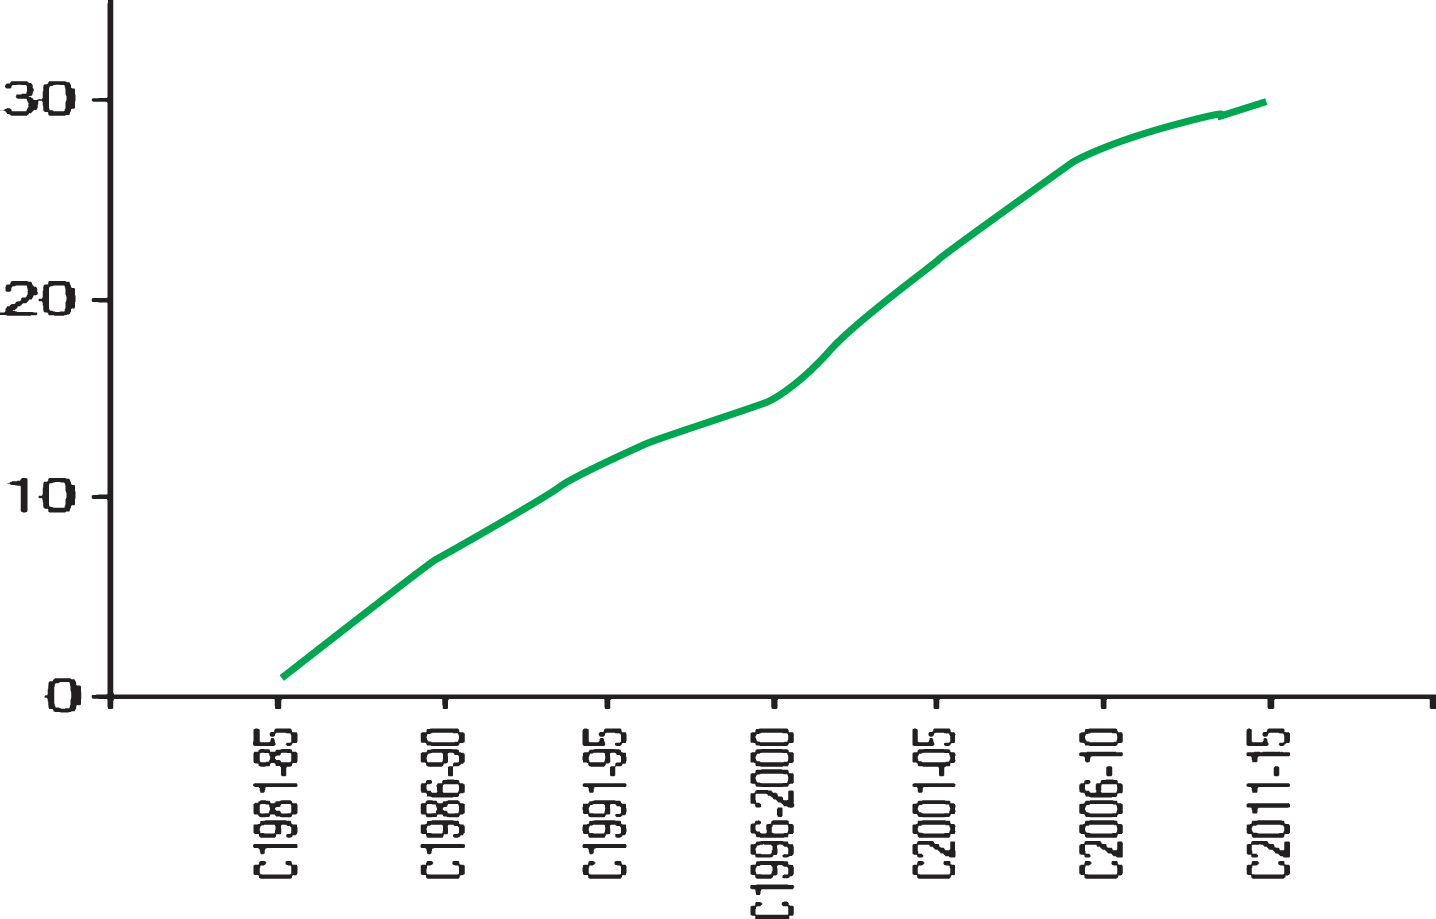
Figure 5 shows a year wise publication graph of an author Umeshwar Dayal. It is observed that his first publication was in the year 1981 with a total 3 publications in the same year and the last publication was in the year 2012.

Year wise Publication details of Selected Author: Umeshwar Dayal.
Figure 6 shows stability graph of Umeshwar Dayal. It reveals that the author is more stable in quantum 2011–15.
Stability of Umeshwar Dayal.
The performance of an author is measured with several parameters like consistency, stability, cooperativeness, solidity and contribution factor. Table 2 shows these parameter values obtained for 25 randomly selected authors. C represents consistency, Cp represents Cooperativeness, S represents solidity and CF represents contribution factor.
Performance Measures of Selected Authors
Performance Measures of Selected Authors
From Table 2, it has been observed that the author H. V. Jagdish, Umeshwar Dayal, Hector Garcia-Mo, lina, Jiawei Han, Sartaj Sahni, and Surajit Chaudhuri. It is noticed that an author Surajit Chaudhuri is greater active spans. Cooperativeness of author H. V. Jagdish is higher among the randomly selected authors. Higher values of cooperativeness indicate that the selected authors co-author are more active for publication. Contribution factor of author Surajit Chaudhuri indicates that the author Sartaj Sahni’s contribution as a main author is greater as compared to the selected authors.
Further co-authors of Umeshwar Dayal are selected one by one, their publication details are retrieved and performance measure values are computed. The performance measure values of all co-authors of Umeshwar Dayal are as shown in Table 3.
Performance Measures of Co- Authors of Umeshwar Dayal
From Table 3, it has been observed that co- author of Umeshwar Dayal, Michael J. Carey has highest consistency, author Philip A. Bernstein has highest cooperativeness.
In the next level, Meichun Hsu is selected for publication information retrieval. His all co-authors publication details are retrieved and performance measure values are computed. Table 3 shows the performance measure of all his co-authors.
Figure 7 shows publications record of an author Meichun Hsu represented by the vertex, which is centrally placed and his co-authors are represented as adjacent vertices. Figure 7 shows that that interaction between co-authors Roel of Vuurboom and Ron Obermarck having label p3 which indicates p p3 article is published in an association with these two authors. Likewise all co-authors interaction with author can be observed.

Publication Record of Selected Author: Meichun Hsu.
Figure 8 shows year wise publication details of selected author Meichun Hsu. Figure 8 indicates that the author’s first publication was in year 1985 and the last publication was in year 1997. Hence his span of publication is 1985–1997.
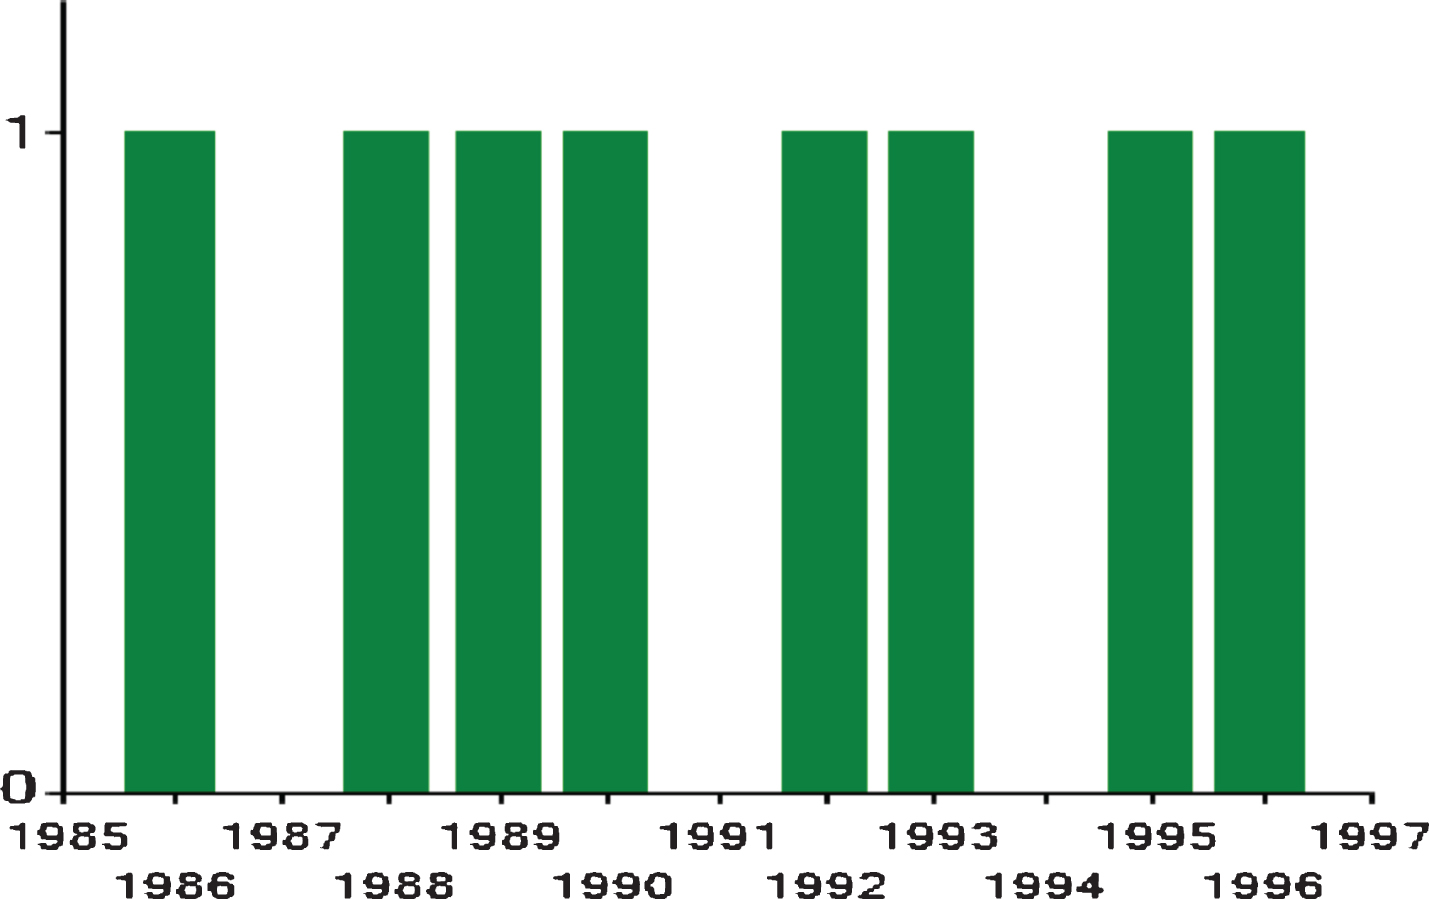
Year wise Publication Details of Selected Author: Meichun Hsu.
Further co-authors of Meichun Hsu are selected one by one, their publication details are retrieved and performance measure values are computed. The performance measure values of all co-authors of Meichun Hsu are as shown in Table 4.
Performance Measures of Co-Authors of Meichun Hsu
From Table 4, it has been observed that, Stuart E. Madnick is a author having has highest consistency, cooperativeness, stability and, contribution factor.
As our study of literature refers, we could not find similar contributing work so as to compare our results with existing. For verification of results, the subjective measure is used. Computation and analysis were shown to the experts and results are evaluated on grades- very accurate, accurate, less accurate, and incorrect. Experts have graded 93% of the author’s analysis as very accurate.
We have presented efficient techniques to retrieve and analyze author-publication information from the DBLP dataset that will help to find author and co-authors and interaction. The visualization tool is applied over the DBLP dataset to analyze the author’s network in bibliographic records and it exhibits correct details of the chosen author including his/her co-authors and publication details. Experimental results reveal that the DBLP processing system retrieves the author’s publication details efficiently and quickly. The retrieval time of authors publication information lies in 6–8 seconds. Consistency and contribution factor is efficiently computed which gives contribution as the main author and as co-authors too. It is observed that an author with good consistency has a good contribution factor too.