
Abstract
The imperfect competition models are equipped by fuzzy set theory with direct assessments of uncertainty. An appropriate point of departure for origination of a system with potentially broader coverage can be provided in view of fuzzy sets. In this way, several extensions of fuzzy set have been introduced to deal with uncertain and ambiguous information including relationships between objects. The q-rung picture fuzzy (q-RPF) model, which inherits the virtues of q-rung orthopair fuzzy set and picture fuzzy set, is one of the convenient way to represent such information. In order to exhibit interactions in various economic structures the conception of q-RPF economic competition graphs can be employed. Thus the intention of present study is to deal with q-rung picture fuzzy competition graphs (q-RPFCGs) and in particular, q-rung picture fuzzy economic competition graphs (q-RPFECGs) with its generalizations: q-RPF k-economic competition graphs; p-economic competition q-RPFGs; and m-step q-RPFECGs through several important results. Furthermore, this paper offers a brief review for perfect and imperfect competition in competitive market structures and sketch q-RPFECGs to represent duopoly, oligopoly, and monopolistic competitions in graph theoretic approach. Also, it designs an algorithm to calculate the strength of economic competition among buyers and sellers in imperfect competitive markets with q-RPF information.
Keywords
Introduction
The decision support systems evaluate competitor’s price and advertising decisions with imperfect judgments. Modern fuzzy uncertainty theory enables an extra natural and straight approach to model uncertainty and vagueness in judgment and behavior of intelligent representatives such as the main suppliers, regulators, unions, clients, and competitors to distinguish an imperfectly competitive environment. The fuzzy set (FS) concept was proposed by Zadeh [52] in 1965. The theory of fuzzy sets since then has become an interesting study zone in various disciplines, like medical science, engineering, social science, signal processing, artificial intelligence, multi-agent systems, computer networks, robotics, and expert systems. Atanassov [9] presented the notion of intuitionistic fuzzy set (IFS) in 1986, as an enlargement of FS, so that information can be captured through two functions, known as membership function α and nonmembership function γ, such that α + γ ≤ 1 . Nevertheless, there is a real situation that we also want to emphasize a neutral part between these two extreme positions. In this way, one more level of freedom has been included in description of IFS. Such a generalization of IFS, known as picture fuzzy set (PFS), was suggested by Cuong [15, 16] in 2013. Cuong and Kreinovich [17] described PFS as a new concept for computational intelligence problems. This concept provides decision makers with an additional opportunity to present unreliable knowledge, which results in a more accurate description of many real issues. Thus PFS has a positive membership function α : P → [0, 1] , negative membership function γ : P → [0, 1] , and neutral membership function β : P → [0, 1] standby α + β + γ ≤ 1, where the difference π = 1 - (α + β + γ) denotes the refusal membership function. Thereby, PFSs can be encouraged whenever the expert’s assessment is of a sort like yes, abstention, no, rejection. This idea has been employed in diverse fields. Garg [19] proposed some picture fuzzy aggregation operators with application to multicriteria decision-making. Khalil et al. [25] defined some operations on interval-valued PFSs and PF soft sets. Son et al. [43] introduced a new fuzzy inference system on PFSs. For other symbols and applications, readers are mentioned [11, 45].
It is noteworthy that the constraint α + γ ≤ 1 in IFS limits the selection of orthopairs from a triangular region. In order to increase the adeptness of IFS, Yager [48] proposed the notion of Pythagorean fuzzy sets (PyFSs) in 2013, which replace the constraint of IFS with α2 + γ2 ≤ 1 . Thereafter, a number of researchers started working on this model. Some remarkable efforts in multi attribute decision making in Pythagorean fuzzy model are performed by Xu and Yager [47], Garg [19] and Akram et al. [5, 6]. It can be noticed that PyFS also limits the selection of orthopairs from unit circular region in first quadrant. In 2017, Yager [49] introduced q-rung orthopair fuzzy sets (q-ROFSs) as a new extension of orthopair fuzzy sets (i.e. IFS and PyFS) which further relieve the constraint of orthopair membership grades with αq + γq ≤ 1 (q ≥ 1) . As q increases, the representation space of allowable orthopair membership grades increases. Yager and Alajlan [51] further discussed approximate reasoning with generalized orthopair fuzzy set. This last extension led many researchers to develop several decision making methods based on q-ROF model. Peng et al. [33, 34] discussed some aggregation operators as well as weighted distance-based approximation (WDBA) algorithm for q-ROFSs. Garg and Chen [20] defined MCGDM based on neutrality aggregation operators of q-ROFSs. For other notations and applications readers are referred to [28–30, 46].
Analogous to the interpretation of IFS, the notion of PFS turns out that its constraint limits the choice of triplet. To conquer this problem, a mathematical model has been developed to manage multiple systems with wide-range uncertainty elements, known as q-RPF model. The q-rung picture fuzzy set (q-RPFS), proposed by Li et al. [27], have given strength to the idea of PFS in the same manner as Yager’s q-ROFS strengthen the IFS and PyFS. To assigning three degrees of membership to elements, it offers much lighter constraint α (x) q + β (x) q + γ (x) q ≤ 1 (q ≥ 1) , showing that this model provides more stronger model ability, more flexibility, freedom, and sophistication for system modelers in representing their understanding of concepts.
Modern science and technology is characterized by complex deals and phenomena involving interactions between entities. The origin of graph theory can be found in Euler’s work on the Königsberg bridges problem in 1736 . In 1968, Cohen [14] proposed competition graphs with reference to ecological issues. The competition graph of a digraph
Many applications of fuzzy set theory reported in the literature are related to economics by several degrees. These incorporate, fuzzy preference theory, fuzzified techniques in operations research, fuzzy games, and some problem zones of fuzzy decision making. An early source on the use of fuzzy set theory in economics is the book by Billot [10] in 1972. Another book on applications of fuzzy theory in economics is compiled by Ponsard [35] in 1986. Businessmen, politicians, journalists, and consumers are always talking about the market. In economics, markets are centrepiece of analysis. Microeconomics studies the individual company and consumer’s interactions and behavior, and consequently asserts how industries and markets work and emerge. An important topic of microeconomics is the competitive market structure, where the interactions between buyers and sellers may not be realistically modeled, whenever, a large number of companies compete with each other for differentiated products in terms of brand and quality. Arnold et al. [8] studied the competitive supply behavior with fuzzy price information. Schott and Whalen [42] explored the concept of fuzzy uncertainty in imperfect competition. Alternative approaches to view these economic competitions are by graph theoretical methods. Due to increasing importance of competitive markets in economics, this study mainly focuses on q-RPFECGs. The concept of q-RPFGs are recently introduced by Akram and Habib [2] along with its geometrical interpretation. Akram et al. further discussed these graphs in [3]. While dealing with interactions between buyers and sellers, it can be seen that buyers may have positive, neutral, and negative associations towards different products. Thus to overcome such cases, the practical implication for the need for q-RPFCGs arises.
In the present study, an effort is made to explain the notion of q-RPFCGs and specifically, q-RPFECGs. It also defines some well known extensions of q-RPFCGs and q-RPFECGs through several important results. Most of all, our current research reveals an incentive approach to imperfectly competitive markets by exploring the strength of economic competition of producers in duopoly, oligopoly, and monopolistic competition environments. Finally, an algorithm is developed to drew out q-RPFECGs and to calculate the strength of economic competition.
Preliminaries
This section provides a review of q-RPFSs and q-RPFGs. Meanwhile, it defines some basic concepts needed for further development.
Its geometrical interpretation is displayed in Fig. 1.
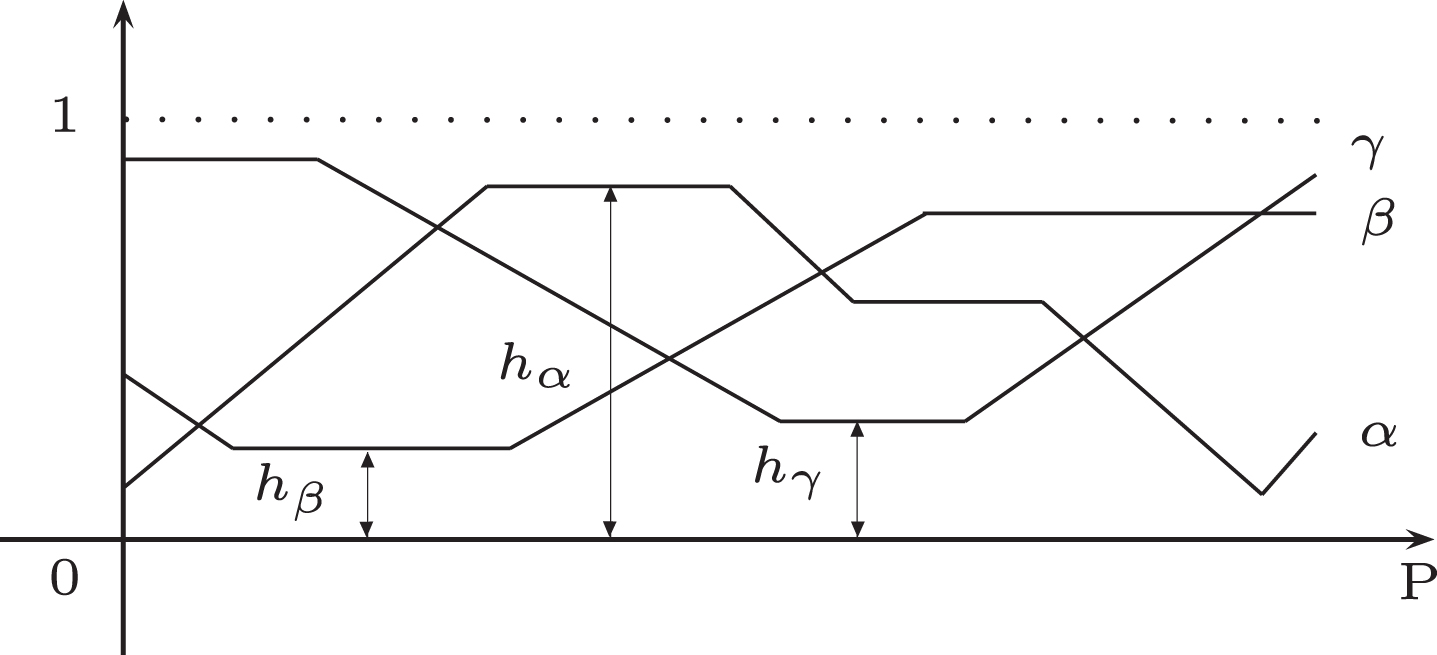
Geometric representation of height of a q-RPFS.
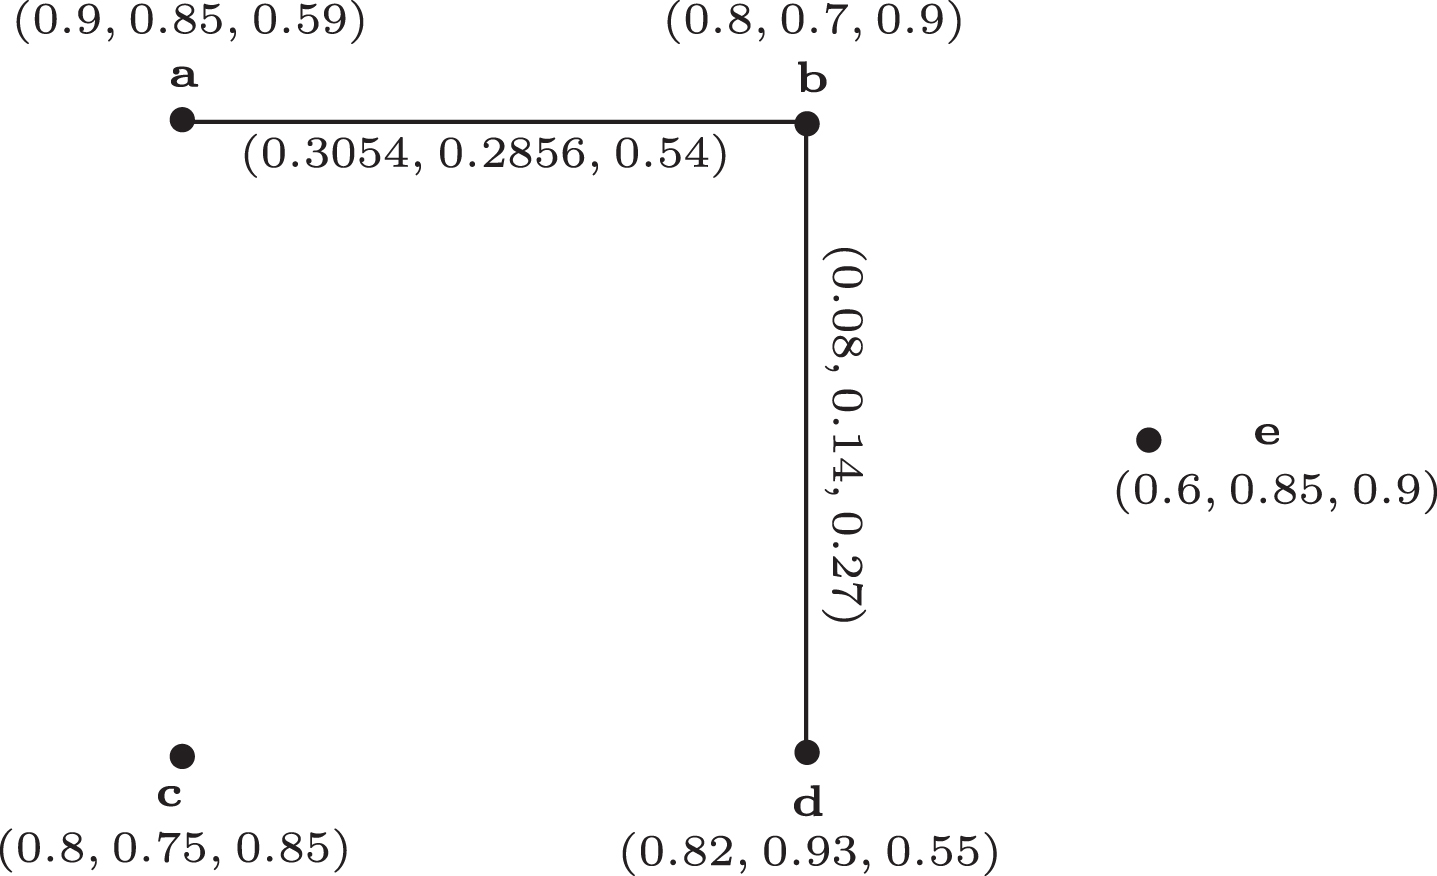
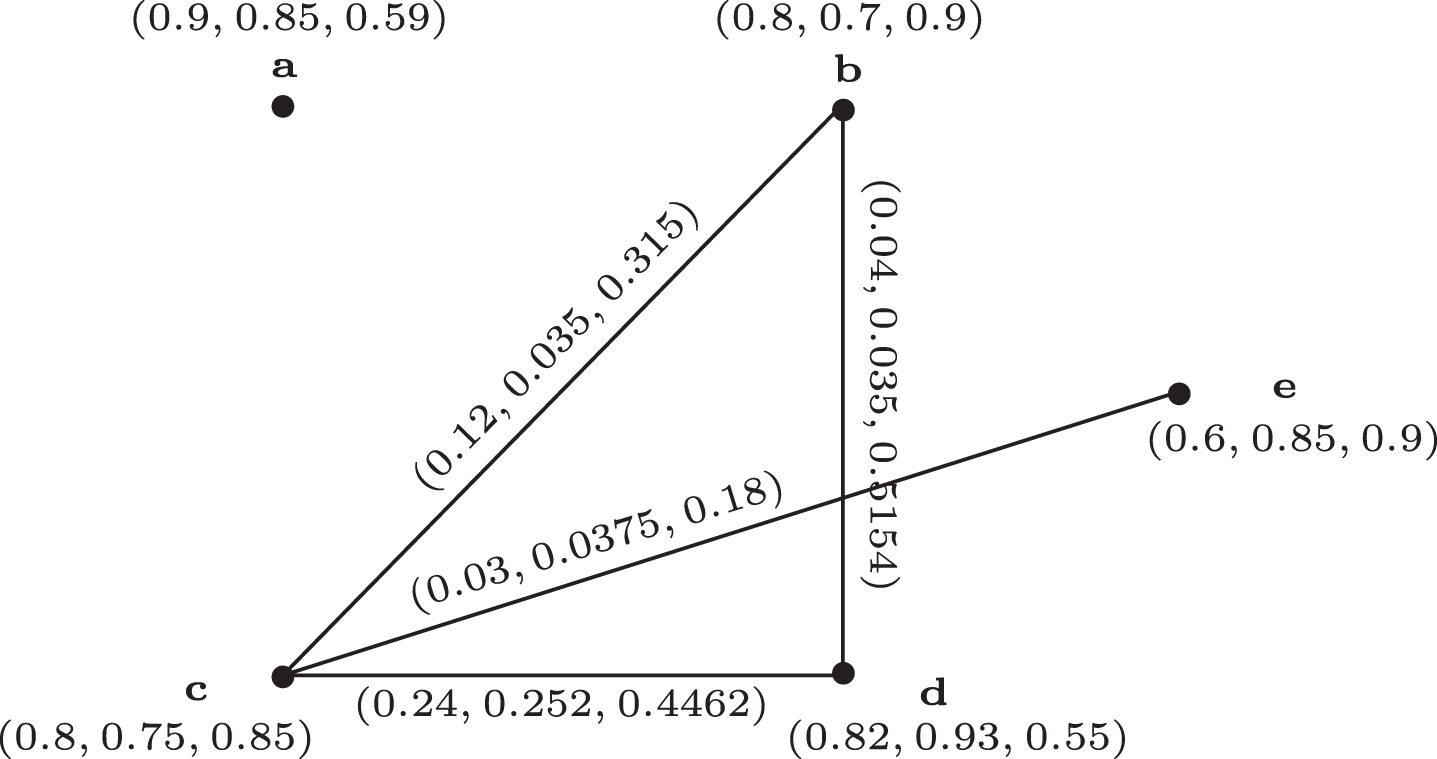
The importance of economic competition graphs can be seen by assuming that three projects are running at some of the five institutions (see Fig. 2). Keep in mind that if two institutions are under a particular project, there will be competition between them. This competition can be shown by the graphs of the corresponding economic competition involving the concept of in-neighbourhoods.
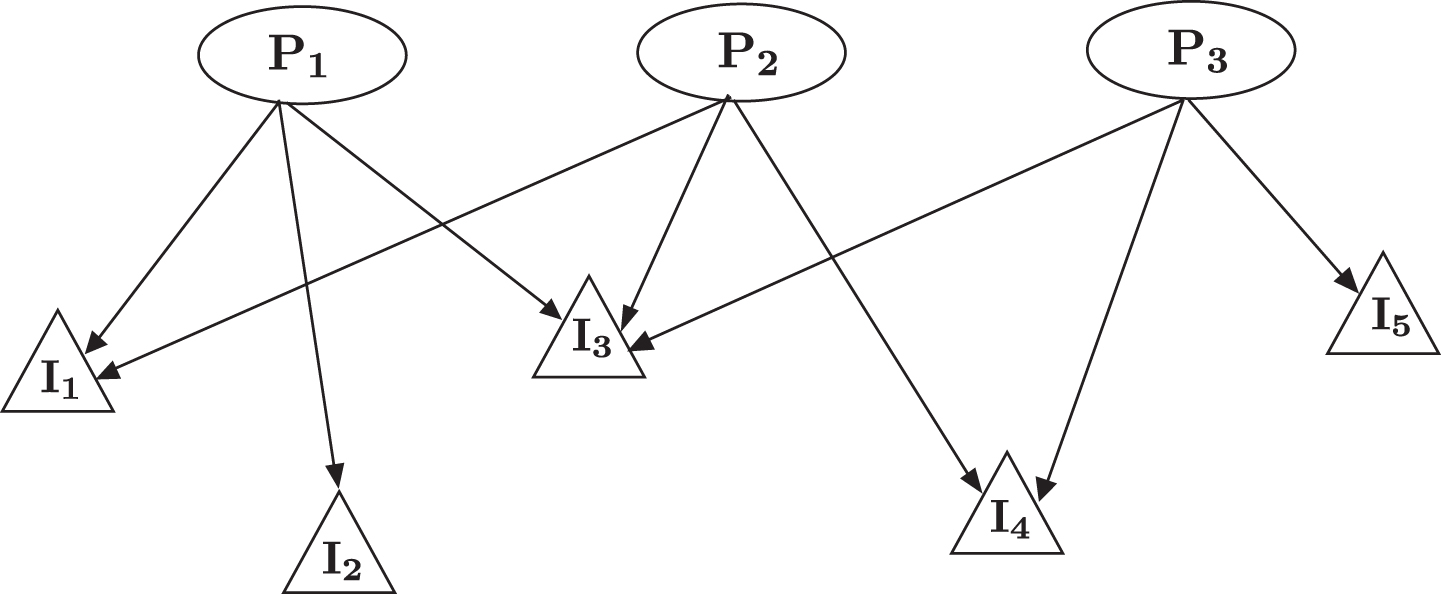
Institutions under projects.
This concept can mainly be used in a highly competitive market structure, where a market is a collection of buyers and sellers who determine the price of a product or product set through real or potential interactions.
In most realistic scenarios, fuzzy vertices and edges of fuzzy competition and fuzzy economic competition graphs may not sufficient to explore various types of species or preys; projects or institutions; for instance, animals are adapted to enhance their ability to be successful predators by using sharp teeth, claws, or jaws i.e., if the tiger wants to use claws to partially rip off his goals, he must has positive associations, neutral associations and negative associations with the use of claws. Similarly, in market structures, the buyers may have positive, neutral and negative comments towards different products/brands. In order to overcome such cases, it is necessary to extend the fuzzy set. The q-RPF model can handle such vague situations in a wide manner. Since the q-RPFS assigns three degrees of membership to elements with much lighter constraint α (u) q + β (u) q + γ (u) q ≤ 1 . Therefore, it is a good model for capturing inaccurate and inconsistent data. Thus the uncertainty associated with the both phases of the species or the interaction between buyer and seller can be translated in a broader way under this model. This fact encourages the need for q-RPFCGs and q-RPFECGs.
Before discussing q-RPFCGs, we first define q-RPF out and in-neighbourhoods of vertices.

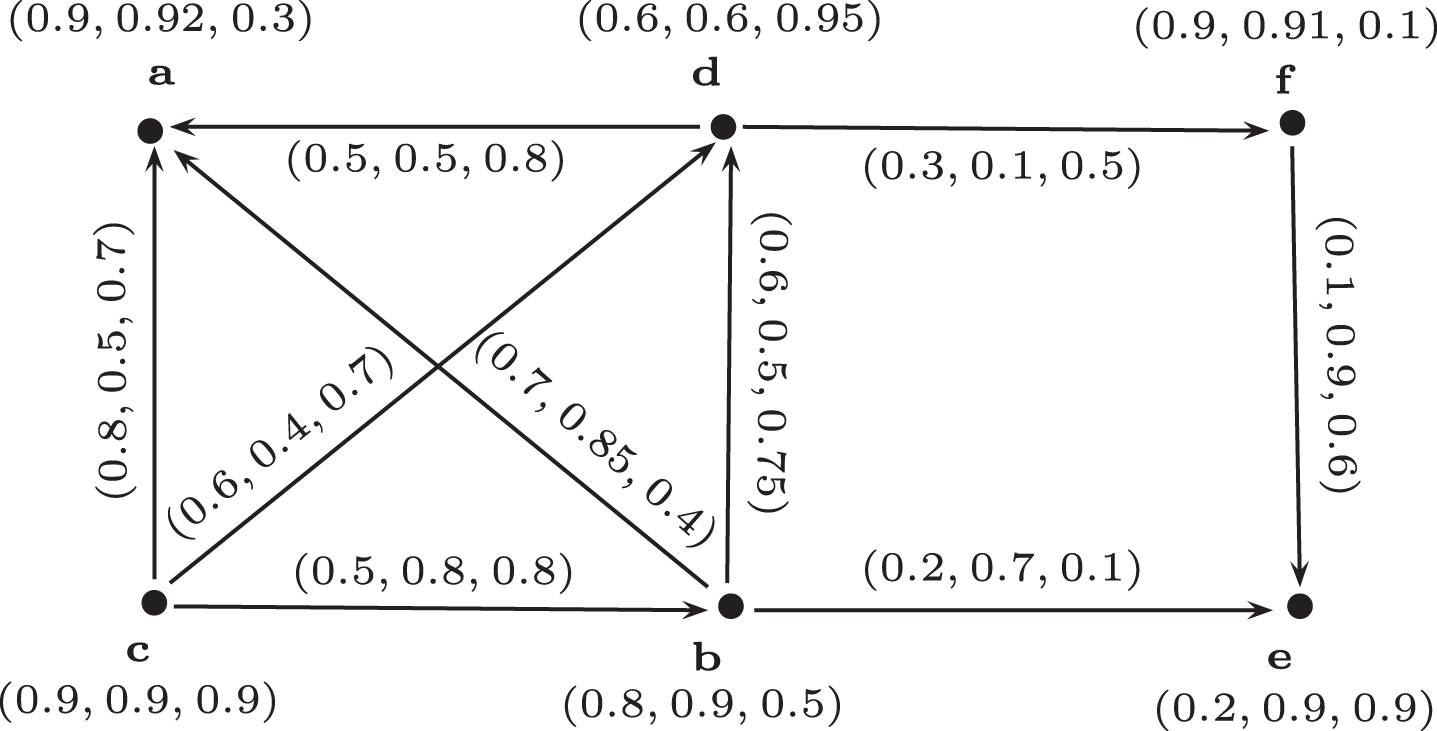
A 6-RPF digraph.
The 6-RPF out-neighbourhoods of vertices of
The next interesting concept is the generalization that inspires our analysis.
A 6-RPFCG.
A 6-RPFECG.
If |Supp (mathdsN+ (u) ∩ mathdsN+ (v)) |=1, then the edge uv of
If |Supp (mathdsN- (u) ∩ mathdsN- (v)) |=1, then the edge uv of
The proof of statement (1) follows the same steps.□
If we intend to improve the state of art of describing q-RPFCGs, we have to discuss some well-known extensions of competition graphs with q-RPF information given as follows.
The corresponding 6-RPF 0.4-competition graph
A 6-RPF 0.4-competition graph.
The corresponding 6-RPF 0.55-economic competition graph
A 6-RPF 0.55-economic competition graph.
The next theorem develops a condition for strong edge of q-RPF k-competition and k-economic competition graphs.
If h
α
(mathdsN+ (u) ∩ mathdsN+ (v)) = h
β
(mathdsN+ (u) ∩ mathdsN+ (v)) = h
γ
(mathdsN+ (u) ∩ mathdsN+ (v)) =1, |mathdsN+ (u) ∩ mathdsN+ (v) |
α
> 2k, |mathdsN+ (u) ∩ mathdsN+ (v) |
β
> 2k, and |mathdsN+ (u) ∩ mathdsN+ (v) |
γ
< 2k, then the edge uv is independent strong in
If h
α
(mathdsN- (u) ∩ mathdsN- (v)) = h
β
(mathdsN- (u) ∩ mathdsN- (v)) = h
γ
(mathdsN- (u) ∩ mathdsN- (v)) =1, |mathdsN- (u) ∩ mathdsN- (v) |
α
> 2k, |mathdsN- (u) ∩ mathdsN- (v) |
β
> 2k, and |mathdsN- (u) ∩ mathdsN- (v) |
γ
< 2k, then the edge uv is independent strong in
The proof of statement (1) follows the same steps. □
The concept of p-competition graphs was firstly defined by Kim et al. [26]. We next propose the definition of p-competition q-RPFG, which is common to other models of fuzzy graph theory.

A 2-competition 6-RPFG.

A 2-economic competition 6-RPFG.
Another important generalization, called m-step competition graphs, was first analyzed by Cho et al. [13]. Now we proceed towards m-step q-RPF out and in-neighbourhood of vertices, which are defined as a pre-requisite of the definitions of m-step q-RPF competition and economic competition graphs.
An 11-RPF digraph.
The 2-step 11-RPF out-neighbourhoods of vertices of

A 2-step 11-RPFCG.

A 2-step 11-RPFECG.
Let
The proof of (1) is similar to (2) . □
To cope with various economic competitions, we now proceed to define the strength of q-RPF buyer in a market structure, which will be used subsequently in our applications with synthetic data.
The strength of q-RPF buyer b, measured by the mappings r1 : P → [0, 1] , r2 : P → [0, 1] , and r3 : P → [0, 1], is defined by (r1 (b) , r2 (b) , r3 (b)) such that
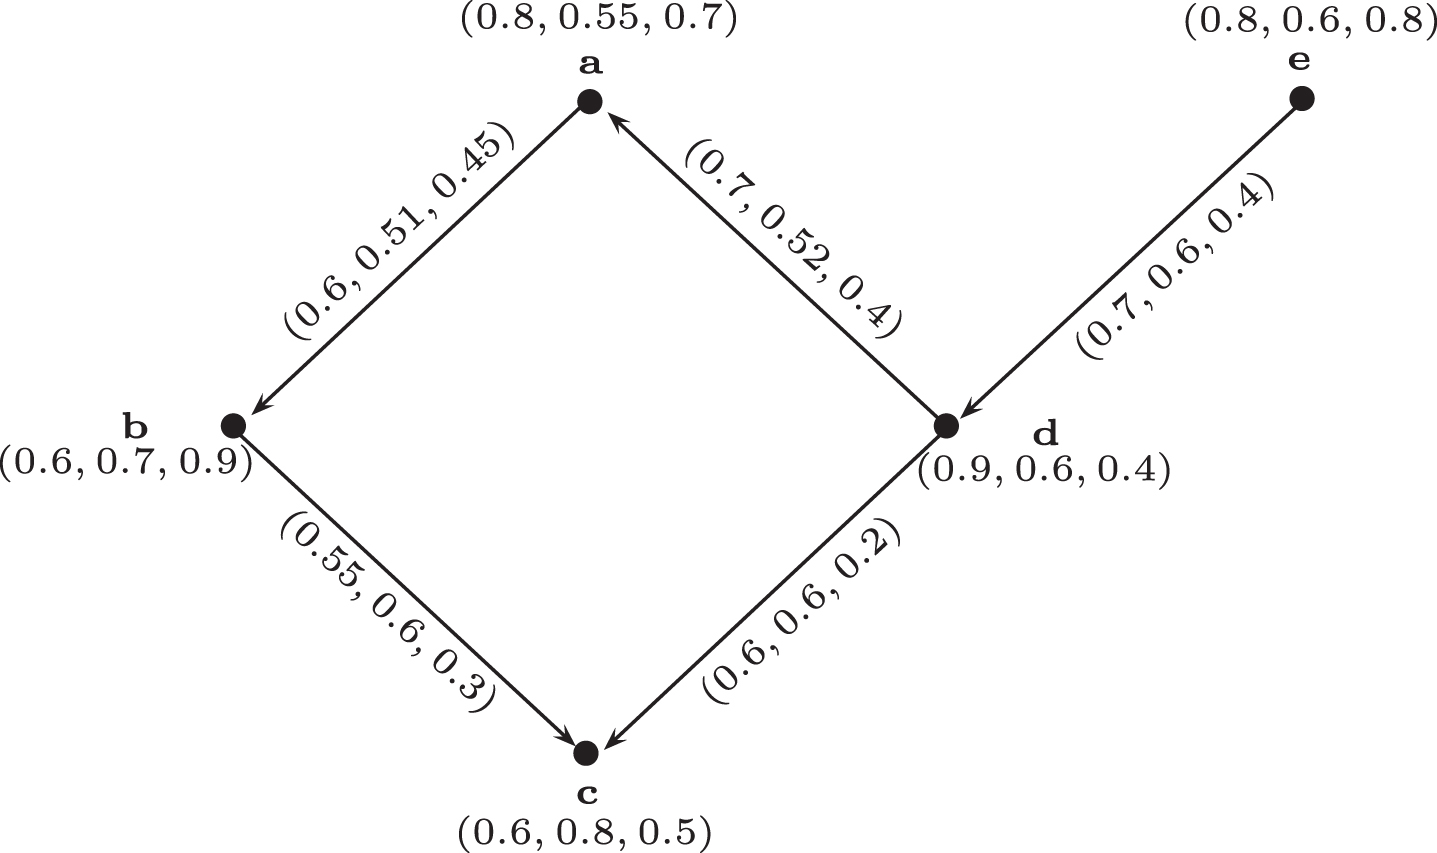
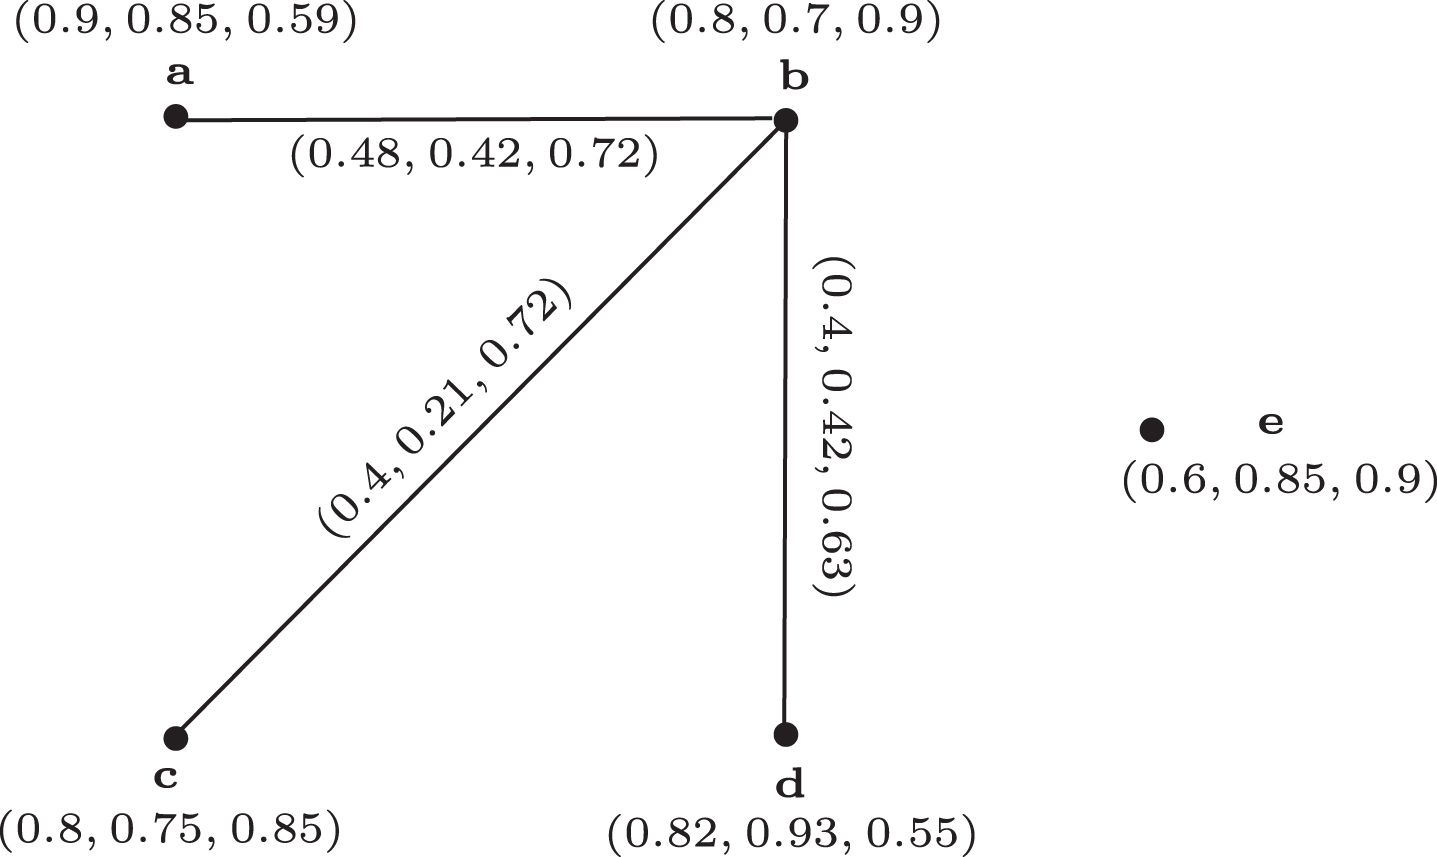
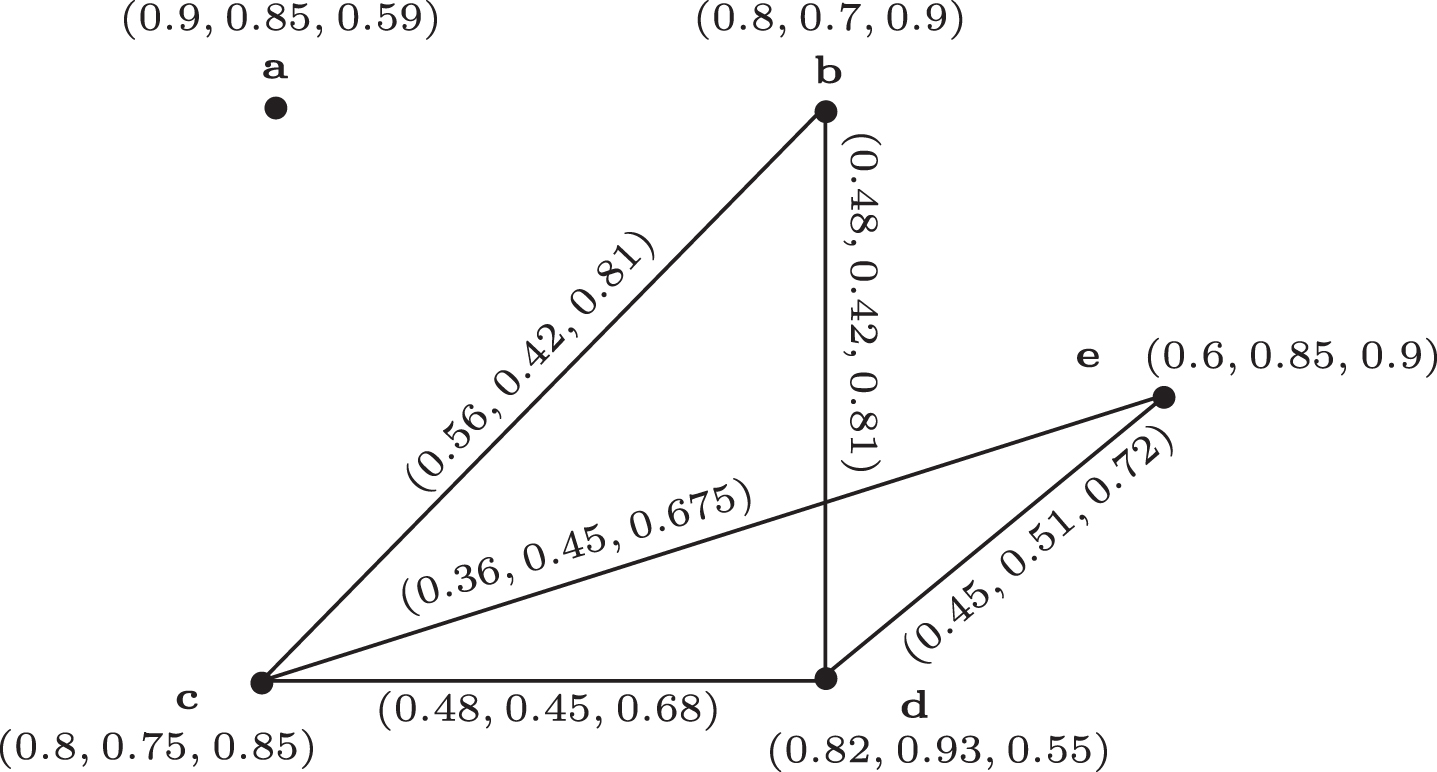
A 5-RPF digraph.
We observe that
Businessmen, politicians, journalists, and consumers are always talking about the market. However, whereupon they mean through the word market, there is ambiguity or misleading. In economics, markets are centrepiece of analysis. Microeconomics studies the individual company and consumer’s interactions and behavior, and consequently asserts how industries and markets work and emerge. Figure 14 depicts the competition in market structure.
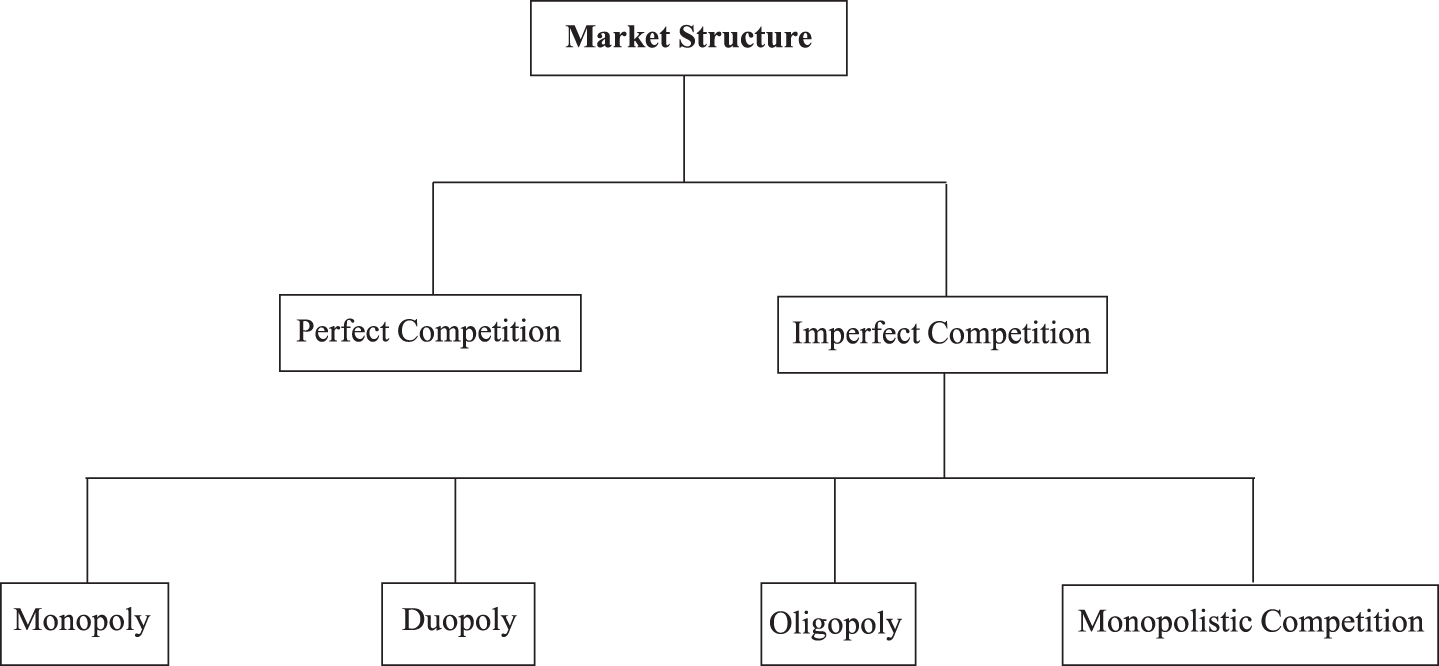
Competitive market structure.
A market with a large number of buyers and sellers is called a perfectly competitive market so that no buyer or seller has a considerable influence on price. Many agricultural markets are quite similar to be perfectly competitive. As an example, thousands of farmers produce wheat, which was purchased by thousands of buyers to produce flour, and other products. Accordingly, neither a farmer nor a buyer can have a substantial impact on wheat prices alone. Other markets, including a few producers, may still be processed as competitive for analytical purposes. For instance, the airline industry in the United States includes dozens of companies, but most of the routes are handled by just a few companies. Nevertheless, the competition between those companies is often ferocious, so the airline market can be regarded as competitive for some purposes. Examples of perfect competition incorporate: stock markets, currency markets, farming organization etc.
Imperfect Competition
In economic theory, imperfect competition does not display all the features of competitive markets, but it is a kind of market structure that exhibits some of their characteristics. Imperfect competitive structures are where there may be a lot of sellers and producers, but they sell different goods and services. In an imperfect market, the people who call the shots are many times more likely to abuse their power.
There are four major forms of imperfect competition.
Monopoly
Monopoly is another extreme of perfect competition. A monopoly is a market consists of only one seller, however, it contains numerous buyers. As the only producer of the product, a monopolist is at the vantage point. If he has made a decision to elevate the price of the product, it does not has to distress about competitors who are charging less prices. Hence the monopolist in the market, has complete control over the amount of production imparted for sale. Real world examples of monopolies include: Energy companies, like Con Edison; computer programming companies, like Microsoft; a government agency of Pakistan, like WAPDA etc.
Markets in which two or more than two firms compete with one another are far more usual. We next examine the market structures other then monopoly that can enhance the monopoly power. The interactions between buyers and sellers in such structures can be well expressed by q-RPF digraphs in order to deal with wide range of uncertain and vague information. The corresponding q-RPFECGs offer an alternative view to detect the strength of competition among producers, where the vertices indicate the powers of buyers and producers in a market and edges interpret the interactions between them.
Duopoly
Duopoly is a simplest model in which two firms compete each other. Therefore, each firm has only one competitor to consider in making its decision. A number of examples for duopoly competition can be seen in real world scenarios such as: Airbus and Boeing, in the market for huge commercial airplanes; visa and master card; coca cola and pepsi etc. The duopoly competition provides a simplest example for economic competition graphs as follows.
The competition within Airbus and Boeing has been described as duopoly in the big jet airliner markets. This is due to a series of mergers in the global aerospace industry, with Airbus starting as a European consortium and American Boeing absorbing its former arch-rival. Other manufacturers, like Lockheed Martin and Convair in US and British Aerospace and Fokker in Europe, can no longer compete and efficiently withdraw from this market. Consider the set of aircraft manufacturers {Airbus, Boeing} which are competing for the set {Passenger} . The 5-RPF digraph displayed in Fig. 15 well translate the interactions between passenger and aircraft manufacturers.

A 5-RPF digraph for duopoly competition.
In Fig. 15, the membership grades assigned to the manufacturers depict positive, neutral, and negative extent of their productivity in the market and for passenger, it represents his respective powers. While the triplets assigned to the arcs shows the passenger’s positive influence, neutral influence, and negative influence towards manufacturers. The 5-RPF in-neighborhoods of aircraft manufacturers are displayed in Table 1.
5-RPF in-neighborhoods of aircraft manufacturers
The 5-RPFECG can be constructed to investigate the strength of economic competition between manufacturers, where the edge connecting the Airbus and Boeing underlines that both manufacturers are competing for a Passenger with 0.243% positive associations, 0.01048576% neutral associations, and 4.59165024% negative associations. The corresponding 5-RPFECG as a duopoly competition model is displayed in Fig. 16.

A 5-RPFECG for duopoly competition.
Table 2 gives the strength of competition between manufacturers for passengers with q-RPF information. It can be observed that Boeing has greater strength of economic competition as compared to Airbus for their common passenger. Thus we conclude that in the opinion of passenger, Boeing is the best facilitated travel along with suitable price and hence the passenger will prefer Boeing instead of Airbus.
Strength of economic competition of aircraft manufacturers for passenger
Oligopoly is widespread shape of market structure. Oligopolistic competitive market is a market where only a few firms compete and the entry of new firms are blocked. Examples of oligopolistic industries involve automobiles, steel, aluminum, electrical equipment, petrochemicals, computers, smart phones etc. The products produced by firms may be differentiated as in the case of automobiles, or they may not as with steel. In the oligopolistic market, at least some product differentiation is often seen. Market share is determined not only by price, but also by differences in product design, performance, and durability of each company. In such situations, it is self evident for companies to compete by choosing prices instead of quantities. For instance, automotive companies see price as a basic strategic entity, and every one chooses its own price with its competitors back to the head. The cost-effectiveness in oligopolistic environment rely in part on how the companies interact as if the interaction is more cooperative than competitive, the enterprise can claim a price that far exceeds the marginal cost and gain significant profits. This can also be easily seen by calculating strength of competition in their corresponding q-RPFECGs. To understand oligopoly competition model in graph-theoretic way, consider the following example.
The US auto industry is an excellent example of oligopoly. It mainly consists of three major companies, general motors (GM), Ford, and Chrysler. The impact of this oligopoly can be considered on the price and development, and insertion of recent car models in the US car market. How did the American auto industry develop it, and how consumers and producers interact in the automobile markets. To show such interactions we design a 6-RPF digraph in which the set of auto industries {GeneralMotors, Ford, Chrysler} is competing for the set of customers {Buyer1, Buyer2} as displayed in Fig. 17.

A 6-RPF digraph for oligopoly competition.
In Fig. 17, the triplets assigned to the vertices and arcs can be translated by means of 6-RPF analysis. For instance, the degree of existence of Ford is 53.1441%, degree of neutrality to be exist is 4.6656%, and 0.4096% it has degree of non-existence in competitive market structure. While the membership grades of arcs show the passengers positive, neutral, and negative influence towards industries. The 6-RPF in-neighborhoods of automobile industries are displayed in Table 3.
6-RPF in-neighborhoods of auto industries
The 6-RPFECG can be constructed to investigate the strength of economic competition between auto industries, where the edge connecting Ford and Chrysler underlines that both industries are competing for Buyer 2 (denoted by dotted lines) with 0.5489% positive, 0.000298% neutral, and 26.2144% negative associations, approximately. The corresponding 6-RPFECG as an oligopoly competition model is displayed in Fig. 18.
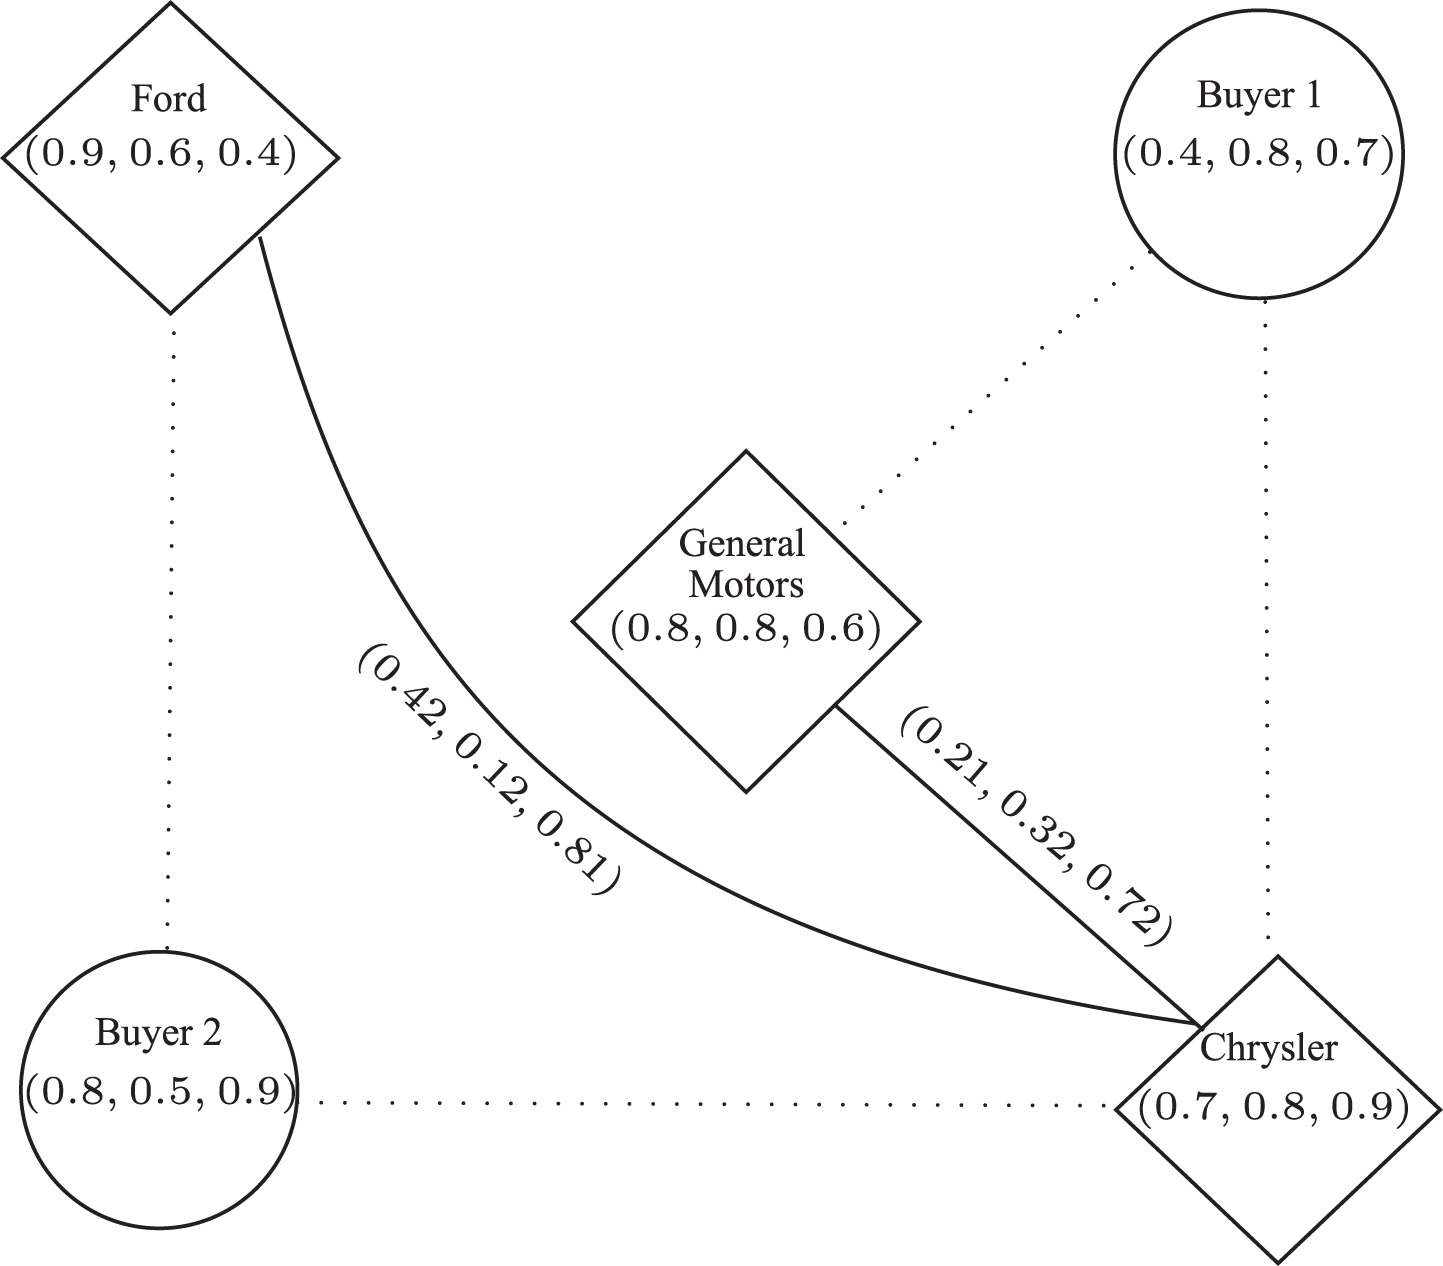
A 6-RPFECG for oligopoly competition.
Table 4 gives the strength of economic competition between industries with q-RPF information. It is easy to observe that General Motors will compete for buyer 1 and Ford will compete for buyer 2, due to their greater values of strength as compared to their competitors.
Strength of economic competition of auto industries for customers
A monopolistic competitive market is similar to a perfectly competitive market in two central aspects: There are many companies, and entry by new companies is not confined. However, it differs from perfect competition in the sense that products are differentiated, i.e., each company sells products of different brands or versions with different quality, appearance, or reputation, and each company is the only manufacturer of its own brand. There are many examples of monopolistic competition industries, like, Shampoo, soap, toothpaste, packaged coffee, laundry detergents, soda industries, furniture companies, and restaurants. Many other products in drugstores are sold in monopolistic competitive markets. Products are differentiated in many of these industries. For some reason, consumers regard each company’s brand as different from other brands. For example, crest toothpastes are sensed better from colgate, aim, and other toothpastes. The differences are somewhat flavor, consistency, reputation, and the customer image of the relative anti-corrosion effect of crest. Ultimately, some customers will pay beyond for crest. To assess the power of competition between different brands, consider the following example.
There are several brands of shampoo in market. These companies mutually compete by diverse packaging, vitamins, scent, product characteristics, and other tricks to make buyers distinguish among competitive products. Consider the set {Karastase, Suave, Neutrogena, Garnier, Pantene, Aveeno, Nexxus, Sunsilk, Redken, Giovanni} of top 10 shampoo brands in the world, which are competing for some of the 6 customers in the set {B1, B2, B3, B4, B5, B6}. The 7-RPF digraph in Fig. 19 interprets the interactions between customers, and shampoo industries in monopolistic competitive environment.

A 7-RPF digraph for monopolistic competition.
By means of 7-RPF analysis of digraph in Fig. 19, we observe that Pantene has 69.83372961% positive extent of productivity, 20.97152% neutral extent of productivity, and 0.00001% it has negative extent of productivity in market structure. While the membership grades of buyers represent their respective powers, and the triplets assigned to the arcs tell about positive, neutral, and negative influences of buyers towards shampoo brands. The 7-RPF in-neighborhoods of shampoo brands are displayed in Table 5.
7-RPF in-neighborhoods of shampoo brands
To show that which brand is more powerful in 7-RPF digraph, its 7-RPFECG can be constructed. It can be observed that the edge connecting Nexxus and Sunsilk underlines that both brands are competing for B5 (shown by dotted edges) with 0.02187% positive, 0.03436% neutral, and 10.30613% negative associations. Similar investigations can be considered for other edges. The corresponding 7-RPFECG as a monopolistic competition model is displayed in Fig. 20.
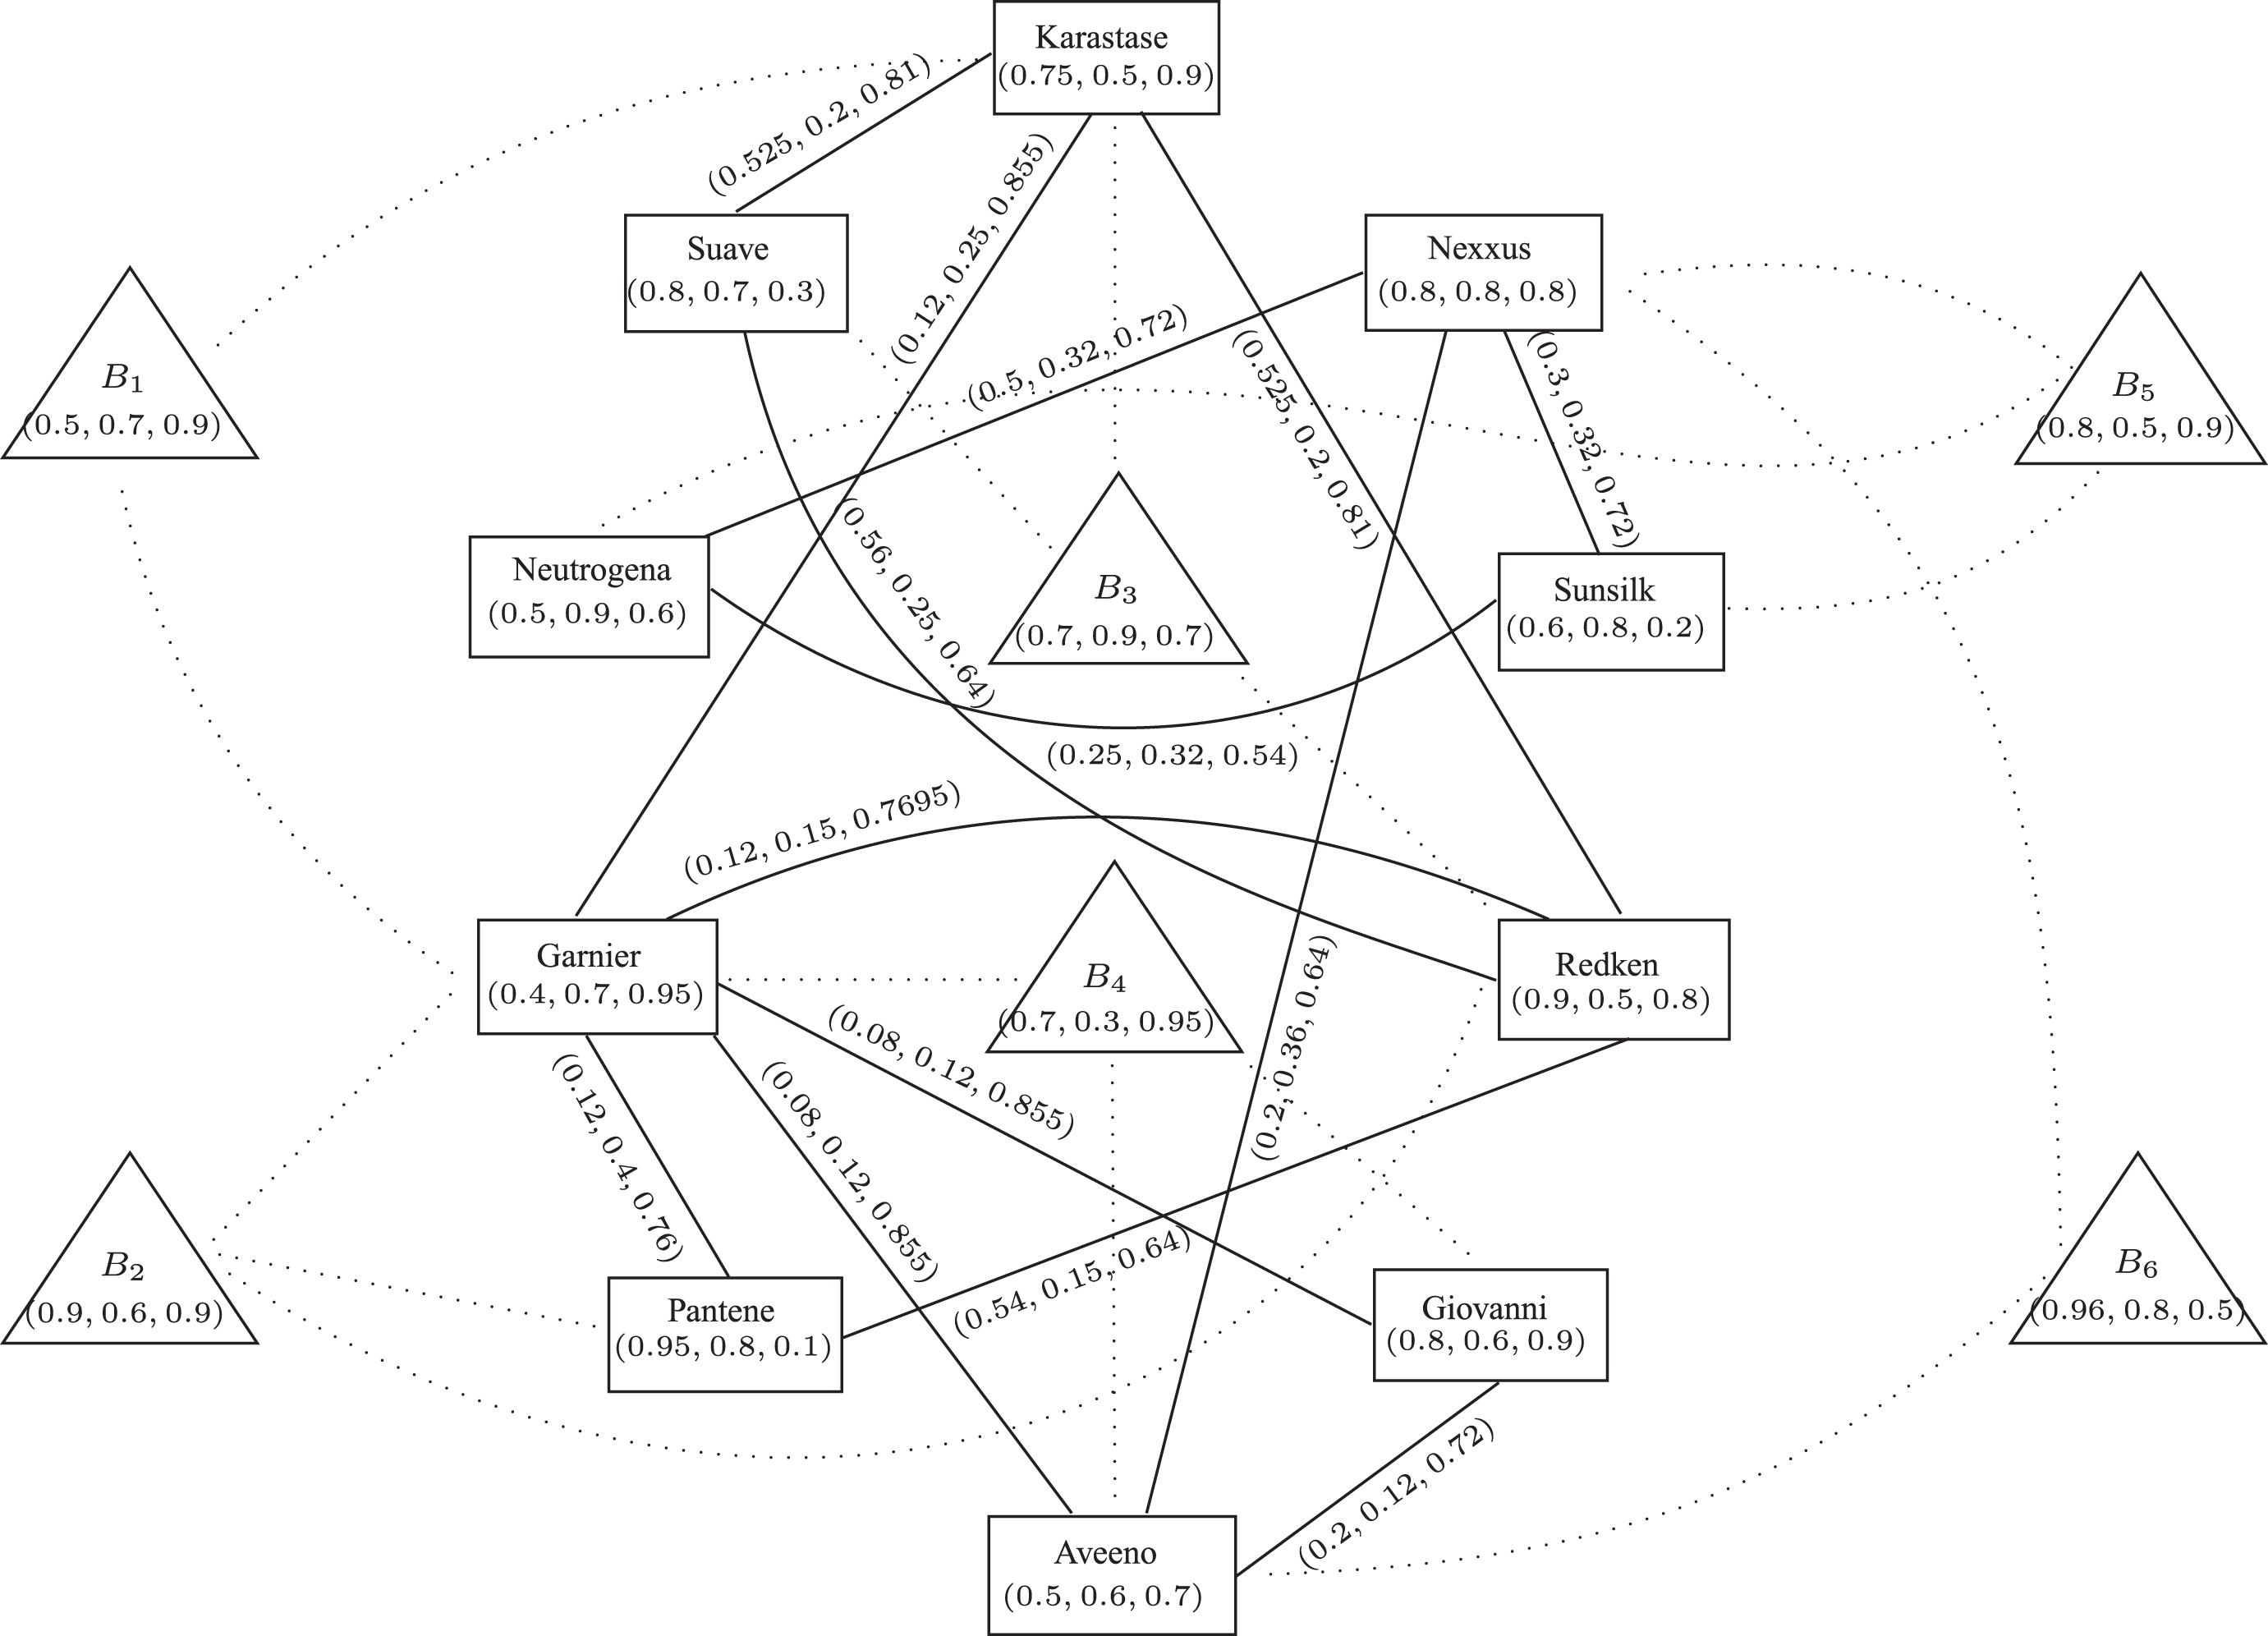
A 7-RPFECG for monopolistic competition.
Table 6 provides the strength of economic competition between shampoo brands with q-RPF information. It can be observed that Pantene has highest strength, i.e., 2.0075 . So it will compete for buyer B2 with its competitors: Garnier (0.6447) and Redken (1.7243) . Thus we conclude that the buyer B2 will purchase the shampoo brand of Pantene. Similar investigations can be considered for other brands.
Strength of economic competition of shampoo brands for customers
The Algorithm 1 provides a way to construct a q-RPFECG of a digraph and calculates the strength of economic competition of sellers for their buyers in imperfect competitive markets with q-RPF information, where S2 is developed to calculate the strength of each producer precisely, in order to distinguish its strength from other producers. The complexity of algorithm is O (n2 + lr k ).
Picture fuzzy set, suggested by Cuong [15, 16], possess more advantages over IFSs because their membership functions can be modeled to minimize the consequences of uncertainty in IF logic system. The idea of IF theory was initiated by Atanassov [9] turns out to be more beneficial than FSs as it has a nonmembership function α alongwith membership function γ satisfying the condition α + γ ≤ 1 . In contrast, PFS deal with one more level of freedom then IFS. This is done with the inclusion of a neutral part β between two extreme positions α and γ with the constraint α + β + γ ≤ 1 .
The constraint in IFS of course limits the selection of orthopairs from a triangular region. To increase the adeptness of IFS, Yager and Abbasov [48, 50] proposed the notion of Pythagorean fuzzy sets (PyFSs) which replace the constraint of IFS with α2 + γ2 ≤ 1 . This notion also limits the selection of orthopairs from unit circular region in the first quadrant [22]. Later, Yager [49] introduced another extension named, q-rung orthopair fuzzy sets (q-ROFSs) as a new generalization of orthopair fuzzy sets (i.e., IFS and PyFS), which further relax the constraint of orthopair membership grades with α q + γ q ≤ 1, (q ≤ 1) .
Analogously, since PFSs confine the selection of triplets only from a tetrahedron, the spherical fuzzy sets (SFSs), proposed by G
The present study analyzes the imperfect competition models in economic market structure with q-rung picture fuzzy information. As the importance of competition graphs and their applications are sought by many researchers [4, 38–41], from our point of view, the state of art described as a way of economic competition graphs is not mature enough. Due to increasing importance of competitive markets in economics, this study mainly focuses on q-RPFECGs. Hence our approach deals with an important topic of microeconomics, where the interactions between buyers and sellers may not be realistically modeled, whenever, a large number of companies compete with each other for differentiated products in terms of brand and quality, however, such interactions of ambiguous nature can be modeled with q-RPF information more flexibly and accurately.
Conclusions and future directions
In imperfect competition, decisions and choices by other certain economic agents are considered as roles that can not be modeled realistically. Such incidents are frequently quite uncertain and inherently vague. Due to insufficient information the state of the future scheme can not be known all the way. Conventionally, these uncertainties have been modeled through fuzzy set theory. The q-RPFS model is an efficient tool because it not only considers the response to be positive or negative, but also provides a wide space of acceptable triplets, whenever it thinks that there is some abstinence and rejection. Our current task has worked on economic competition graphs with q-RPF information providing greater accuracy, flexibility and convenience for buyers and sellers in competitive markets. Thus many real world competitions in the field of economics can be designed by q-RPFECGs. Based on concept proposed, this paper has mainly analyzed some major forms of imperfect competition. For instance, in duopoly, oligopoly, and monopolistic industries, the marketing competition is imperfect. Keeping ahead, a few firms compete within such industries and each firm’s strategy influence the demand of other. By way of examples, we have developed imperfect competition models based on q-RPFECGs. The strategic criteria and pricing decisions of companies about their competitors can be explored with the proposed approach. Moreover, fuzzy game theory can be used to extend this analysis of strategic decisions. Therefore, the donation of this work is important in both theoretical and practical aspects. Finally, it has designed an algorithm to evaluate the strength of economic competition among producers in market structures.

Future development of this study include the investigation of more effective competitive environments with q-RPF information, and additional work into the extensions and applications of the proposed method in other domains, like as, (1) Interval-valued q-RPFECGs; (2) Bipolar-valued q-RPFECGs; and (3) q-RPFEC hypergraphs.
Conflict of interest
The authors declare that they have no conflict of interest.
Footnotes
Acknowledgment
This project was funded by the Deanship of Scientific Research (DSR), King Abdulaziz University, Jeddah, under grant No. (DF-147-130-1441). The authors, therefore, gratefully acknowledge DSR technical and financial support.