
Abstract
The economic development of any country is closely linked with the consumption of energy. Therefore, international policies encourage increasing penetration of renewable energy sources (RES) into the electrical grid in order to reduce CO2 emissions and cover ever-increasing demands. However, high variance of RES complicates their integration into power systems and complicates their transition from central to distributed energy sources. On the other hand, increasing the penetration of RES in electrical networks stimulates the demand for large capacity for energy storage. This paper presents a new approach to optimize the size of on-grid renewable energy systems integrated to pumped storage system using Salp Swarm Algorithm (SSA). This approach allows the examination of various energy sources and their combination to handle the optimal configuration of the hybrid system. The simulation and optimization process of the studied system have been carried out by MATLAB programming. The impact of the system under study on the grid is examined according to the power exchange values between the system and the grid. Moreover, different scenarios have been introduced for optimal operation. The simulation results indicate that these hybrid systems can reduce power exchange with the grid and ensure that the proposed system is economically and environmentally feasible. Furthermore, the results indicate the technical feasibility of seawater hydroelectric power plants in increasing the capacity of the electric grid to allow for high penetration of RES. Finally, the results showed that the best minimum value of the objective function is 3.9113 and showed that CO2 emission can be reduced about 29.65% per year compared to the conventional power plants.
Nomenclature
The length of the reservoir
The width of the reservoir
Irregular numbers.
The capacity of the replacement units,
The cost of replacement units
The balance of energy
The load demand
The generated energy from water turbine
The energy yield
The situation of the nourishment source
The acceleration of gravity
The effective head
The height of the reservoir
The inflation rate of replacement units
The initial capital cost of the system components
Ambient intensity of solar radiation
The intensity of solar radiation under standard test conditions
PV panels number in the system
The number of units replacements over the project lifetime T
The operation and maintenance cost of the system components
PV system designed capacity under STC
The present value of scrap
The rated power
The discharge through turbines
The pumping speed
The volume of water discharged
The volume of water raised to the reservoir from the sea water
The net interest rate
The replacement cost of the system components
Value of scrap of the system components
The system lifetime in years
Upper and lower bound of j th measurement, respectively
Cut-in speed
Cut-off speed
Rated wind speed
The maximum stored capacity of the upper reservoir
Situation of the pioneer in the j th measurement
The efficiency of the pumping unit
The PV efficiency
Water turbine and generator efficiency
The mass density of seawater
Introduction
The improvement of generating facilities to face the continuous increasing demand is a significant prerequisite in power systems. In this way, renewable energy generation has started to assume an undeniably fundamental role in electric power systems [1, 2]. However, due to the irregularity and discontinuous nature of renewable energy sources (RES) [3], as well as the instability of loads, the design and size of RES was viewed as a significant challenge among researchers [4–6]. Simultaneously, energy storage systems in high-penetration frameworks must be arranged for such unpredictable sources [7, 8]. Battery storage is one of the most regularly utilized types of energy storages [9, 10]. However, since batteries are made up of chemicals, the way they are used affects their performance, cost and lifetime [11, 12]. Accordingly, when used in utility grid storage applications, the main disadvantage contrasted with other energy storage is a lower life cycle [13]. Besides, the lower capacity with lifetime, higher capital cost, higher environmental impact and less spare time. Given the above flaws, the pumped storage has been considered in renewable energy applications [14, 15]. The pumped storage system can fill in as a bulk storage application [16]. The system comprises of an upper reservoir to store water utilizing surplus energy during off-peak hours and a lower reservoir in which the water is depleted back producing electricity during peak hours [17]. The size of the reservoir relies upon the capacity and time span for which the energy stored. In contrast to fossil and nuclear plants they can rapidly increase and slope down and accomplish full load in limited time [18]. The system-level controlling of the load flow could be feasible. Furthermore, the efficiency of this system is normally between 75% and 85%, making it one of the more proficient strategies of energy storage. With expanding vulnerability in the generation, it is significant to have the adaptability to guarantee supply security. According to the low operation and maintenance costs and high reliability are additionally significant; the hydroelectric power plants have a lifetime of hundred years [19].
Over the span of the latest decade, a survey of the literatures shows that different works related to hybrid renewable energy system (HRES) have been performed in many countries around the world. For example, in [20] the authors evaluated the techno-economic related reachability of a photovoltaic (PV)/wind/hydrogen framework to supply power for a pre-defined site in Iran utilizing HOMER software. The obtained results avowed the credibility and ampleness of the proposed system. In [21] the authors showed an evaluating procedure for an off-grid PV/wind system by working up a multi-model in the objective to survey the proposed structure. The proposed model must be fit for estimating the PV/wind system with most insignificant theory, for instance, upgrading the size of the battery bank and PV cluster for a given burden and expanding its effectiveness. In [22], the authors showed an examination of a power framework subject to PV, wind turbines (WT), converter, batteries, electrolyze, FC and hydrogen tank for different sites in Saudi Arabia. Six designs have been proposed and the analysis and simulation have been performed using HOMER software. The examination exhibited that compromise 7 batteries stockpiling bank, 3 WT, 2 kW PV system and 2 kW converter is the most sensible configuration, it offers the least cost of energy. Authors in [23] exhibited an iterative methodology for the enhancement of non-irregular wellsprings of biomass and energy storage frameworks for dispersed energy generation frameworks. In [24] the authors exposed the suitable utility of utilizing evaluating procedure and exhibited the impact of the battery storage on the whole cost of the framework. The authors showed a deterministic calculation to limit the whole framework cost whilst achieving the heap necessities of the framework. They utilize the information of a half year of meteorological data through the algorithm. The authors in [25] evaluated the techno-economic related execution of different systems to supply demand for natural telecom. The generation results performed by using HOMER software exhibit that the PV/wind/battery or PV/WT/battery/Fuel Cell (FC) is the most sensible and capable structure as a result of their low total net present expense. The authors in [26] examined a streamlined course of action for the essentialness supply of an ordinary nuclear family (3 kWh multi-days) in three regions. In their assessment, specific budgetary improvement of a structure including wind and sun based power with a battery was investigated. As far as possible concerning two days was found as the perfect course of action with minimal cost of imperativeness use. In [27] the authors considered orchestrating and execution of economic power source systems using sun based, wind and tide energies. In [28] the authors showed a structure including PV board, control module and battery for an imperativeness giving of an area in Amazon. The objective of this assessment was a cost related examination of the referenced pilot structure. The results showed that improved fundamental cost, present endeavor regard and power essentialness cost of this structure close by hydrogen accumulating. The authors in [29] presented a particular cost related assessment of hydrogen age and supportable influence source systems. The improved system fused a 15.9-kW sun based board, a 8-kW control module, and a 16-kW electrolyzer which could convey 3.2 m3 hydrogen per hr. Furthermore, the utmost of hydrogen storing tank was 320 kg compacted hydrogen with a 30-bar weight. In long stretch circumstances, a half cost abatement in electrolysis cost and a 40% decline in hydrogen accumulating cost were considered. A large portion of the approaches appeared in these writing utilize transient meteorological information of wind speed or sun oriented radiation and temperature which thus decreases the framework measuring precision [30]. In [31] a grid-independent hybrid PV/wind/diesel/battery system has been designed with the best hybrid combination of system’s components to fulfill the electricity demand of standalone load. The authors in this paper have utilized five scenarios of system’s renewable energy fractions using HOMER software.
Meta-heuristic algorithms fall into two dominant categories: swarm and evolutionary intelligence algorithms [32–36]. Evolutionary algorithms imitative the conceptions of evolution in nature; there are many evolutionary algorithms in the literature such as Evolutionary Strategy (ES), Evolutionary Programming (EP), Differential Evolution (DE), Biogeography-Based Optimization (BBO), Genetic Algorithm (GA) [37], and Particle Swarm Optimization [38]. GA and PSO can adequately investigate distinctive locale of search space at once. Subsequently, GA and PSO are less defenseless to being caught in local minimum when contrasted with regular approach. The authors in [38] have used PSO for sizing and optimization of hybrid hydro/PV/ Diesel system in different regions in Western Himalayan. Cuckoo Search (CS) is a recently used meta-heuristic algorithm for solving the optimization problems of HRES [39]. The main basis of the intelligence swarm algorithms stems from the additive manner of a set of creatures. In the Salp Swarm Algorithm (SSA), the parameters to be adjusted during the optimization process are less than those of GA and PSO. This in turn makes SSA more potential and superior among the optimization techniques in solving wide class of optimization problems [40].
In this paper SSA based MATLAB software is used to survey the structures of the different inexhaustible generation frameworks of electrical energy. One year of power utilization has been displayed unequivocally, and the agent year is relied upon to go over for the assessment time period. The main idea of this estimation is to limit the expense of the electrical energy produced in order to get in contact at an ideal arrangement of the framework to supply energy to determined burden request. The proposed system consolidates WT, PV and pumped storage. The main contribution in this paper can be summarized as follows: Introduce a new program using SSA that can handle the design of hybrid renewable energy systems (HRES) in smart and effective way. To define a numerical model, which describes the parallel operation of a hybrid energy framework comprises of WT, PV and twofold penstock seawater pumped storage hydropower plant integrated with the electric utility. Introduce an improvement model outcome in limiting the effect of such a framework on the national network by choosing the ideal parameters of the hydropower plant. Investigate and present the level of duty of every parameter on the estimation of the energy exchanged with the network.
Modeling of the hybrid renewable energy system components
A typical structure of the proposed renewable energy system with a pumped storage system including the basic parameters and the direction of power flow is described in Fig. 1. The hydropower plant utilizes seawater as a lower reservoir, and only a tank has to be built as the upper reservoir to reduce the initial cost of the pumped storage system. The pumped storage power plant used for compensation of the variation of the output energy from the PV and wind power plants by discharging water from the upper reservoir, which is previously pumped in the case of surplus energy from PV and WT power plants. The impact of the system under study on the grid utility is investigated in accordance with the values of deficits and surpluses of energy exchange between the considered hybrid system and the grid. The optimum design of the seawater energy storage facility was determined for the pump and turbine capacities, upper reservoir volume, the volume of water, which will be left in the tank for emergencies, different scenarios for the optimum operation are presented for analysis. The integration of variable RES into the power system makes its management a very complicated task. That is because of the output energy yields from such systems like PV and WT mainly dependent on solar radiation and wind speed, which must be anticipated to an exceptionally little level of assurance. The siphoned stockpiling framework is utilized to store surplus power during the daytime and produce control during the evening time. As the twofold penstock hydroelectric framework manages voltage and keeps up a steady recurrence with appropriate control procedures, the proposed system receives the twofold penstock seawater siphoned capacity framework instead of the single-penstock siphoned capacity framework [18]. On the off chance that the RES created control surpasses the required load request, at that point surplus power is conveyed to charge the battery bank unit. From that point the battery becomes possibly the most important factor when the age of RES is deficient to take care of the heap demand [25]. The PV/wind/pumped storage HRES activity relies upon every segment execution. Hence amending each sustainable source execution, an individual sustainable power source is displayed is talked about in this segment:

Schematic diagram of the grid-connected HRES with pumped storage.
The wind power and the real WT output power are expressed as follows, respectively:
Where Ucut-in, Ucut-off, U rated are the cut-in, cut-off and rated wind speed, respectively. P WT is the rated power.
The energy yield from the PV system is expressed as follows [28]:
Where, EPV is the energy yield (kWh); n PV is PV panels number in the system; Irad (t) is ambient intensity of solar radiation (kWh/m2); I STC is the intensity of solar radiation under standard test conditions (kWh/m2); P PV is the PV system designed capacity under STC (kW); η PV is the PV efficiency [28, 29].
The energy yield from a hydroelectric power station is calculated as follows:
Where, E H is the generated energy from water turbine in (kWh), η T is the water turbine and generator efficiency, ρ is the mass density of seawater in (kg/m3), g is the acceleration of gravity in (m/s2), Q is the discharge through turbines in (m3/s), h is the effective head in m.
The Levelized Cost of Energy (LCOE) has been utilized in this paper and can be calculated as follows [15]:
CRF and TPV are expressed as the following:
Where, r is the net interest rate [41], and T is the system lifetime in years and IC is the initial capital cost of the system components. OMC is the operation and maintenance cost of the HRES segments, the maintenance cost involved in hydroelectric storage and can be estimated as the following [42–45]:
In the case of renewable energy systems, there is no fuel cost, therefore the operating and maintenance cost is the major cost of the system, and is given by:
Where, C pv o&m , C wt o&m , C hydro o&m , C pump o&m are the operating and maintenance cost of PV, wind, turbine/generator set and pump/motor set per unit time, t pv , t wt , t hydro , t pump are the operating times of PV, wind, turbine and pump systems, respectively.
RC is the replacement cost of the system components and can be determined as the following [43]:
PSV is the present value of scrap and can be expressed in terms of the value of scrap of the system components (SV) as the following [43]:
Energy is a very important aspect in all sectors of a country’s economy. Coal and gas are traditional energy sources and are available in limited forms. These two sources are important for generating electricity. It is absolutely necessary to improve the use of natural resources and it is necessary to avoid the energy crisis [13]. Energy demand has increased with the increase in its consumption, so an appropriate energy conservation methodology must be adopted. Excessive energy use can be avoided by conserving energy. Energy saving achieved through energy efficiency and conservation avoids capital investment in mining, fuel, water, transportation, and land needed for the power plant, thus mitigating environmental pollution. The balance between energy use and the environment and issues related to global warming and air pollution are the main requirements of the environment sector. In this context, RES in focus in recent years. The International Energy Agency (IEA) is developing policies to reduce equivalent CO2 emissions, and many countries have adopted RES in the market as an important target. Figure 2 shows the top CO2 emitting countries [36].
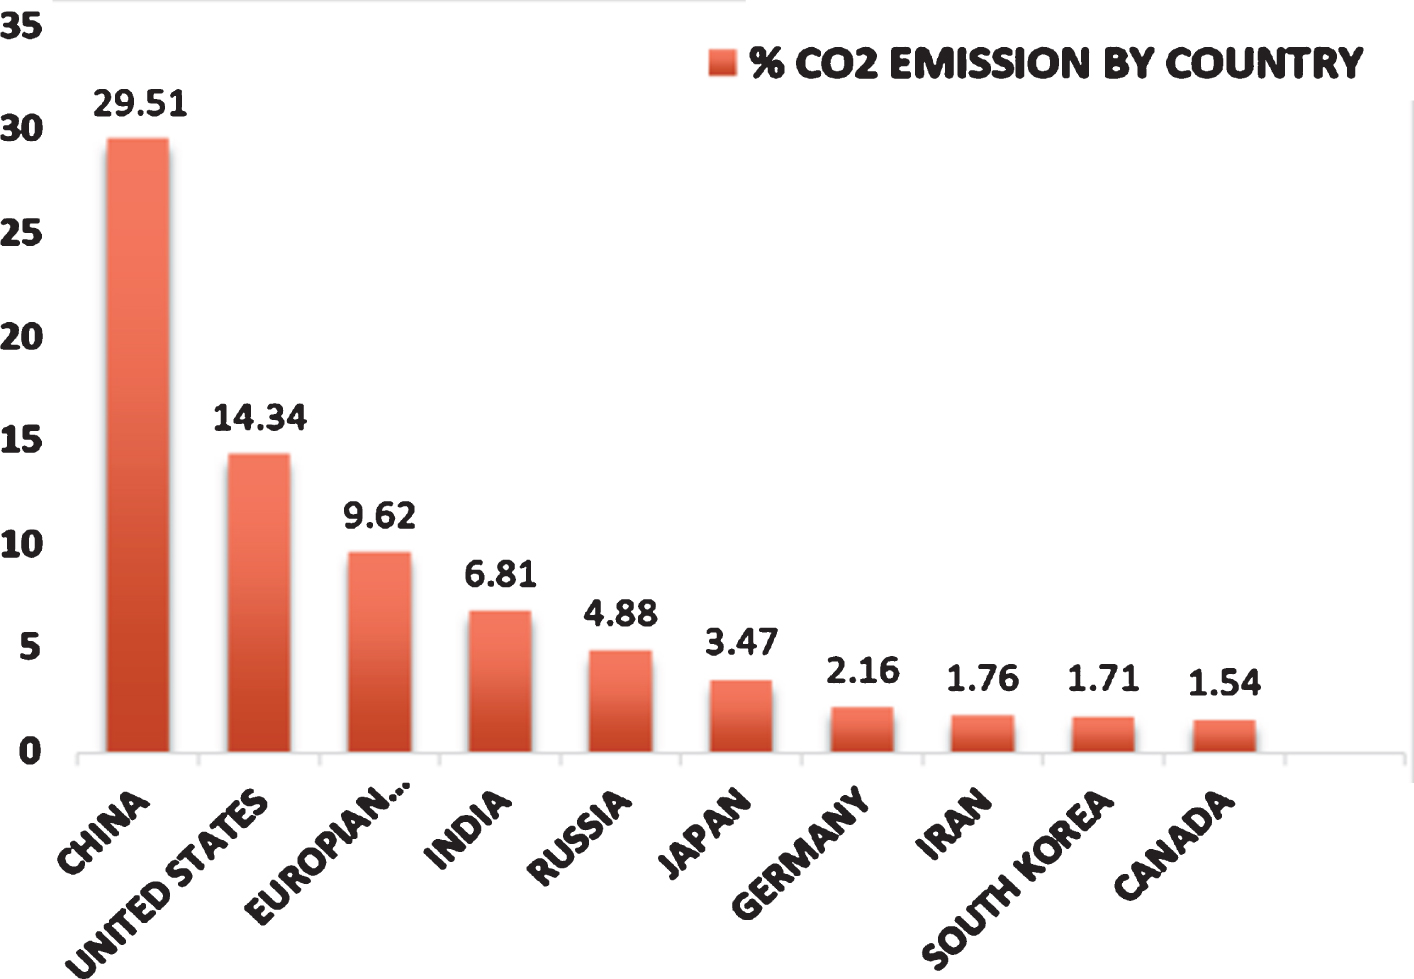
The top CO2 emitting countries.
The basic idea of becoming carbon neutral or carbon negative is to reduce greenhouse gas emissions from direct and indirect sources such as electricity, transportation, solid waste, sewage waste, etc. These are potential sources of carbon dioxide emissions that release a large amount of CO2 into the atmosphere. The accumulation of CO2 has a serious impact on health and the environment [11]. Also, there is a high cost of generating uneconomic electricity for our environment. The following are tasks that should be accomplished to be carbon neutral: To identify the various potential or indirect potential sources of carbon emissions to the environment that can be addressed on RES. To find CO2 equivalent for each specific source. Working to find an alternative solution for the specified source under the existing circumstances. To determine the technical and economic feasibility of the proposed techniques. This paper discusses various economic steps to reduce greenhouse gases [22]. These plans include the following: Electricity: analyzing various electrical equipment, finding total CO2 emissions annually and proposing feasible solutions to reduce CO2 content by installing PV systems. Vehicle emissions: reduce vehicle pollution by using solutions such as campus auto systems and replacing petrol and diesel with compact natural gas. Sewage waste: CO2 emissions can be reduced through various technologies such as reducing the BOD of wastewater treatment water.
The estimation of CO2 from electricity is done on the basis of the consumption of electricity per kW. The emission factor of electricity is 0.81. The total CO2 emission from the system is calculated by using the equation:
The proposed algorithm is applied for optimization the system to supply the electricity load at certain location in Dalian, Liaoning, China. The latitude of Dalian, Liaoning, China is 38.920834, and the longitude is 121.639168. Dalian, Liaoning, China is located at China country in the Cities place category with the GPS coordinates of 38° 55’ 15.0024” N and 121° 38’ 21.0048” E. A load demand and meteorological data (wind speed and irradiation) in a specified area have been utilized in this study as shown in Fig. 3. Figures 4, and 5 show the wind speed data and solar irradiance data for the selected site which is obtained from the NASA database [46]. Table 1 shows the economic and technical characteristics of the system components [42, 43].
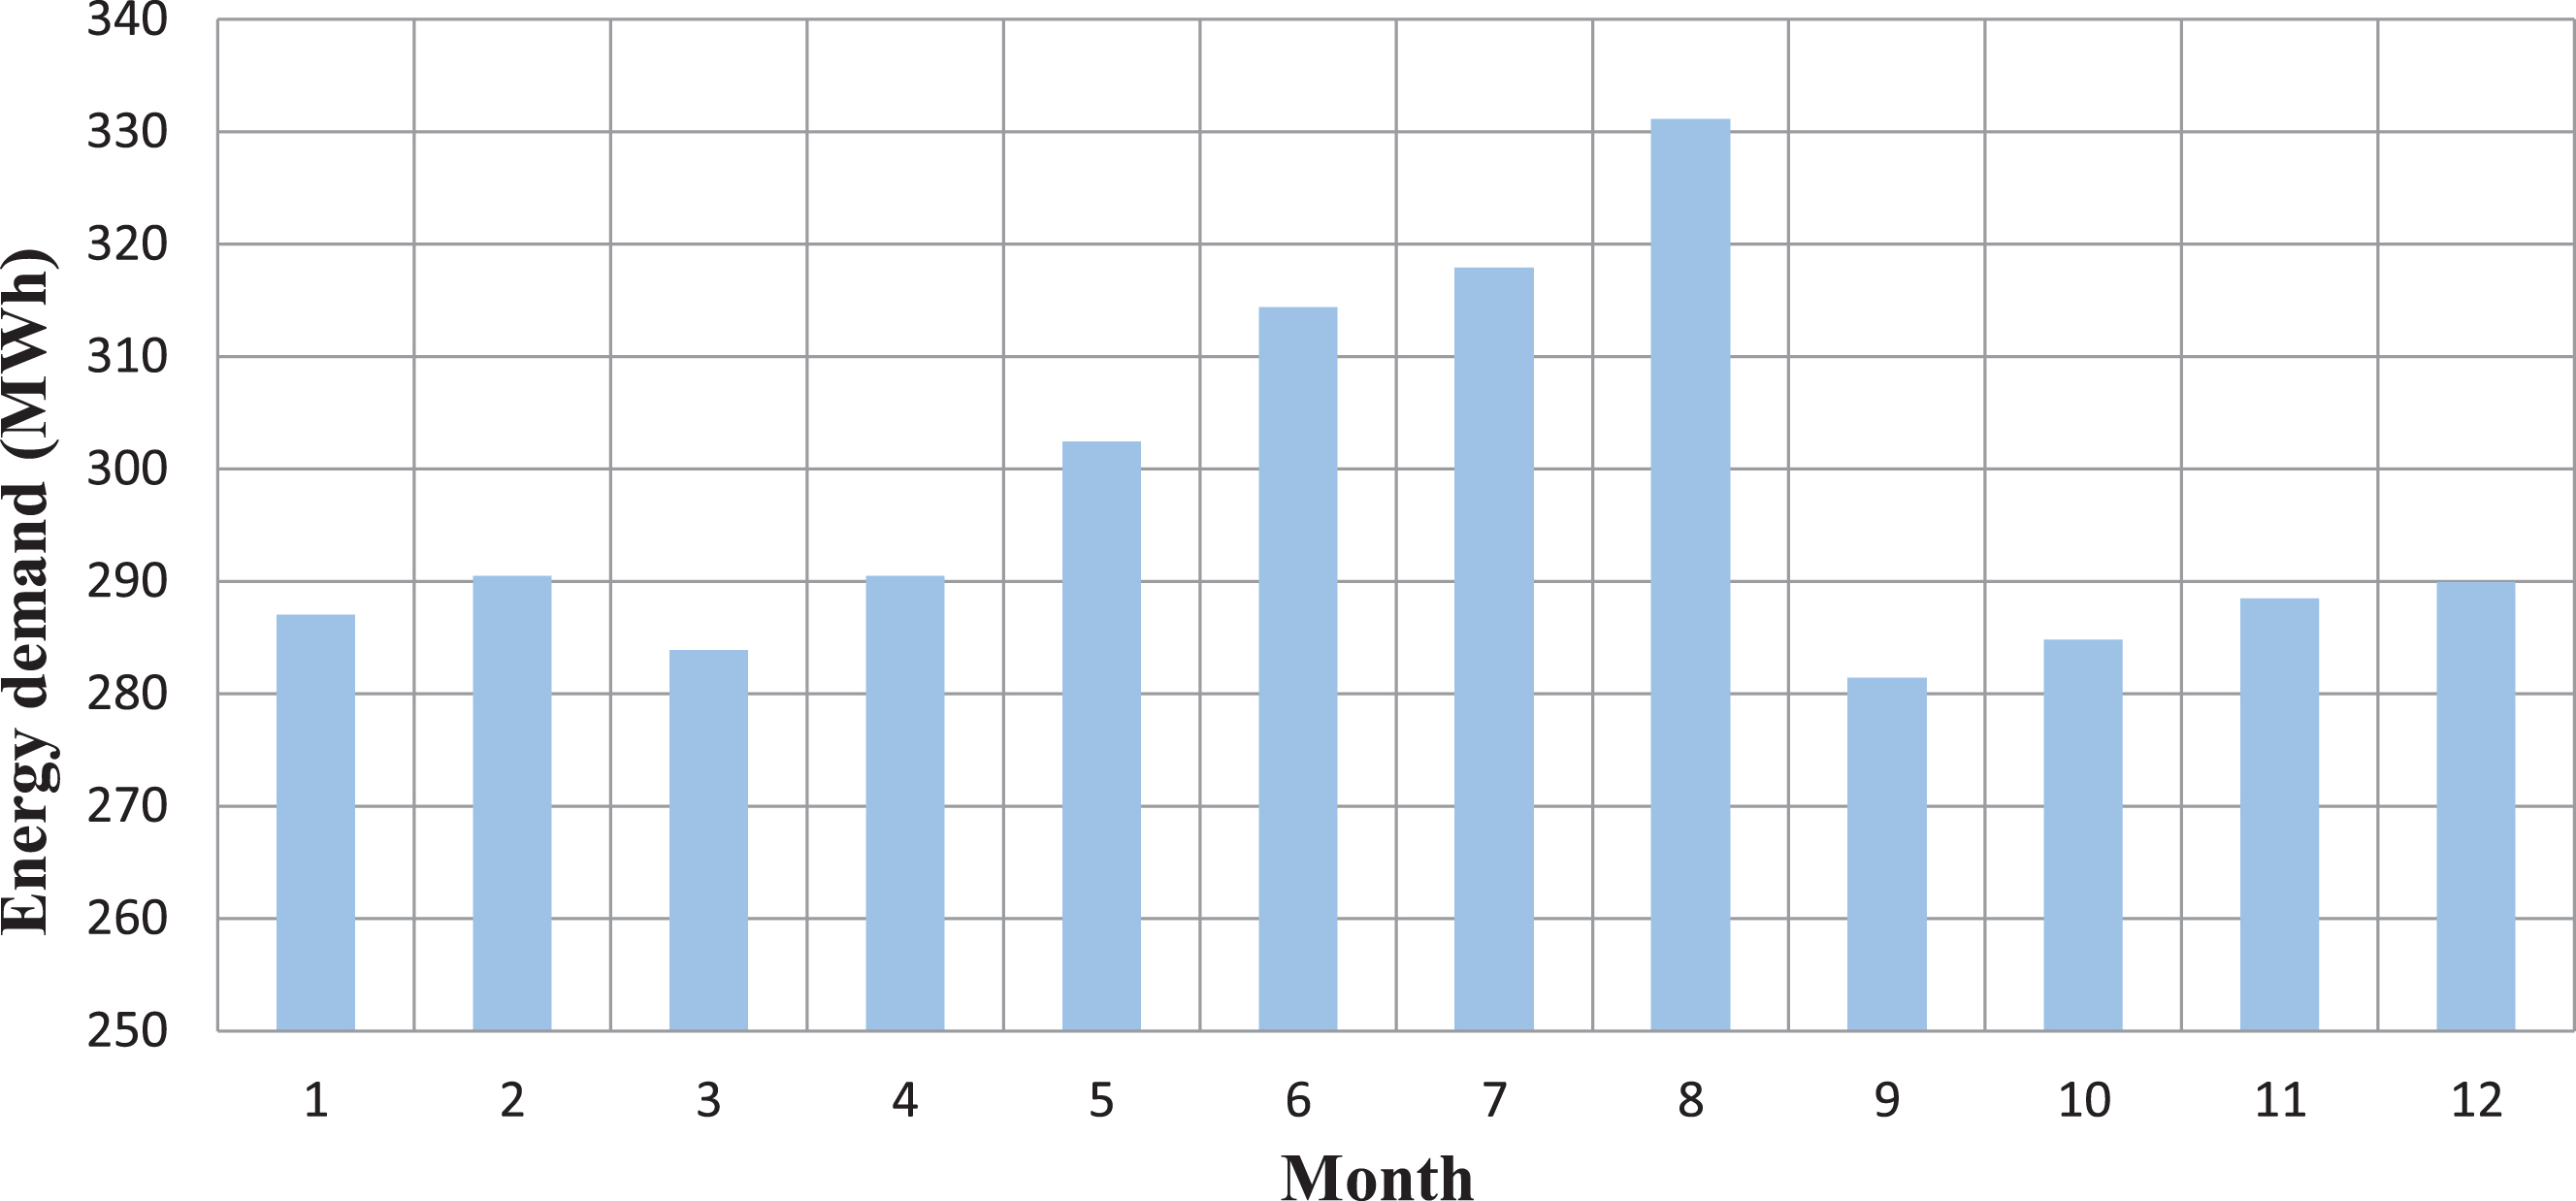
Annual variation of the energy demand.
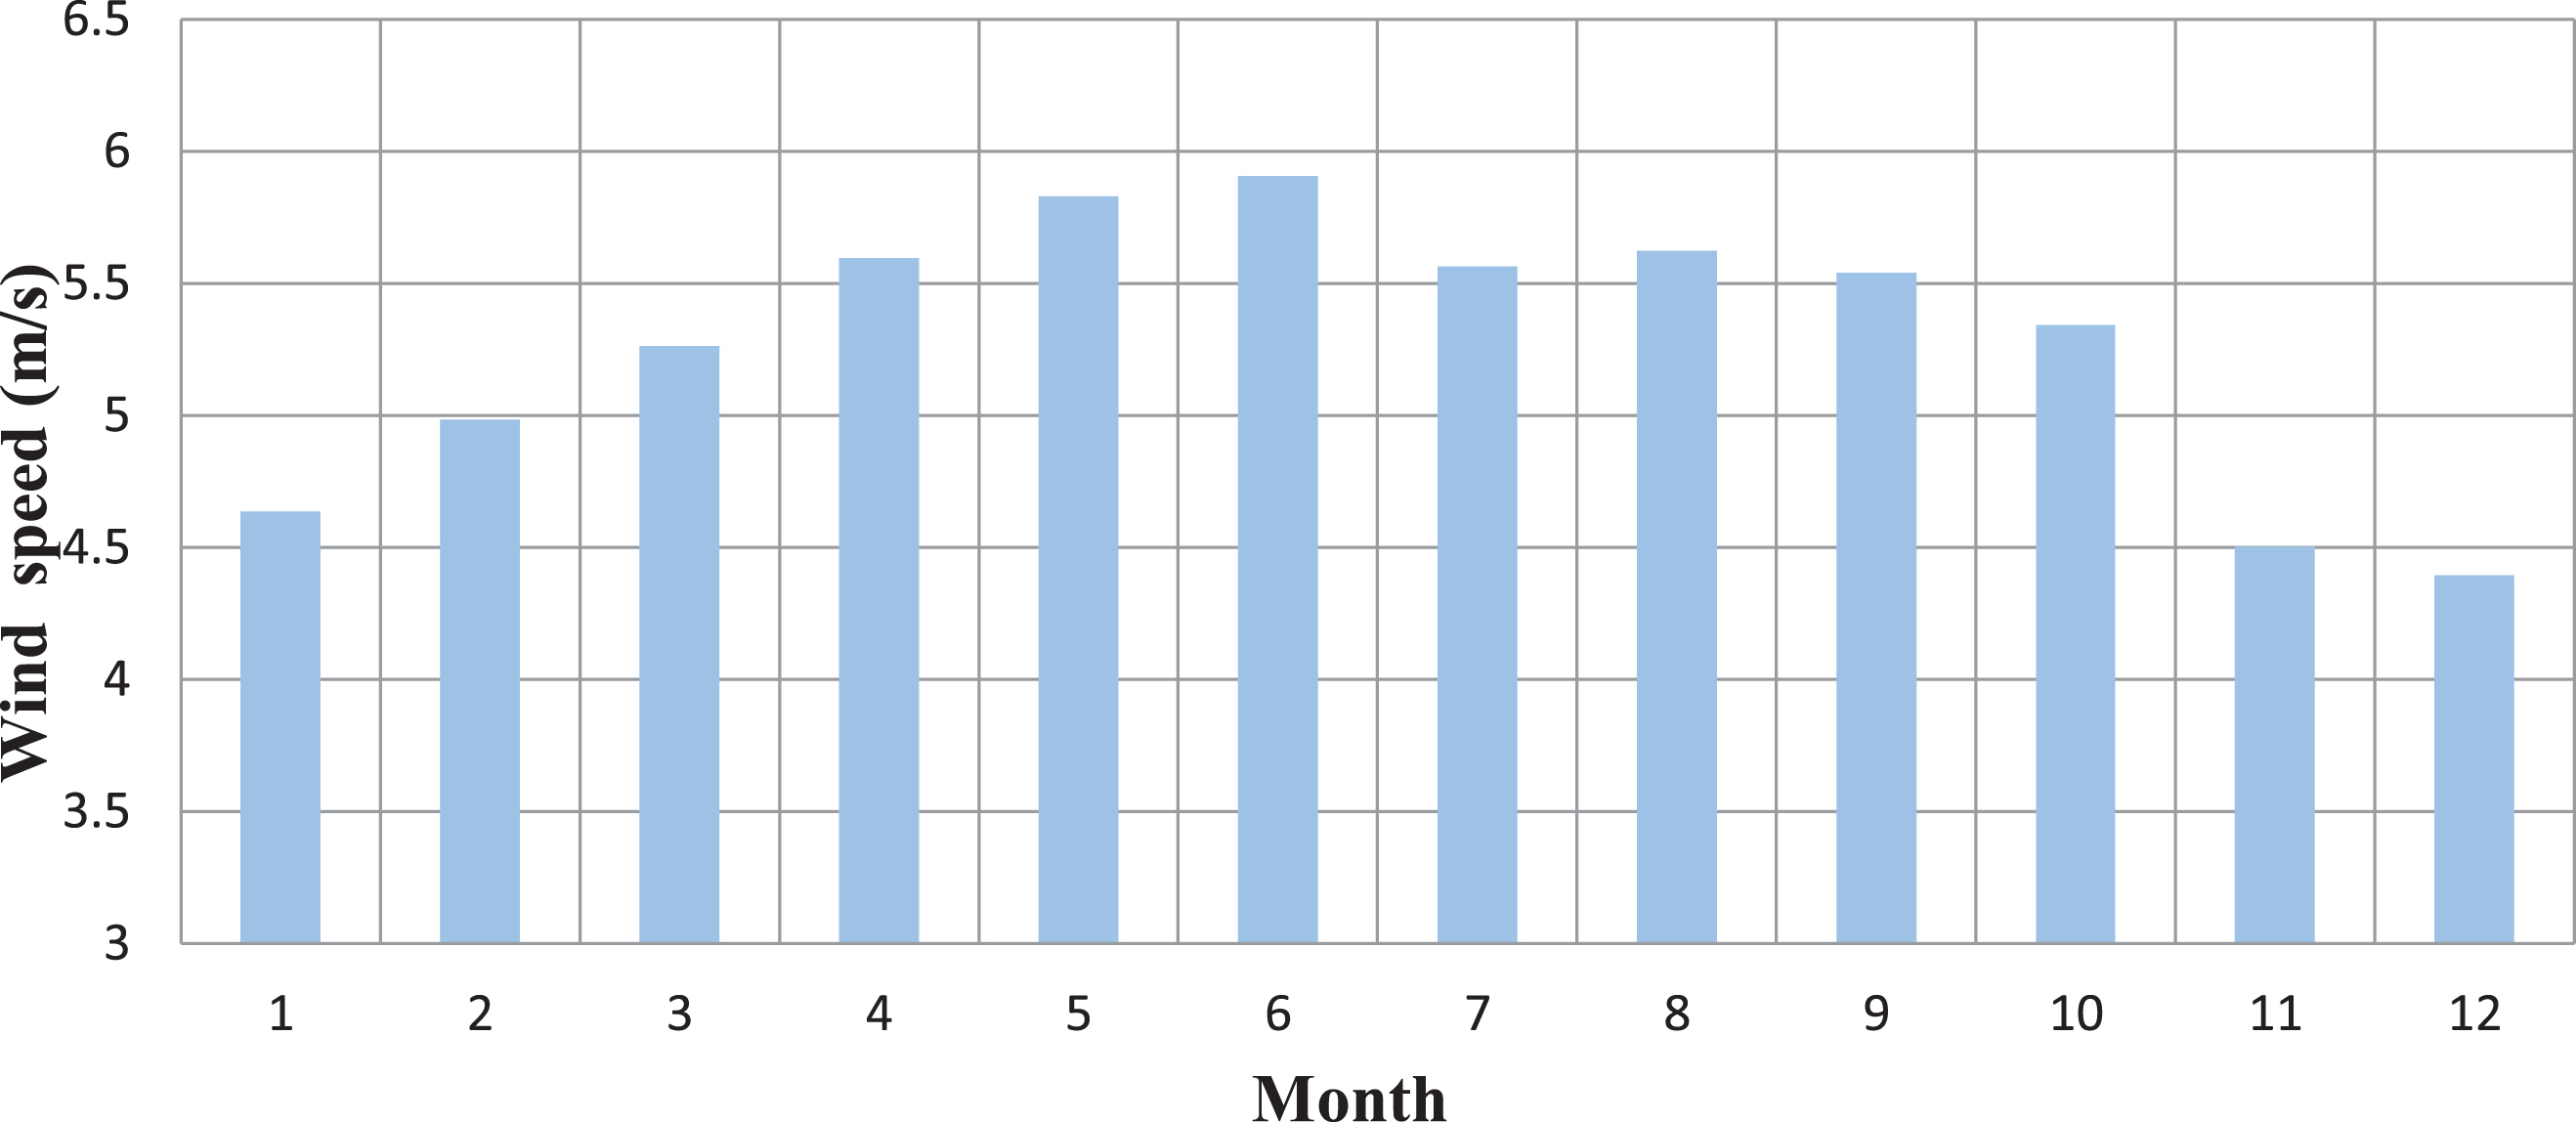
Annual variation of wind speed.
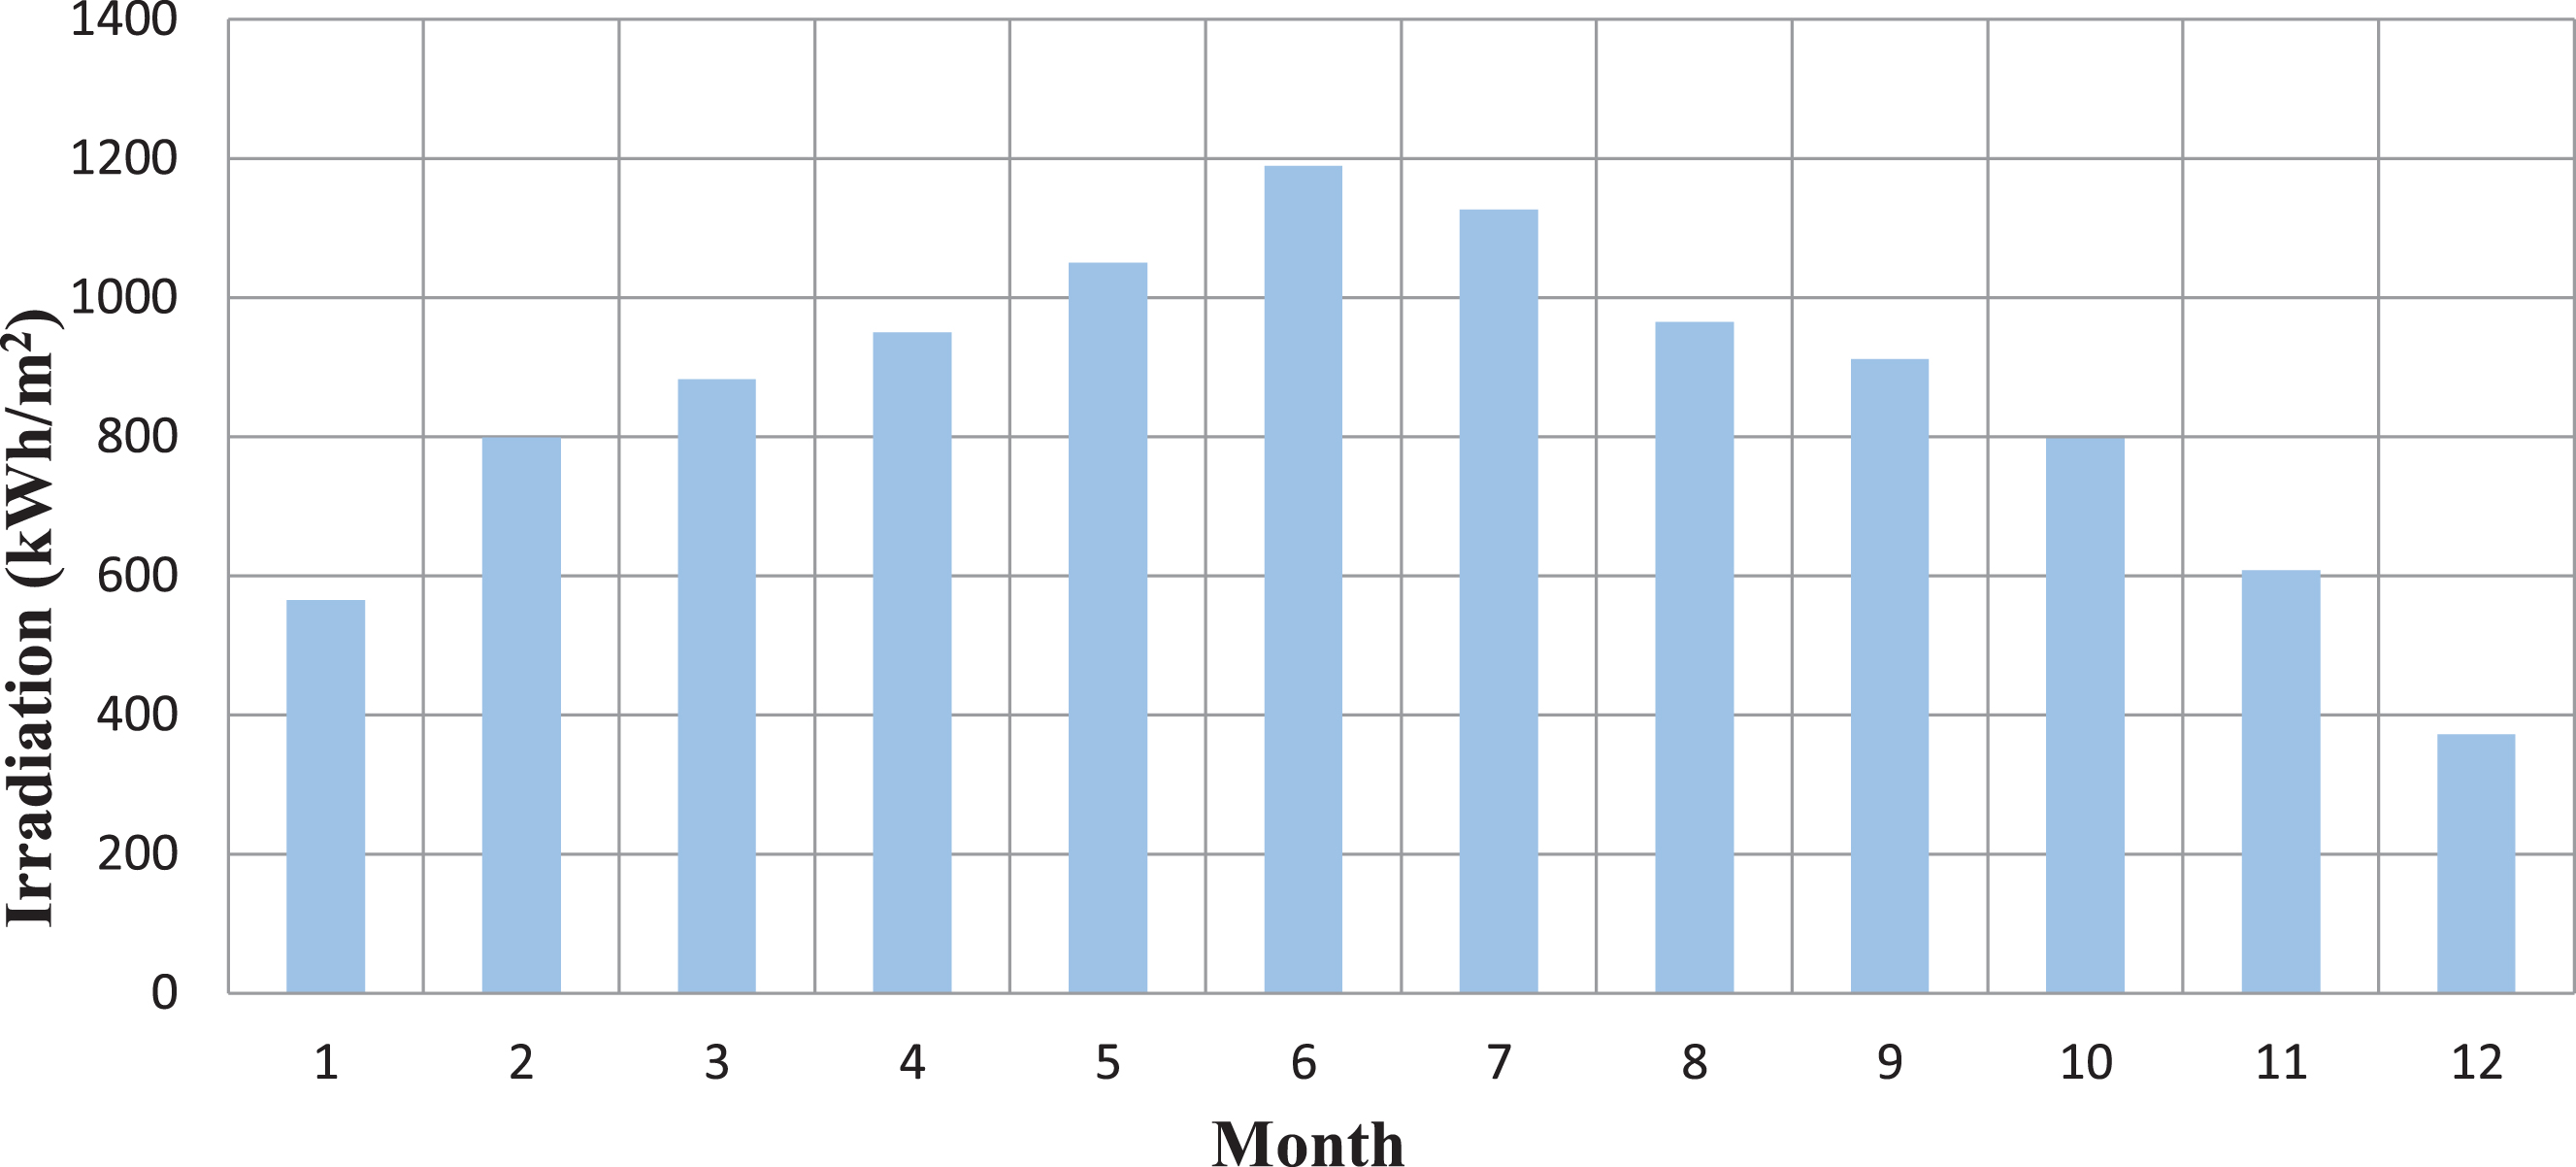
Annual variation of irradiance.
The economic and technical characteristics of the system components [8]
The operation of the hybrid energy system is determined depending on the values of the energy yield of the PV and WT compared with the values of the load demand as follow:
The Energy balance of the system is performed as follows:
Where, E B is the balance of energy (kWh), and E D is the load demand (kWh).
The upper reservoir is assumed to have a cube shape and the energy storage potential is depending on the volume of stored water:
Where, a is the length of the reservoir (m), b is the width of the reservoir (m) and h2 is the height of the reservoir.
The length of the water segment isn’t consistent during the working lifetime and whenever influenced by the volume of water put away or released from the store during the time of recreation. In the principal time of recreation, the volume of put away energy is thought to be a large portion of the greatest limit of the supply.
During the reproduction lifetime, it is accepted that the volume of water put away in the supply must not be not exactly the base suitable worth V
min
. The saved energy in the tank will be sent to the network in crisis circumstances identified with a deficiency event or the blackout of a power plant. The energy held is taken as a level of the greatest limit of the upper supply. The volume of water put away in the supply whenever in the year is determined as pursues:
Else
Where, V
max
is the maximum stored capacity of the upper reservoir (m3),
During the period of pumping and discharging the head of the column of water changed with time due to the additional head resulting from the occupancy of the upper reservoir, besides the main head of the hydropower.
When the values of energy balance EB < 0, the system will operate in the generating mode and the electric energy generated from the generator-turbine set is calculated as follows:
Where, QT is the discharge water speed of the turbine (m3/s), h3 is the mean head of the hydropower system, ηWP is the pipeline conveyance efficiency, ηT is the generator efficiency. As a result of the previous equation the volume of water discharged during that period of time is given as follows:
The hybrid system normally won’t have the option to give the energy demand request in unsurpassed; in some cases it needs support from the grid to cover the demand for energy. The energy deficit in this situation is determined as follows:
On another hand, when the value of the energy balance EB > 0, in this case the share of energy surplus is used to pump water from the sea to the upper reservoir, the electric energy drawn from the PV and WT and consumed by the pump system at any period of time is calculated as the following:
Where, Q
P
is the pumping speed (m3/s), η
P
is the efficiency of the pumping unit. Based on the previous equation the volume of water raised to the upper reservoir during a certain period is calculated as follows:
If the hybrid system cover the demand for energy and there is no possibility to store the excess of water in the upper reservoir, then the surplus of energy fed to the grid is calculated as follows:
SSA simulates the mannar of salps during cruise and searching for food in water [47]. To display the salp chains, the populace is first partitioned into two gatherings: a pioneer and adherents [48]. It is additionally expected that there is a nourishment source called F in the quest space as an objective for a squadron [41]. To describe the situation of the pioneer, the accompanying equation is presented:
Where
The position of the pioneer can be modified as follows:
Where x i j shows the position of i th pioneer salp in j th dimension.
The flowchart of the SSA with the proposed objective function is described in Fig. 6 [47].

The flowchart of the SSA.
The simulation of the proposed HRES has been performed by means of SSA optimization technique which has been set up with m-file based MATLAB simulation model. The model provides a simple and a clear instruction for implementing the simulation. The operation of the hybrid energy system is determined depending on the values of the energy yield of the PV and WT compared with the values of the load demand utilizing Equations (14–24). The input parameters for the simulation model are as follows:
Input parameters
For this analysis, data was obtained from energy demand of Fig. 3, wind speed from Fig. 4, irradiation from Fig. 5. The economic and technical characteristics of the system components have been utilized from Table 1. The climate-related meteorological parameters are representative for Dalian site, Liaoning, China.
In this study we have investigated the effect of varying the installed capacities of water pumps and the energy storage potential of the upper reservoir on the energy balance (exchange with the grid) and on the general operation of the considered hybrid energy source. The considered scenarios are 8 various scenarios, a number which resulted from the permutations of the values of the three considered parameters. Those parameters included: Energy storage capacity of 18.4, 92.0, 184.0, 276.0 and 368.0 MWh, which translates to coverage of 5, 25, 50, 75 and 100 hours of average energy demand; Water turbine maximum pumping and generating power output of 2.0, 4.0, 6.0, 8.0 and 10.0 MW; The β parameter which determines the percentage of the upper reservoir which can be refilled by the available river inflow or, in other words, the part of the reservoir volume which will always be available for pumping operation. The beta parameter took the following values: 0.0, 0.25, 0.5, 0.75, and 1.0, where 1.0 means that the upper reservoir may be totally filled by the available inflow, whereas 0.0 means that the water from the river cannot be stored in the reservoir and in general the proposed hydropower plants starts to operate as a conventional pumped storage hydroelectricity facility.
The SSA parameters are as follows: c1, c2, and c3 are irregular numbers. The parameter c2 and c3 are irregular numbers consistently produced in the interim of [0,1] though c1 is the most significant parameter and decided by the l current cycle [40].
For the purpose of the calculations the following assumptions on the electricity generation cost have been considered as follows: The LCOE of the PV system ranges from 0.079 to 0.115 with a mean value of 0.1 € /kWh [49]; The LCOE of wind generation ranges from 0.048 to 0.1025 with a mean value of 0.08 € /kWh [49]; The hydropower facility construction (PSH) is 2,000 € /kW and 14 € /kWh for pumps/turbines and storing capacity, respectively, while the operation and maintenance of the PSH facility is about 3€ /kW [50].
With regards to the environmental impact of the proposed solution, the relevant CO2 emission values have been assumed as follows: Over its lifecycle, the PV installation will “emit” 0.048 kg of CO2 per 1 kWh of electricity generated [51]. The wind turbine emissions will be significantly smaller, at 0.011 kgCO2/kWh [52]. The PSH facility emissions are split into two phases: construction (35.7 kgCO2/kWh) and operation (0.0018 kgCO2/kWh) [53]. The current real emissions in the Polish energy sector are relatively high, at 0.810 kgCO2/kWh [53].
Results and discussion
The balance of energy over the period of study is shown in Fig. 7. The siphoned stockpiling hydropower plant comprises of an upper and a lower repository associated, however for this situation, the lower supply isn’t considered as the seawater is considered as the lower store. At the point when overabundance energy is required, the water used to produce power moves through the penstock and impels water turbines. At the point when siphons are taken care of into the activity to store abundance energy from the breeze as well as sunlight based age the water is siphoned over from the ocean to the upper supply. The distinction in rise between the upper store and the seawater level considered in this examination is h3 = 100 m and the additional head, which is resulting from the change in the volume of water stored in the upper reservoir is h2 = 5 m. The dimensions of the upper reservoir are as follows: length a = 600 m, width b = 200 m. This gives a total volume V max of 1000 000 cubic meters. In this study the efficiency of the pump is 90% and for the generator-turbine set is 80%, the maximum capacity of the upper reservoir amounts to 375 MWh, which is equivalent to 5 hours of average demand of the load. Normally, the hourly energy generation of such a water turbine is dictated by its maximal release limit and effectiveness bend, the effect of turbine and siphon limits on the framework setup will be contemplated in the accompanying segments.

The balance of energy over the period of study.
At the point when the overflow of energy is near the volume of shortfalls in energy for this situation the conclusive job of energy storage framework gets self-evident. For this situation, the energy store can utilize the accessible surplus energy and move it to time to give them when less good states of light and wind speed happen. Fluctuation in the energy exchange is imagined in Fig. 8.
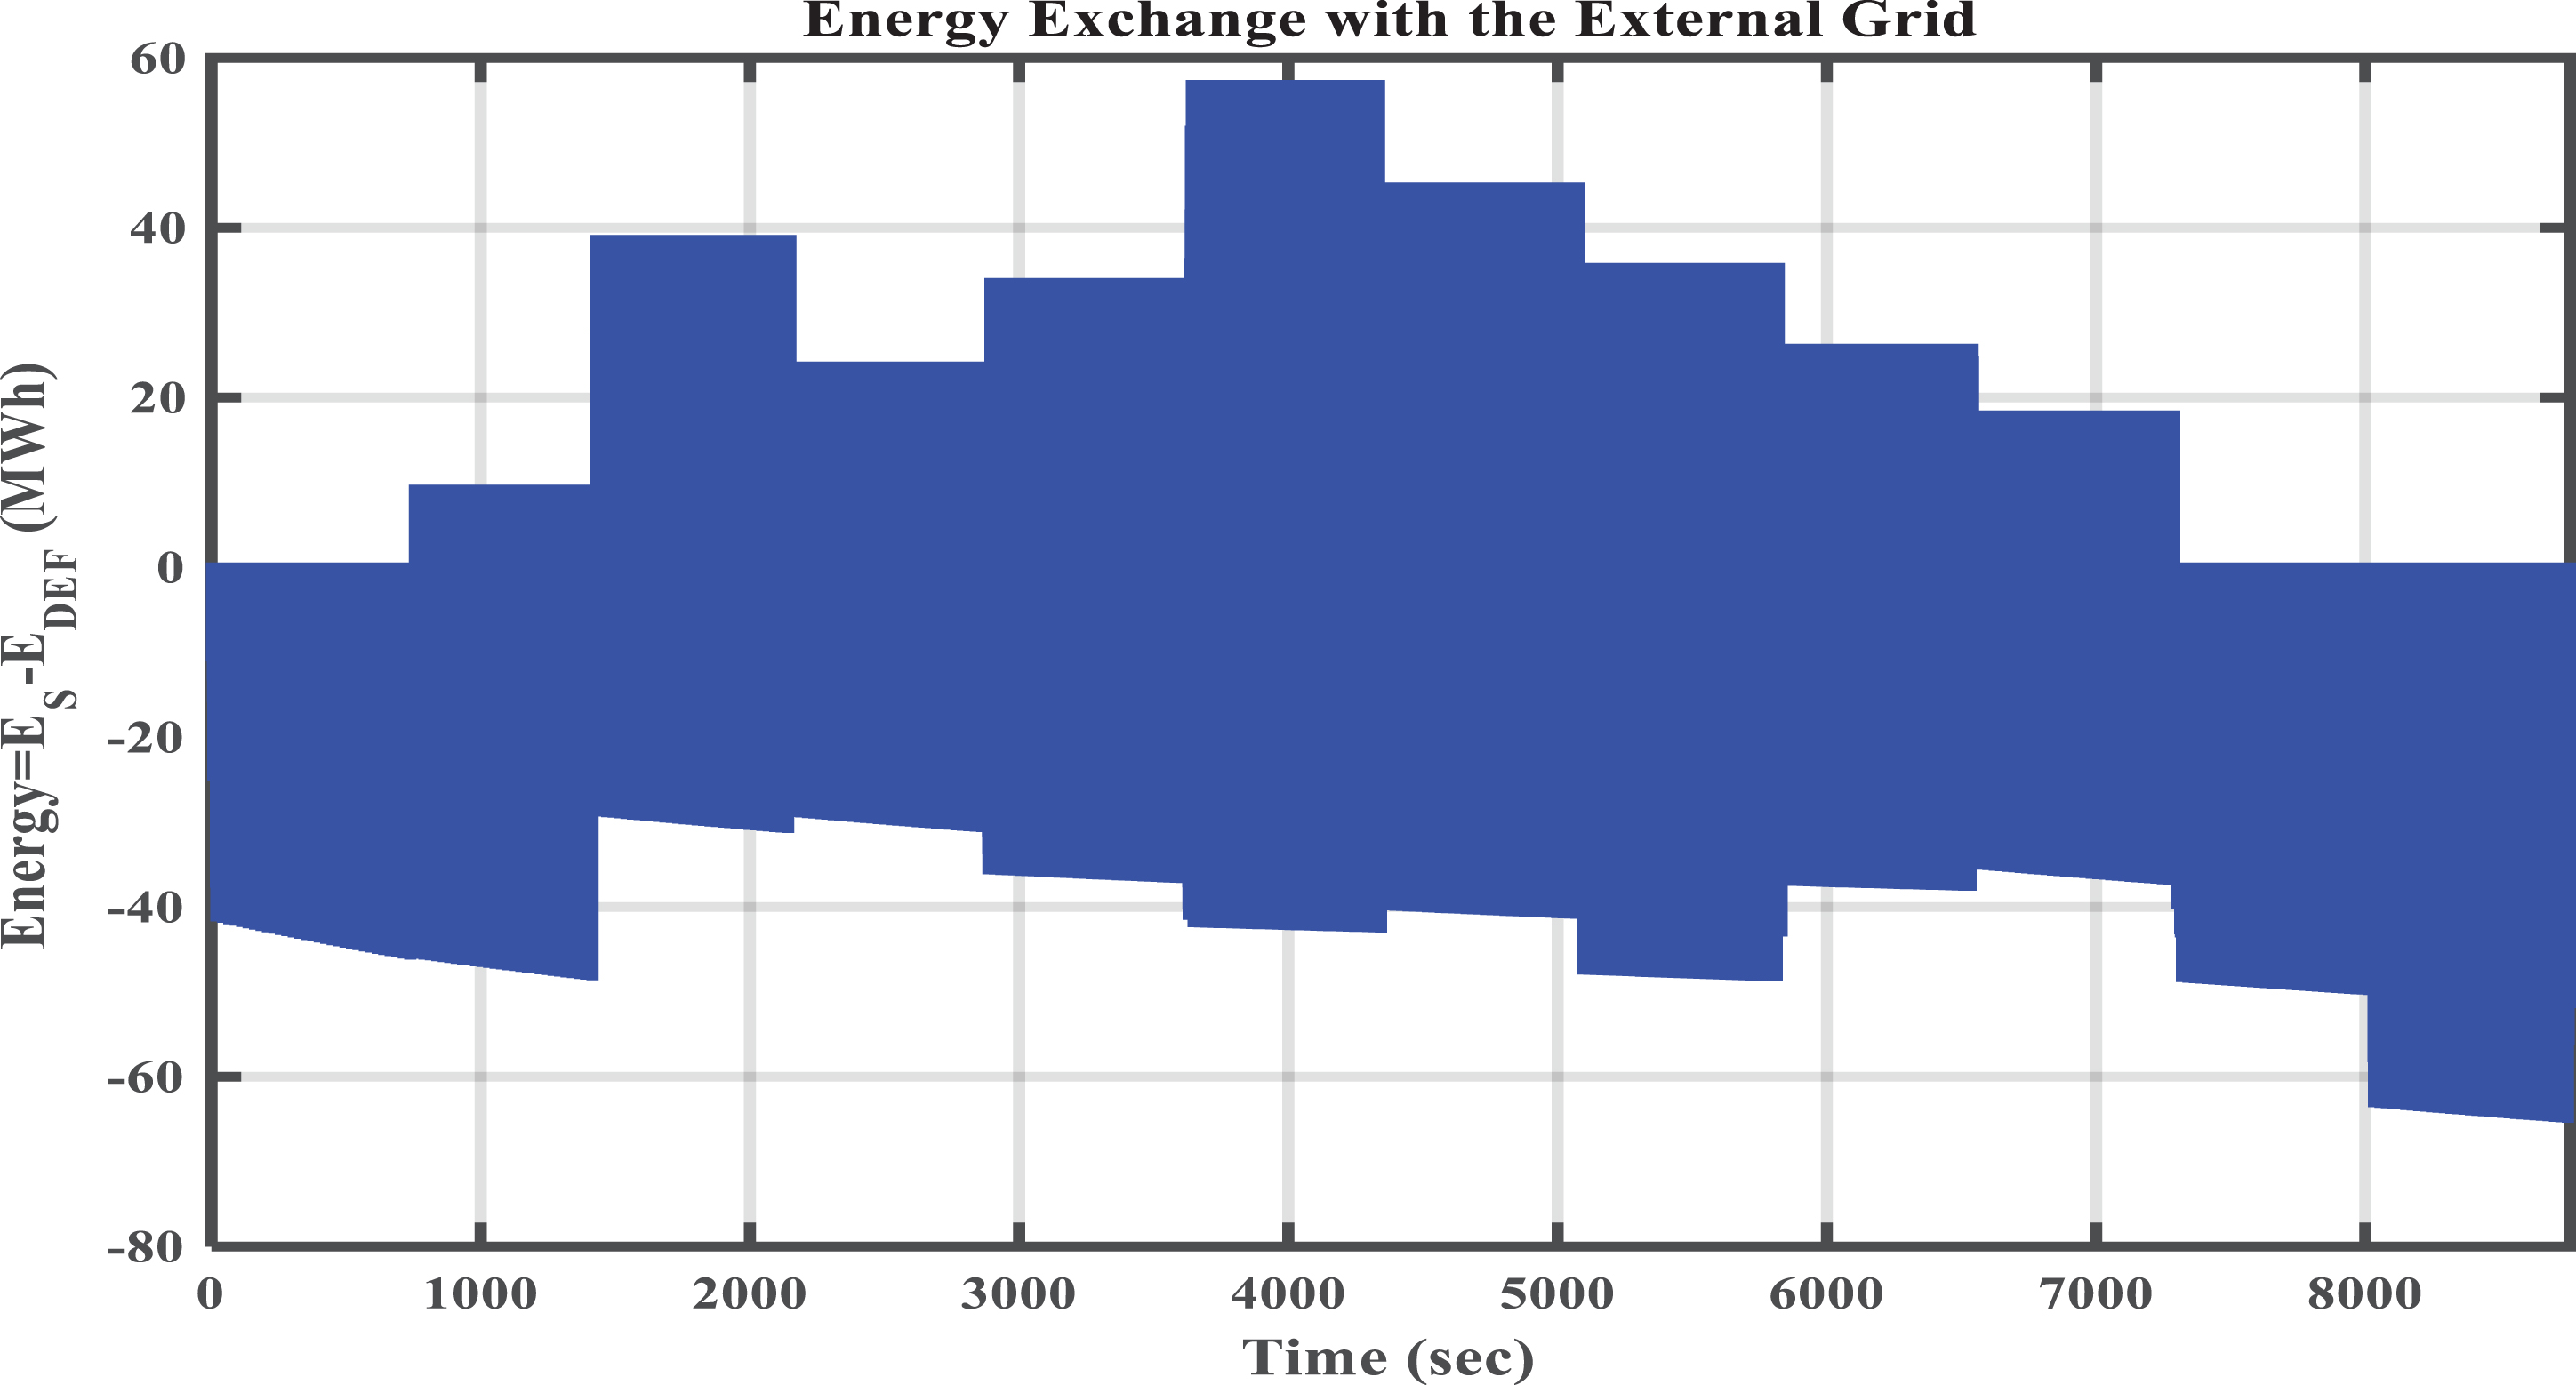
Hourly energy exchange with the grid over the year.
To find the optimal configuration of the upper reservoir volume and the capacities of the pump and turbine-generator various scenarios have been studied as shown in Table 2.
Various scenarios to find the optimal configuration
Figure 9 shows situation (S1) where the energy surpluses surpassed 10% of energy request, though over 60% of interest was secured from sustainable wellsprings of energy. In different situations, the level of energy surpluses is altogether littler and not more than 5.18 % of the heap request, with the least worth somewhat above 0.2%. In all situations in this investigation, the aggregate of yearly energy request was 650.34 GWh. As appeared in Fig. 8 with the use of a siphoned stockpiling framework for situations S2 to S8, the shortages have for the most part been supplanted by the generated energy from the hydropower plant. Quite, in all situations the volume of energy request secured from the inexhaustible sources stays steady and the offer from the hydropower plant increments step by step. In situation S8, over 35% of the interest is secured by the capacity framework. Also, this comes at the abatement of the unforeseen energy stream from the framework (shortages) and to it (surpluses) as appeared from the cumulated segment beneath. The outcomes displayed beneath show that the power framework administrator needs to change the power plant activity for different estimations of energy stream between the crossover control framework and the national lattice.
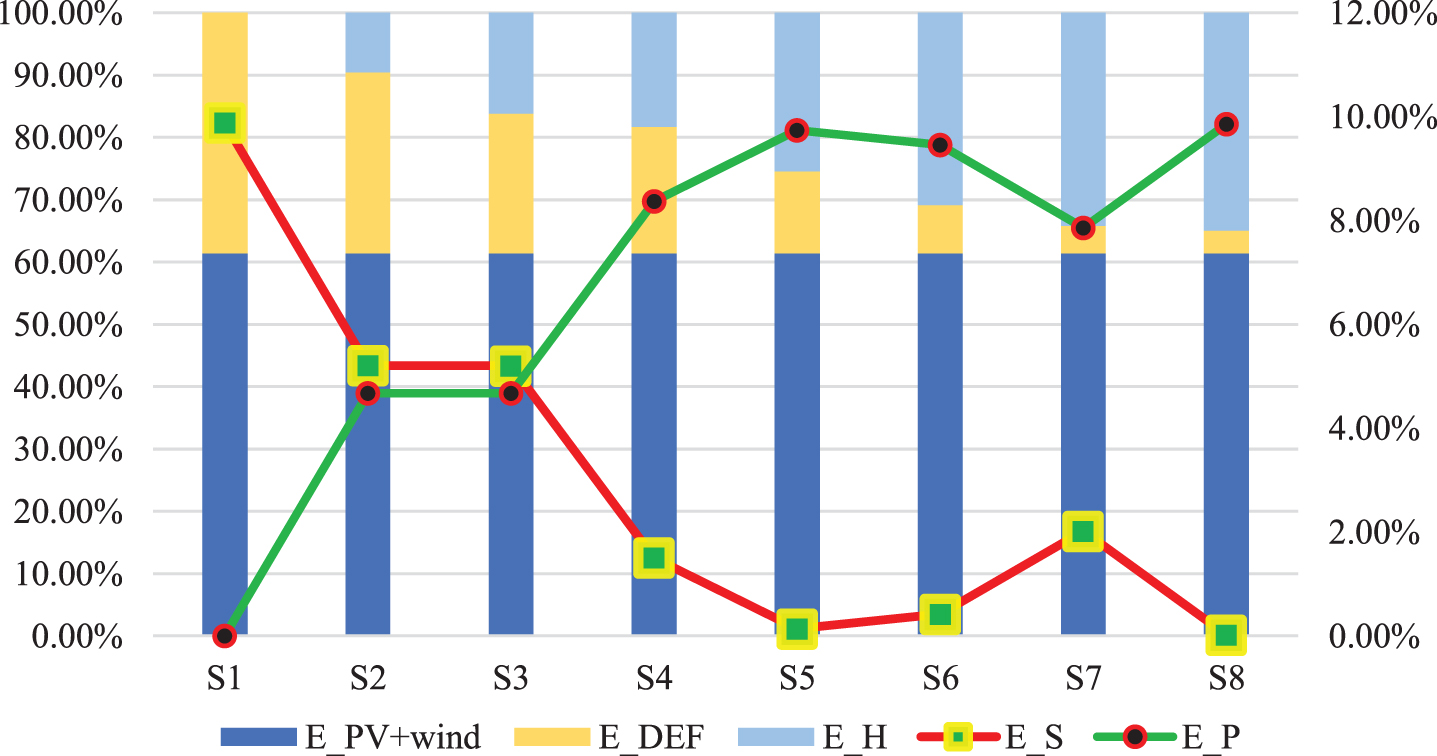
The distribution of energy demand between individual energy sources.
The proposed SSA methodology has been applied to perform sizing and optimization of HRES in order to supply the demand. The simulations were executed using one year hourly data of wind speed, solar radiation and ambient temperatures for the sites under study. In order to validate the SSA optimization technique, statistical tests have been performed. In Table 3, the indexes which have been applied in order to measure the performance of the SSA algorithm are presented. The indexes estimate the best minimum value of the objective function (F min ) and record the objective function value at each time of run (F i ).
Statistical indexes for evaluating the performance of SSA technique
The results demonstrate that the SSA optimization approach has an acceptable root mean square error (RMSE). Furthermore, the standard deviation (SD) validates that the proposed approach based on the SSA algorithm has satisfactory stability. Moreover, the best minimum value of the objective function F best is 3.9113 and the worst maximum value of the objective function was 4.0027.
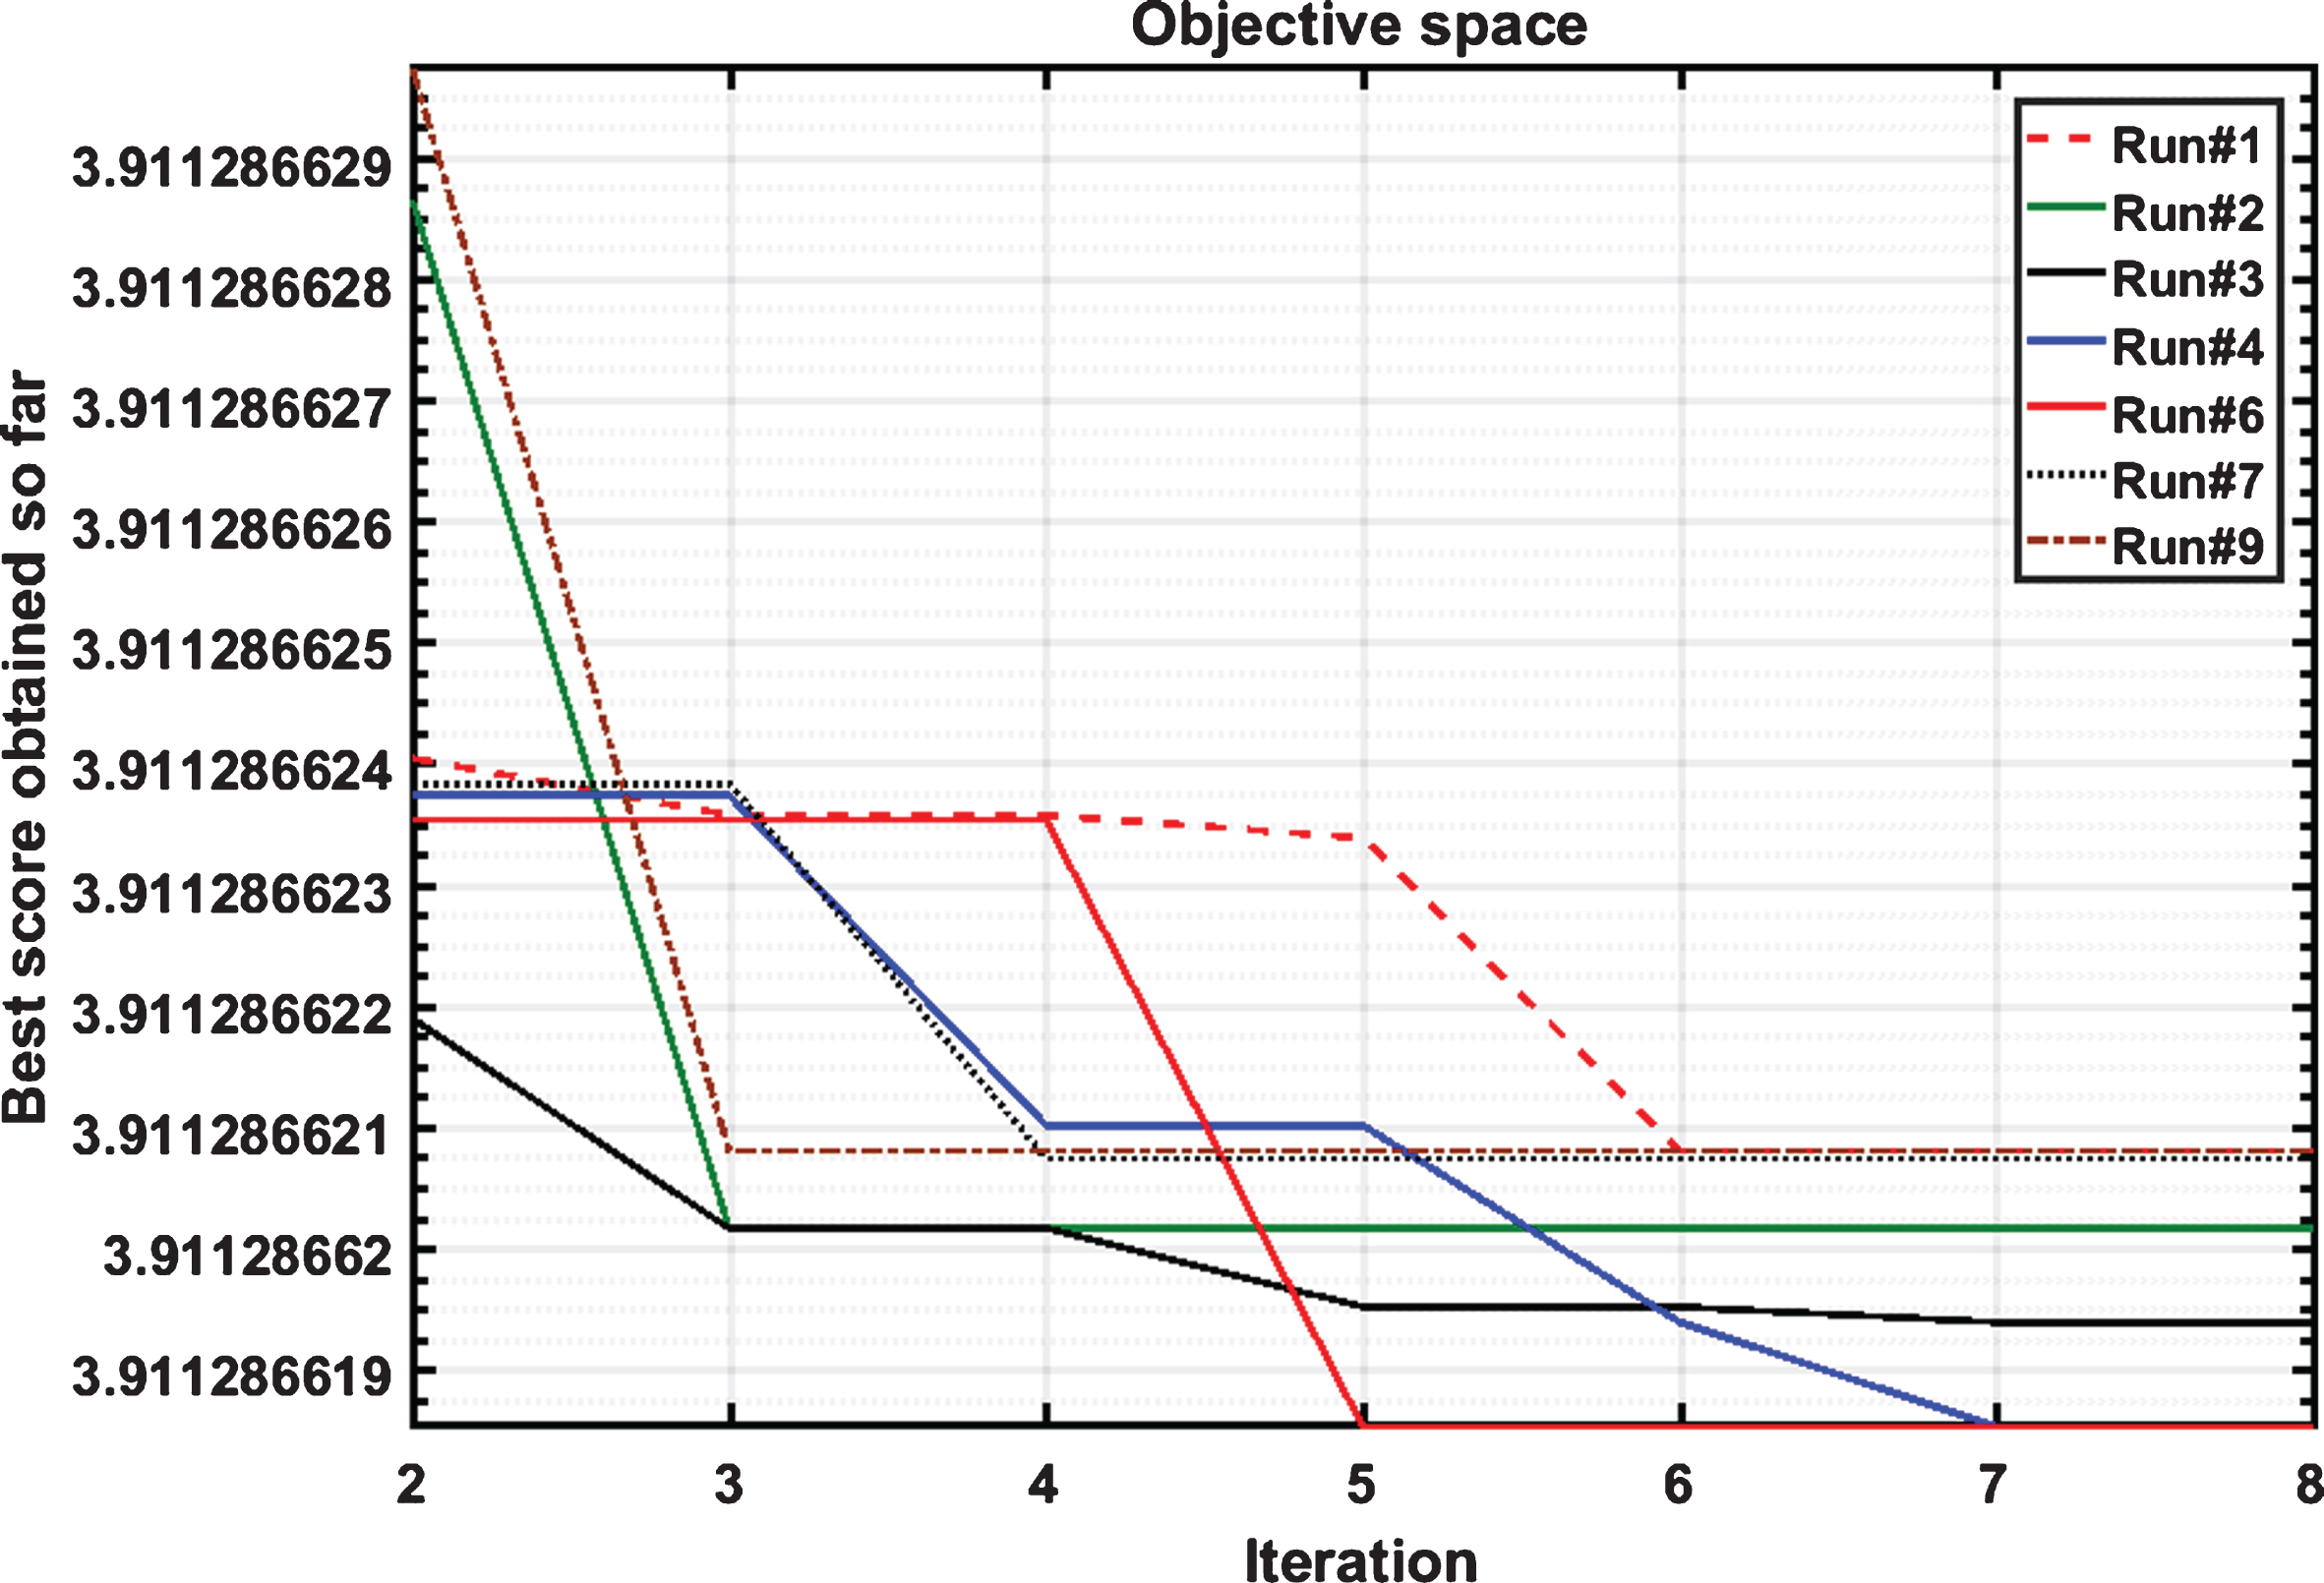
The SSA optimization algorithm is executed 10 times of run. Figure 10 shows the convergence curves of the proposed approach under different executions. The figure validates that the system has good convergence curves. Moreover, the SSA technique can reach the global minimum value of objective function several times with well convergence speed.
SSA convergence.
To evaluate the performance of SSA algorithm, it has been executed many time with population size = 3, iterations no. = 50, and executions no. = 50 run, and the statistical performance is shown if Table 4. From the simulation results, it is clearly indicated that the proposed hybrid renewable energy system model is economically and environmentally feasible in comparison with other conventional power generation systems.
Evaluation of statistical performance of SSA
This investigation has been completed a structure and a monetary practicality evaluation of a grid-connected framework considering pumped storage. The proposed procedure relies upon the meteorological information of wind speed, sunlight based radiation and temperature. Slap Swarm Algorithm (SSA) has been used to minimize the total cost of the framework to supply the power request of average houses situated in a predefined site. MATLAB programming has been used to set up the code utilized for the estimating of the framework under examination. The proposed calculation guaranteed great execution, particularly with the immense number of factors. Besides, the global minimum value of the objective function has been obtained rapidly and in a brief span contrasted with other optimization algorithms. From the analysis and simulation results it can be said that the analyzed hybrid energy system will be applicable for all over the world where the environment and other situation would be same. The results demonstrate that the SSA optimization approach has an acceptable root mean square error. Moreover, the standard deviation validates that the proposed approach has satisfactory stability. Furthermore, the best minimum value of the objective function is 3.9113 and the worst maximum value of the objective function was 4.0027. The proposed hybrid system also ensured the reduction of CO2 emission about 1600 tons per annum which indicates a significant environmentally friendly effort to the earth.