
Abstract
Ever increasing ordinal variables are being collected by the Personal Credit Reference System in China, however this system suffers from analysis of this kind of data, which cannot be calculated by Euclidean distance. In this study, we put forward a hybrid KNN algorithm based on Sugeno measure, and we prove that the error of this algorithm is smaller than that of Euclidean distance, furthermore, we use real data obtained from the Personal Credit Reference System to perform experiments and get the user’s initial portrait. Through the comparisons with Kmeans algorithm and other different distance measures in KNN algorithm, we find that the hybrid KNN algorithm is more suitable for clustering personal credit data.
Introduction
In 2013, China promulgated regulations for the management of the credit industry, which expedited the introduction of the Credit System. In 2014, China issued “the outline of credit system construction plan” (2014–2020), which proposed to build the society’s entire credit system on the basis of information resource sharing. In 2015, eight institutions were permitted to conduct personal credit investigation services. By the end of June of 2017, there were 92.6 million personal credit reports in the Credit System. Between January and May of 2017, the average daily number of personal credit report queries was 3.43 million.
Basic consumer data, mortgage data, and credit data are the main foundation of the Credit Reference, and the development of big data provides the possibility of exploring deeper data applications. With increasing demands for credit information, user classification and user portraits are keys to the practical application of credit information. Therefore, it can be said that user classification is the first step in the credit information process, which restricts the application value of the information as a whole.
Research on user personas in the Personal Credit Reference System is limited but increasing, and a clustering algorithm is often used to classify users. Clustering algorithms are based on the measure of distance, and can be divided into four categories: hierarchical clustering, segmented clustering, mixed clustering, and grid clustering. For large datasets, KNN hierarchical clustering is shown to be the most widely used algorithm. Current research focuses on selection of the initial point and algorithm performance enhancements, but it is clear that the KNN algorithm always deals with numeric attributes. For frequency attributes, this algorithm is shown to be invalid, which greatly limits its application.
Meanwhile, there are many numeric attributes in the Credit Reference, such as the number of loans, the number of credit cards, and the number of mortgages. These are variables of distance difference and cannot be effectively measured using value, making this a Hybrid Intelligent System [1]. Similarly, it can be found that combination of demographic similarity and cosine similarity between users is a real problem for Intelligent Systems [2]. Thus, according to the fusion theory, KNN clustering based on Euclidean distance measure does not provide an effective solution for such customer classification problems. Because the traditional KNN is based on Euclidean distance, and Euclidean distance is calculated by variance, which measures the numeric difference between data value, while the actual frequency difference cannot be effectively described by variance. For example, there is a variable named “the number of query”, we can calculate the Euclidean distance between samples by its mean and variance, but it is meaningless, from the record, we know there are only positive integers in this variable, and intuitive difference between five queries and zero queries is 5, not the Euclidean distance.
To address this research gap, we explored the Sugeno measure under two sets of sequences, and then constructed a KNN cluster based on the Sugeno distance. We defined the set upper limit as the threshold for cluster combination. This new algorithm has a smaller distance error when dealing with ordered variables through theoretical analysis. Compared with the cluster based on Euclidean distance, Cityblock distance and Correlation distance it can be found that this hybrid algorithm is more accurate for exploring user personas.
This article is divided into six parts. This introductory part has explained the problem. The next part summarizes the research related to this topic. The third part focuses on the calculation of distance under the Sugeno measure and designs a dynamic clustering algorithm. The fourth part carries out experiments on the Personal Credit Systems using Sugeno distance and KNN dynamic algorithm. In the fifth part, the clustering results of this hybrid algorithm are compared with Kmeans, and preliminary robust check of different distances are summarized. The last part discusses the findings of this study and provides a conclusion.
Literature review
Current research on the Personal Credit Reference System is relatively scarce. Many previous research efforts focused on the description of consumer credit behavior, including studies by Mikhed and Vogan [3]. According to the findings of Mikhed and Vogan, a clustering algorithm is often used to analyze consumer characteristics.
Clustering algorithms can be divided into four categories: hierarchical clustering, segmented clustering, mixed clustering, and grid clustering, as discussed by Bonchi, Garcia-Soriano, & Liberty [4] who found KNN hierarchical clustering to be the most widely used algorithm. Current research focuses on the selection of initial settings [5–10] and algorithm performance enhancements [11–15]. Scholars usually think that KNN algorithm has less ability to deal with the sample set with large density difference. Bhattacharya, Ghosh and Chowdhury [16] propose similarity function using this affinity function to classify the test patterns and then use KNN to conduct clustering. They gave a basic idea of improvement, which can be adopted by using different distance and separating clustering process. In the research of Deng, et al. [17], they argue that KNN is a lazy learning algorithm, so they propose to conduct a KNN clustering to separate the whole dataset into several parts at first, and then based on these separate parts, they let KNN to learn, and with big data sets their experiments show better performance. Later, Chen, et al. [18] find that KNN algorithm has the ability to deal with density difference problem. Gou, et al. [19] propose local mean representation-based k-nearest neighbor classifier, which they think will be better for small training samples and more robust with different density, but they only conduct experiments with UCI data. According to the research of Zhang, et al. [20], they use correlation matrix to reconstruct KNN algorithm by training data to assign different k values to different test data points, they also find that the KNN algorithm can only deal with numeric attributes, and for frequency attributes this algorithm is tested to be ineffective, greatly limiting its application. Jo and Hwang [21] find that KNN can classify text through string vectors, which have a good performance in text summarization.
Sugeno [22] proposed a special fuzzy interval set, named the Sugeno set, in his doctoral thesis. Klement, Mesiar, and Pap [23] designed an integral operation in monotone sequence according to this set, but the Sugeno integral proposed by Klement, Mesiar, and Pap can only deal with the horizontal order set. Agahi [24] discussed the operation of the partial inclusion sequence in his research. Smrek [25] proposed a general construction method for aggregation operators with the integrals of Choquet, Sugeno, and Shilkret. Halaš, Mesiar, and Pócs [26] introduced a characteristic Sugeno integral, that is, congruences, and stressed that it can be used in the multi-criteria decision. Hala, Mesiar, and Pócs [27] studied compatible aggregation functions on a general bounded distributive lattice of the Sugeno integral. Dubois, et al. [28] generalized the concept of the Sugeno integral, which can be split into two functions, one based on a general multiple-valued conjunction and one based on a general multiple-valued implication. Brabant and Couceiro [29] discussed the use of this parametrized notion in preference aggregation and learning. Shubair, Ramadass and Altyeb [30] propose kENFIS, which partitions the input space into clusters by using a new designed KNN-based evolving fuzzy clustering method and organizes the rule base using Takagi-Sugeno method, and they deployed this method into worm detection. Wang, et al. [31] argued fuzzy fractal dimension can reflect the dynamic structure and topological structure of complex network, it can be used by first-order Sugeno fuzzy approximator to reduce dimension. Increasing numbers of research efforts began to explore the usage of the Sugeno integral, including those works such as [32–36].
Generally speaking, clustering with categorical variables can be challenging, and most clustering methods have difficulties detecting clusters of hugely different densities in a dataset. According to the research of Agahi [24], Sugeno integrals are aggregation operations involving a criterion weighting scheme based on the use of set functions. However, the categorical variables cannot always be clearly bounded, as found by Ezequiel Opez-Rubio [1]. Therefore, how to control the combination of clusters is the key problem in the application of Sugeno integrals.
Method
Because the setting of distance and the selection of initial point are the key to affect the clustering algorithm, we use Sugeno measure method to explore the clustering, which is focus on the monotonic sequence, and gives the distance within fuzzy sets.
The Sugeno measure uses sequence to calculate different element sequence distances. Thus, in our research we used distance as the basis for clustering. If set sequence {A n } meets A1 ⊆ A2 ⊆ … ⊆ A n , it is called a monotonic sequence, and we can define it as A n ↑. And this work can be found in Sugeno [22].
Method
h
λ
(X) =1; h
λ
(A ∪ B) = h
λ
(A) + h
λ
(B) + λh
λ
(A) h
λ
(B)
then h
λ
is defined as the Sugeno set.
By the definition of the Sugeno integral h (x
i
) ⩽ h (xi+1), it can be represented as
So, the clustering algorithm can be designed as follows:
For the X = {x1, x2, …, x
n
}, we calculate the mean and variance, and then transform each element to
The method for extracting the characteristic elements is orthogonalization, which is described as follows: z1 = x1,
Using
Mark the farthest records between two cluster as z d = {{zd,1} , … {zd,s}}, zn-d = {{zn-d,1} , … {zn-d,s}} and so on.
Calculate the distances between the farthest records and within the maximum range of threshold λ for r ij , we combine the classes as Cd′ = C d ∪ {zn-d}.
This process is repeated until all elements have been clustered.
Termination follows when two conditions are satisfied: one is that all of the elements have been clustered, and the other is that all of the distances are greater than the threshold λ. Then, the clustering results can be controlled by the threshold λ.
For a sample, if the included information of multiple indexes is described by fuzzy numbers, the sample can be regarded as fuzzy sample. For M fuzzy samples under N indexes, each fuzzy sample in the fuzzy sample set
Euclidean distance between the fuzzy numbers of two fuzzy samples (
Intuitively, aiming at calculating the distance
In spite of easy understanding, the calculated distance can increase the error. Here, a new distance, named Sugeno distance, is defined, which can lead to smaller error. The conclusion will be proved in detail later. Next, the definition of improved Euclidean distance is described. For the domain of discourse
Equation (3) takes full consideration of the distance between two fuzzy samples (
Moreover, let e
Σ
(i, j) to be total error,
In a word, using fuzzy distance can better distinguish the key features of categories, and fuzzy distance has less total error than Euclidean distance.
Data preprocessing
In this experiment, we used a credit card database as the sample, as provided by the Personal Credit Reference System in China. The data set ranges from 2004 to 2009, with a total number of 65,536 accounts and 31 variables.
Firstly, we explored the basic information of accounts. In this sample, there are more than 40% of users with a bachelor degree or above. Nearly 80% of users are married. Users in the Personal Credit Reference System are mainly from Beijing, Jiangsu, Shanghai, Shandong, Zhejiang, and Guangdong. All of these regions in China are developed, and we can state that the regional distribution of this sample is reasonable and representative of all users.
Next, we examined the development of accounts. We examined trends in the ratio of debit accounts, the ratio of credit accounts, and the number of effective accounts, as shown in Fig. 1.
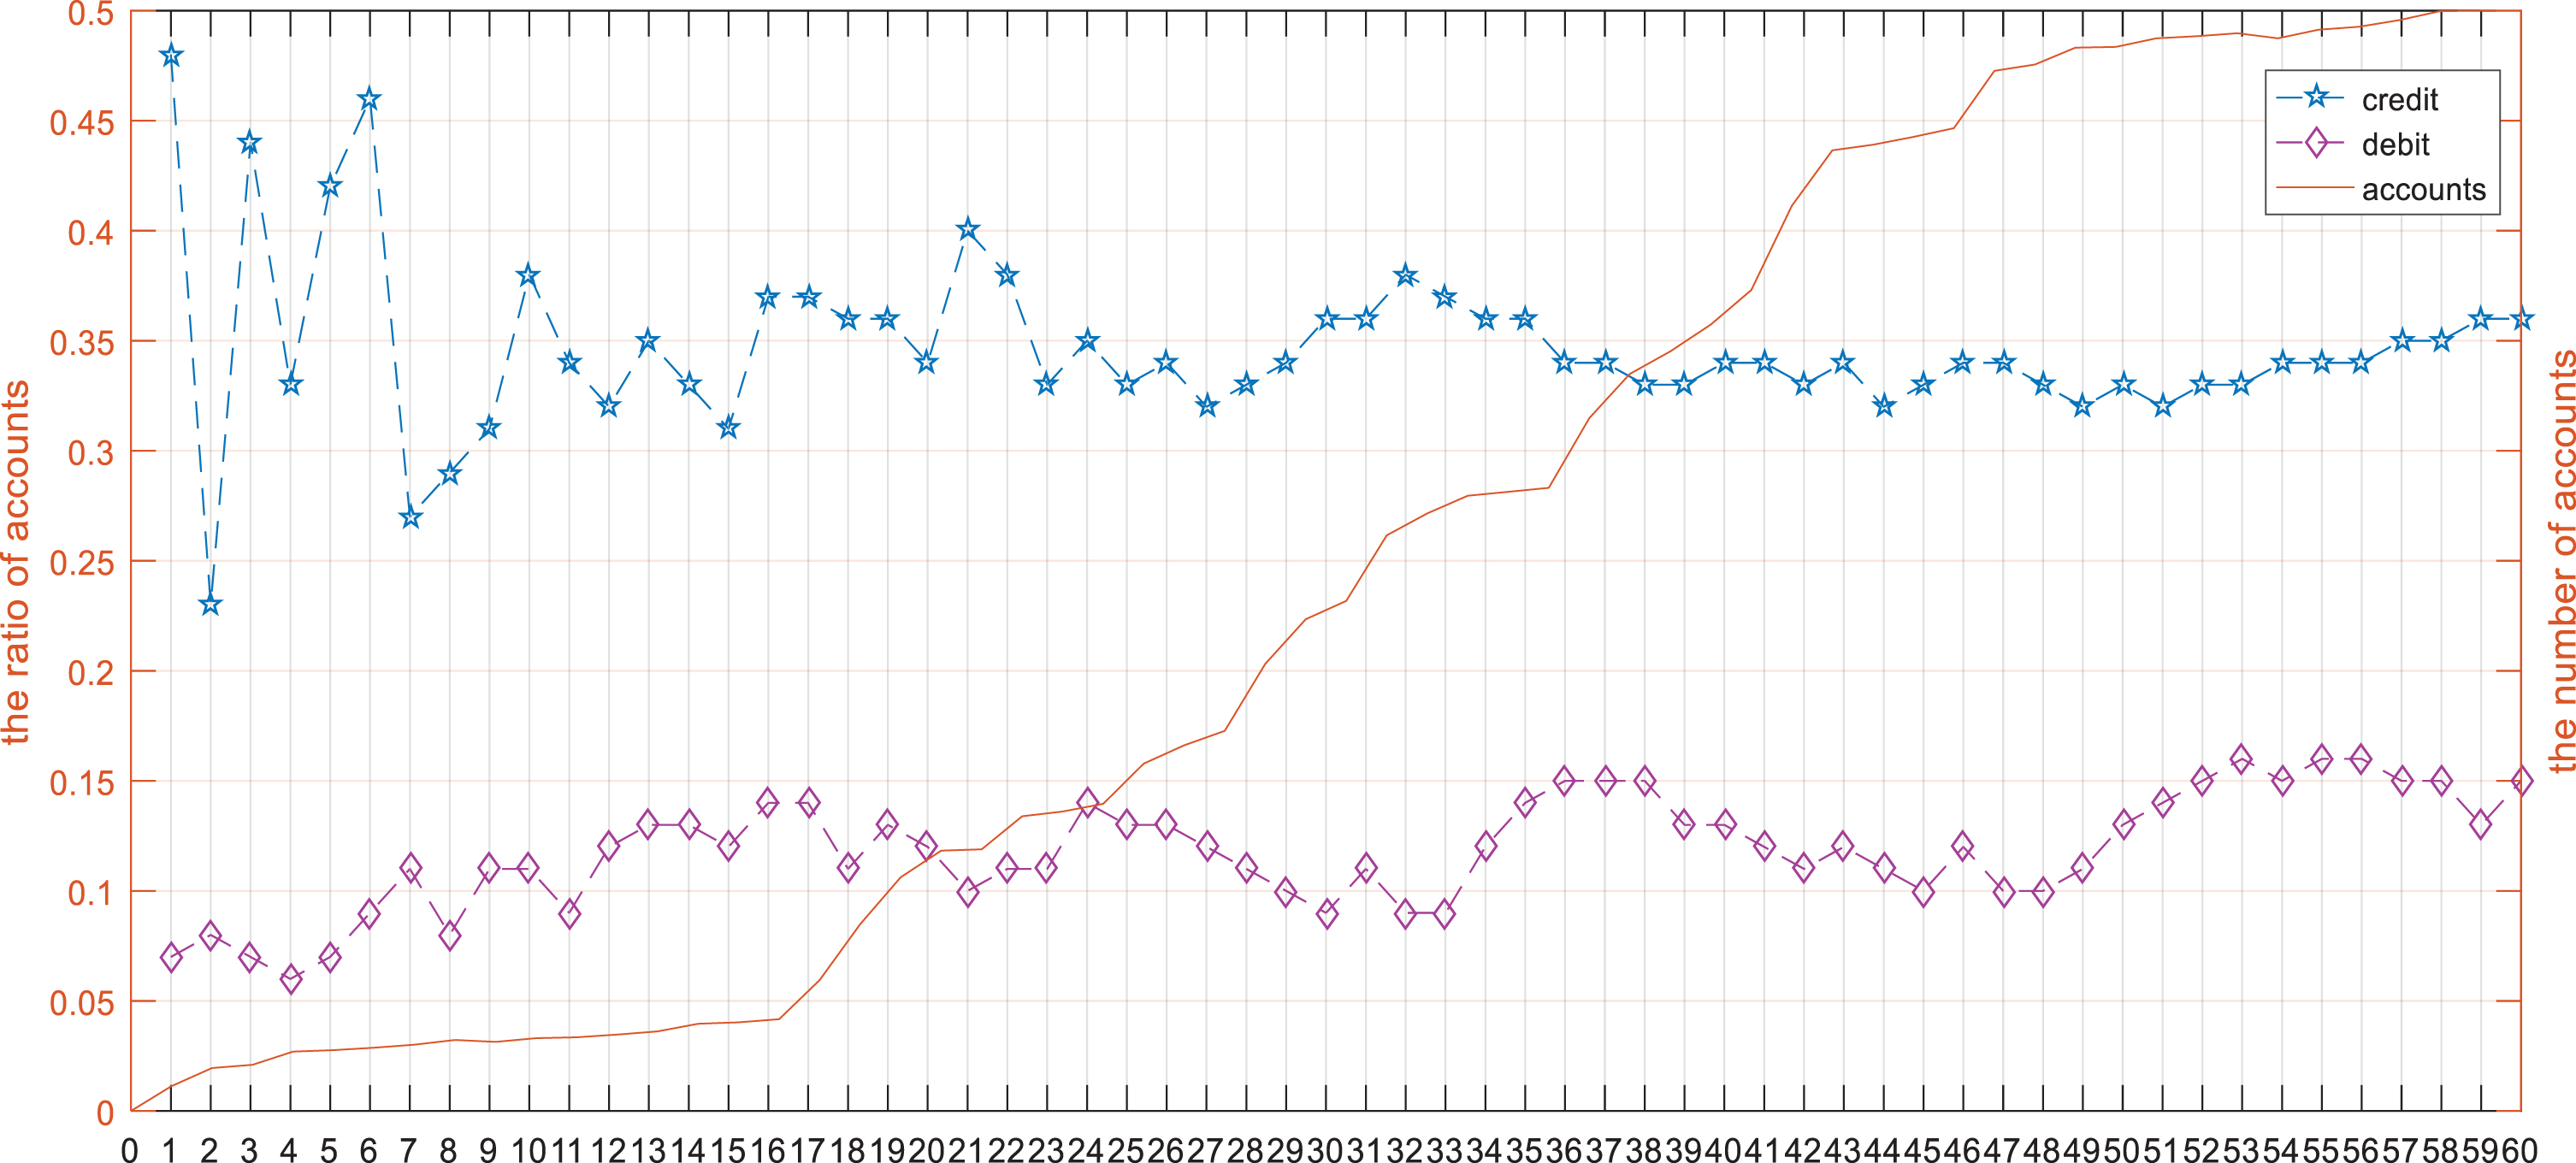
The trend of accounts and the ratio of credit/debit.
From Fig. 1, we can see that the number of accounts showed rapid growth with an almost exponential trend until 2008. The growth then slowed, and the trend approached stability. The ratio of credit accounts changed rapidly initially, and then varied at a level between 30% and 35%. The ratio of debit accounts changed relatively less than the ratio of credit accounts, and has been around 10% and never over 16% in last five years. Therefore, it can be said that the users in this system have become stable, and we can use these samples to perform clustering.
Furthermore, in order to check whether there were any great changes in the sampled accounts, we took average annual income and average total debt to explore the trend of economic attributes in individual accounts, as shown in Fig. 2.

The trend of average annual income and average total debt.
From Fig. 2, we can see that between 2004 and 2005 the average total consumer debt changed rapidly. After 2006, the average total user debt growth became relatively stable. Meanwhile, it can be seen that the average annual income increased, almost following a line, and its speed of growth was much less than that of the average total debt. Nonetheless, it can be inferred that average individual annual income and average individual total debt have become stable in recent years, and these samples can be used to represent all consumers in the system, and so the clusters are reasonable and stable. The sample for analysis comprises consumers in the Personal Credit Reference System with dates after 2006, and there are 53,892 records.
In order to make uniform the distance of the variables, we segmented the continuous variables, and the details are shown in Table 1. The observations marked with blue are the variables that were deleted for a certain reason.
Variables and data preprocessing
Then, we used maximum/minimum-normalized processing to put all of these records into an interval [0, 1] in order to calculate the distance matrix of the sample, to give the distance the same dimension.
According to the clustering algorithm, we explored the orthogonal process to find the characteristic elements in 31 variables, as described in step 2 of the algorithm. It was found that there were 10 variables in the results, which were gender and marital status (x1), the number of queries(x2), education degree (x3), industry (x4), the number of guarantees(x5), the number of credit cards (x6), the number of loans (x7), credit balances (x8), total debt(x9), and annual income(x10), listed by their variance.
With the 53,892 records and initial 10 variables, we used the maximal number of occurrences to determine the initial number of clusters and used the mode of the final cluster to determine the initial record core.
We explored the results by constructing a diagram to show the relationship between cluster number and Sugeno distance, as shown in Fig. 3.

The number of clusters and the distance.
From Fig. 3, it can be seen that for distances between 13 and 18, the number of clusters is always 30, which is most representative of the experimental results and is the flattest area in the figure. Therefore, we set the number of initial clusters to 30.
The clustering growth process was performed using MATLAB 2016a, with the 30 initial classes. The clustering process is shown in Fig. 4.

The combination process of clusters.
As shown in Fig. 4, there are five prominent peaks in the graph, and so we inferred that the number of final clusters was five. Furthermore, we summarized the growth process in as shown in Table 2.
The summary of dynamic clustering
The final distance was found to be λ = 2, and the records in different clusters were not equal. Category 5 had the most records, and category 4 had the least. The maximum distance within categories was almost equal, and so it can be said that it was concentrated within classes. Category 4 had the largest distance, which was evidently different from the others. According to the distance out of category, we found that categories 2 and 3 had the tendency to combine with category 1, and category 4 had the tendency to combine with category 5. We also explored the modes of the 10 core variables within these categories, and the results are listed in the Table 3.
The modes of 10 variables with 5 categories
Using the χ2 test, it was found that 8 of the 10 variables were different at the 95% significance level for category 1 and category 5; gender and marital status (x1) and the number of guarantees (x5) failed the test. Five of the 10 variables were different at the 95% significance level for category 1 and category 3; gender and marital status (x1), education degree (x3), industry (x4), total debt (x9), and annual income (x10) failed the test. Seven of the 10 variables were different at the 95% significance level for category 3 and category 5; gender and marital status (x1), the number of credit cards (x6), and total debt (x9) failed the test.
Comparison with K-means
In order to compare the new algorithm with other algorithms, we used the same sample to perform experiments under Euclidean distance using K-means. The experiment is done using the same software Matlab 2016a. The algorithm finished with 13 categories, but the results were confused and the maximum distance was larger than the dynamic clustering algorithm. The details are shown in Tables 4 and 5.
The cluster summary of K-means algorithm
The cluster summary of K-means algorithm
The modes of 10 variables with 13 categories
From Table 4, it can be found that the distances within categories are larger than Sugeno KNN, moreover, it can be inferred that features are quite confusing compared with Sugeno KNN, just because the modes are not effectively separated among different categories with Table 5.
For hierarchical clustering algorithm, the setting of initial point and the selection of distance are the key factors affecting the whole clustering results. In the research of Zhang, et al. [20], they argue that the setting of initial point can be adjusted during the learning process, thus the distance may be the most important key factor for the total performance of KNN.
Based on this, we conducted a few robust check experiments using different distance with KNN algorithm, here we chose a typical dataset “German Credit Card” which can be get from http://archive.ics.uci.edu/ml/datasets/statlog+(german+credit+data). In the data set, there are 20 predictors and 1 response variable.
Because there are fewer continuous variables in this data set, which are age and income, we divide them into discrete segments. Because there is no text variable, we only choose Euclidean distance, Cityblock distance, Correlation distance and Sugeno distance to compare. The result of Confusion Matrixes can be found in Fig. 5, and the confusion matrixes are constructed with 70% training samples and 30% validating samples.
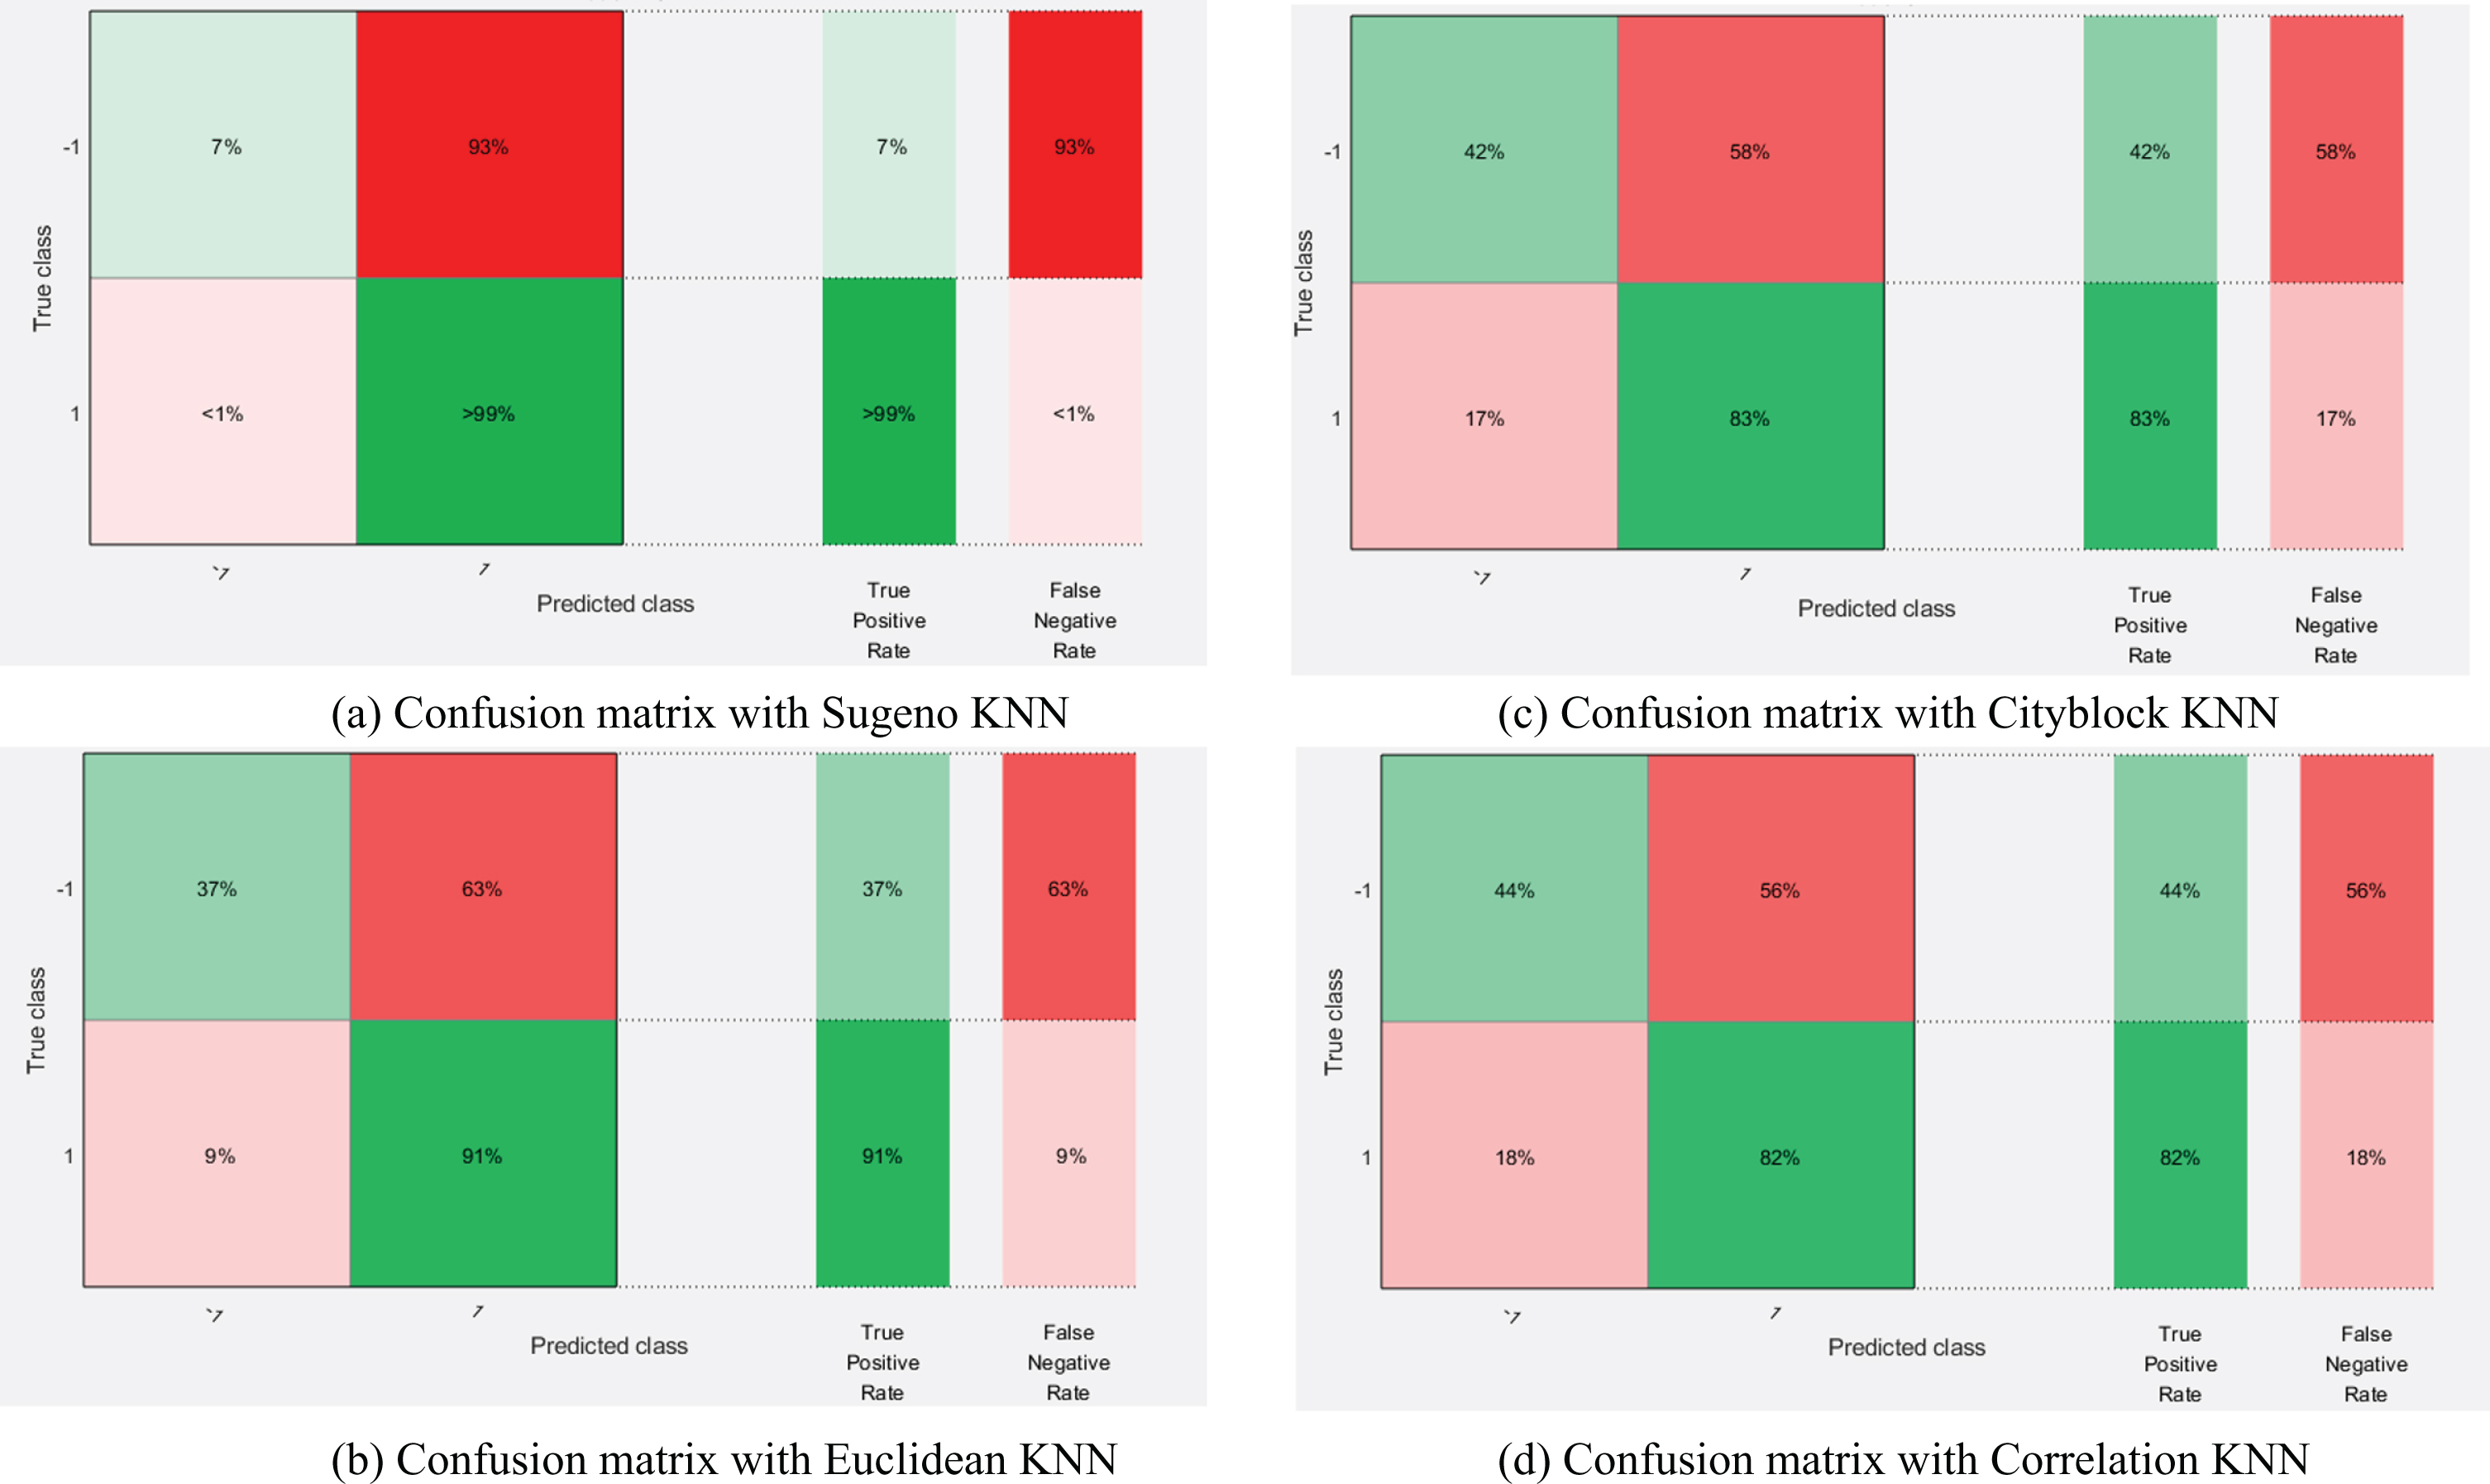
Confusion matrix with different KNN algorithms.
According to a series of different threshold, we chose ROC to conduct the further comparison. The result of ROC can be found in Fig. 6.
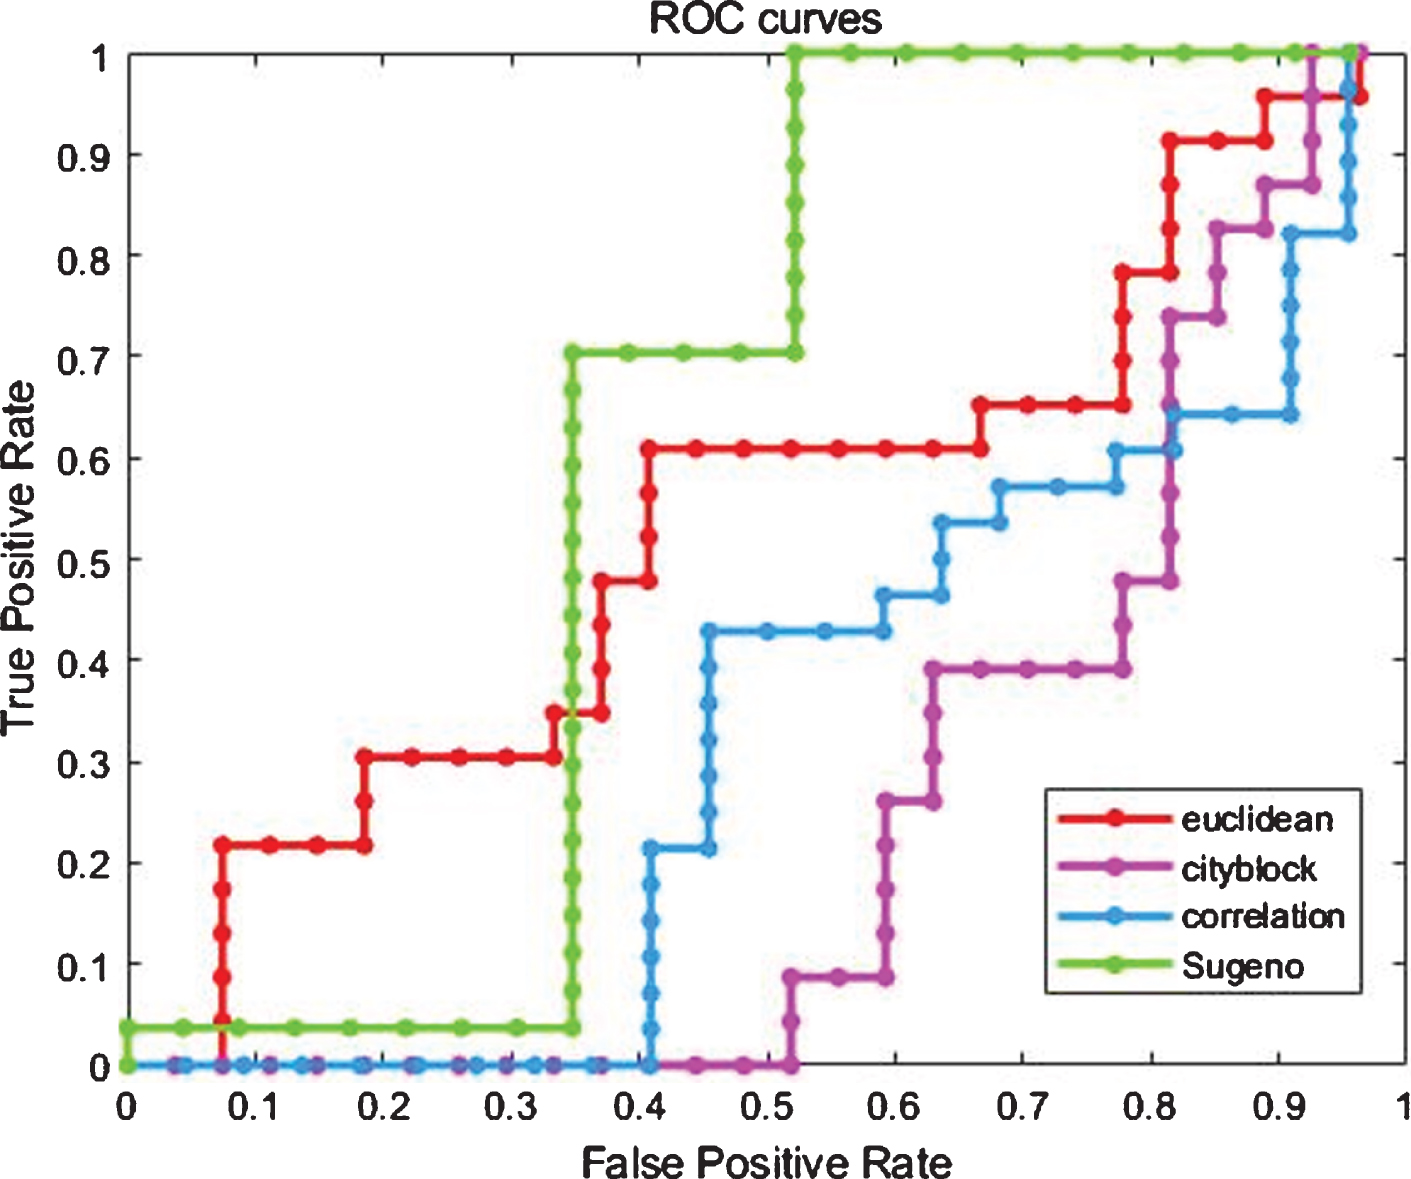
ROC curves between different distances.
From Fig. 6, we can find that Sugeno KNN algorithm has a faster accuracy improvement with the expansion of the number of samples. At the same time, the Area Under Curve (AUC) of the algorithm is also the largest among several algorithms. So to some extent, it can be shown that Sugeno KNN algorithm has better effect on the clustering of discrete data.
In academic research, clustering algorithms are often implemented for user classification. The clustering algorithm is based on the sample distance measure. In large datasets, the most commonly used algorithm is the KNN hierarchical clustering algorithm, which uses Euclidean distance. Current research focuses on selection of the initial cluster center and performance improvement. KNN has been shown to provide good results with numerical attributes, but, for ordinal variables, the clustering algorithm is invalid. With the Personal Credit Reference System in China, there are many ordinal variables, such as the number of queries, the number of credit cards, and the number of loans. The difference between these variables cannot be measured by Euclidean distance. Therefore, the KNN algorithm cannot solve this problem.
By using partial order integral under Sugeno measure, we constructed Sugeno distance between two class sets, and then we reconstructed dynamic clustering algorithm through controlling the combination of classes by the cut-off threshold. The most advantage of this algorithm is that it can deal with ordinal variables, which has no meaning in Euclidean distance, so it is more suitable for the database which has a great number of ordered variables.
We used real data obtained from the Personal Credit Reference System to perform the analyses, and unified metric variables between the Sugeno distance, selected the preliminary category variables, explored the threshold test to design the initial setting, and finally experimented with the dynamic clustering algorithm through a consolidation process.
Through experimentation, it was found that credit users can be divided into five categories. The three main categories can be summarized as middle-income conservatives (category 1), middle-income activists (category 3), and high-income high leverage activists (category 5). Furthermore, it can be seen that in the Personal Credit Reference System, user portraits can be drawn from the two basic dimensions, which are income and credit.
However, the Sugeno measure is based on the finite order. If we deal with infinite order, the result is not clear. In this study, all of the continuous data have been segmented, so the segments have a great effect on the final result. Furthermore, just as for other clustering algorithms, the initial settings also affect the final result. Therefore, further discussions are necessary to elucidate the segmentation of continuous intervals and the initial settings. Moreover, the theoretical error of this algorithm requires future study.
In summary, user classification is the first step in credit information extraction, which restricts the application of the Personal Credit Reference System. There are a large number of ordinal variables in the system, so clustering using Sugeno measures is more practical and reasonable.
Footnotes
Acknowledgments
The work was supported by Visiting Scholar Grant Program of China Scholarship Council for Han (No. 201806495014), and the Fundamental Research Funds for the Central Universities.