
Abstract
This study introduces a dynamic decision architecture that involves three steps for corporate performance forecasting as such bad performance has been widely recognized as the main trigger for a financial crisis. Step-1: performance evaluation and integration; Step-2: forecasting model construction; and Step-3: knowledge generation. First, the decision making trial and evaluation laboratory (DEMATEL) is incorporated with balanced scorecards (BSC) to discover the complicated/intertwined relationships among BSC’s four perspectives. To overcome the problem of BSC that cannot yield a specific direction, the study then employs data envelopment analysis (DEA). Apart from previous studies that utilize an all embracing one-stage model, this set-up extends it to a two-stage model that calculates the performance scores for each BSC perspective. By doing so, users can realize a company’s weaknesses and strengths and identify possible paths toward efficiency. VIKOR is subsequently used to summarize all scores into a synthesized one. Second, the analyzed outcomes are then fed into random vector functional-link (RVFL) networks to establish the forecasting model. To handle the opaque nature of RVFL, the instance learning method is conducted to extract the implicit decision logics. Finally, the introduced architecture, tested by real cases, offers a promising alternative for performance evaluation and forecasting.
Introduction
In today’s highly volatile and competitive business environment, companies are encountering more severe challenges (such as the demand for quick order fulfillment, fast delivery, and short lead time) than ever before [44]. With growing interdependence among companies in their supply chain, risks of all types - including financial difficulties, depressed economic atmospheres, operational troubles, cultural dissimilarities, labor cost problems, and political issues - can promptly cascade throughout the whole supply chain and cause financial troubles or, even worse, turn into a financial crisis [8, 15]. Due to its harsh and negative impacts on the whole society, financial crisis prediction has attracted a high degree of attention over the decades, especially when the financial market is full of uncertainties.
Compared to the widely examined research fields of financial crisis prediction and credit default forecasting, works on company performance evaluation are quite rare. Kamei [25] indicated that bad operating performance can be used to account for 99% of financial crises - that is, bad operating performance is a stage leading up to a financial crisis eruption. Thus, an inevitable task appears in how to establish a performance evaluation architecture that not only provides synthetic information about efficiency and effectiveness of firm operations, but also generates a comparative assessment that is intuitive, simplified, and standardized [42].
The nature of performance evaluation is unfortunately multi-dimensional, and the traditional evaluation architecture tends to focus merely on financial indicators, such as return on investment (ROI) and return on assets (ROA) that only represent past outcomes and reveal little regarding expectations of future trends. Thus, there is an urgent requirement to construct an over-arching architecture that goes beyond financial measures and takes other measures into consideration, such as employee skills, customer satisfaction, and culture of innovation, which are fundamental for business development [27]. Balanced scorecard (BSC), introduced by Kaplan and Norton [26], is one of the best well-known and most widespread utilized frameworks for performance evaluation. The aim of BSC is to translate a company’s strategic objectives into a set of operational measures and to illustrate the cause-and-effect relations between strategies and processes through four perspectives: financial, customer, internal business process, and learning and growth.
The relations among these four perspectives play a critical role in performance evaluation, but most researchers consider them in a simple manner (i.e., unidirectional) [46]. However, it must be mentioned that other essential relations between these perspectives may exist. Looking at the possible relations among the four perspectives (i.e., network-based structure) may yield a more reliable and comprehensive outcome for decision makers to form their own judgments [1]. We believe that the network-based structure better captures the dynamics of the production processes and sub-processes as well as more clearly depicts the company’s real operational status.
The network-based structure is established based on decision making trial and evaluation laboratory (DEMATEL), introduced by the Science and Human Affairs Program of the Battelle Memorial Institute of Geneva in 1972 [20], and solves a group of complex and intertwined social problems. This technique helps decision makers to recognize the interrelated and entwined relations among evaluation criteria, which can assist them in identifying the influential directions and weights of the utilized criteria when making a judgment, such as Petrović and Kankaraš [41] and Liu et al. [34] who used it to identify the relations among attributes and eliminate less significant attributes so as to prevent the problem of information overload. By joint utilization of DEMATEL and BSC, we can introduce a network-based decision architecture for advanced management.
Although BSC is one of the most comprehensive and intuitive performance evaluation frameworks, in practice this method suffers some challenges, including a lack of strategic focus, failure to identify inefficiency in the usage of resources, forcing managers to chase local optimization rather than looking for continuous improvement, and the inability to generate a final aggregated outcome without a benchmarking exercise [46]. Data envelopment analysis (DEA) can be applied to overcome these problems. The advantages of the joint approach (one stage model: BSC+DEA) are summarized as follows: (1) BSC eliminates the impact of information overload by focusing attention on the key successful elements, which may suggest the main attributes in the DEA model [3]; (2) DEA deals with multiple inputs and outputs of BSC at the same time without pre-determined cost functions, thus handling the problems coming from market participants; and (3) DEA assists BSC in generating operational standards by translating qualitative measures into quantitative ratios [10, 17].
Although the one-stage model tends to summarize well in yielding an overall performance score, it can also bury essential messages and obscure the needed action of users [19]. To combat this, we aim to move away from a unique, all embracing one-stage model by introducing a two-stage complementary model that calculates a performance score for each BSC perspective. By doing that, users can highlight the strongest and weakest dimensions of performance and identify relevant benchmarks for continuous learning toward efficiency.
How to convert the performance scores from each BSC perspective into a synthesized measure is a critical issue. This situation turns into a classical multiple-criteria decision-making (MCDM) problem - that is, decision makers often have to consider multiple criteria at the same time with conflicting outcomes on different criteria [35, 46]. One can apply a MCDM technique, Vlse Kriterijumska Optimizacija Kompromisno Resenje (VIKOR), to handle this MCDM task.
After performing VIKOR, we obtain the aggregated outcome that can be used to arrange the companies from efficient to inefficient. The analyzed outcome is then fed into an artificial intelligence (AI)-based approach to construct the forecasting model. This study employs random vector functional link (RVFL) networks as they present numerous advantages, such as easy-to-use, superior approximation capability, and fast convergence [7]. However, RVFL is a neural network (NN)-based algorithm, and one critical challenge of this approach is being able to represent the embedded decision logics in a human readable format - that is, the inherent decision logic is a black-box. If users cannot examine or judge the model’s decision logics (that is, the model’s decision judgment is vague), then its practical applications are impeded. To overcome this obstacle, we utilize an instance learning strategy to open up the black-box and represent the knowledge in a transparent and easy-to-use manner. The contributions of this study are as follows. We introduce a dynamic decision architecture that involves three steps: (1) performance evaluation and integration, (2) forecasting model construction, and (3) knowledge generation, for performance forecasting in today’s highly competitive environment. In the first stage, we extend the original BSC with a unidirectional structure into network-based BSC by performing DEMATEL so as to describe the highly intertwined and interconnected business relations. By doing that the users can realize which element contributes more to the final outcome as well as assist in scarce resource allocation. Despite BSC posing numerous advantages and widespread utilizations, it still comes with some difficulties, such as it does not specify how tradeoffs are to be made between different perspectives, and it cannot provide a specific direction for users to follow. To combat this, DEA is conducted. Apart from prior one-stage models (BSC+DEA) that merely focus on an aggregated outcome, this study calculates a performance score for each BSC perspective. By doing that, we can identify where there is room for improving operation performance and point out opportunities for reciprocal learning between companies. We also can help with the interests of multiple stakeholders. A MCDM method called VIKOR is implemented to convert performance scores from each BSC perspective into a synthesized one. Inspired by the principle of a hybrid model, we believe that the two-stage complementary model (DEMATEL+BSC+DEA+VIKOR) performs better in capturing the dynamisms of the production processes and sub-processes. In the second stage, the performance score derived from a two-stage complementary model is used to divide the companies into two groups: efficient and inefficient. The analyzed results are then injected into RVFL to construct the model for performance forecasting. In the third stage, the instance learning method is utilized to extract the decision logics from RVFL and represent them in a human-readable format. If the users can examine or justify the decision logics derived from the black-box model (i.e., RVFL), then they will have greater incentive to accept this model as well as increase its practical applications.
The remainder of the paper runs as follows. Section 2 briefly surveys related works on performance evaluation. Section 3 details the methodologies used. Section 4 demonstrates the experiments and comparisons. Section 5 concludes the paper.
Literature review
The applications of DEMATEL and its extensions in an uncertain environment
DEMATEL has demonstrated its effectiveness in aggregating expert opinions about a problem and uses them to overcome complicated and multifaceted tasks they encounter [4, 35]. It is also one of the most powerful approaches to identify the interrelations among criteria, determines the central criteria to express the usefulness of factors, and prevents the problem of over-fitting in the performance evaluation task. However, it is widely recognized that human perceptions on decision criteria are normally full of subjectivities. In real-life applications, the human preference model is uncertain and might be unable to assign a crisp number to depict the preference [49]. To combat this, fuzzy logics with the ability to handle information full of uncertainty and vagueness are incorporated into DEMATEL to handle intrapersonal uncertainty [51]. This has been successfully applied in many research fields, such as Lin and Wu [32] using fuzzy DEMATEL in the R&D projection selection of a Taiwanese company, Chang et al. [9] utilizing the model to identify the key successful factors in supplier selection, Karaşan and Kahraman [28] adopting the model for freight village location selection, and Tan and Zhang [48] performing it to assess the risk elements associated with typhoon disaster management.
The integration of BSC and DEA
Balanced scorecard (BSC) [27], which can convert a company’s business objectives into numerous practical criteria distributed among four perspectives, is one of the most widely implemented frameworks for performance evaluation. Although this approach has been enriched by different scholars, some gaps still exist in certain aspects. It lacks a solid assessment of the criteria and approach for combining information from different sources that can yield an aggregated outcome [38]. To combat this, DEA is considered. Rouse et al. [43] is the first study to emphasize the potential of complementing DEA analysis with performance assessment architectures based on BSC. They analyzed the productivity of the engineering service division in the airline industry. Based on the hybrid model, they can speed up the process in identifying the source of inefficiencies. Grounded on the same idea, Chen and Chen [11] studied efficiency in Taiwan’s semiconductor industry. Chiang and Lin [12] developed a hybrid model that integrated DEA with BSC to assess the performance of auto companies and commercial banks. One of the possible reasons for the aforementioned researchers’ willingness to work with hybrid models is that they all believe the hybrid model can capture the dynamics of production processes and sub-processes as well as gain deeper insights to assist them in formatting better decisions. Thus, this study is also based on this concept to develop a hybrid model for performance assessment.
Methodologies
Decision making trail and evaluation laboratory: DEMATEL
DEMATEL, first proposed in the 1970 s, is a commonly utilized approach to analyze and visualize the structure of complicated systems and to represent the direct and indirect relationships between factors. The strength of this approach is in revealing useful information about the structure of the task and assisting at identifying factors that play an essential role, which would otherwise be neglected [2]. This approach can be briefly addressed by the following steps [16, 47].
Step 1: Collect expert opinions.
This method starts with gathering opinions from g experts E ={ E1, E2, …, E
g
} regarding the impact of assessing criteria D ={ D1, D2, …, D
n
} on each other, utilizing the scaling system (i.e., it ranges from 0 to 4, or from “no influence” to “very high influence”) by establishing a pair-wise comparison matrix. The kth expert generates an individual direct influential
Step 2: Calculating Z: average matrix
By calculating the matrix Z = [z
ij
] n×n, expert g ’s opinions can be summarized.
Step 3: Calculating normalized influence matrix X.
Based on the average matrix Z, the normalized matrix X = [x
ij
] n×n can be decided by utilizing Equation (2).
Step 4: Calculating total influence matrix T.
The total influence matrix T = [t
ij
] n×n can be determined from X by utilizing the transition rule and aggregating whole direct and indirect effects.
Step 5: Identifying the influence relation map (IRM).
IRM can be derived from summing up the rows and columns of total relation matrix T.
Here, r i denotes the sum of the ith row of matrix T and can be used to indicate the direct and indirect impacts that are dispatched from factor D i to other factors; c j represents the sum of the jth column of matrix T can be used to illustrate the direct and indirect impacts that factor D j receives from the other factors.
The causal diagram utilizes
Data envelopment analysis (DEA), proposed in the second half of the 1970 s [8], is a non-parametric linear-programming technique that assesses the efficiency of economic entities, also termed as decision making units (DMUs), by converting multiple inputs into multiple outputs. Compared with other performance evaluation techniques, DEA poses numerous benefits: (1) it can handle multiple inputs and multiple outputs; (2) it does not require a pre-determined cost function; and (3) it works well for a small dataset; thus, it has become widely accepted and gained momentum in numerous research fields [22, 30].
By measuring DMUs with multiple inputs and outputs, DEA generates efficient frontiers. If the DMUs are on the efficient frontier, then they are considered efficient and hold an efficiency score of 1; if they are not on the efficient frontiers, then they are considered inefficient and given a non-negative efficiency score below 1. Assuming s - DMUs with e - inputs and f - outputs, the CCR efficiency of the k - th DMU is determined by:
The solution to Equation (5) can be reached by transforming it into a linear programming format as in:
As for model orientation, we assume that a company generally uses the resources at hand in order to reach its goals. Under this assumption, an output orientation seems a natural choice (that is, this study handles the problem of maximization of g k instead of the minimization of g k ).
With its advantage of universal approximation capability, the artificial neural network (ANN) with a back-propagation (BP) supervised learning mechanism is one of the most popular machine learning algorithms, but it has some weaknesses, such as slow convergence and being extremely sensitive to learning rate determination and difficulty at escaping from the local minimum [45]. To handle these challenges, a randomized-based NN, called the random vector functional-link (RVFL) network, was introduced that assigns a weight randomly and connects the input and output layers by a functional link [18, 40]. Igelnik and Pao [23] and Georgopoulos and Hasler [21] indicated that randomly generating the weights from the input layers to the hidden layers can enhance the model’s forecasting performance.
Assume that the approximation of g (x) is represented as g* (x) and can be used to map input data
where F
j
is the vector of weights connecting the input to the jth enhancement node, and the error term and the weights connected to the output are g
j
and α
j
, respectively. Since the weights from the input layer to enhancement node and error term can be randomly determined in an appropriate range and kept constant in the learning procedure, the only computation task is to determine the output weight α, which can be realized via handling the following task:
where N denotes the total amount of research targets, and e expresses the vectors that can be used to concatenate initial and random features.
In order to avoid the problem of over-fitting, we conduct the Moore-Penrose Pseudoinverse. Zhang and Suganthan [53] further indicated that the ridge regression can perform a satisfactory job in handing this task. Thus, we apply ridge regression to handle the following task:
where α = E (E T E + βI) -1Y denotes the solution of the aforementioned task, β depicts the regularization value, and the input and output matrices are E and Y, respectively. For a more detailed illustration of RVFL, one may refer to Zhang and Suganthan [53] and Katuwal et al. [29].
This study introduces a dynamic network-based decision architecture (see Fig. 1) that involves three steps for corporate operating performance forecasting: (1) performance evaluation and integration, (2) forecasting model construction, and (3) knowledge generation. Undoubtedly, one of the best-known and most widely used frameworks for performance evaluation in recent years is balanced scorecard (BSC). It not only can translate a company’s vision and strategic objectives into a set of performance measures distributed among four perspectives, but also can explicitly form the links between different perspectives in a single system. The original BSC assumes that the relations among four perspectives are unidirectional, but this cannot depict today’s highly intertwined business relations. To combat this, DEMATEL can help determine the causal relations and mutual influence among perspectives. While prior research merely focuses on an aggregated outcome, this study aims to go beyond an all-embracing outcome and advances to calculate the performance score for each BSC perspective so as to gain much deeper insights of business operations. Realizing the performance of a company in each BSC perspective may be useful, because it can help top managers to identify the relative efficiency of their firm’s operations with respect to different focal points represented by the perspectives.
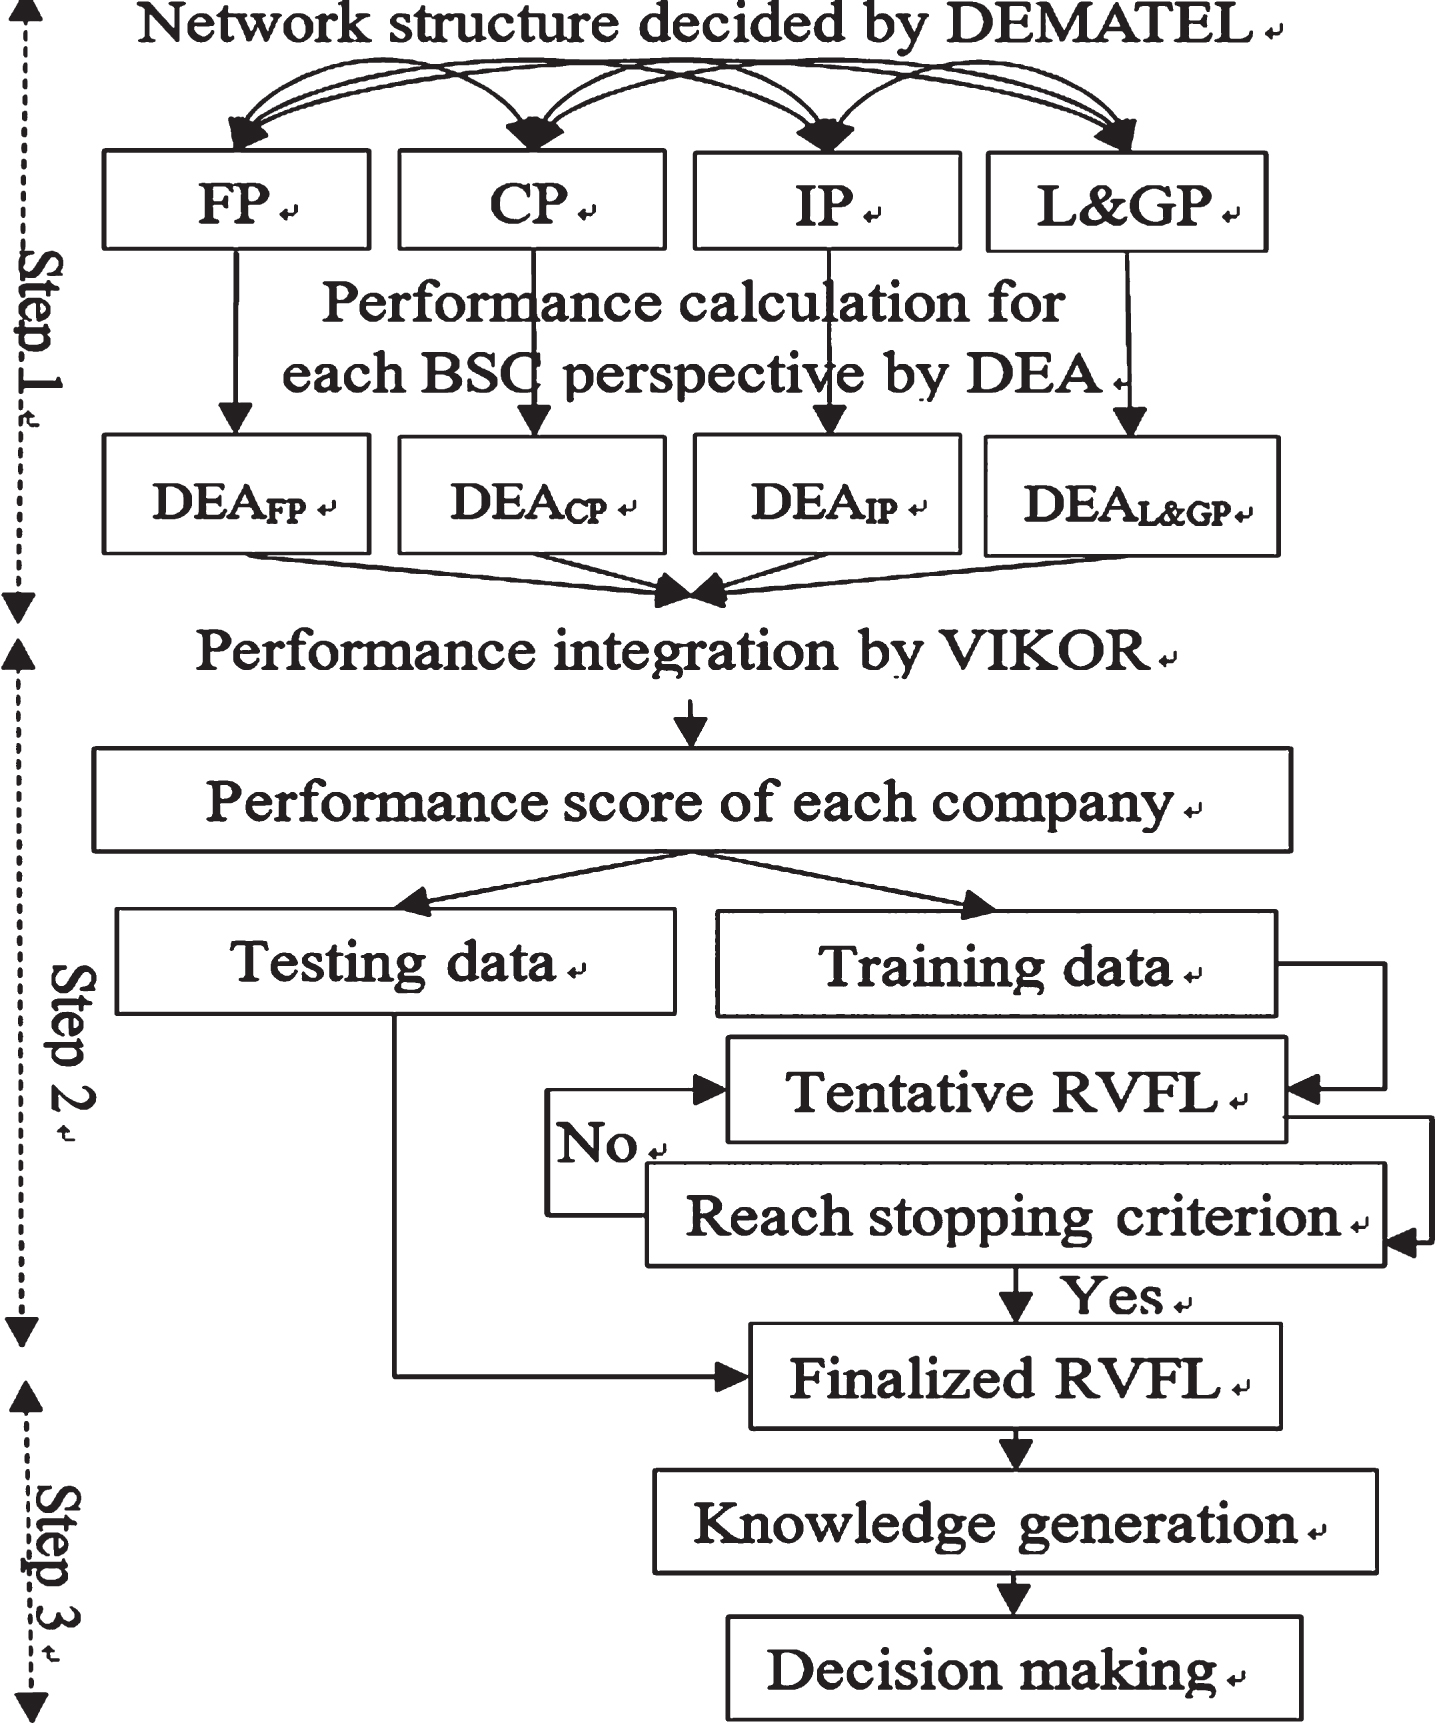
The dynamic network-based decision architecture.
How to transform the performance scores derived from each BSC perspective into a synthesized outcome is an essential task. This task is a classical MCDM task, and the MCDM method can be used to solve it. Thus, VIKOR (one type of MCDM method) is considered. After going through the DEMATEL+BSC+DEA+VIKOR procedure, all the companies can be discriminated into two groups: efficient and inefficient. Next, the analyzed results are injected into RVFL to construct the forecasting model. To prevent the impact of over-fitting, five-fold cross-validation is conducted. The inherent parameters of RVFL are decided randomly. The calculation process is terminated when the performance of RVFL reaches the stopping criterion.
RVFL belongs to neural network (NN)-based models, which have been criticized for lacking interpretability. To combat this, the instance learning algorithm grounded on a pedagogical structure is utilized to extract the decision rules from RVFL and represent them in a human-readable format. Users can rely on the model to assist them in forming their own judgments as well as maximize their business profits under anticipated risk exposure.
The research target and data
Because the attention among members of the organization for economic cooperation and development (OECD) has shifted from a labor-based economy to a knowledge-based economy, knowledge-intensive industries have turned into an essential center of economic growth and sustainable development. Knowledge-intensive industries in the United States sprang up dramatically in the early 1990 s, reaching nearly 40% of GDP (National Science Board 2012 [39]). This situation not only exists in developed countries, but also in developing countries. Many developing economies have made a considerable effort to become the main producers/manufacturers of knowledge-intensive goods and services [14]. For example, the knowledge-intensive industries in Taiwan contributed to 20.4% of its GDP in 2012, and these specific industries have also become the main suppliers in the global supply chain, such as IC chips, laptops, and liquid crystal displays [13]. The Taiwan government has also provided numerous tax incentives and preferential loans for these specific industries, turning them into its economic backbone as well as important capital markets for global investors. In fact, the trading volumes of these specific industries make up over 60% of domestic stock turnover. Thus, we choose them as our research target.
All the data are collected from the Taiwan Economic Journal (TEJ), which provides detailed company-level data of companies listed and traded on the Taiwan Stock Exchange (TSE) and Taipei Exchange (TE). The research period ranges from 2016 to 2018. After deleting missing and extreme values, 1120 data points remain.
The independent attribute
BSC has demonstrated its usefulness in guiding successful strategy implementation, because it focuses on financial and non-financial perspectives, long-term and short-term strategies, and internal and external business measures [26]. However, Makhijani and Creelman [37] indicated that some companies have diluted the effectiveness of their BSC systems as a result of basic mistakes in mapping - that is, there is a lack of articulation about the cause-and-effect relationships between some of the suggested areas of assessment in BSC [36, 37]. To overcome this task, DEMATEL is implemented to obtain the relationships among BSC perspectives.
One of the critical weaknesses of BSC is that it does not provide an aggregated outcome. To overcome this, we use DEA used to measure company performance for each BSC perspective. By realizing this performance in each BSC perspective, managers can prioritize their own focus on reaching their goals. Lastly, we apply VIKOR to synthesize the performance result of the various BSC perspectives into an aggregated final outcome.
The dependent attribute
Company operating performance evaluation is highly related to the issue of financial crisis prediction, whereby the chosen attributes are taken as the surrogates for joining up with the dependent attributes. Based on previous related works, this study employs 10 attributes which are A1: CA/CL (Current assets to current liabilities), A2: TD/TA (Total debts to total assets), A3: WC/TA (Working capital to total assets), A4: OI/TA (Operating income to total assets), A5: S/TA (Sales to total assets), A6: OI/S (Operating income to sales), A7: LTD/TA (Long-term debts to total assets), A8: EBIT/IE (Earnings before interest and tax to interest expense), A9: C/S (Cash to sales), and A10: NI/(TA-TL) (Net income to (total assets – total liabilities)).
The results
After surveying the related works on performance evaluation by BSC, this study obtains 9 variables (see Table 1). Sequentially, the 9 variables are designed to extract the implicit knowledge from specialists regarding the performance evaluation task. This study gathered 10 questionnaires from specialists as inputs to obtain the influential weights for the 9 variables. In our questionnaires, we presented specialists with a brief description on the purpose of this study. All of the specialists have more than 15 years of working experience in banks, CPA firms, or the financial industry (including one senior manager from Bank of Taiwan, two CPAs and four senior managers from the BIG 4: Deloitte, Ernst & Young, PriceWaterhouseCoopers, and KPMG, and one financial analyst from Fubon Financial Holding Company).
The variables of performance evaluation on BSC
The variables of performance evaluation on BSC
*Average is abbreviated to AVG., and standard deviation is abbreviated to S.D. **This study asks the specialists to mark the importance of measures, utilizing a 7-point Likert scale that ranges from 1 “extremely unimportant” to 7 “extreme important”, respectively. ***The weight is determined by a trapezoidal method.
To obtain the relationships among BSC perspectives, it is necessary to undertake some processes as follows. First, we have to obtain the initial direct-relation matrix and normalize it to get the total relation (direct/indirect) matrix (see Table 2). In order to realize the influential relation between the measures, we take the median as a threshold. If the values reach or exceed the threshold, then that perspective is considered to be more influential than the others. Sequentially, we add up the values in each row and the values in each column as r i and c j , respectively. The horizontal axis (r i + c j ) depicts the degree of influential relations between perspectives, while the vertical axis (r i - c j ) displays the degree of influential relations between one perspective and the other perspectives. Figure 2 represents the total-relation matrix with r i + c j and r i - c j . By performing DEMATEL, we move go beyond the unidirectional relationships among the original BSC to a network-based structure so as to provide more information for users to make better decisions.
The total relation (direct/indirect) matrix
*The mean (2.65) is taken as the threshold. If the value exceeds the threshold, then the value has an influence; if the value is less than the threshold, then the value has no influence.
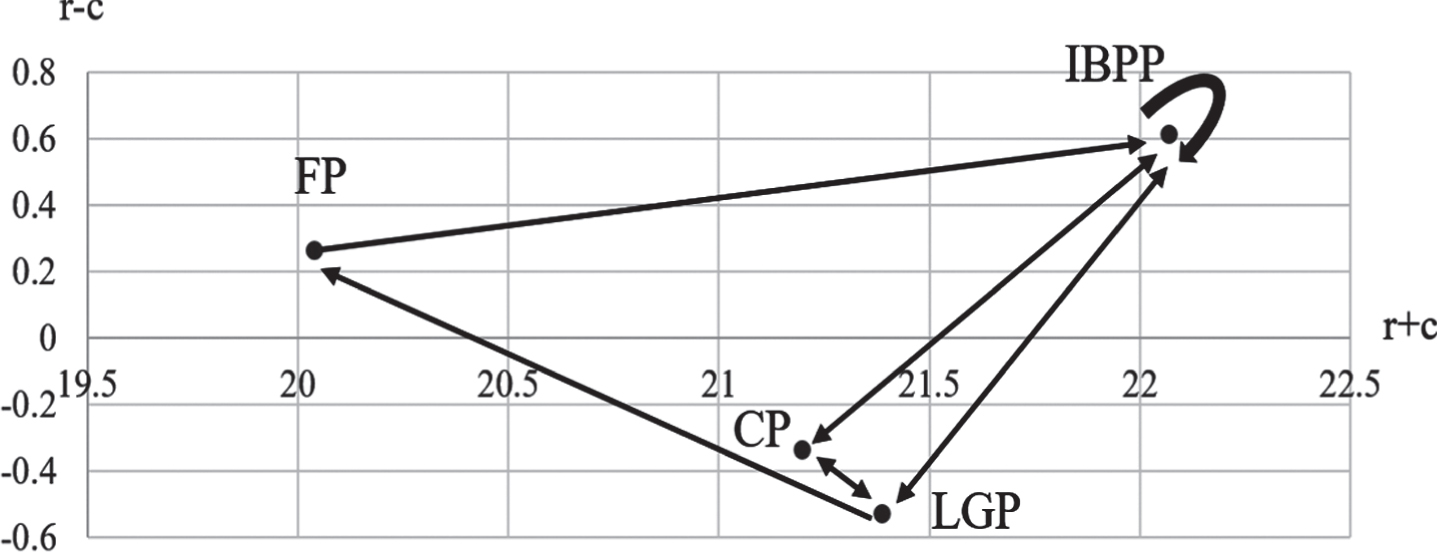
The network structure of BSC.
The performance evaluation of all BSC perspectives is useful, because it may help managers to identify the relative efficiency of company operations with respect to the different focal points expressed by the perspectives [3]. The outcomes from each BSC perspective are synthesized by VIKOR to form an overall performance rank. We rank each company’s performance from superior to inferior by a synthesized outcome (i.e., overall performance rank). The highest quintile (top 20%) is designated as those companies at efficient operations, and the lowest quintile (bottom 20%) is designated as those companies at inefficient operations.
Table 3 represents the results of two different groups. We can see that the efficient group usually has good business operations (i.e., simplify workflow and eradicate redundancies), appropriate and quick customer reaction (i.e., enhance communication and sound customer loyalty), and superior profit potential (i.e., sell profitable products and eliminate product cost). No matter whether a company is efficient or inefficient, both groups place little emphasis on LGP among the four perspectives. In order to overcome this problem, the government announced the “Enterprise Human Resource Improvement Program” to improve employee capability and skills and to spur the restructuring of business operating procedures so as to increase competitiveness and further upgrade the nation’s industrial level.
The results of two different groups (AVG)
The analyzed outcomes are then inserted into the AI-based technique to construct the forecasting model. Before model construction, we have to decide the predictors first. Based on the related works, 10 predictors are taken. However, not all the collected predictors are informative and useful - that is, a great proportion of the data is derived from financial statements that may be contaminated by some degree of errors, such as selective accounting principles and different estimation methods. To avoid any biased outcome, we conduct rough set theory (RST) with the merits of handling uncertainty, vagueness, and incompleteness [5]. In addition, ensemble learning is a prolific field in pattern recognition and data mining since it is grounded on the assumption that integrating the outcome of multiple models is better than utilizing a singular model, and it usually achieves superior results.
West [52] indicated that even a little improvement in a model’s forecasting accuracy can transmit into a large amount of future savings for market participants. Thus, this study performs RST with an ensemble structure to identify the most essential and relevant attributes which are A1: CA/CL, A2: TD/TA, A5: S/TA, A6: OI/S, and A9: C/S. We see that efficient companies usually have sound risk-absorbing ability, appropriate capital structure, superior profitability, and sufficient free cash flow.
To examine the usefulness of feature selection, we divide the experiments into three scenarios: (1) no feature selection, (2) feature selection by RST, and (3) feature selection by RST with an ensemble structure. To prevent an outcome just happening by coincidence, we conduct a statistical examination, taking into consideration four different kinds of measures: overall accuracy, precision, recall, and F-measure. The results are in Table 4. We can see that the model with feature selection performs better than the model without feature selection. This finding is in accordance with the prior work of Wang et al. [51] who pointed out that feature selection reduces computational complexities and also increases a model’s generalization ability. The results in scenarios 2 and 3 demonstrate the usefulness of ensemble learning. This outcome is the same as by Bolón-Canedo and Alonso-Betanzos [6], who stated that an ensemble-structured model can add stability and transparency in the procedure of knowledge discovery.
Comparison of results
To test the effectiveness of our introduced model, we take the proposed model as a benchmark and compare it with other three models: decision tree (DT), support vector machine (SVM), and neural network (NN). Five-fold cross-validation (CV) is performed to eliminate the problem of over-fitting. The compared results are in Table 5, indicating that the introduced model outperforms the other three models for all assessment measures.
Comparison of results in the four models
Notes: OA: overall accuracy; Pre.: precision; Rec.: recall, and F-m.: F-measure.
As RVFL is an NN-based algorithm, and one of the critical weaknesses is an inability to provide an intuitive and comprehensive judgment for users to examine and test the forecasted outcome - that is, the inherent decision process is a black-box. To open up the black-box, this study implements the instance learning method to extract the implicit decision rules and represent them in a human-readable manner so as to increase their practical applications. The decision rules are in Table 6. We can see that a company with efficient operations usually has a suitable capital structure, higher profitability, and sufficient cash flow so as to react quickly to a severe financial shock and to survive in a turbulent business atmosphere.
The decision rules from RVFL
Most studies reaching a conclusion have only relied on one pre-determined dataset, which is not reliable and trustworthy, because different inputs lead to different outputs. To make our research findings robust and to examine the applicability of the proposed model, we consider three other situations: (1) one stage mode (BSC+DEA) [11], (2) two stage model (BSC+DEA+DEA) [3], and (3) proposed model (DEMATEL+BSC+DEA+VIKOR). Figure 3 illustrates the results. We can see that our proposed mechanism has better discriminant ability (lower mean and higher variance) than the other two models. Table 7 expresses the forecasting outcomes when performance ranks are determined by these two models. We can see that our proposed model still performs better than the other three models for all assessment measures.

The results of three different mechanisms.
The results from two different situations
Notes: OA: overall accuracy; Pre.: precision; Rec.: recall, and F-m.: F-measure.
Moving away from an all-embracing one-stage model toward a hybrid two-stage model can be advantageous for performance evaluation and improvement. One reason is because by calculating the performance score for each BSC perspective the managers can realize the strongest and weakest perspectives of their company and identify the relevant benchmark for continuous learning toward efficiency. Furthermore, in line with a network-based learning structure, we believe that this model better captures the dynamics of production processes and sub-processes as well as gains more insights and assists in allocating resource to suitable places.
Taking the efficient group for example, if this group wants to improve its LGP in the subsequent period, then it should set “variables in FP” as the top priority, because the aggregated performance gap on perspective LGP is the highest among the four perspectives (see Fig. 4). By realizing the cause-and-effect relations among the four perspectives, firm managers can allocate valuable resources to appropriate places so as to fulfill their mission and reach the goal of both profits and sustainable development.

The performance gaps to the optimal level with cause-and-effect influences.
One of the essential issues in a company’s performance evaluation is identifying the weak points in the inputs and taking internal and intertwined relations into consideration. The goal of top executives is to form a balance between dissimilar visions; hence, balanced scorecard (BSC), which can handle financial and non-financial perspectives, long-term and short-term strategies, and internal and external business measures, seems like an appropriate approach to handle this balancing task, but the issue is that relations between different perspectives are designed as unidirectional. Unfortunately, in today’s highly interconnected and collaborative environment, unidirectional relations among the four BSC perspectives are unable to precisely describe the whole picture of a company’s operations.
To handle the above task, we apply DEMATEL to extract the causal relationships and mutual influences among the perspectives. In other words, this study considers advancing BSC with a network structure instead of utilizing the traditional BSC with a unidirectional structure in order to provide users with more overarching considerations to form better judgments. However, BSC is unable to indicate inefficiency in the utilization of a resource, and it cannot discriminate the difference between efficient and inefficient companies.
We therefore add DEA into our approach. Apart from prior related studies that combined BSC and DEA into a one-stage (BSC+DEA) procedure to get an aggregated outcome, the aggregated outcome derived herein follows a two-stage procedure. In the first stage, DEA is performed to compute the performance score for each BSC perspective. By doing that, managers can realize their company’s performance of each BSC perspective and identify where there is room for improvement as well as determine opportunities for reciprocal learning between DMUs. Moreover, managers can further allocate resources to a suitable place to reduce the gap of each criterion and to promote a continuous learning procedure for reaching the optimal level.
In the second stage, VIKOR is applied to synthesize the performance scores of the various BSC perspectives into an overall performance measure. The analyzed outcome is then fed into RVFL to construct the model for operating performance forecasting. However, while RVFL offers superior forecasting capability, it also comes with a critical weakness, as it does not provide any intuitive and transparent decision logic - that is, the inherent decision judgment is a black-box. To handle this task, we execute instance learning, grounded on a pedagogical structure, to extract the decision knowledge from RVFL, to present it in a human-readable manner, and to increase its practical applications.
Future works can consider two potential research directions. First, we have worked on the target sample in Taiwan’s electronics industry, which suggests that the ability to generalize the results could be limited. Future studies can look into other industries or conduct cross-country analysis. Second, future research can extend a singular mechanism into much more sophisticated mechanisms, such as fuzzy DEMATEL, in order to handle an uncertain environment and human subjectivity as well as to gain more insight from the outcome.
Disclosure statement
No conflicts of interests exist in the submission of this manuscript.
Footnotes
Acknowledgments
The authors would like to thank the Ministry of Science and Technology, Taiwan, R.O.C. for financially supporting this work under contracts. No. 106-2410-H-034-011-MY3, No. 108-2410-H-034-056-MY2, No. 108-2410-H-034-050-MY2, and No. 109-2410-H-034-034-MY2.