
Abstract
With the widespread of location-based social networks (LBSNs), the amount of check-in data grows rapidly, which helps to recommend the next point-of-interest (POI). Extracting sequential patterns from check-in data has become a meaningful way for next POI recommendation, since human movement exhibits sequential patterns in LBSNs. However, due to the check-ins’ sparsity problem, exploiting sequential patterns in next POI recommendation is a challenging issue, which makes the learned sequential patterns unreliable. Inspired by the fact that auxiliary information can be incorporated to alleviate this situation, in this paper, we model sequential transition based on both item-wise check-in sequences and region-wise spatial information. Besides, we propose an attention-aware recurrent neural network (ATTRNN) to learn the contribution of different time steps. Furthermore, considering users’ decision-making is influenced by public’s common preference to some extent, we design a novel framework, namely HSP (short for “
Introduction
Recent years have witnessed the increasing popularity of location-based social networks (LBSNs), such as Foursquare, Gowalla and Yelp. These platforms help users to explore the surrounding environ-ment and share life experiences in the form of check-ins in the physical world. The considerable check-in data provides a great opportunity to better analyze users’ mobility behavior and preferences, based on which next point-of-interest (POI) recommendation becomes valuable. Therefore, developing recommender systems for LBSNs has recently attracted increased research attention.
Compared to the general recommendation tasks (e.g., movie recommendation), next POI recommendation is highly dependent on the locations of spatial items [1]. Some existing next POI recommendation methods [2, 3] focus on exploring the influence of combination factors for improving the recommendation accuracy. Obviously, auxiliary factors include spatial proximity of locations, temporal context and auxiliary meta-data information (such as type and social relationship) have influence on users’ movement behaviors. Nevertheless, from recent research on human mobility [4], it has been observed that human movement exhibits sequential patterns, and successive check-ins are usually correlated (as shown in Figure 1(a)). For example, some users always check-in at POIs around restaurants after shopping malls since they would like to have something after shopping. Furthermore, according to the analysis [5] of successive check-ins’ transitive patterns on two real-life datasets, Foursquare and Gowalla, the distribution of transition probabilities between spatial items is nonuniform, which verifies users’ sequential patterns. Therefore, it is necessary to model the sequential patterns of users’ check-ins for next POI recommendation.
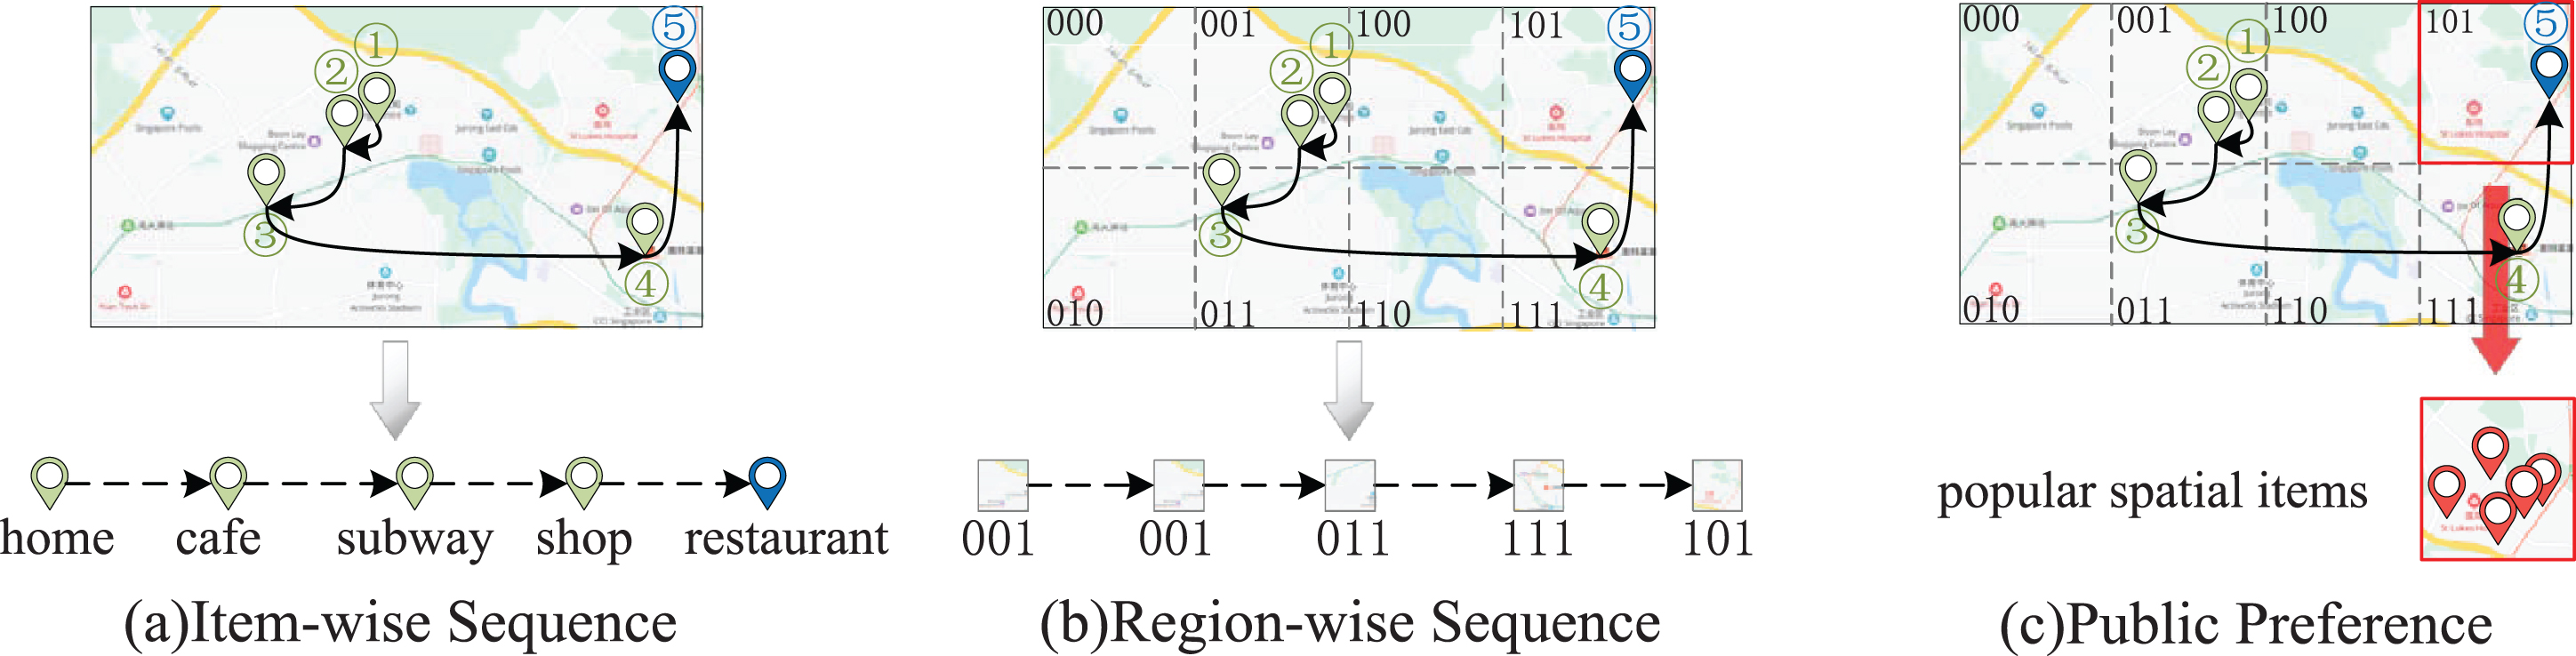
An example of sequential pattern and public preference effects.
However, due to data sparsity problem, it is highly challenging to utilize sequential factor for next POI recommendation. Study in [6] analyzed the check-in records collected from Gowalla. It is obvious from the results that the data density that can be utilized for next POI recommendation is usually about 0.1%, which indicates that the check-in frequency of LBSN data is low. Since it is more difficult to learn sequential patterns based on sparse check-in sequences, next POI recommendation is sensitive to the data sparsity.
In order to solve the above challenges, earlier methods for next POI recommendation explore users’ sequential patterns by Markov Chain [7]. However, existing Markov Chain methods have limitations due to high computational complexity and difficulty of capturing longer dependencies. Hence, recurrent neural network (RNN) based approaches [8] are exploited to model users’ mobility patterns because of their ideal effect of capturing longer sequential context. Afterwards, some methods [9] even combine auxiliary factors into RNN to mitigate the data sparsity problem. However, none of the previous sequential recommendation methods consider the powerful impact of region-wise sequential patterns and public’s common preference.
The region-wise sequences are check-in sequences at the region level (as shown in Figure 1(b)). While users’ sequential transition on precise POIs has great randomness, their regional transitions often shows stronger sequential dependencies. For instance, we assume that a user wants to have dinner in a restaurant near home after work. The movement from the office to a specific restaurant tends to be unreliable. On the contrary, the region-to-region movement (e.g., from the user’s working area to the user’s living area) presents a more stable sequential pattern. Furthermore, users usually refer to the public preference before deciding to visit a spatial item. For example, as shown in Figure 1(c), when choosing a restaurant for dinner, a user is likely to prefer a local popular restaurant. A recommendation model that only exploits sequential transitions may not produce ideal results. Therefore, integrating sequential transition patterns and public preference in a unified model can provide better recommendation performance for next POI recommendation.
To tackle the problems mentioned above, we propose a hybrid model based on sequential feature mining and public preference awareness.
Our primary contributions can be summarized as follows. We model sequential transitions based on both item-wise check-in sequences and region-wise spatial information which can address the data sparsity problem. Furthermore, an attention-aware recurrent neural network, named ATTRNN, is designed to model the contribution of different time steps. We propose a novel framework for next POI recommendation, called HSP. HSP embeds two features (i.e., sequential transition pattern and public’s common preference) and combines them together for the prediction task. We evaluate the proposed method by detailed experiments on two real-life datasets. Experimental results demonstrate the competitiveness of HSP, outperforming state-of-the-art next POI recommendation techniques. We further measure the impact of different components in HSP on the overall performance through ablation tests.
The rest of this paper is organized as follows. In Section 2, we review the related work. In the following section, we introduce the preliminary study on our method. We describe our HSP model in Section 4. Next, we report our empirical study in Section 5. Finally, we conclude this paper in Section 6.
In this section, we review previous studies related to next POI recommendation, including general POI recommendation and sequential POI recommendation.
General POI recommendation
POI recommendation has recently attracted widespread attention in academia. Exploiting only check-in records often results in poor performance due to the sparsity of users’ check-ins. Therefore, combination factors are exploited in some methods due to auxiliary information can be incorporated to alleviate this situation.
Since there is a strong correlation between users’ activities and geographical distance, some existing studies focus on exploiting spatial information [10]. Feng et al. [5] model the geographical distance between POIs and users. Wang et al. [1] incorporate spatial influence, spatial susceptibility, and distance into the model to learn the POI-specific geographical influence. Ye et al. [11] propose a spatial feature based Poisson Factor Model to jointly capture spatial preferences and user preferences. Feng et al. [4] design a model that places nearby POIs in the same cluster due to the high correlation between them. Sarwat et al. [12] propose a method based on region-wise popular location calculations using coarse-grained spatial information. Li et al. [13] directly calculate the attraction of a target POI by considering the attraction of its geographical neighbors.
In addition, other factors have been utilized to facilitate the recommendation performance [14]. Temporal context is an important factor in POI recommendation. Gao et al. [15] design a novel model based on latent factors, in which temporal influence and various types of contexts are introduced to capture user preferences. Furthermore, auxiliary meta-data information have significant influence on users’ check-in behaviors. For example, Ding et al. [16] utilize a deep neural network to integrate social information, geographical influence and categorical content. Yu et al. [17] take user’s influence and authority under various categories into consideration. Chang et al. [18] design a content-aware POI embedding model that employs various context information to learn the POIs’ characteristics. Such works are complementary to our work.
Sequential POI recommendation
Modeling sequential patterns is meaningful for capturing user preferences. Therefore, researchers have recently paid more attention to next POI recommendation.
Some works leverage the Markov chain property to model the sequential influence. Cheng et al. [7] develop a method that takes the latest check-in in a user’s check-in sequence into consideration. Nevertheless, the next POI may depend on both the last check-in and user’s earlier behaviors. Zhang et al. [3] leverage an additive Markov chain to predict the sequential probability. But this approach cannot assign transition probabilities to the unobserved data. Ye et al. [6] consider transitive patterns of categories in sequential check-ins. Since the hidden states learn the user’s sequential patterns, user preferences can be better modeled on sparse data. Recently, inspired by studies in deep learning, some researchers utilize neural networks to model check-in sequences. Liu et al. [19] extend Recurrent Neural Network (RNN) and propose a method of modeling local temporal and geographical influence with two types of transition matrices. Liu et al. [20] capture the sequential patterns by the word2vec framework. Kong et al. [9] combine geographical and temporal influence into long-short term memory (LSTM) network to mitigate data sparsity problem. Zhao et al. [21] design a new spatial-temporal gated network by enhancing LSTM to control user’s interest updates. Li et al. [22] propose the temporal and multi-level context attention mechanisms for next POI prediction by extending LSTM-based framework. He et al. [23] exploit the category transition pattern for next POI recommendation. Yu et al. [24] develop a LSTM based deep model that incorporates categorical information and spatial influence to reduce candidate results. Sun et al. [25] design a novel model for next POI recommendation, which learns user long-term preferences by using a nonlocal network, and captures user short-term preferences with a geo-dilated RNN. Nevertheless, all previous sequential models neglect the coarse-grained spatial information and public preferences.
Summary
Our work differs from previous studies in twofold. First, although existing research [4] has also exploited the influence of POIs in the same geographical region, the sequential transition pattern of POI regions is not considered to predict future check-ins. In contrast, our proposed HSP model extend RNN technique and propose a novel method to model the sequential pattern of POI regions. Second, we automatically integrate sequential patterns and public preference in a unified model.
Definitions and preliminaries
In this section, we provide formulation in terms of key notations and introduce the related technologies in this paper.
Problem formulation
Assume that there is a set of users
In this work, we focus on extracting information from check-in sequence S u and public data (i.e., check-ins of other users in the same region). Therefore, we define our problem as follows.
Geographical binary tree
A geographical binary tree structure is developed to divide the search space into several regions. In the binary tree, nearby POIs should be tightly distributed, since they have high relevance[4]. In this paper, POIs are divided into a hierarchy of binary regions, so that geographically adjacent POIs have a higher probability to cluster in the same region. In order to build the geographical binary tree, we recursively divide each region into two equal-sized subregions, until at least one edge of these regions is below the region size threshold value. In the resulting binary tree, we assign each POI to a single region.
Latent representation learning
Similar to word symbols in natural language processing, the original check-ins, regions and users (i.e., one-hot representations) have very limited representation capacity. In this paper, these one-hot encodings are embedded into low-dimensional dense vectors, i.e., item vector
Intuitively, the latent representations of two spatial items (or regions) that are proximate in the geographical space should be similar to each other. Similarity, if two users have similar preferences, then the latent representations of them should be similar to each other. According to the observation, we leverage the Skip-gram model [26] to characterize similarity. Taking the latent representation learning of users as an example, we treat similar users of each given user as “words” in a “sentence”, and use Skip-gram model to learn user vectors. The learned user vector represents user preferences. The same is true for the latent representation learning of regions and spatial items. Thus, we train the embedding vectors of POIs, regions and users by maximizing the following objective function:
In this part, we first provide an overview of our solution, then we present the details of the proposed HSP model, which integrates sequential transition pattern and public preference. The framework is presented in Figure 2.
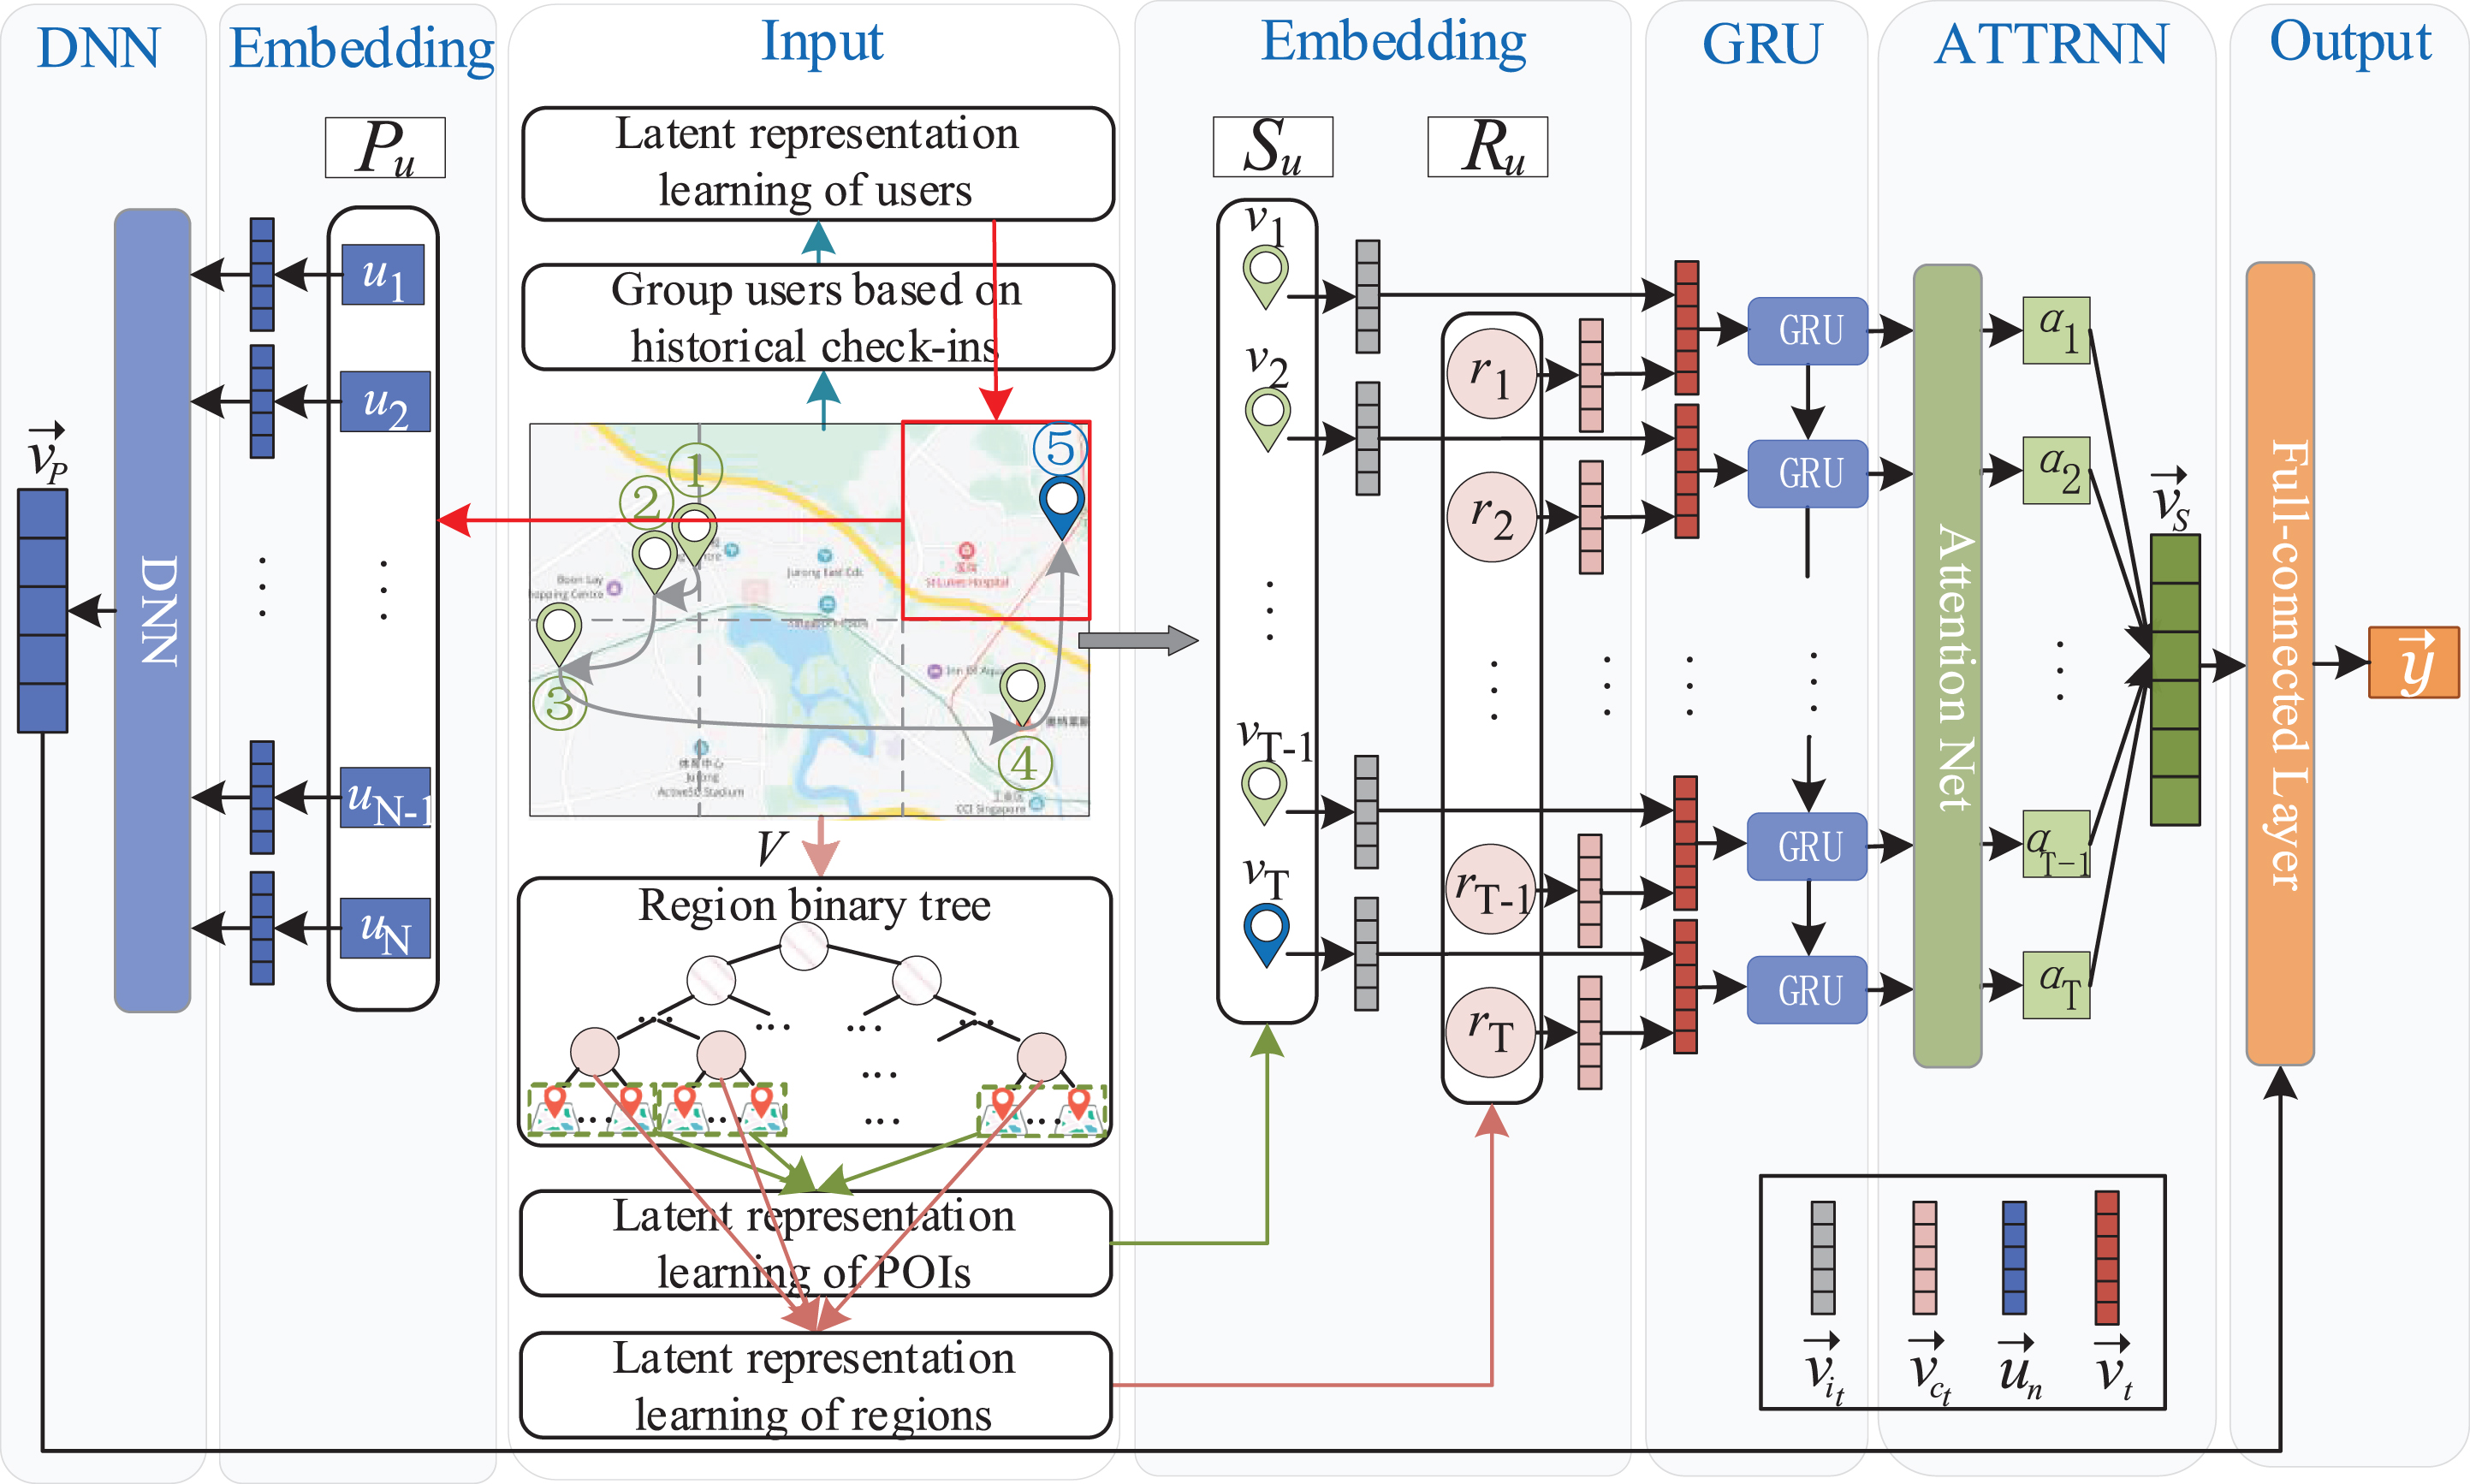
Illustration of HSP model.
To solve the issues mentioned above, HSP consists of three components, including region-wise spatial context, ATTRNN, and public’s common preference. More specifically, since check-ins are highly position-dependent, we introduce spatial context to the model for the recommended task. To mitigate the problem of data sparsity, we use the coarse-grained spatial context, i.e., POI regions. Sequentially, we leverage Gated Recurrent Unit (GRU) [8] based model to learn the long-range dependency. In order to model the dynamics of check-in sequences, we further utilize an attention mechanism to model the contribution of different time steps. We built the sequential feature vector by adopting the attention mechanism, which is a weighted sum of the prediction vectors of each time step with different attention weights. Afterwards, we exploit deep neural network (DNN) to learn public’s common preference in check-in behaviors. The final prediction vector is generated by integrating the sequential feature vector and the public preference vector into a fully-connected layer. The details of each component of HSP will be explained as follows.
Region-wise spatial context
Merely considering the dependencies between spatial items is not enough to make accurate prediction of the next spatial item simple because of the data sparsity. To solve this problem, we introduce region-wise spatial context to the HSP model.
Once the geographical binary tree is generated, sequential transition can be learned based on both item-wise check-in sequences and region-wise spatial information. Taking the spatial item sequence and the region sequence as input, our HSP first encodes sparse input (i.e., one-hot representations) via embedding layer and embeds them into low-dimensional dense vectors. The combination of spatial item vector and region vector can be used as a new representation sequence
We employ GRU to capture the long-range dependency via the following formulation:
Existing methods only use the attention mechanism to describe users’ appetites for different items. However, these methods cannot reflect the dynamic features of users’ check-in sequential preferences at different time steps. Actually, the prediction results of different time steps have the different contribution to the sequential feature vector of target user.
Therefore, we propose an attention-aware recurrent neural network, called ATTRNN, whose aim is to capture the sequential feature from the user’s historical check-ins. ATTRNN is illustrated in Figure 2. ATTRNN introduces the attention mechanism for getting sequential feature and modeling the contribution of different time steps. These features are integrated as the sequential feature representation of user’s history check-in data.
ATTRNN calculates the weight of each time step in the sequence and learns the probability distribution over all time steps, which makes each time step has the different contribution. The time step with higher probability is considered as the one that more of significance to the next POI recommendation. The sum of the weights of all time steps is 1. The process of weights calculation is illustrated by Eq. 4, where α
t
is the weight used to measure the impact of
As shown in Figure 2, once we compute the attention scores α
t
for all T time steps, with the help of α
t
, we define the final sequential feature representation vector
As mentioned above, the assumption that users prefer spatial items only based on their personalized sequential patterns may be inaccurate in multiple social application scenarios [27, 28]. After investigating some LBSNs, we find that users’ check-in behaviors are generally affected by two factors: their personalized sequential patterns and public’s common preference. Therefore, taking public preference into consideration is helpful for next POI recommendation. We design a hybrid neural network to learn the impact of sequential patterns and public preference on user’s check-in behaviors. More specifically, it consists of a RNN and a DNN, one used on the sequential feature representation vector and another on the public preference vector.
Public preference extraction based on DNN is shown in Figure 2. DNN is a feed-forward neural network with multiple hidden layers between its input and output. It is with fully connected layers and activated by sigmod. For each hidden layer l, sigmod is used to map all input from the lower layer,
In HSP, ATTRNN is used to capture user’s sequential feature and the DNN is used to extract public preference. The simple concatenation operation makes sequential feature vector and the public preference vector independent with each other for next POI recommendation. Actually, the check-in sequence is closely related to public’s common preference, since users’ decision-making usually depending on public preference. Therefore, to capture the overall preference, we combine the output of ATTRNN
The recommended task is usually handled by a multi-class classifier. At the target time, SoftMax is employed as activation function. The predicted probability distribution y is obtained via the following formulation:
1:
2: Divide check-in sequences by 24 hours
3: Map each check-in sequence into a region transition sequence
4:
5: Initialize model parameters Θ
6:
7:
8: Calculate user’s sequential preferences by using Eq. (5)
9: Calculate public preference by using Eq.(7)
10: Calculate the predicting score y i by using Eq.(9)
11: Update model parameters Θ using Eq.(11)
12:
13:
14:
15: Calculate the score according to Eq.(9)
16: Recommend top-k POIs
17:
Thus, a predicted vector y is built, which indicates the probability that the target user prefer to visit each spatial item in the future. The label vector over all spatial item candidates need to be obtained. Therefore, we define the real probability distribution, as
We utilize stochastic gradient descent (SGD) to optimize the objective function. The corresponding parameters are updated along the ascending gradient direction as follows:
Algorithm 1 describes the detailed flow of our HSP algorithm. The first step (lines 1-6) is our data processing, followed by our training module (lines 7–14), and finally the prediction module (lines 15–18).
In this section, we evaluate the proposed method by detailed experiments on two real-life datasets to show the competitiveness of HSP in next POI recommendation task. We also measure the performance gain from the three main components in HSP via a series of tests.
Datasets
We conduct experiments on two real-world datasets. One is the Foursquare check-ins within Singapore [29]. Foursquare dataset contains 342,850 check-ins of users who live in Singapore between Aug. 2010 and Jul. 2011. The other one is the Gowalla check-ins within California and Nevada [30]. Gowalla dataset contains 736,148 check-in data between Feb. 2009 and Oct. 2010. Each check-in activity in both datasets contains the user-ID, POI-ID, POI-location in the form of latitude and longitude, and check-in time. To get check-in sequences, we utilize the same method as that in [31], i.e., taking a set of check-ins of user in 24 hours as a check-in sequence. We remove users’ interactions with fewer than 5 items and items interacted by fewer than 5 users in the two datasets. After pre-processing, the Foursquare dataset comprises 194,108 check-ins made by 2,321 users at 5,596 POIs, and the Gowalla dataset comprises 456,988 check-ins made by 10,162 users at 24,250 POIs. Each check-in is associated with a time stamp. The statistics of the datasets are shown in Table 1.
Statistics of two datasets
Statistics of two datasets
In the experiments, 5-fold cross validation is performed on 90% of the dataset, and the remaining 10% of the dataset is selected as the test set to evaluate the effectiveness of the recommendation methods. Based on the cross validation, learning rate is set at 0.005, regularization term λ is set at 0.001.
To evaluate the performance of the proposed method HSP, we conduct experiments against the following 7 state-of-the-art recommendation methods in the task of predicting next POI:
In order to validate the performance gain brought by considering the region context, considering the contribution of different time steps and exploiting the public preference influence, we design three variants of HSP.
Evaluation metrics
In general, next POI recommendation techniques compute a score for each POI regarding a target user and return POIs with the top-k highest scores. To evaluate the effectiveness of the proposed methods, we employ four standard metrics, i.e., precision (pre@k), recall (rec@k), normalized discounted cumulative gain (NDCG@k) and mean reciprocal rank (MRR@k), where k is the number of recommendation results. The pre@k indicates the ratio of the number of discovered POIs to the k recommended POIs, and the rec@k defines the ratio of the number of discovered POIs to the number of positive POIs, which have been visited by the target user in the testing set. NDCG@k measures the ranking quality, which assigns higher scores to POIs at top-k ranks. MRR@k defines the average of reciprocal ranks of the desired POIs.
The pre@k and rec@k is defined as:
The NDCG@k is defined as:
The MRR@k is defined as:
Overview
We present the experimental results of our proposed model HSP and the seven comparison recommendation methods on Foursquare and Gowalla datasets. To be specific, the effectiveness of different methods on two datasets evaluated by pre@k, rec@k, NDCG@k and MRR@k are shown in Figure 3 and Figure 4. In addition to recommendation effectiveness, we provide an efficiency comparison among different state-of-the-art methods shown in Table 2. Additionally, a statistical test is further used for statistical comparison of methods.
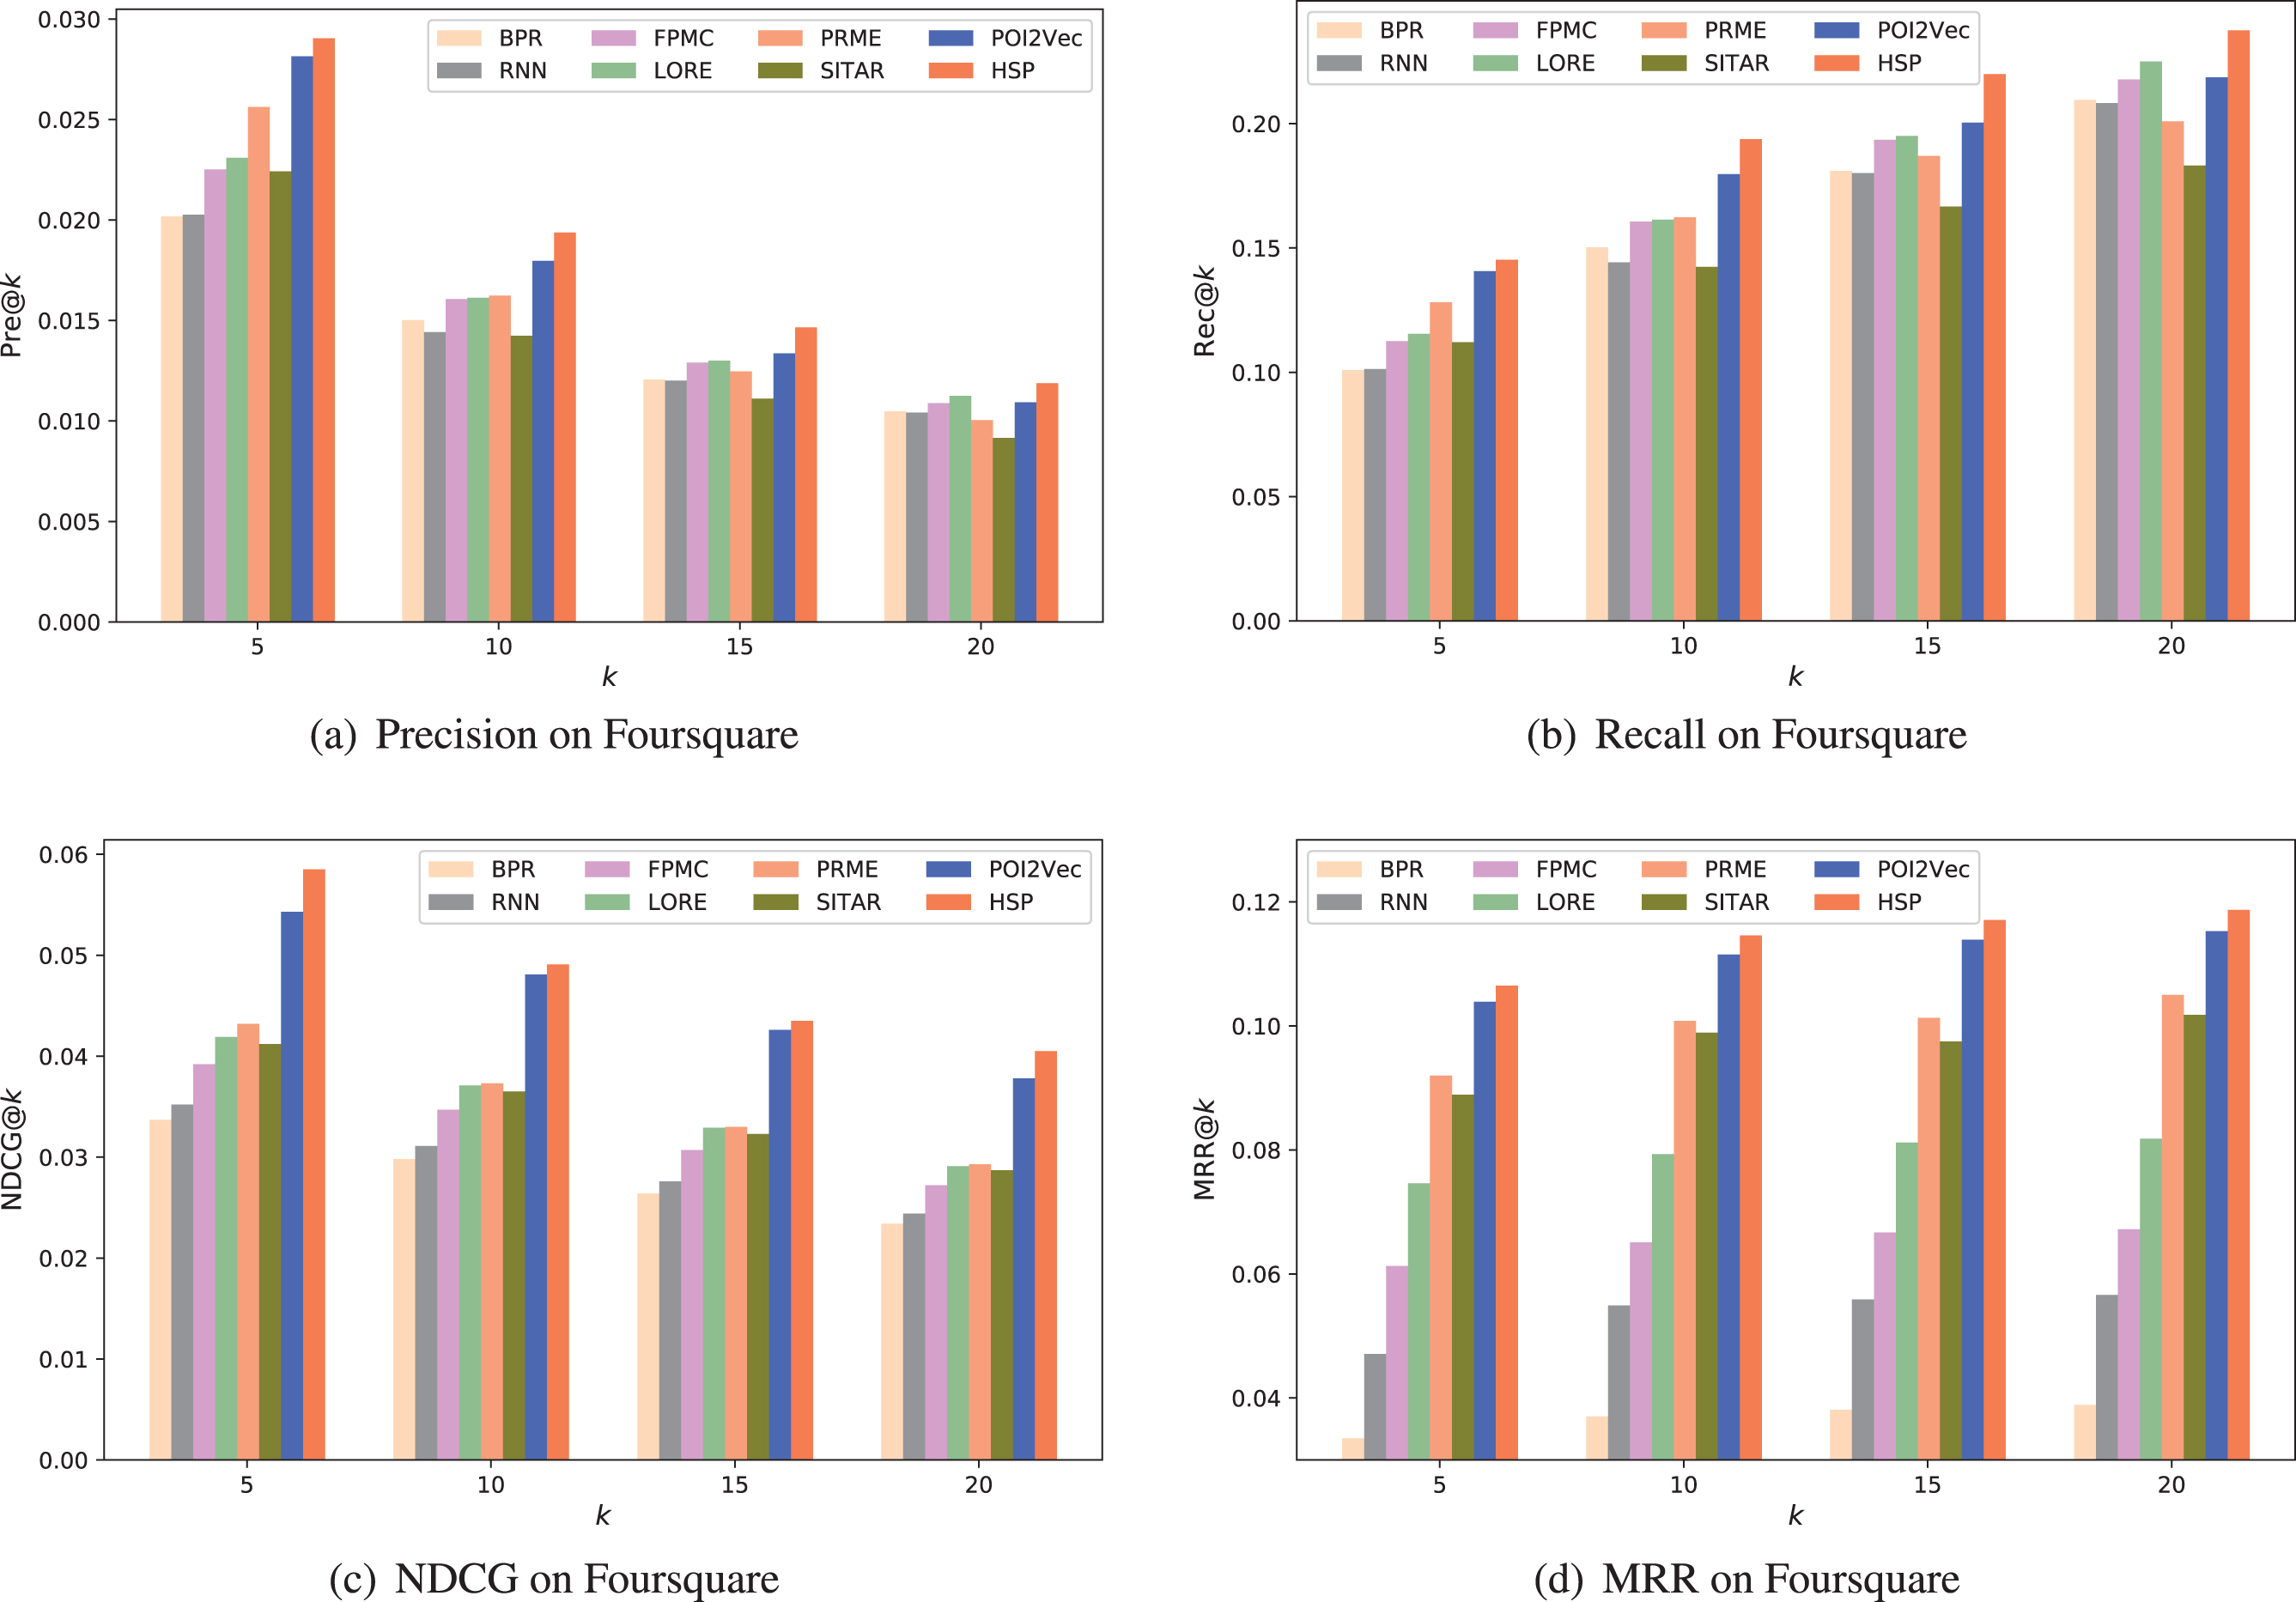
The result of methods on Foursquare.
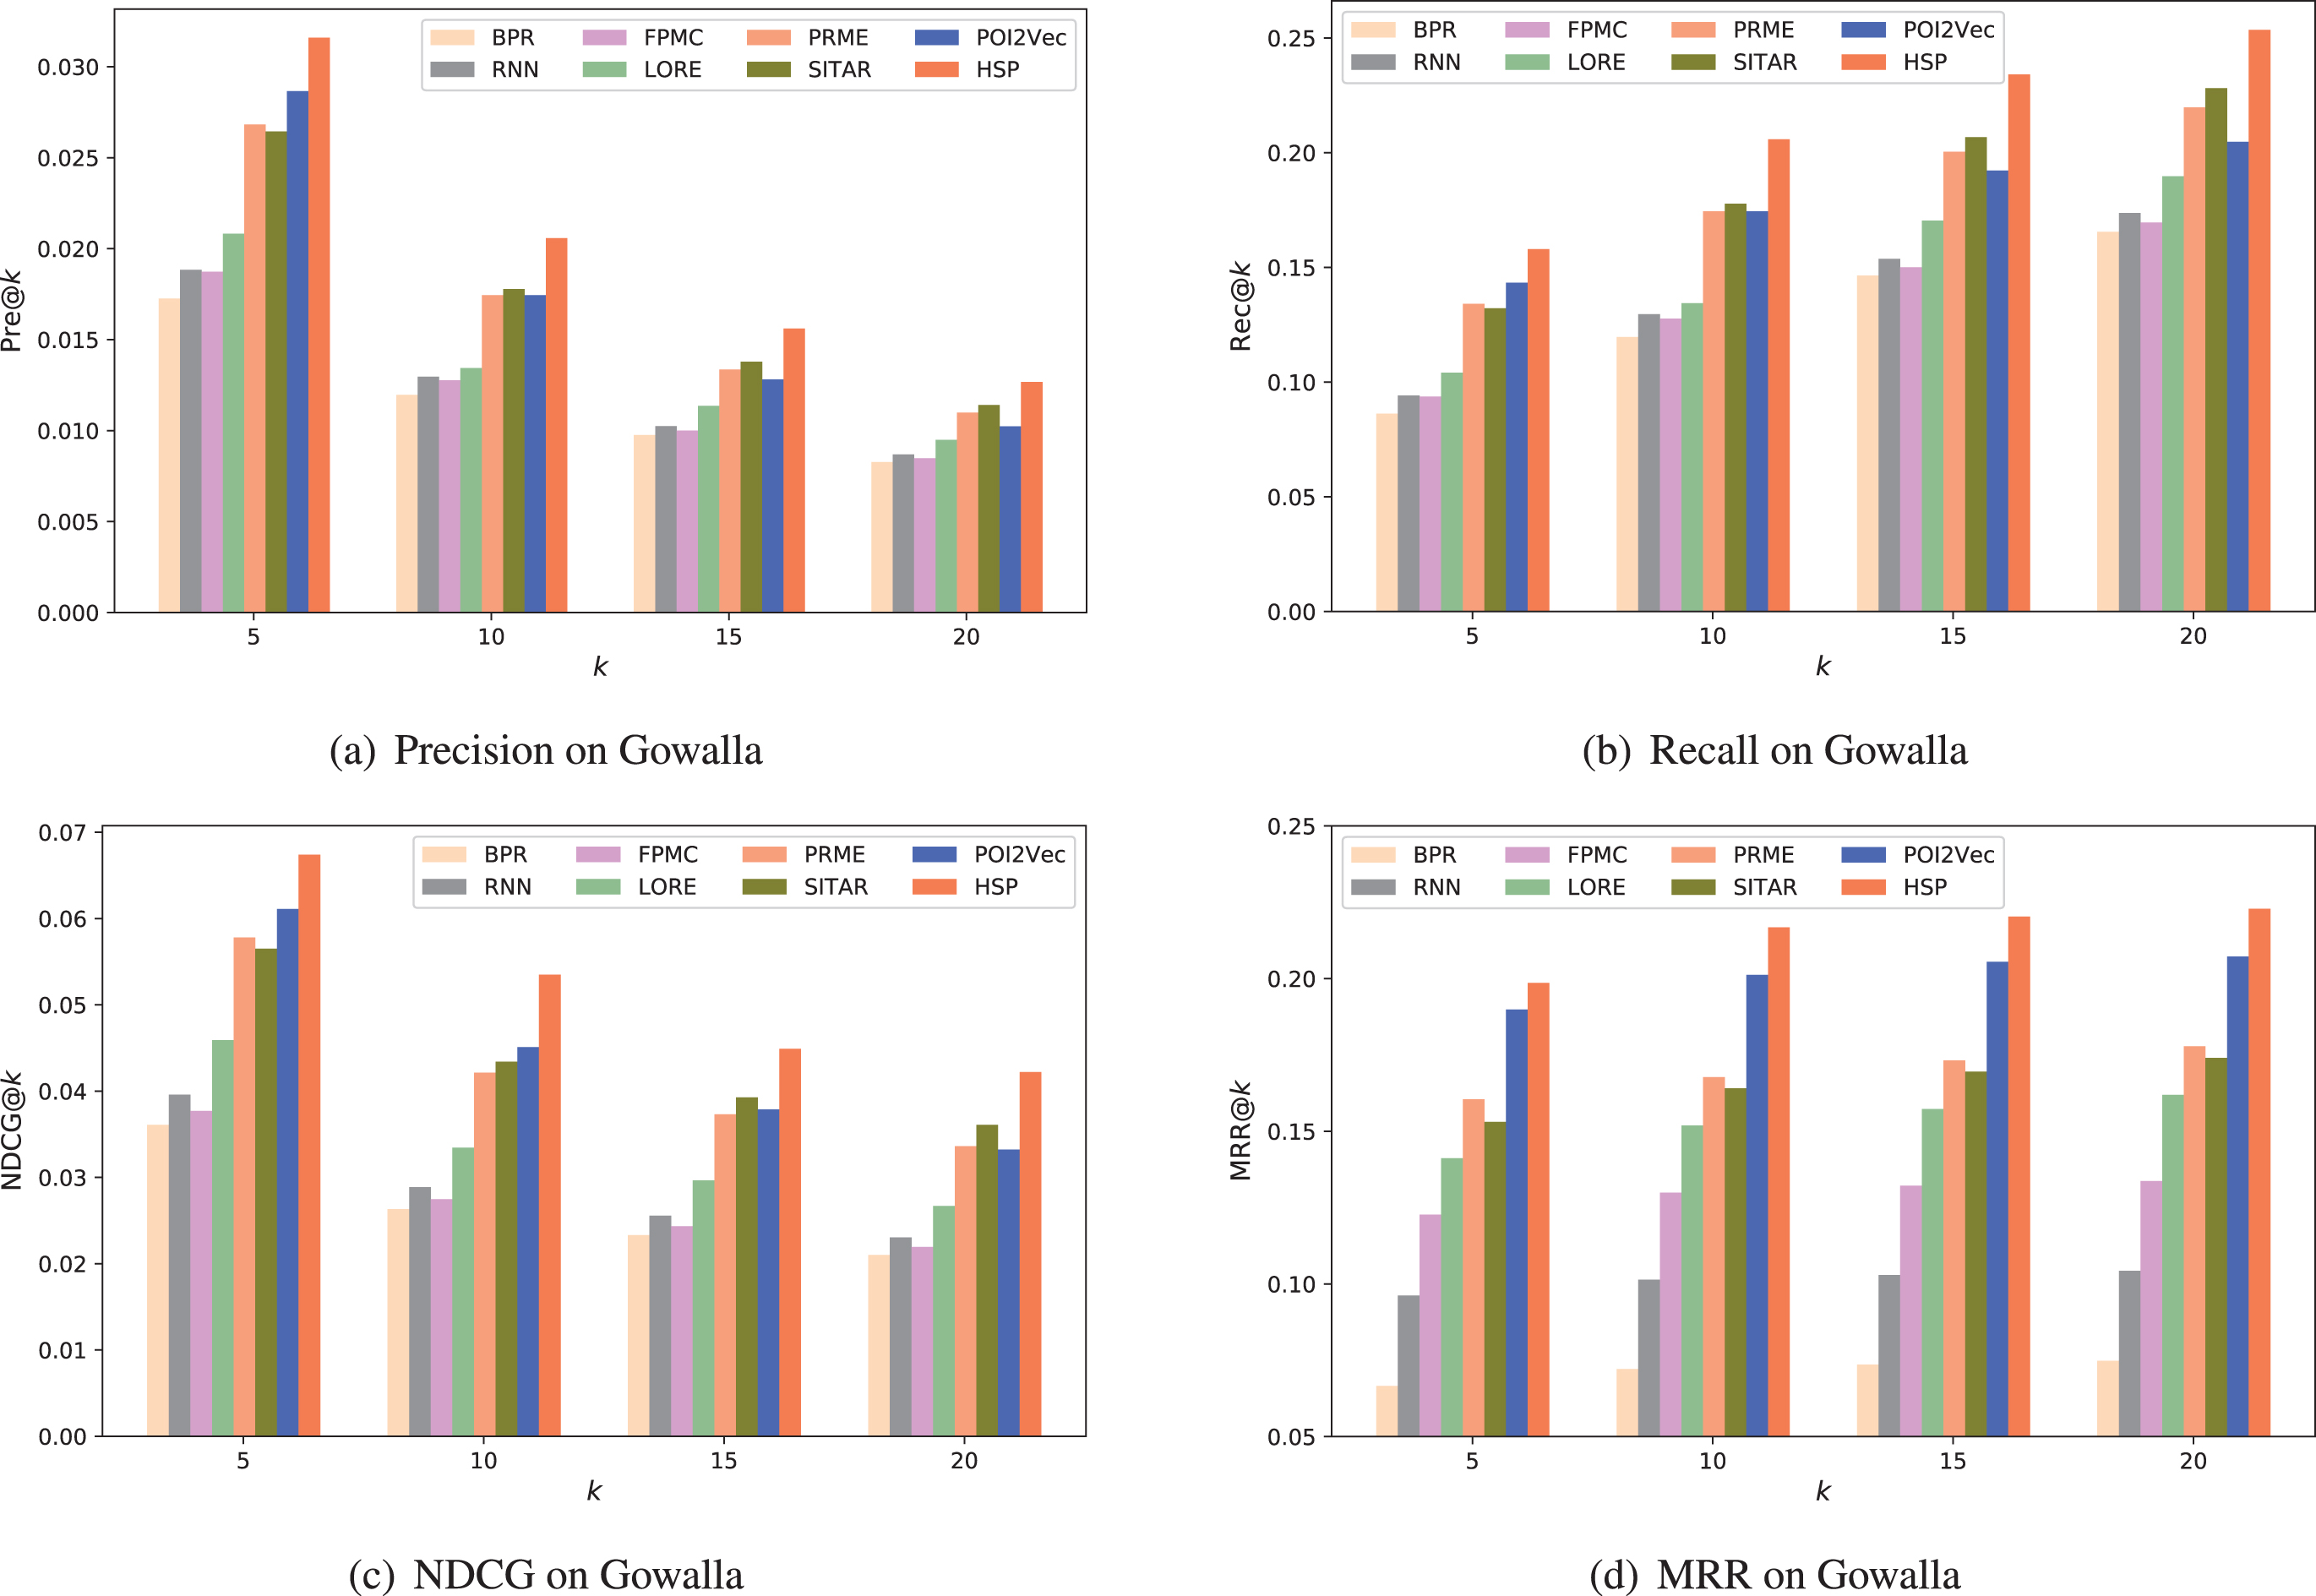
The result of methods on Gowalla.
The execution time (ks) of all the comparison methods
The embedding size is set to 200, and the number of GPU layers is set to 2 for our proposed model. For the parameters of other comparison methods, we follow the best settings in their papers. Note that k in all the tested methods is set between 5 and 20. Greater values of k are usually ignored for the top-k recommendation task.
Based on the results shown in Figure 3 and Figure 4, we can note the following interesting findings.
Firstly, with the increasing value of k, the recall and MRR gradually increase but the precision and NDCG decreases steadily on the two datasets. The reason is that, by returning more POIs for users, it becomes easier to discover the next POI that users prefer to visit. However, the extra recommended spatial items are less possible to be liked by users due to the lower visiting probabilities of these locations, since the recommendation techniques return the locations with the top-k highest scores. The recommendation precision for all the comparing methods are low, since the check-in data on two datasets are very sparse.
Secondly, from the results, we observe that utilizing spatial information is necessary for next POI recommendation. Methods that take spatial influence into consideration generally perform better than those that ignore spatial influence. As shown in Figure 3 and Figure 4, PRME and FPMC are better than BPR, POI2Vec and our proposed HSP are better than SITAR, since PRME, FPMC, POI2Vec and HSP capture the spatial influence effectively on a user mobility behavior.
Thirdly, modeling the sequential patterns of user behaviors can improve recommendation performance, and correct sequential modeling is important for recommendation. The performance of BPR is worse than other comparison methods, proving the effectiveness of the sequential patterns modeling. Additionally, performances of methods based on sequential patterns modeling are influenced by the disordered property. Specifically, performances of sequential based methods on Foursquare are not as good as their performances on Gowalla. The reason is that multiple behaviors occur at a specific time on Fouraquare dataset and we cannot know the true order of these behaviors.
Fourthly, social influence affects the performance of POI recommendation. It is clear that, in Figure 3 and Figure 4, LORE is always superior than FPMC. Moreover, HSP outperforms POI2Vec, and this indicates that combining user’s public preference helps to recommend POIs.
Fifthly, data sparsity problem can be alleviated by combining multiple factors. On the Foursquare dataset, baselines BPR, RNN, FPMC, LORE perform better than on the Gowalla dataset. This is because Gowalla has much sparser check-in data than Foursquare. On the contrary, other comparison methods have stable performance, since they combine multiple factors such as spatial information, sequential patterns and social influence. Additionally, due to the use of region-wise spatial information, HSP and POI2Vec further alleviate data sparsity and achieve performance improvements over other methods.
Overall, our HSP is optimal on both datasets for all these cases. In terms of rec@10 on Foursquare dataset, HSP outperforms BPR, RNN, FPMC, LORE, PRME, SITAR and POI2Vec by 27%, 33%, 20%, 21%, 19%, 35%, and 7%, respectively. In terms of rec@10 on Gowalla dataset, HSP outperforms BPR, RNN, FPMC, LORE, PRME, SITAR and POI2Vec by 72%, 60%, 61%, 53%, 19%, 16%, and 18%, respectively. As shown in Table 2, in addition to recommendation effectiveness, the recommendation efficiency of HSP far exceeds that of other competitive methods based on deep learning. These results clearly demonstrates the competitiveness of our proposed HSP model with respect to other methods. Our region-based sequential pattern and public preference are powerful for next POI recommendation.
Statistical analysis
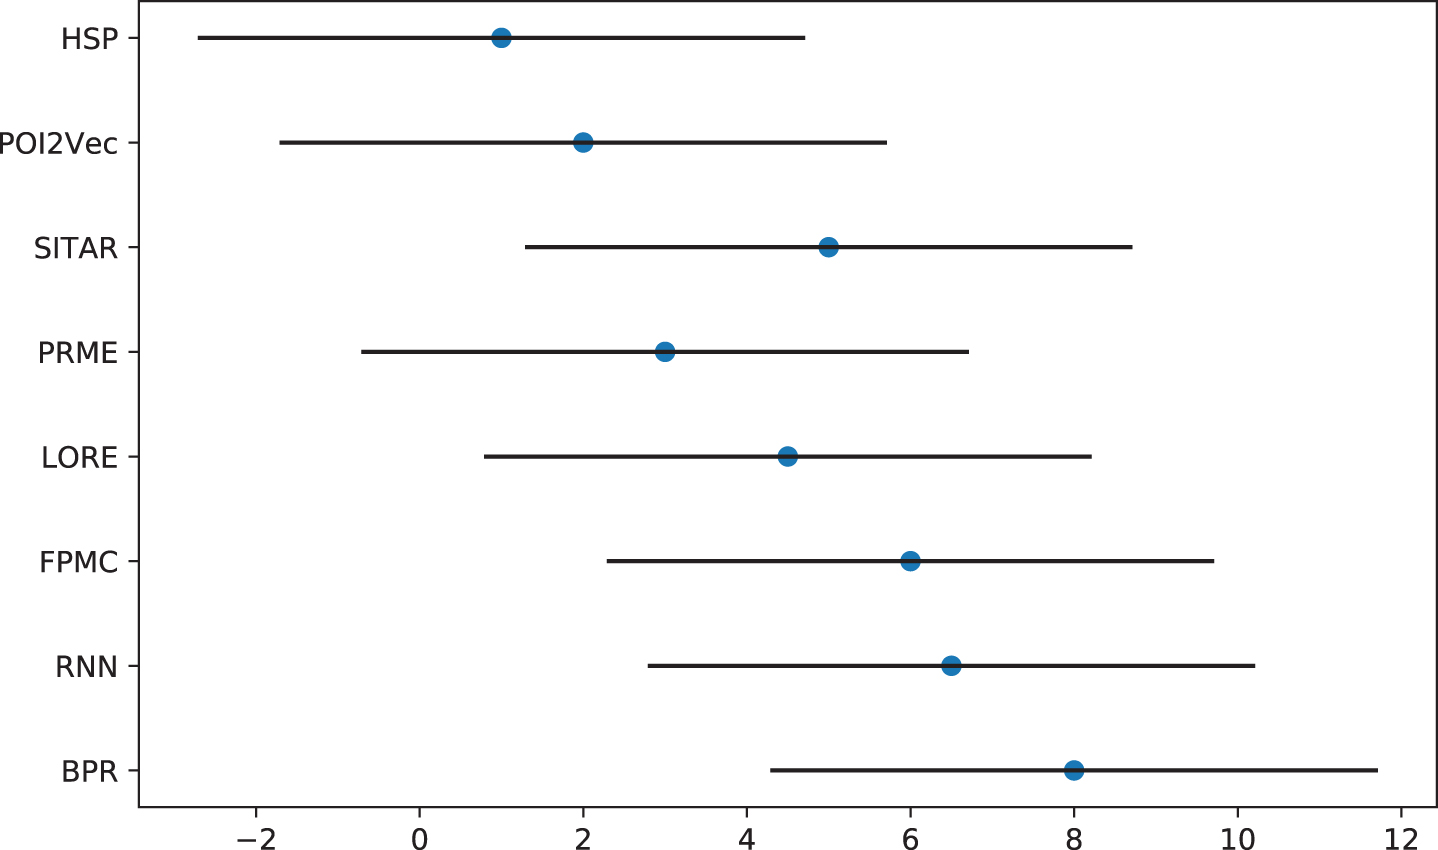
Although there are differences in the performance of all the recommendation methods, it is necessary to assess whether the differences are statistically significant. For this reason, Friedman statistical test [34] was used for recommendation methods statistical comparison.
The statistical analysis was based on the precision values of each method. According to the mean rank obtained by each recommendation method, HSP performs best on both two datasets, and the mean rank obtained is 1. We calculate Friedman statistic value with seven degrees of freedom as 15.79, where α = 0.05. Therefore, the null hypothesis that all methods behave the same is rejected. The differences of the comparison methods are significant. Figure 5 shows Friedman test results. From the results, certain deep learning based methods, such as HSP and POI2Vec perform better than the matrix factorization based method BPR.
Friedman test results.
Overview
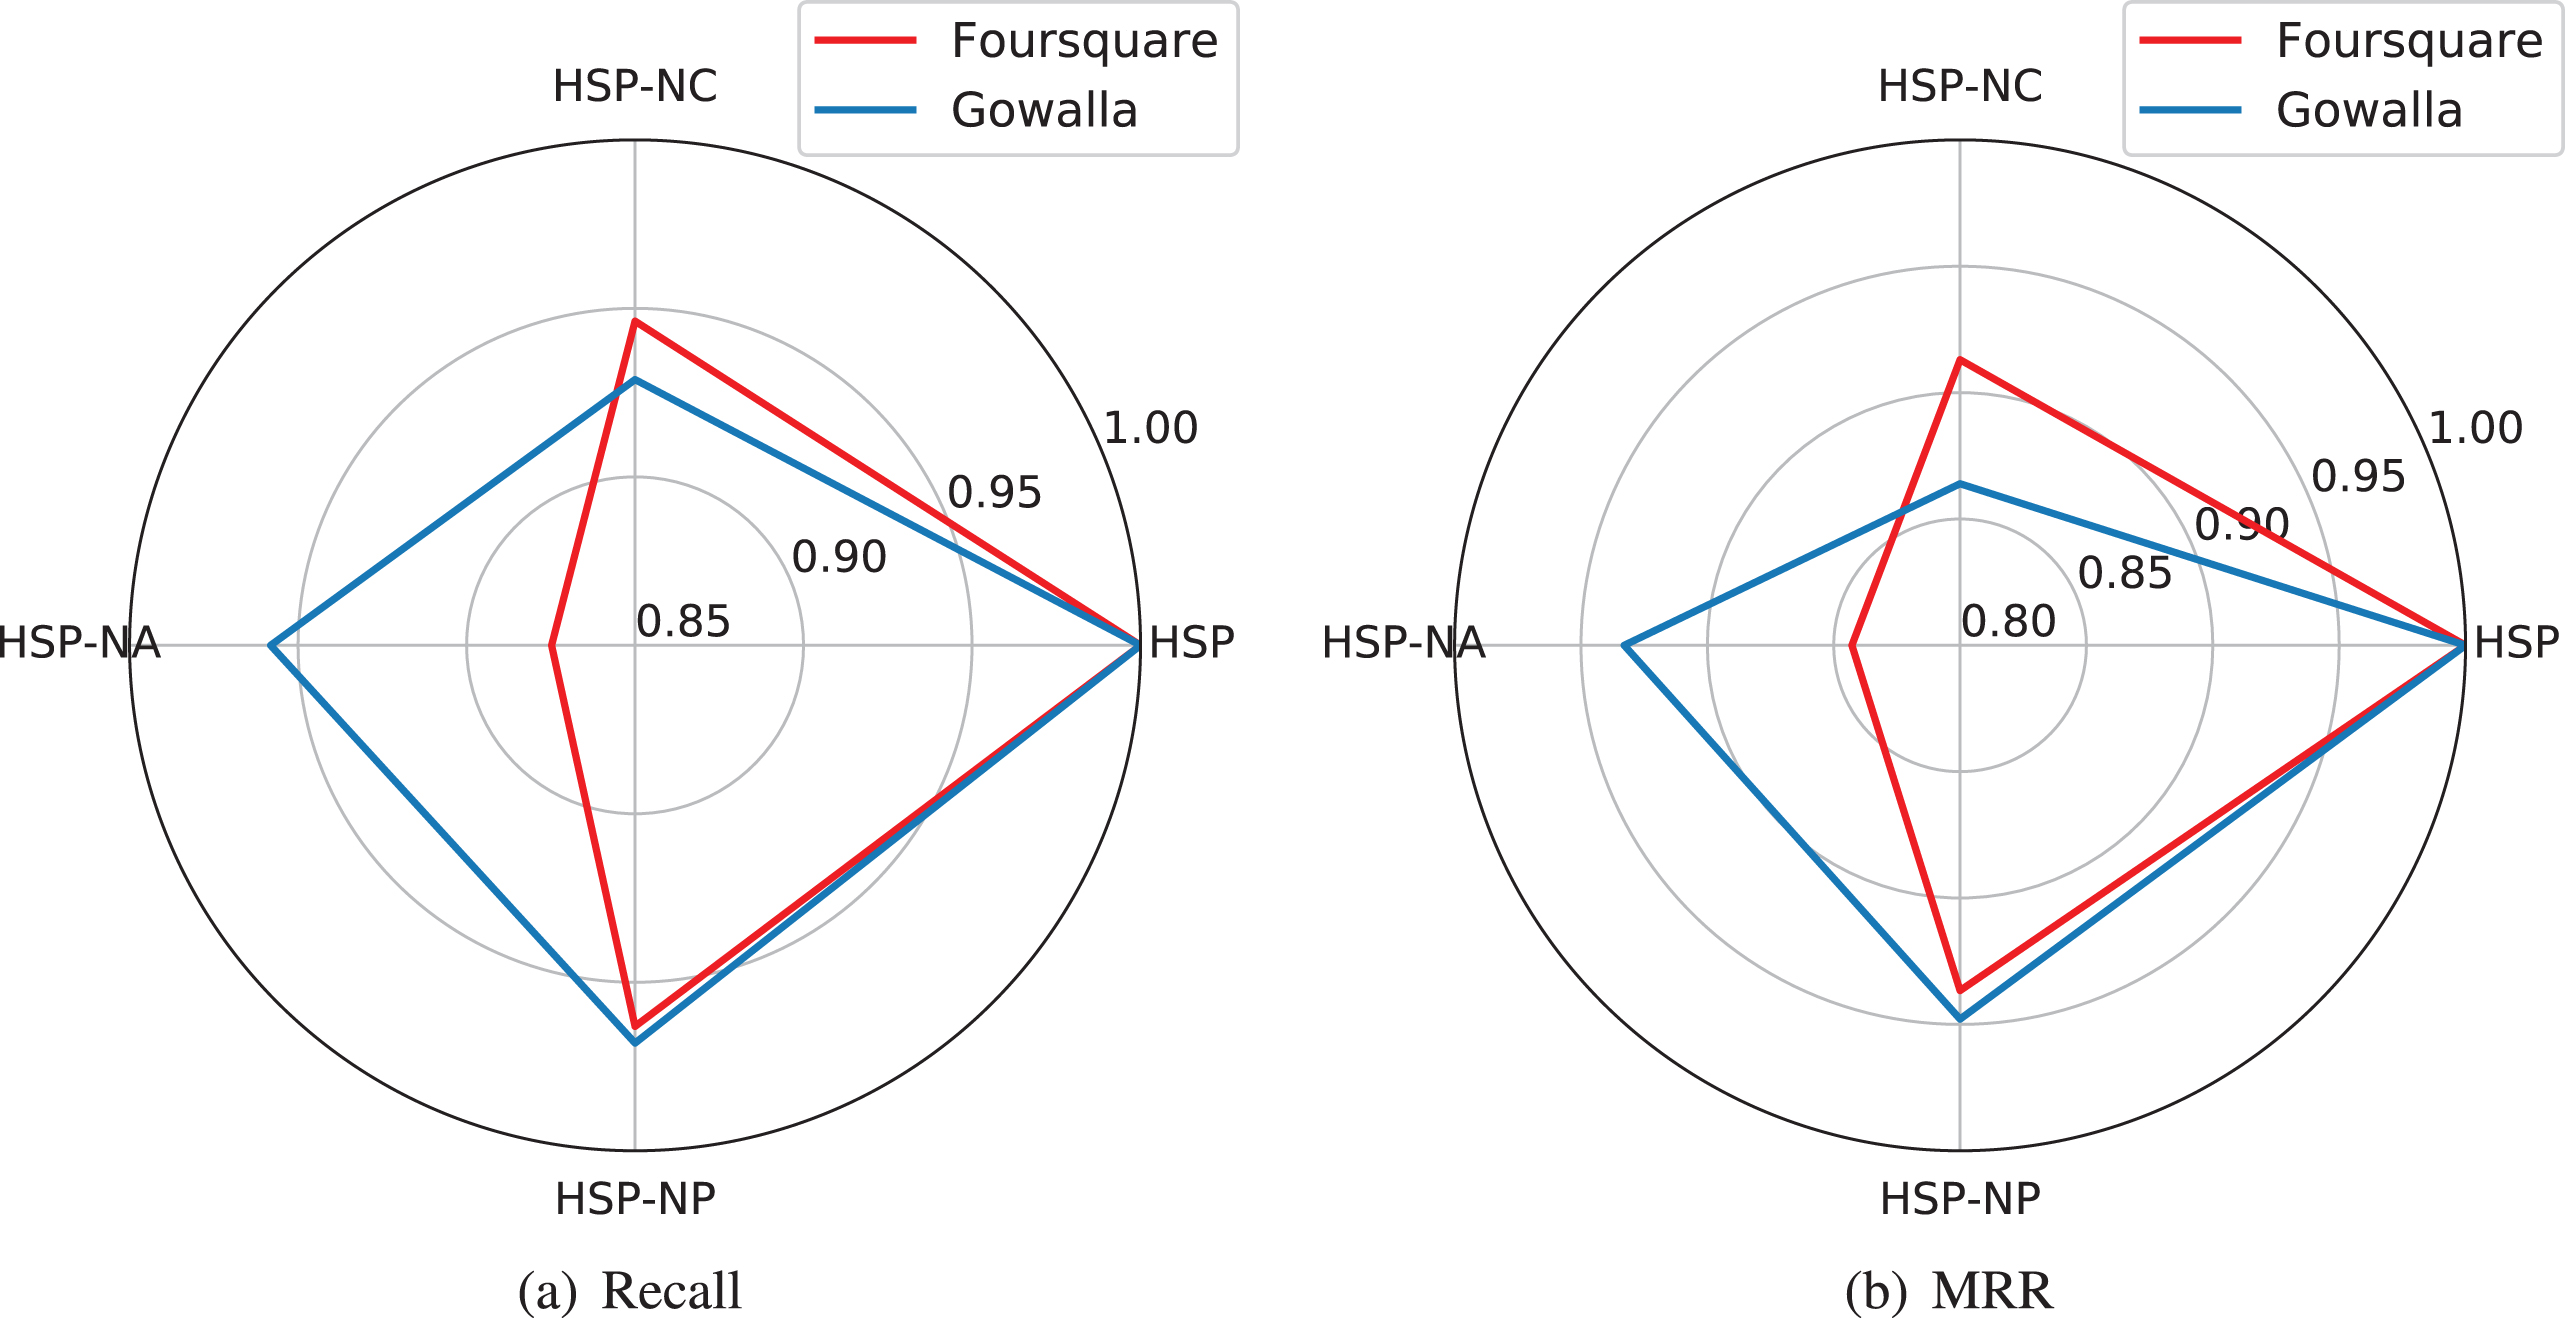
We investigate the performance gain from three components, including region context, ATTRNN, and a hybrid neural network. To be specific, we remove region context, ATTRNN, and public preference from HSP, i.e., HSP-NC, HSP-NA, HSP-NP, respectively. Then compare the precision values and recall values with HSP. We took pre@k, rec@k,NDCG@k and MRR@k to illustrate the performance of the different components shown in Figure 6 and Figure 7. Note that k is set between 5 and 20. To further measure the impact from different components, we calculate the ratio of the average performance of each variant to that of HSP, as shown in Figure 8.

Effectiveness of different components on Foursquare.

Effectiveness of different components on Gowalla.
The degree of influence from the different components.
We validate the influence of region context via HSP-NC. Region context is an important component of HSP. Correspondingly, HSP-NC can only learn the item-level sequential preferences. The significant precision, recall and NDCG drop shown in Figure 6 and Figure 7 verifies that our proposed region context component contributes positively to the performance gain. Besides, from Figure 8, we observe that on Gowalla dataset, among three variants of HSP, HSP-NC has the largest performance degradation compared with HSP-NA and HSP-NP. The reason is that Gowalla dataset has sparser check-in data than Foursquare dataset. HSP-NC captures sequential preference from the sparse check-ins and neglects the user’s inequality of check-ins in different regions, so that the model unable to capture reliable sequential patterns and varied behavioral semantics. Overall, it further validates the importance of region context in next POI recommendation.
ATTRNN for modeling user sequential patterns
HSP-NA, which ignores the attention mechanism, is used to model users’ check-in sequential patterns. As shown in Figure 6 and Figure 7, an obvious performance decrease on both datasets. It shows the substantial effect of the attention mechanism in next POI recommendation. It can capture the dynamics of user check-in sequences, and detect which time step is important for modeling users’ check-in sequential preferences. HSP-NA experiences the most performance decrease compared with HSP-NC and HSP-NP on Foursquare dataset shown in Figure 8. The reason is that there is more than one behavior at a certain time on Fouraquare dataset, making the prediction of the last time step unreliable. HSP-NA ignores the contribution of different time steps. Moreover, the model can still performance well, especially in the scenarios when there are some drop-in check-in locations that interrupt the user check-in sequential patterns.
The impact of public preference
We validate the impact of public preference via HSP-NP which replaces the hybrid neural network unit with a single neural network. As shown in Figure 6 and Figure 7, similar to HSP-NA and HSP-NC, in HSP-NP which ignores the public preference for next POI recommendation, we also notice a significant drop on recommendation performance. In terms of rec@10, The component of public preference contributes 4.39% and 3.73% performance gain on Foursquare dataset and Gowalla dataset, respectively. This is due to the hybrid neural network learns public preference in check-in patterns. The results indicate that the proposed hybrid neural network unit benefits the model performance in next POI recommendation.
Performance study on GRU layer and embedding size
We investigate the performance of HSP with varying the number of GRU layers and embedding size, shown in Figure 9 and Figure 10. In this paper, we exploit the same embedding size for users, regions, and check-ins. Achieving optimal performance and maintaining reasonable training efficiency is important for next POI recommendation methods. From the perspective of performance, we study the sensitivity of HSP to the number of GRU layers and embedding size. We pay attention to the changes in execution time and rec@10 when the number of GRU layers and embedding size change. As can be inferred from Figure 9, nearly all optimal rec@10 results are obtained through a 2-layer GRU structure. Nevertheless, as shown in Figure 9, although the performance of the 3-layer GRU structure is slightly better than that of the 2-layer GRU structure, the execution time is much longer. Also, it can be seen from the Figure 10 that when the embedding size is less than 200, the execution time grows relatively slowly, and when the embedding is above 200, the execution time increases sharply. Therefore, we made a tradeoff between the performance and execution time, and the embedding size is set at 200.
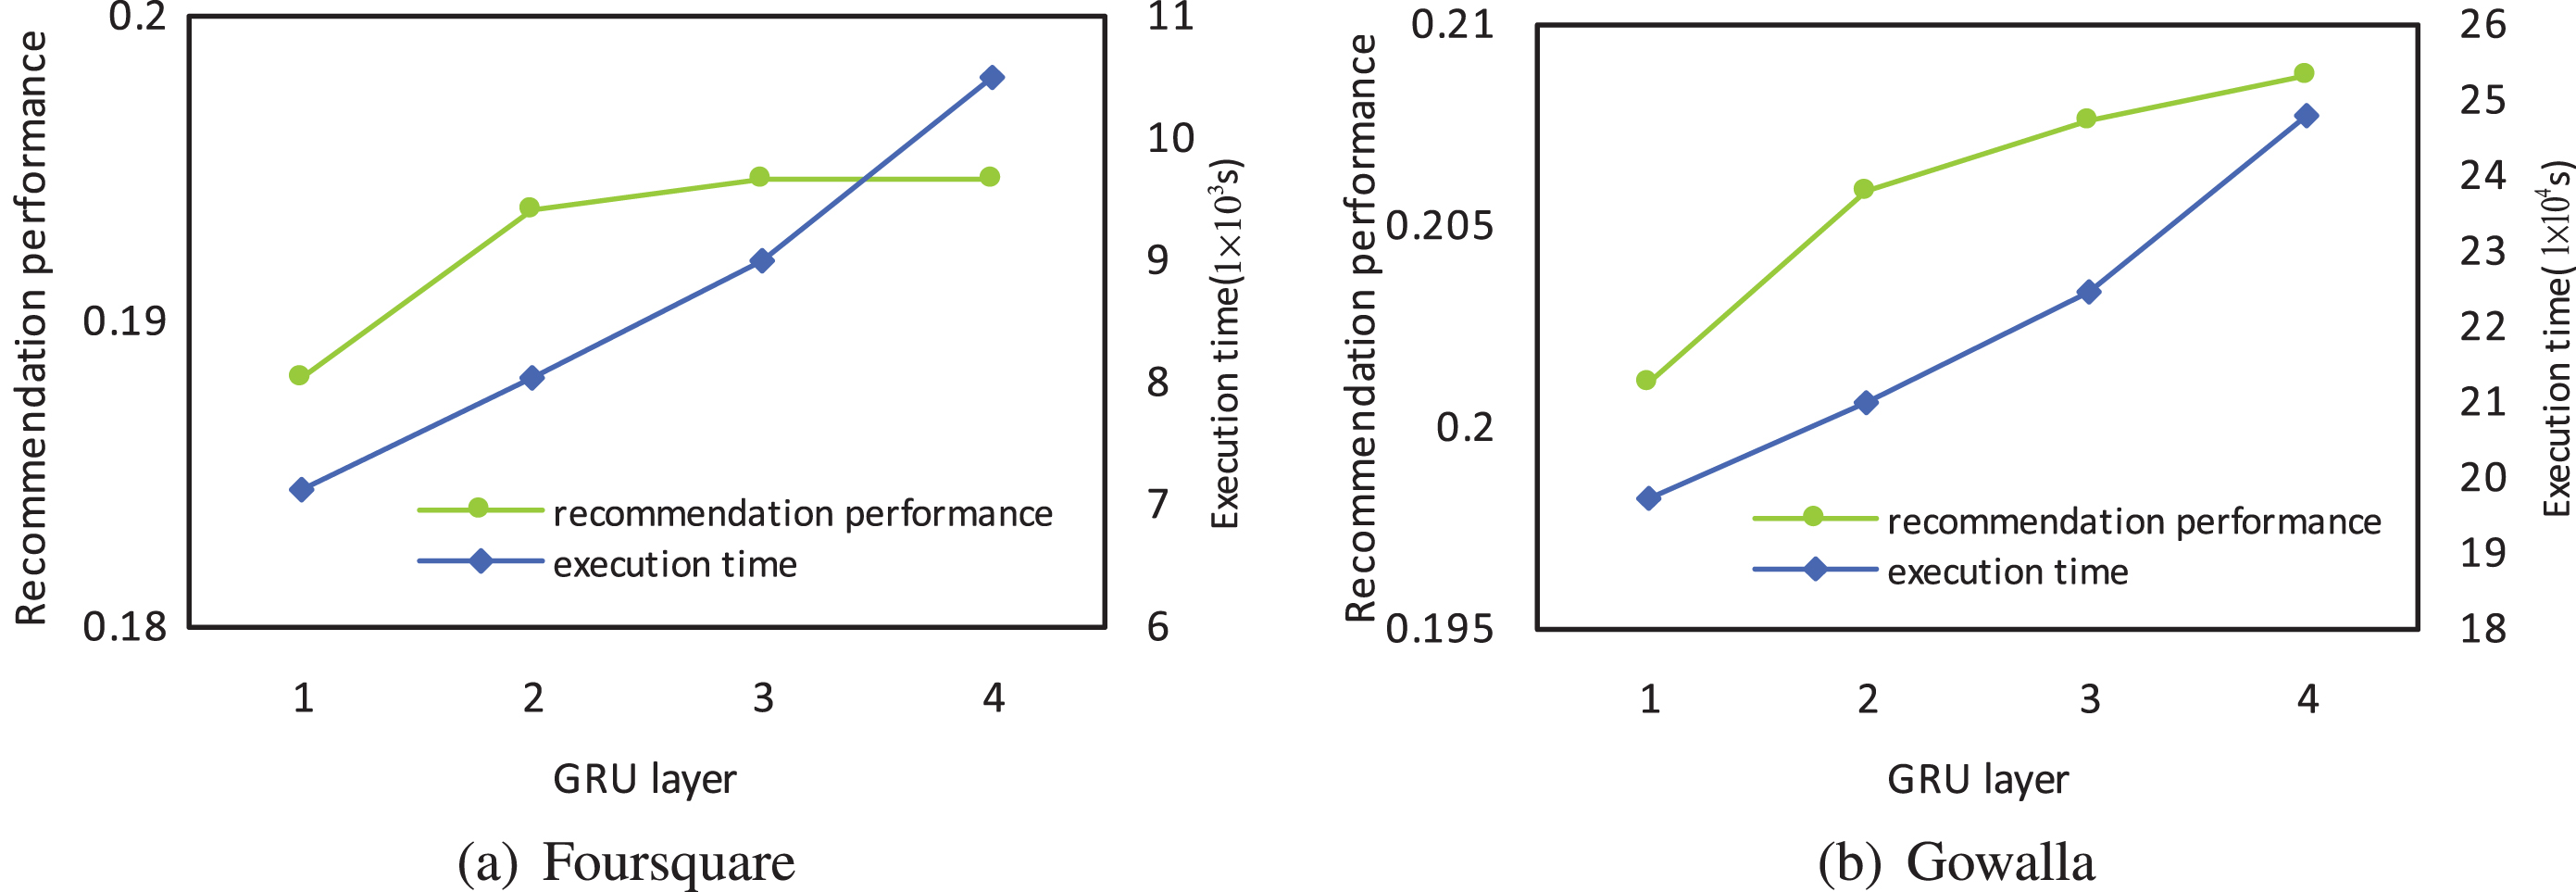
Execution time and the recommendation performance with varying GRU layer.

Execution time and the recommendation performance with varying embedding size.
In this paper we have presented a new method, called HSP, for next POI recommendation. Our method absorbs the merits of recurrent neural network, region-wise spatial information and public preference. The central idea of our method is to learn user preferences, by exploiting sequential patterns and public preference. Extensive experiments based on two public datasets have demonstrated the effectiveness and efficiency of our method.
For future work, we would like to incorporate more content information such as POI’s text content to further improve our method. Moreover, we will further exploit category information in next POI recommendation task. In addition, we are also interested in exploring the impact of user temporal patterns on user movement behaviors.
Footnotes
Acknowledgments
This work is supported by the National Key R&D Program of China (2018YFB1003404) and the National Natural Science Foundation of China (61672142, 62072086, 62072084, U1811261).