
Abstract
In this article, an effective method, called an adaptive covariance strategy based on reference points (RPCMA-ES) is proposed for multi-objective optimization. In the proposed algorithm, search space is divided into independent sub-regions by calculating the angle between the objective vector and the reference vector. The reference vectors can be used not only to decompose the original multi-objective optimization problem into a number of single-objective subproblems, but also to elucidate user preferences to target a preferred subset of the whole Pareto front (PF). In this respect, any single objective optimizers can be easily used in this algorithm framework. Inspired by the multi-objective estimation of distribution algorithms, covariance matrix adaptation evolution strategy (CMA-ES) is involved in RPCMA-ES. A state-of-the-art optimizer for single-objective continuous functions is the CMA-ES, which has proven to be able to strike a good balance between the exploration and the exploitation of search space. Furthermore, in order to avoid falling into local optimality and make the new mean closer to the optimal solution, chaos operator is added based on CMA-ES. By comparing it with four state-of-the-art multi-objective optimization algorithms, the simulation results show that the proposed algorithm is competitive and effective in terms of convergence and distribution.
Keywords
Introduction
Multi-objective optimization problems (MOPs) [37], which involve multiple objectives that need to be optimized at the same time. No matter in scientific research or engineering application [1], since multiple objectives are often coupled and conflict with each other. The optimization of one objective performance may result in the performance degradation of another or more objectives. The optimization problem can be described as follows:
With the effort of more than twenty years from researchers and practitioners in different fields, multi-objective evolutionary algorithms (MOEAs) have become a major methodology for dealing with MOPs [2, 3]. Obviously in the process of multi-objective optimization, there are two key problems to be solved: (1) the approximate solutions obtained should be as close as possible to the true optimal front; (2) the approximate solutions obtained should be evenly distributed throughout the front (i.e. balance convergence and diversity). Over the past two decades, a large number of MOEAs have been proposed. The principal methods adopted at present can be divided into three categories [4], ranging from dominance-based framework [5–9], indicator-based framework [10–13], and decomposition-based framework [14–16].
Although, the dominance-based framework and the indicator-based framework are quite popular, they have certain limitations. In the dominance-based framework, where Pareto ordering is adopted to determine the optimal front of the population. One of the main drawbacks is that most of the candidate solutions generated in a limited-scale group are non-dominated, making it difficult to distinguish candidate solutions based on the dominant selection criteria while the objective function increases [17]. Therefor, it is not suitable for many-objective optimization. Although the indicator-based algorithm is not affected by the advantages of MOEAs based on MOPs, the computational cost for the calculation of the performance becomes prohibitively expensive when the number of objectives is large [18].
In recent years, an MOEA based on decomposition (MOEA/D) proposed in [14] has attracted much attention in the area of MOEAs, which decomposes MOPs into a set of simple optimization subproblems and solves them in a collaborative manner. However, decomposition-based algorithms face their own challenges. One major challenge is that the decomposition-based method needs to specify a set of weight vectors, which significantly affect the performance of the algorithm in terms of diversity. Several variants and implementations of MOEA/D employ simplex-lattice design method [19] to generate evenly distributed weight vectors. However, in this method, the population size dramatically grows as the number of objectives increase and the setting of population size is not flexible. In MOED/D-DRA [21], a weight vector generation method based on uniform random sampling paradigm [20] is adopted. The advantage of the uniform random sampling method over simplex-lattice design is that the setting of population size is flexible. Recently, Tan et al. [22] proposed a new version of MOEA/D (UMOEA/D). UMOEA/D adopts the uniform design method to set the aggregation coefficient vectors of the subproblems. Compared with MOEA/D, distribution of the coefficient vectors is more uniform over the design space, and the population size neither increases nonlinearly with the number of objectives nor considers a formulaic setting. Deb and Jain [23] proposed a reference-point-based evolutionary algorithm (NSGA-III) with two-layer weight vector generation method. The two-layer weight vector generation method overcomes the limitation of the simplex-lattice design method in generating relatively small number of evenly spread weight vectors. In another aspect, the dynamic reference point is adopted by adjusting a parameter in [25], which can strike a good balance between exploitation and exploration. In [27], the effect of increasing population diversity by calculating the angle between the objective vector and the reference vector is achieved. To deal with the irregular PF frontier, a multi-objective evolutionary algorithm (MOEA-NAA) based on neighborhood adaptive adjustment and enhanced reference vector is proposed in [52]. The effectiveness of these algorithms in solving problem with a highly irregular PF has been proved. Due to the effectiveness and simplicity of the decompose frame based on reference point, it has been widely applied in MOPs. Therefore, a decomposition framework based on reference points will be applied in this paper.
More specifically, the decomposition mechanism decomposes MOP into many separate subproblems, and solve them cooperatively. In this respect, any single-objective operators can be potentially plugged as search engine for the single-objective subproblems. For example, polynomial mutation, SBX crossover [28, 29] and differential evolution (DE) [30], where the latter is believed to be among the better performing implementations. However, the crossover rate and mutation rate are difficult to determine in the actual calculation. The global optimal solution in the convergence domain can not be guaranteed when the crossover rate and mutation rate are small, while large rate will increase the number of iterations [14]. Sometimes the rate needs to be adjusted manually, which will reduce the objectivity of the algorithm. The underlying objective of mutative strategy parameter control is roughly to favor previously selected mutation steps in the future. If this goal is strictly pursued, a completely asymmetric adaptive scheme will be produced, which can adapt to any normal variation distribution. Moreover, this inclusion of single-objective optimizers might not always be straightforward due to two additional specificities of the MOEA/D framework related to the cooperativity among the search process of the scalar problems.
To meet the previously stated demands, CMA-ES [31] was proposed, which is one of the most successful single objective evolutionary algorithms as a core single-objective evolution engine to generate new solutions by sampling a multivariate Gaussian distribution model. In [32], CMA-ES considered as a state-of-the-art optimizer for single-objective blackbox continuous problems, which can be greatly improved through accumulation-using evolutionary paths instead of a single search step. In [33], an extension of CMA-ES for multi-objective optimization (MO-CMA-ES) is proposed and studied under the framework of NSGA-II. The algorithm uses Pareto dominance and its performance index selection. Each individual solution is associated with a different Gaussian model. Due to the invariant nature of CMA-ES, MO-CMA-ES proved to be a very favorable variable when processing MOP interactively. In MOEA/DD-CMA [34], a new algorithm based on CMA-ES and MOEA/DD [35] was proposed. It uses the selection mechanism of MOEA/DD that employs dominance and decomposition simultaneously to increase the diversity of the solutions found, although with a slower convergence rate. In [36], the covariance strategy to combine with differential evolution is used to solve the deviation problem and get good results. Since CMA-ES considers the adaptive strategy for controlling step size in sampling new solutions, it is potential to exploit the optimal solutions in a small area.
Moreover, genetic algorithms have the disadvantage of slow convergence [49]. The main reason for the premature convergence of CMA-ES is that all individuals in the group have too much selection pressure during the early evolution process, which leads to a rapid convergence in the pattern. In order to prevent local premature convergence, a chaotic operator is introduced, which uses the specific inherent randomness and ergodicity of chaotic variables to jump out of the local best. In [50], a novel genetic algorithm containing chaos operator was proposed based on the analysis of population diversity and premature convergence within the framework of Markov chain. This algorithm increases the population size dynamically so as to restore the population diversity and prevent premature convergence effectively. J. Li [51] used the properties of ergodicity, stochastic property, and regularity of chaos to lead particles’ exploration to prevent the prematurity of particles.
Based on the existing studies, covariance matrix adaptive strategy in reference point-based multi-objective evolutionary algorithm is proposed in this paper, and the main improvements of RPCMA-ES are listed as follows:
(1) A decomposition framework based on adaptively adjusted reference vectors is applied. By calculating the distance between the target vector and the relevant reference vector, which can effectively select uniformly distributed particles and search the entire boundary.
(2) CMA-ES is used as a way to generate a new population, which guides individuals to search in a better direction. The application of CMA-ES strategy improves the convergence performance and accelerates the convergence speed of the algorithm.
(3) Chaos operator is added to the original CMA-ES algorithm to prevent individuals from falling into local optimum. The new distribution mean will be generated by the chaotic equation, which can guide the search of population with better probability and find the global optimization.
The remainder of this paper is organized as follows. Section 2 describes the covariance matrix adaptive mechanism, the generation of reference points and the details of RPCMA-ES. Section 3 presents the simulation results compared with other algorithms. Finally, the conclusions and some possible paths for future work are provided in Section 4.
More recently, a set of direction vectors are used to decompose the entire PF into several segments, each of which is a multi-objective subproblem. This decomposition strategy has aroused some interest. For example, in NSGA-III [23], a set of reference points or reference lines is used for niche preservation to manage diversity in each subspace for many-objective optimization, which effectively enhances convergence by giving priority to solutions closer to the reference points. In RVEA [27], a reference vector-guided EA for multi-objective optimization was proposed. The reference vectors can be used not only to decompose the original multi-objective optimization problem into a number of single-objective subproblems, but also to elucidate user preferences to target a preferred subset of the whole PF. Therefore, a framework based on reference point decomposition will be used in this paper. Fig. 1 illustrates the overall flowchart of the framework based on reference point decomposition.

The overall flowchart of the framework based on reference point decomposition.
In order to screen out the non-dominant solutions with good diversity and convergence effectively, reference points are introduced into objective space and the objective space is divided according to the reference vectors. Thus, a set of uniformly distributed reference vectors on a hyperplane need to be generated by the method proposed in [41].
In this method, the number of reference points is calculated by
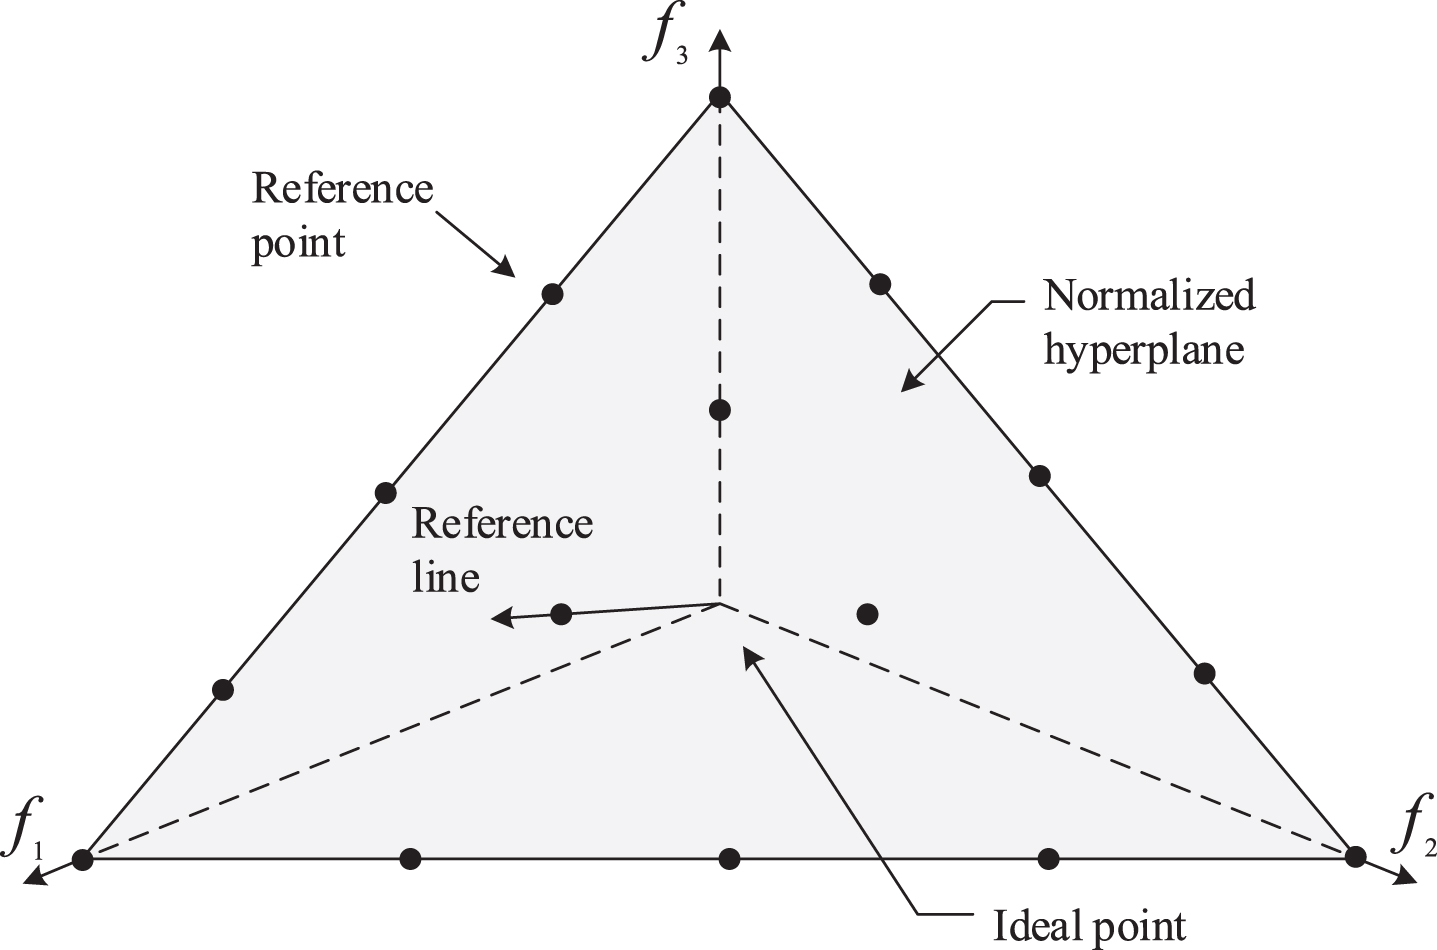
15 reference points on the normalized hyperplane for 3-objective problem with P = 4.
If the population size is N, N reference vectors will be generated to divide the objective space into N sub-regions. Thus, the population is divided by calculating the angle of individuals in the population to each reference vector and the reference vectors of the minimum angle are correlated. As shown in Fig. 3, for each objective vector t
i
, the angle between t
i
and the reference vector w
i
is calculated by the Eq. (4):
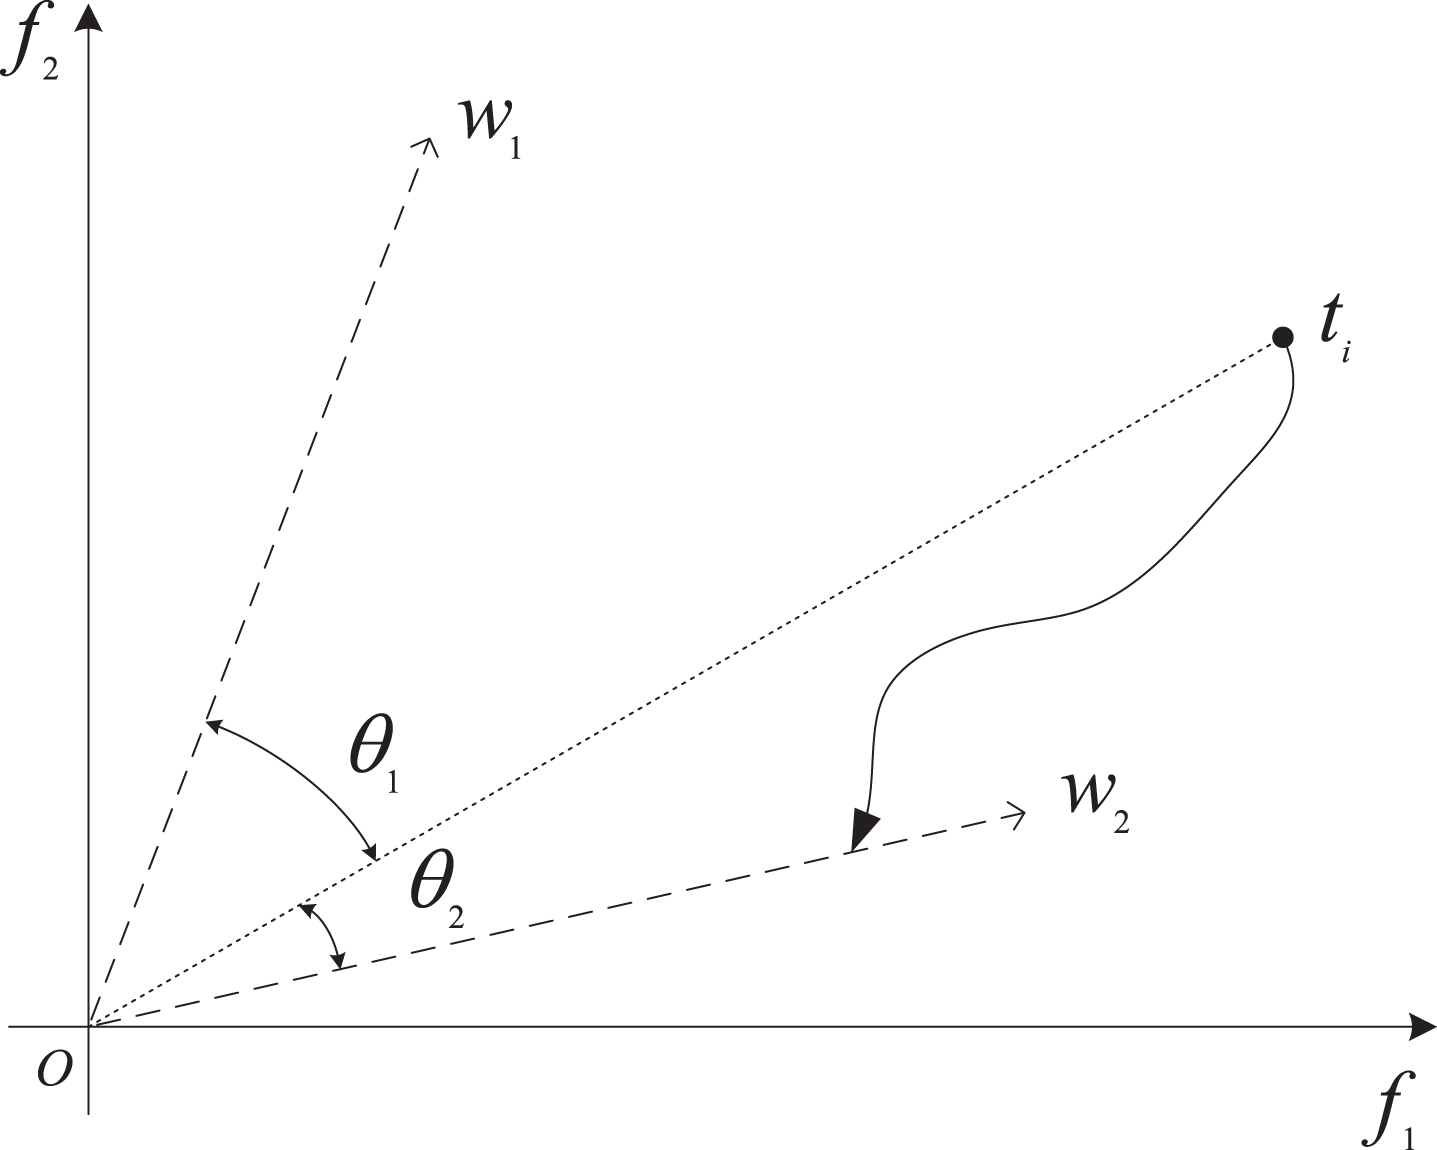
A schematic diagram of the reference vector associated with the objective vector. t i is a objective vector, w1 and w2 are the the reference vectors. θ1 and θ2 are the angles between t i from w1 and w2.As can be seen from the Fig. 3, θ2 is smaller than θ1, so t i is related to w2.
The quality of the solution is evaluated by a series of reference points so as to assist in controlling the distribution of population in the objective space. This evaluation method will be described in detail in the Environmental Selection.
Covariance matrix adaptive is a kind of random numerical optimization algorithm that calculate gradient is not needed, which increases the probability of correct search direction by changing the covariance matrix. Note that the evolutionary strategy is different from the genetic algorithm, but both are important variants of the evolutionary algorithm.
The parameters involved in CMA-ES are mean value of distribution
More specifically, the detailed operations of CMA-ES are presented in Algorithm 1. As described in Algorithm 1, each subproblem generates subpopulation through the CMA-ES operation. The CMA-ES adopted in this paper follows the literature [42]. The step1 is the initialization process. Firstly, the initial parameters are set, which
1:
2:
3: m i ← the ith individual in P t ;
4: Initialize
5:
6:
7:
8:
9:
10:
11: Generate the average candidate distribution using (11);
12: SetΛ = X ⋃ m i ;
13: Λ = TruncationSelection (Λ);
14: Update Parameters{P
c
, P
σ
,
15: Q = Select (Λ);
16:
17:
After the sampling process is completed, the central point of the new population is updated by selecting the optimal solution from the generated population as a sub-population for recombination. Each candidate solution (i.e. the number of individuals is combined with the mean value of the extracted sample and the birth distribution) is sorted according to the value of the objective function where the annotation xi:λ for the ith best solution(i.e. f (x1:λ) ≤ . . . ≤ f (xu:λ) ≤ f (xu+1:λ) ≤ . . . ≤ f (xλ:λ)) is used, then the first μ (μ = λ/2) individuals are selected to update distribution parameters by truncation selection.
The new average distribution is calculated by the Eq. (6):
The Method of combining rank-1-update and rank-μ-update is used in update operation, which is described by the Eq. (7):
Covariance requires fully excavating a series of relevant information between evolutionary generations to be updated. Hence, the concept of evolutionary path is introduced in [31, 38]. Evolutionary path
In the updating of covariance matrix, only the variation direction is controlled by
The evolution path
Most of the parameters in the above formula are self-contained. When the birth parameter is set, the algorithm will iterate and loop in accordance with the above operations and gradually search for the global optimal solution until the stop condition is reached.
Termination conditions play an important role in the optimization of restart subproblems and the reduction of resource waste in CMA-ES. The part of the descriptions in the literature are applied [42], which are described as follows: NoEffectCoord. Reset if adding 0.2-standard deviations in any single coordinate does not change NoEffectAxis. Reset if adding a 0.1-standard deviation vector in any principal axis direction of TolXUp. Stop/Reset if σ(g) · max (diag ( ConditionCov. Stop/Reset if the condition number of the covariance matrix exceeds 1014.
Therefore, it means that the current optimization of the problem is over and the next sub-optimization process is started as long as any of the above conditions are met.
Most CMA-ES algorithms iterate according to Eq. (5)-(10) and search for the optimal solution. In order to make the new average distribution mean more likely to approach the optimal solution and avoid falling into the local optimal solution, chaos operator [43] is added on the basis of CMA-ES.
The chaos operator takes the current mean as the initial point after each update of the distribution mean, and uses the Eq. (11) to generate the candidate mean:
The new generation of distribution mean can not only ensure the population to search in a better direction, but also jump out of the local optimum effectively, which improves the convergence of the population.
After the generation of offspring population, the current population size is 2N, and it is necessary for an effective selection mechanism to select excellent N individuals from 2N individuals as the population of the next iteration. The process uses the reference vectors to divide the objective space into subspaces with the same number as the initial population size. The best individuals will be chosen in these subspaces. The process is described in Algorithm 2
1:
2: R = Normalization (P);
3;
4: Partition the Population: calculate angle between x i ∈ R and v j ∈ V using (16),associate all individuals with reference vectors;
5: Calculate the Angle-Distance of each reference vector and the individuals associated with it which will operate independently in each of the sub-regions by using (17);
6: Select the closest individual to each reference vector through AD;
7:
The main framework of the environmental selection is divided into five parts. First of all, since the non-dominant solutions may be different in the range of each objective value, scaling operation is needed to convert the objective value to facilitate the next association operation, the initial population can be standardized as
The angles between individuals x i ∈ R and each reference vector v j ∈ V are calculated as
The objective space is divided into N independent subspaces by reference vectors. Through the numerical ordering of Eq. (4), the individuals of the population can be determined which reference vectors to associate with.
Eq. (4) calculates the cosine value between the objective vector and all reference vector. By cosine value sorting, the reference vector with the largest cosine value (i.e., the smallest angle) of the objective vector can be determined. The reference vector can be considered to be associated with the objective vector. Traverse all reference vectors associated with individuals, then the method mentioned in literature [27] will be used to calculate the angle-distance (AD) which be explained by the Eq. (14):
Finally, Zmin and Zmax are recalculated to adjust the reference vector adaptively by the Eq. (15):
The basic idea is use Zmin and Zmax to zoom in or out according to the shape of the leading edge so as to change the position of the reference vector for guidance and provide a better search direction for the next iteration.
The pseudocode of the method is shown by Algorithm 3. The strengths of the selection mechanism according to the position of reference points and population individuals are used in RPCMA-ES. The individuals with good convergence and diversity are selected to guide the population to search in a better direction. It can be seen that the proposed algorithm includes initialization, CMA-ES evolution process, selection of reference vectors and adaptive adjustment of reference vectors. First, randomly generate an initial population P of size N. Second, a set of uniformly distributed reference vectors V (|V| = |P|) are generated to evaluate the diversity of these solutions. It is well-known that a set of uniformly distributed reference vectors can divide the objective space into several independent sub-regions. Next, covariance adaptive adjustment strategy is adopted to ensure the generation of more excellent sub-population, which is the main contribution of this paper. Finally, the optimal individual is selected from the combined population according to the relationship between the objective value vector and the reference vector.
1: Generate a random set of solutions: P = {x1, x2, . . . , x N };
2: Generate a set of uniform reference vectors from reference points: V = Generate (N, m);
3:
4: Q = CMA - ES (P);
5: R = P ⋃ Q;
6: P = RP - Select (gen, R, V);
7: V = AdaptiveAdjustment (V);
8: gen = gen + 1;
9:
10:
Experimental results
Aim at testing the effectiveness of the proposed algorithm, four popular algorithms are selected for comparison including RVEA, NSGA-II, R2MOPSO, and MOEA/D-STM. In this section, an introduction to the test function and performance index is given. Then, the parameter settings of each algorithm are described, and the experimental results are analyzed finally.
Test problems
To test the performance of the algorithm which is proposed in this paper, WFG1-WFG10 benchmarks are used. The PF of WFG test problems has the characteristics of linear, convex, concave, mixed, multi-modal or discontinuous [44]. Besides, any number of objectives and decision variables can be scaled to in WFG test problems. They present a significant challenge for an evolutionary algorithm to find a well-converged and well-distributed solution set. Moreover, the true Pareto optimal front is known for these problems. The number of decision variables is set to D = k + l for WFG problem instances, where the position-related variable k = 18 and the distance-related variable l = 14. In this work, 2-objective and 3-objective of these problems are focused.
Performance indicators
In this paper, the performance indicators of inverted generational distance (IGD) [45, 46] and HV are widely used to evaluate the performance of the algorithm, on account of no one indicator can assess a MOEA [47, 48] comprehensively.
(1) IGD indicator [26]: IGD is the comprehensive performance evaluation index of a algorithm, reflecting the distribution and convergence of a algorithm. Let S be a set of approximate solutions in the objective space, F is a solution set uniformly distributed on the real PF. The PF contains 1,000 points which is knew from the start. The IGD value is defined as:
(2) HV indicator [24]: The hypervolume measures the volume of dimensional regions in the objective space enclosed by the non-dominant solutions set and reference points obtained by the multi-objective optimization algorithm. The mathematical expression of hypervolume is as follows:
The parameters of the proposed algorithm are set as follows: the population size is set to 50 for 2-objective and 105 for 3-objective, which is determined by the objective number m. For WFG1-WFG3, WFG8 and WFG10, the number of generations is set to 1000. The number of generations is set to 800 for WFG4, is set to 500 for WFG5, WFG7, and is set to 300 for WFG6, WFG9.
The parameter settings for the CMA-ES strategy are shown in Table 1. λ represents the number of samples and λ ≥ 2. μ is the number of selected search points in the population, which is set to λ/2 by truncation selection. ω k is positive weight coefficients for recombination, Eq.(6) calculates the mean value of µ selected points. c1 and c μ are the learning rates of the rank-one and rank-µ update respectively. μ eff is the variance effective selection mass. μ cov is the parameter for weighting between rank-one and rank-µ update, which determines their relative weighting and is chosen as μ eff is most appropriate. d σ is damping parameter for step-size update, which scales the change magnitude of step size. c c and c σ are the backward time horizon of the path P c and the learning rate for cumulating for the step-size control respectively.
Parameter settings for CMA-ES
Parameter settings for CMA-ES
In order to be fair, the number of iterations and population size in the comparison algorithm are consistent with the RPCMA-ES. For the crossover and mutation operator, the distribution index is set to η c = 20. In addition, the crossover probability p c = 1.0 is used in the compared algorithms except R2MOPSO. For the polynomial mutation, the distribution index and the mutation probability are set to η m = 20 and p m = 1/n, respectively in the four algorithms. The neighborhood size T is set to 20 in decomposition framework, and the particle of agemax T a is set to 2 in R2MOPSO. For each test function, all algorithms run 20 times independently.
To verify the statistical difference between RPCMA-ES and other compared algorithms, an useful statistical test is recommended to be conducted. The Wilcoxon signed-rank test can be used to make simple pairwise comparisons. Therefore, this statistical test is used herein.
Wilcoxon signed-rank test is a non-parametric method used to test whether there is a significant difference in the distribution of the population from which two pairs of samples come from. First, the observations of the corresponding samples of the first group are subtracted from the observations of the second group of samples, respectively. If the difference is positive, it is recorded as ′ + ′; if it is negative, it is recorded as ′ - ′, and the difference data is also saved. Subsequently, the difference data are sorted in ascending order, and the rank of the difference is obtained. Next, the positive sign rank sum W+ and the negative sign rank sum W- are calculated in steps.
Eventually, if the p-value does not meet the acceptable criterion, then, the null hypothesis could not be held. In this paper, the significance level is set as 0.05. When p-value is greater than 0.05, it means that the compared HV mean values or IGD mean values are similar in statistics.
As can be seen from Tables 2-5, the oblique bold of p-value in tables shows that there is no significant difference between RPCMA-ES and other algorithms. For WFG2, there is no significant difference between RPCMA-ES and NSGAII in the HV values of 2-objective, 3-objective, and IGD values of 3-objective; similarly, there is no significant difference from RVEA in HV values of 3-objective Sexual differences. For WGF9, RPCMA-ES is not significantly different from NSGAII and RVEA in the index values of the 2-objective and 3-objective, respectively. In addition, there is no significant difference between the algorithm of this paper and NSGAII in the IGD value of WFG4 with a 3-objective. In addition to the above-mentioned relationship with no significant difference, there are obvious differences in the remaining test functions. These tables clearly indicate that RPCMA-ES received more significant in most test functions than other comparison algorithms.
HV values obtained by RPCMA-ES, RVEA, NSGA-II, R2MOPSO and MOEA/D-STM on WFG1-WFG10 with 2-objective
HV values obtained by RPCMA-ES, RVEA, NSGA-II, R2MOPSO and MOEA/D-STM on WFG1-WFG10 with 2-objective
HV values obtained by RPCMA-ES, RVEA, NSGA-II, R2MOPSO and MOEA/D-STM on WFG1-WFG10 with 3-objective
IGD values obtained by RPCMA-ES, RVEA, NSGA-II, R2MOPSO and MOEA/D-STM on WFG1-WFG10 with 2-objective
IGD values obtained by RPCMA-ES, RVEA, NSGA-II, R2MOPSO and MOEA/D-STM on WFG1-WFG10 with 3-objective
Aim at evaluating the performance of the proposed algorithm, the other four compared algorithms are RVEA, NSGA-II, R2MOPSO and MOEA/D-STM.
Table 2 and Table 3 summarize the mean, standard deviation (std) and p-value (p) of the HV performance indicators for 2-objective and 3-objective problems. Similarly, Table 4 and Table 5 record the mean, std and p of the IGD performance indicators for 2-objective and 3-objective problems. In these tables, the best results of the mean or std for each test function are highlighted. The better/similar/worse (+/=/-) show that RPCMA-ES is better than, similar to, and worse than the performance of these compared algorithms.
As can be seen from the tables and figures, RPCMA-ES is significantly superior to R2MOPSO and MOEA/D-STM in the mean value of all test functions. It may be that the mechanism in the particle swarm optimization algorithm is not suitable for dealing with test functions like WFG with complex fronts. MOEA/D-STM is the worst performer among all the comparison algorithms. The lack of fairness of the stable matching strategy may lead to the reduction of convergence and diversity of the algorithm in dealing with complex problems.
Compared with NSGAII, Table 2 shows that the HV values of NSGAII are slightly better than that of RPCMA-ES in the two-objective problems of WFG1, WFG4, and WFG5. The reason is that NSGA-II is a typical algorithm for solving MOPs which the non-dominant solutions are selected according to the crowding distance. However, The selection pressure of NSGAII decreases with the increase of objective dimension. It can be seen from Tables 3 and 5 that the HV and IGD values of NSGAII are worse than that of RPCMA-ES. It can be clearly seen from Fig. 7, the uniformity and diversity of NSGAII are far inferior to that of RPCMA-ES. RPCMA-ES performed well mainly because it adopted the mechanism of reference point in the objective space, which can effectively screen out candidate solutions with good diversity and convergence according to the angle of non-dominant solution and reference point to reduce complexity.
Figs. 4-7 show the trend of performance indicators of five algorithms on WFG3 and WFG5-WFG9 test functions. It can be seen that, RVEA performs slightly better on the 3-objective WFG5 problem. Table 2 and Table 4 also show that the performance of RVEA is slightly better on the 3-objective problems of WFG1, WFG4, and WFG5. It may be due to WFG1, WFG4, and WFG5 are designed with different complexity criteria (e.g., WFG4 is a multimodal problem, WFG5 is deceptive, WFG1 is a problem with complex structure of the PF). The ability of RPCMA-ES to deal with such problems needs to be improved. However, whether it is HV value or IGD value, RPCMA-ES is the most effective algorithm in terms of the number of optimal outcome. Although both RPCMA-ES and RVEA adopted the strategy of reference point, the effect of RVEA on the optimization of 2-objective or 3-objective is not very good. The main reason for this result is that CMA-ES strategy combines the reliability of ES, the overall situation and the efficient guidance of adaptive covariance matrix. The adaptability is strong in CMA-ES to solve non-convex optimization problems and makes up for the shortcomings of more human factors in crossover and mutation operations in RVEA. The introduction of chaotic operator enables the population to jump out of local optimum.
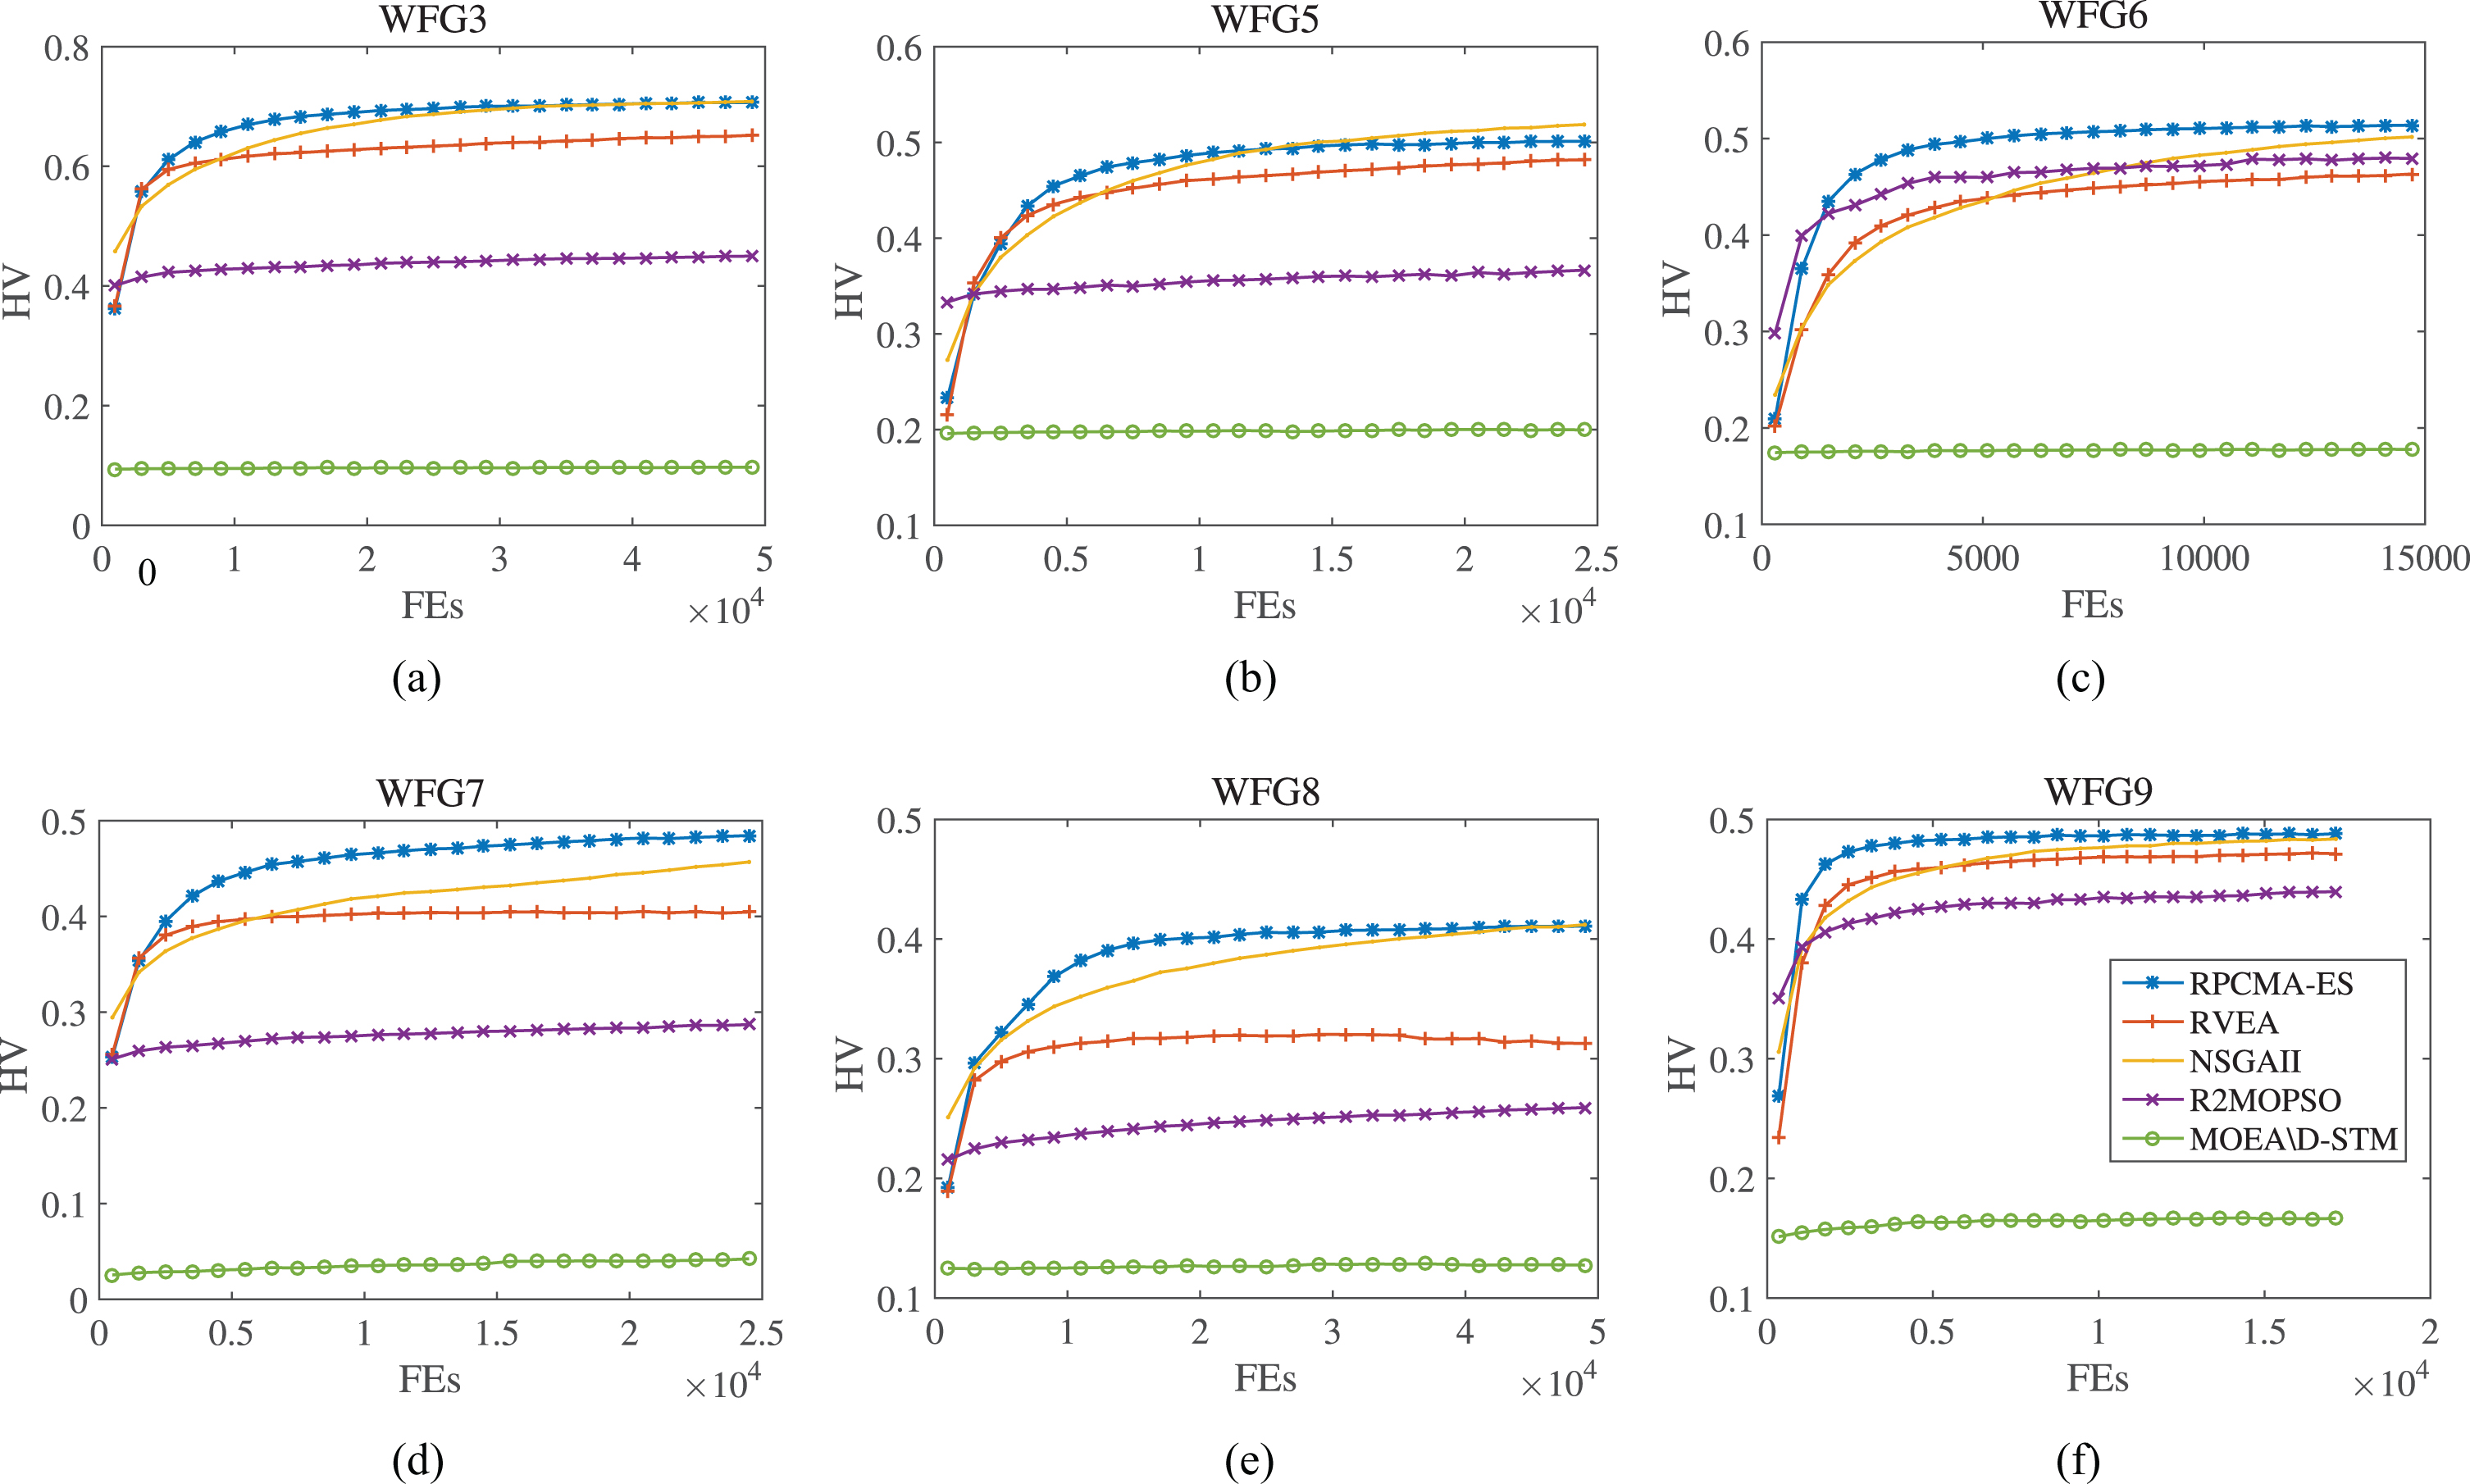
HV indicator value on WFG3,WFG5-WFG9 with 2-objective.

IGD indicator value on WFG3,WFG5-WFG9 with 2-objective.

HV indicator value on WFG3,WFG5-WFG9 with 3-objective.

IGD indicator value on WFG3,WFG5-WFG9 with 3-objective.
Fig. 8 and Fig. 9 describe candidate solutions achieved by each compared algorithm on WFG3 and WFG5-WFG9 in the run resulting the best IGD among 20 runs of 2-objective and 3-objective test functions, respectively. It may be known from Fig. 8 that MOEA/D-STM performs poorly on convergence and diversity in the 2-objective, especially on the WFG3 and WFG8 problems. Besides, in addition to the better convergence on WFG9, R2MOPSO has poor convergence on other test problems. At the same time, RVEA does not perform as well as RPCMA-ES on WFG3 and WFG6-WFG8. Although the convergence of RVEA is good on WFG5 and WFG9, the search for boundary solutions is inferior to that of RPCMA-ES. By comparison, it is found that the approximate solutions of RPCMA-ES algorithm can cover and converge to the real front in a wider range. An interesting observation is that, although the convergence of the approximate PF obtained by RPCMA-ES looks slightly worse, the distribution of these solutions is better than other comparison algorithms, and thus the results obtained by the RPCMA-ES are very encouraging.
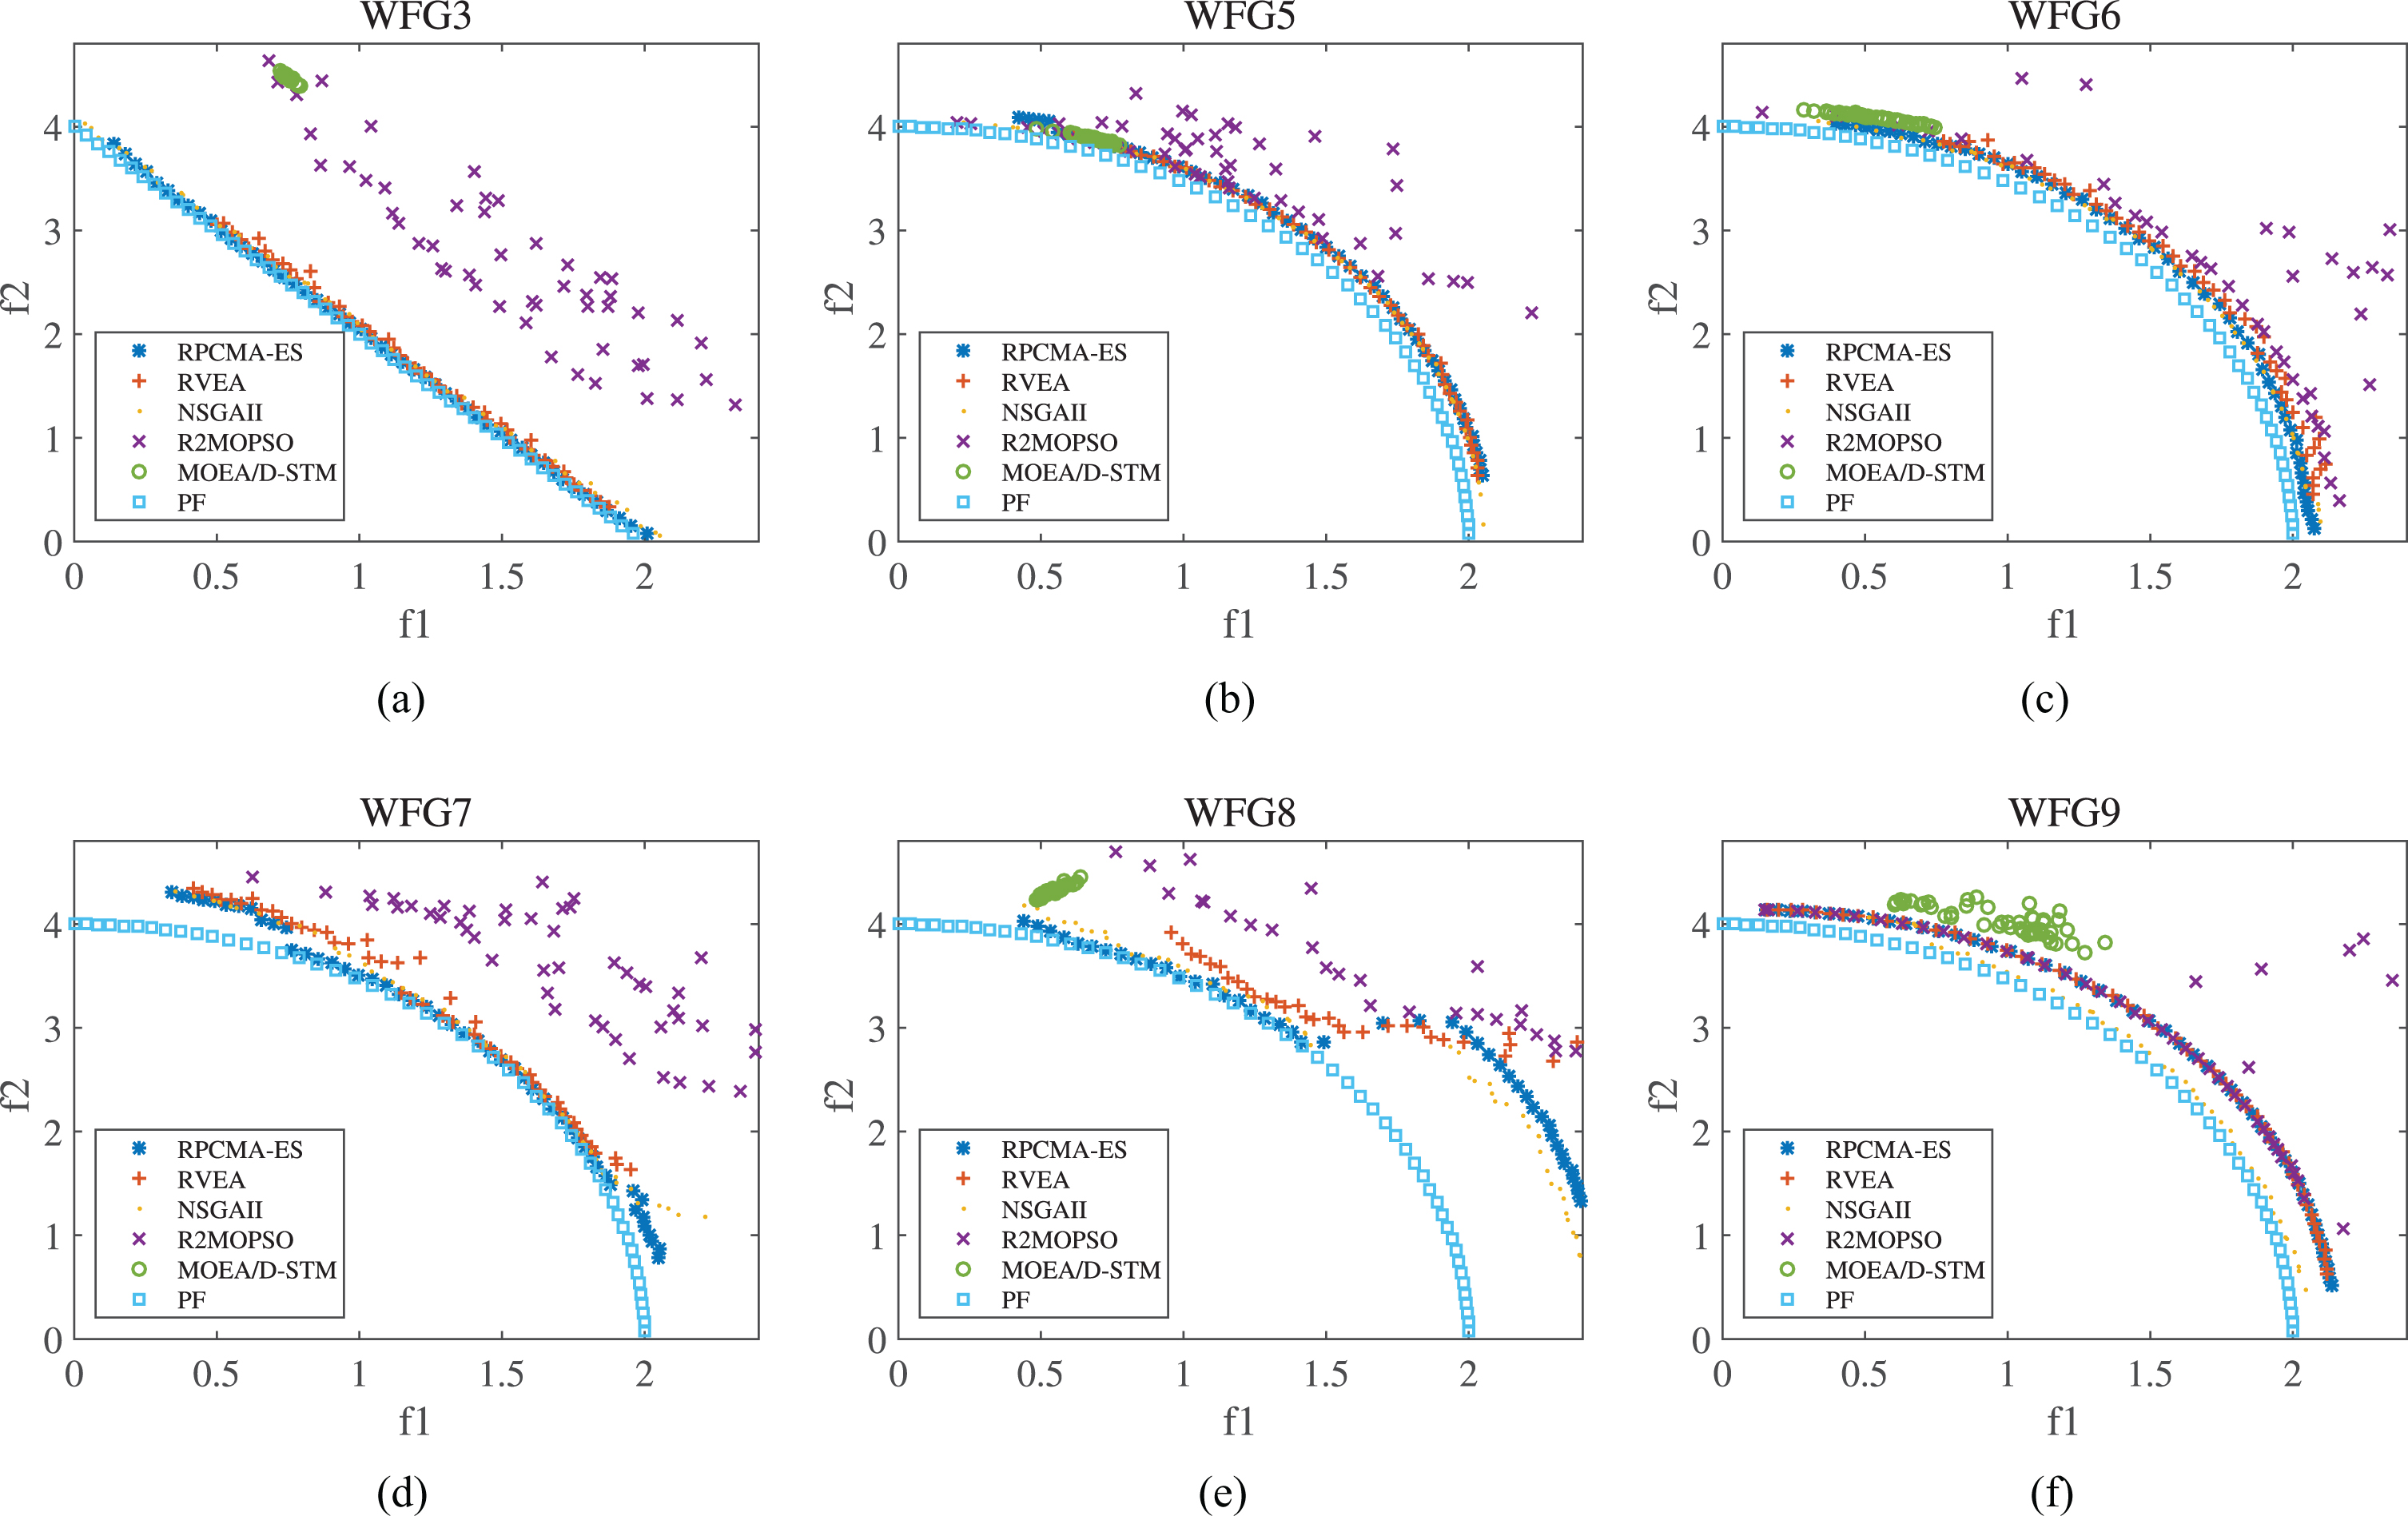
The solutions set of each compared algorithm on the PF of WFG3,WFG5-WFG9 with 2-objective.
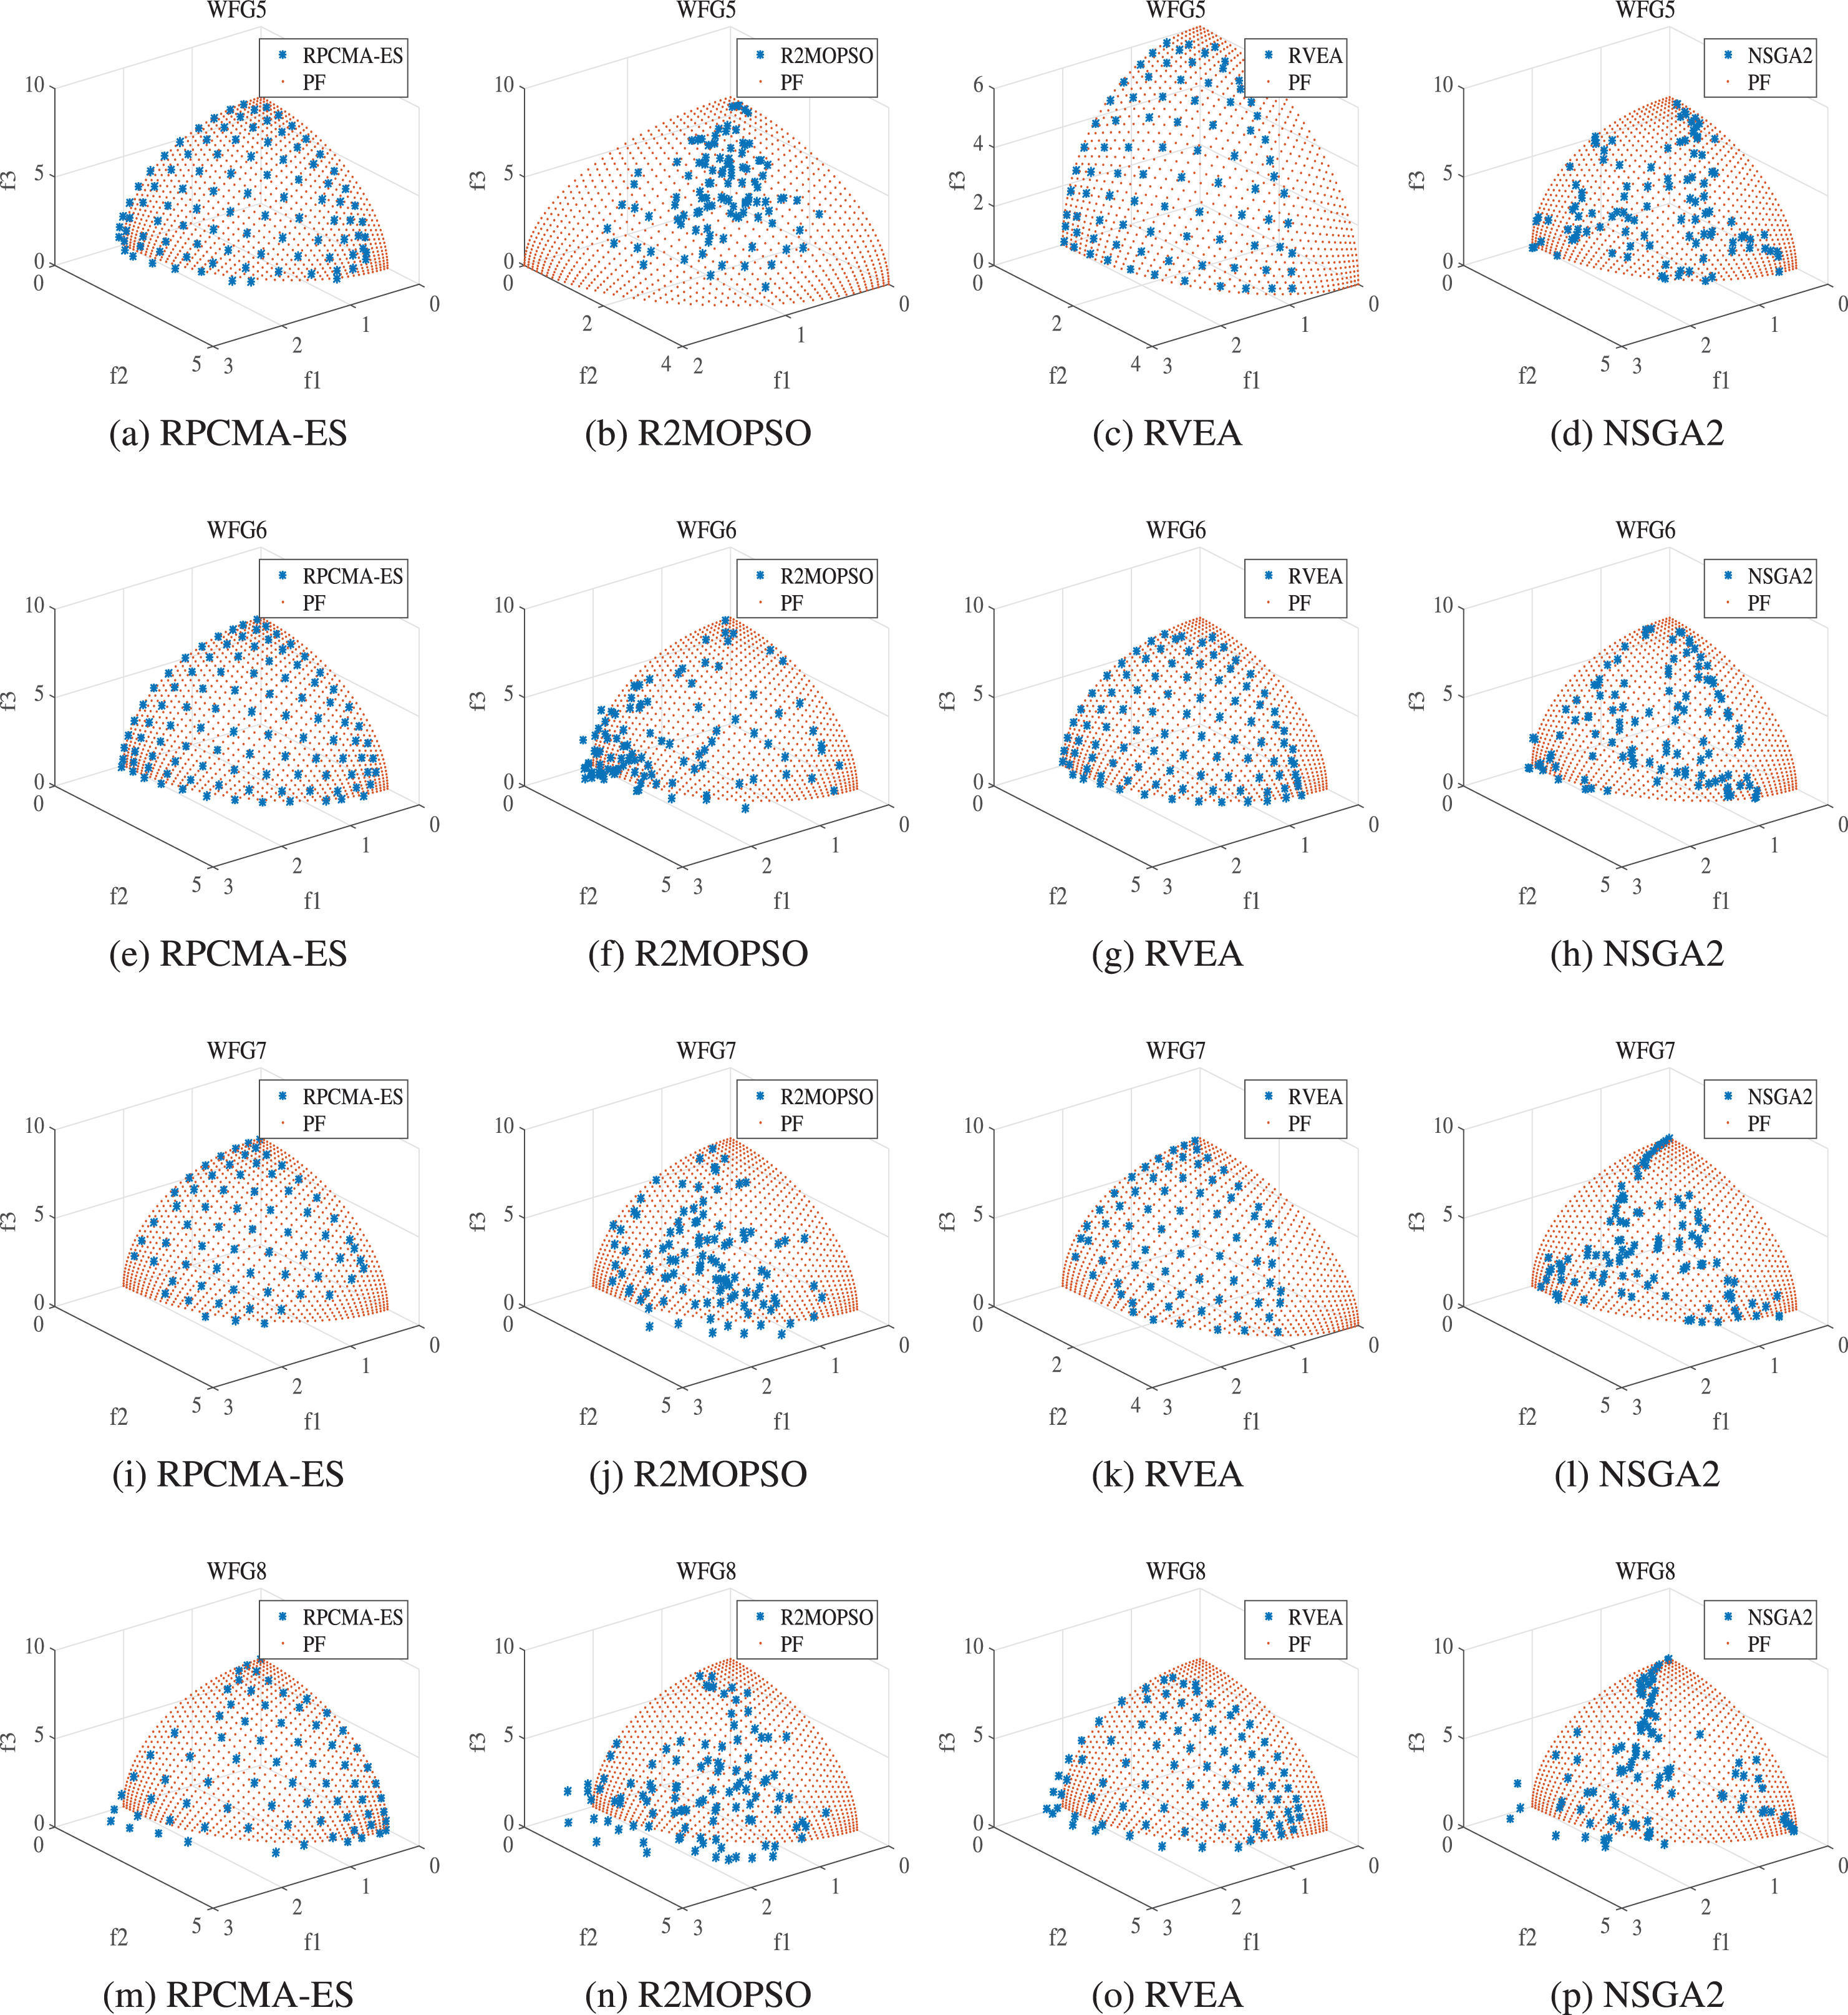
The solutions set of each compared algorithm on the PF of WFG5, WFG6, WFG7, WFG8 with 3-objective.
As can be seen from Fig. 9, performance of NSGAII in the 3-objective is worse than that in the 2-objective. The reason for this may be the reduction of selection pressure. Whether in terms of convergence or diversity, R2MOPSO and MOEA/D-STM obtain relatively poor performance compared with other algorithms by the results demonstrated. Similarly, the ability to search the boundary in the 3-objective test functions of RVEA is still worse than RPCMA-ES. The RPCMA-ES algorithm performs very well in solving many problems, especially in the continuous objective function. Not only the convergence speed is fast, but also the optimal result is better than other algorithms, because in the experiment, a chaotic mutation operator is introduced into the mutation operation of the better individual. The results show that RPCMA-ES present a clear advantage over the other algorithms on the majority of the test instances.
In this paper, an adaptive covariance strategy based on reference points is proposed to solve multi-objective optimization problems which named RPCMA-ES. This algorithm is mainly composed of the adaptive covariance strategy of the probability distribution model based on the potential candidate solutions to generate new individuals by random sampling. The difference with traditional CMA-ES is that chaos operator is used to updating the distribution mean value to search for good individuals with higher probability, which enhances the convergence speed and reliability of the population. In the solution selection mechanism, the entire search space is divided into independent sub-regions by reference points, and the AD value is calculated to effectively screen out diverse candidate solutions. In this paper, several test functions are simulated and compared with the current popular algorithms. In fact, although RPCMA-ES has achieved good results in 2-objective and 3-objective test functions, the algorithm has many challenges. Next, we will pay more attention to the high-dimensional multi-objective evolutionary algorithm with more objective functions.
Footnotes
Acknowledgement
This work was supported by the Natural Science Foundation of Hebei Province (No. F2016203249) and the Youth Fund of Hebei Natural Science Foundation (No. E2018203162).