
Abstract
The environmental adaptabilities of low-density polyethylene (LDPE) play an important role for high-speed trains’ reliability and comfort. The weathering of LDPE depends on environment factors, while the complexity of the weathering processes inhibits the evaluation of environmental weathering risks. To elucidate the correlation between weathering and environmental factors, and to predict the weathering risk of target areas of interest, three-year-long natural weathering tests were conducted at twelve natural exposure stations in China. Properties of weathered LDPE were compared and analysed using factor analysis. The fuzzy recognition method based on analytic hierarchy process (AHP) was established and used to predict the weathering risk based on environmental database. The results indicate that the factor scores can partitioned the atmospheric environments into five weathering risk grades. This article used the accumulated cumulative temperature of the daily maximum temperature for weathering risk evaluation, which is more scientific than the annual average temperature widely used and is useful for revealing the difference in LDPE weathering in Turpan and Korla. A comparative chart of LDPE’s weathering risk in China was established by this fuzzy recognition method for the first time, which caters to the continuous extension of high-speed railway to new regions.
Keywords
Introduction
China has about 35,000 kilometers of high-speed railway, and high-speed trains travel across the vast territory of the country, suffering from complex and diverse climates. The environmental adaptabilities of various materials on trains play an important role in reliability. Low-density polyethylene (LDPE) is widely used as cold-proof and sound insulation material in trains. Besides material susceptibility, and the weathering of LDPE largely depends on the environmental factors of its application [1–3].
Some studies predicted weathering behavior of polyethylene according to the kinetics [4–6], such as Arrhenius equation, established the prediction model of weathering, and these models merely adapted to indicate the relative importance of oxidative processes with temperature and underlying activation energies [7]. As a matter of fact, the variation of activation energy in a wide range of temperature changes leads to deviate from the predicted results, which is particularly significant in predicting outdoor weathering. Because in long-term natural behaviors where complicating physical processes may evolve over large temperature differences are not easily accommodated. Other studies have used climate classification or clustering of environmental factors to classify the weathering severity of environment, but these classifications are not very accurate and generally differ from weathering facts of materials. Nowadays, with the continuous extension of China’s high-speed railway to new regions, it is urgent to establish a mathematical method, which consistent with the weathering mechanism and can predict the adaptability of LDPE in new regions through environmental characteristics based on the existing environmental data and LDPE weathering data.
In this work, a three-year-long LDPE natural weathering test was conducted in twelve exposure stations, covering the climatic types in China. Based on tensile strength, elongation at break, bending strength, impact strength, yellow index, carbonyl index, and area percent of crack of weathered LDPE specimens, this article used factor analysis to establish a weathering grade classification method and the twelve stations were divided into five weathering risk grades according to the factor analysis scores. Meanwhile, analytic hierarchy process (AHP) was used to establish a fuzzy recognition method of LDPE weathering grade based on climate variables. The temperature variable referred to the concept of accumulated temperature in meteorology, which is the segmented accumulated temperature of daily maximum temperature, to replace the annual average temperature often used in the past. The main reason is that in a longer time period, such as month or year, the average temperature commonly used in previous literatures cannot reflect the evolution of the actual environmental temperature. If a shorter time period such as hourly temperature is used, this data is difficult to obtain from the public databases. The results showed that this fuzzy recognition method can effectively classify the potential application environments and accurately reveal the great difference of LDPE weathering between Turpan and Korla, which geographically adjacent in Xinjiang Uygur Autonomous Region, the same desert climate and the approximate annual average temperatures.
Experimental and method
Materials and sample preparation
Raw LDPE pellets were purchased from Yanshan petrochemical company (LD100AC, Mn = 22888, Mw = 180078, and melt index is 2.0 g/min). Square samples (80×55×3 mm), standard dumb-bell tensile samples (4×10 mm cross-section, 50 mm gauge length), and strip samples (80×10×4 mm) of additive-free LDPE were injection-moulded on a UA120A injection-moulding machine (Yizumi, China). The injecting temperature, mould temperature, injection pressure, packing pressure, and pressure-holding time were 190°C, 40°C, 700 Bar, 150 Bar, and 10 s, respectively.
Outdoor weathering experiments
According to ISO 877 standard, the exposure tests were conducted in twelve natural exposure stations, which generally reflect the climatic characteristics of different regions in China. These stations were Wuhan (WH, subtropical zone, humid urban climate), Korla (KL, warm temperate zone, salty desert climate), Mohe (MH, frigid zone, forest climate), Lhasa (LS, warm temperate zone, plateau rural climate), Wanning (WN, torrid zone, marine climate), Dunhuang (DH, warm temperate zone, dry and hot desert climate), Turpan (TLF, warm temperate zone, extreme dry and hot desert climate), Shenyang (SY, warm temperate zone, humid urban climate), Jiangjin (JJ, subtropical zone, suburban acid rain climate), Guangzhou (GZ, subtropical zone, humid urban climate), Xishuangbanna (BN, torrid zone, rainforest climate), and Qingdao (QD, temperate zone, marine climate) (Fig. 1).
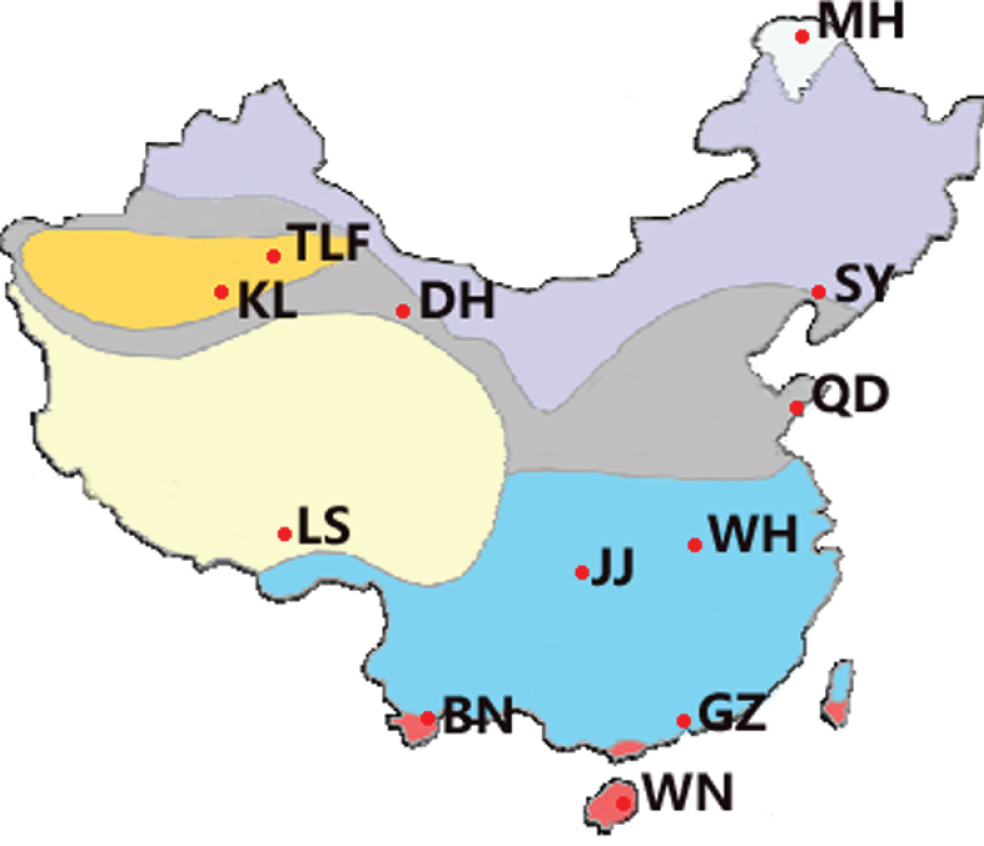
The positions of the stations and the major climatic zones.
Because high temperature and low temperature have different weights for the weathering of LDPE, this article adopted the accumulated temperature parameter (Tk, Equation (1)) of segmented daily maximum temperature to replace the annual average temperature parameter (T0) used in most documents to analyze the weathering process.
Where Tk is the accumulated temperature of the daily maximum temperature in different intervals and ti is the daily maximum temperature. T1, T2, T3, and T4 correspond to the ti range ≥ 40 °C, 35–39 °C, 30–34 °C, and 20–29 °C, respectively.
The mean annual values for main environmental factors such as annual average temperature (T0), accumulated temperature of daily maximum temperatures T1, T2, T3, T4, total solar irradiance (G), sunshine hours (S), relative humidity (RH), rainfall (R), rainy days (RD,≥0.1 mm), and air pressure (AP), of the exposure stations are shown in Table 1. The climate data were calculated based on the collected data from the China Meteorological Administration and the National Material Environmental Corrosion Platform.
The mean annual data for the main environmental factors of the exposure stations
Square specimens were used for attenuated total reflectance Fourier transform infrared spectroscopy (ATR-FTIR), yellow index (YI), and the area percent of crack measurements. ATR-FTIR spectra were recorded using a Bruker infrared spectrometer (VERTEX 70) for sixteen scans between 400 and 4000 cm–1, at a resolution of 4 cm- 1. The absorbance of the Gaussian-deconvoluted spectrum between approximately 1850–1650 cm- 1 and 1480–1450 cm- 1 attributed to the carbonyl and methylene groups, respectively. The carbonyl index (CI) was computed by the ratio of the peak area of the 1850–1650 cm- 1 to that of the 1480–1450 cm- 1 [8, 9]. The carbonyl group peaks are attributed to the ketone group (1713 cm–1), ester group (1735 cm–1), and lactone group (1785 cm–1), and the peak at 1466 cm- 1 (= C-H2 characteristic vibration bending band of LDPE) was chosen as the reference peak.
Surface crack patterns of the exposed specimens were observed by white light confocal 3D profilometer (Measure II, STIL, France). Scan area is 3×3 mm and randomly selected on square specimens. Motion type and scan step is constant speed and 6 nm respectively. The area percent of crack is adopted to quantitatively investigate the crack development.
Dumb-bell specimens were used for tensile tests according to the ISO 527.2 standard, using a universal material machine (CMT 6503, MTS Systems Corporation), at a stretching rate of 20 mm/min. Strip samples were used for impact tests according to the ISO 180, using an impact testing machine (XJU-5.5J, Xinhong testing machine factory, China). The test parameters were 5.5 J. Strip samples were used for bend tests according to the ISO 178 standards, using CMT 6503, at a crosshead speed of 2 mm/min with a span length of 64 mm.
Data analysis
This paper evaluated the weathering risk grade through factor analysis and AHP-Fuzzy methods. Factor scores were applied to determine the grade of weathering of LDPE and AHP was applied to determine the weight vector of the index layer and the factor layer under it, we compared the importance of each two factors. With the weight vector, the membership matrix in the fuzzy evaluation could be calculated reasonably. AHP-Fuzzy was used respectively in the index layer and the factor layer to get the final risk grade (Fig. 2). In general, the index layer included the fundamental environment factors while the secondary environment factors were defined as the factor layer and the final evaluation conclusion constituted the comment layer.
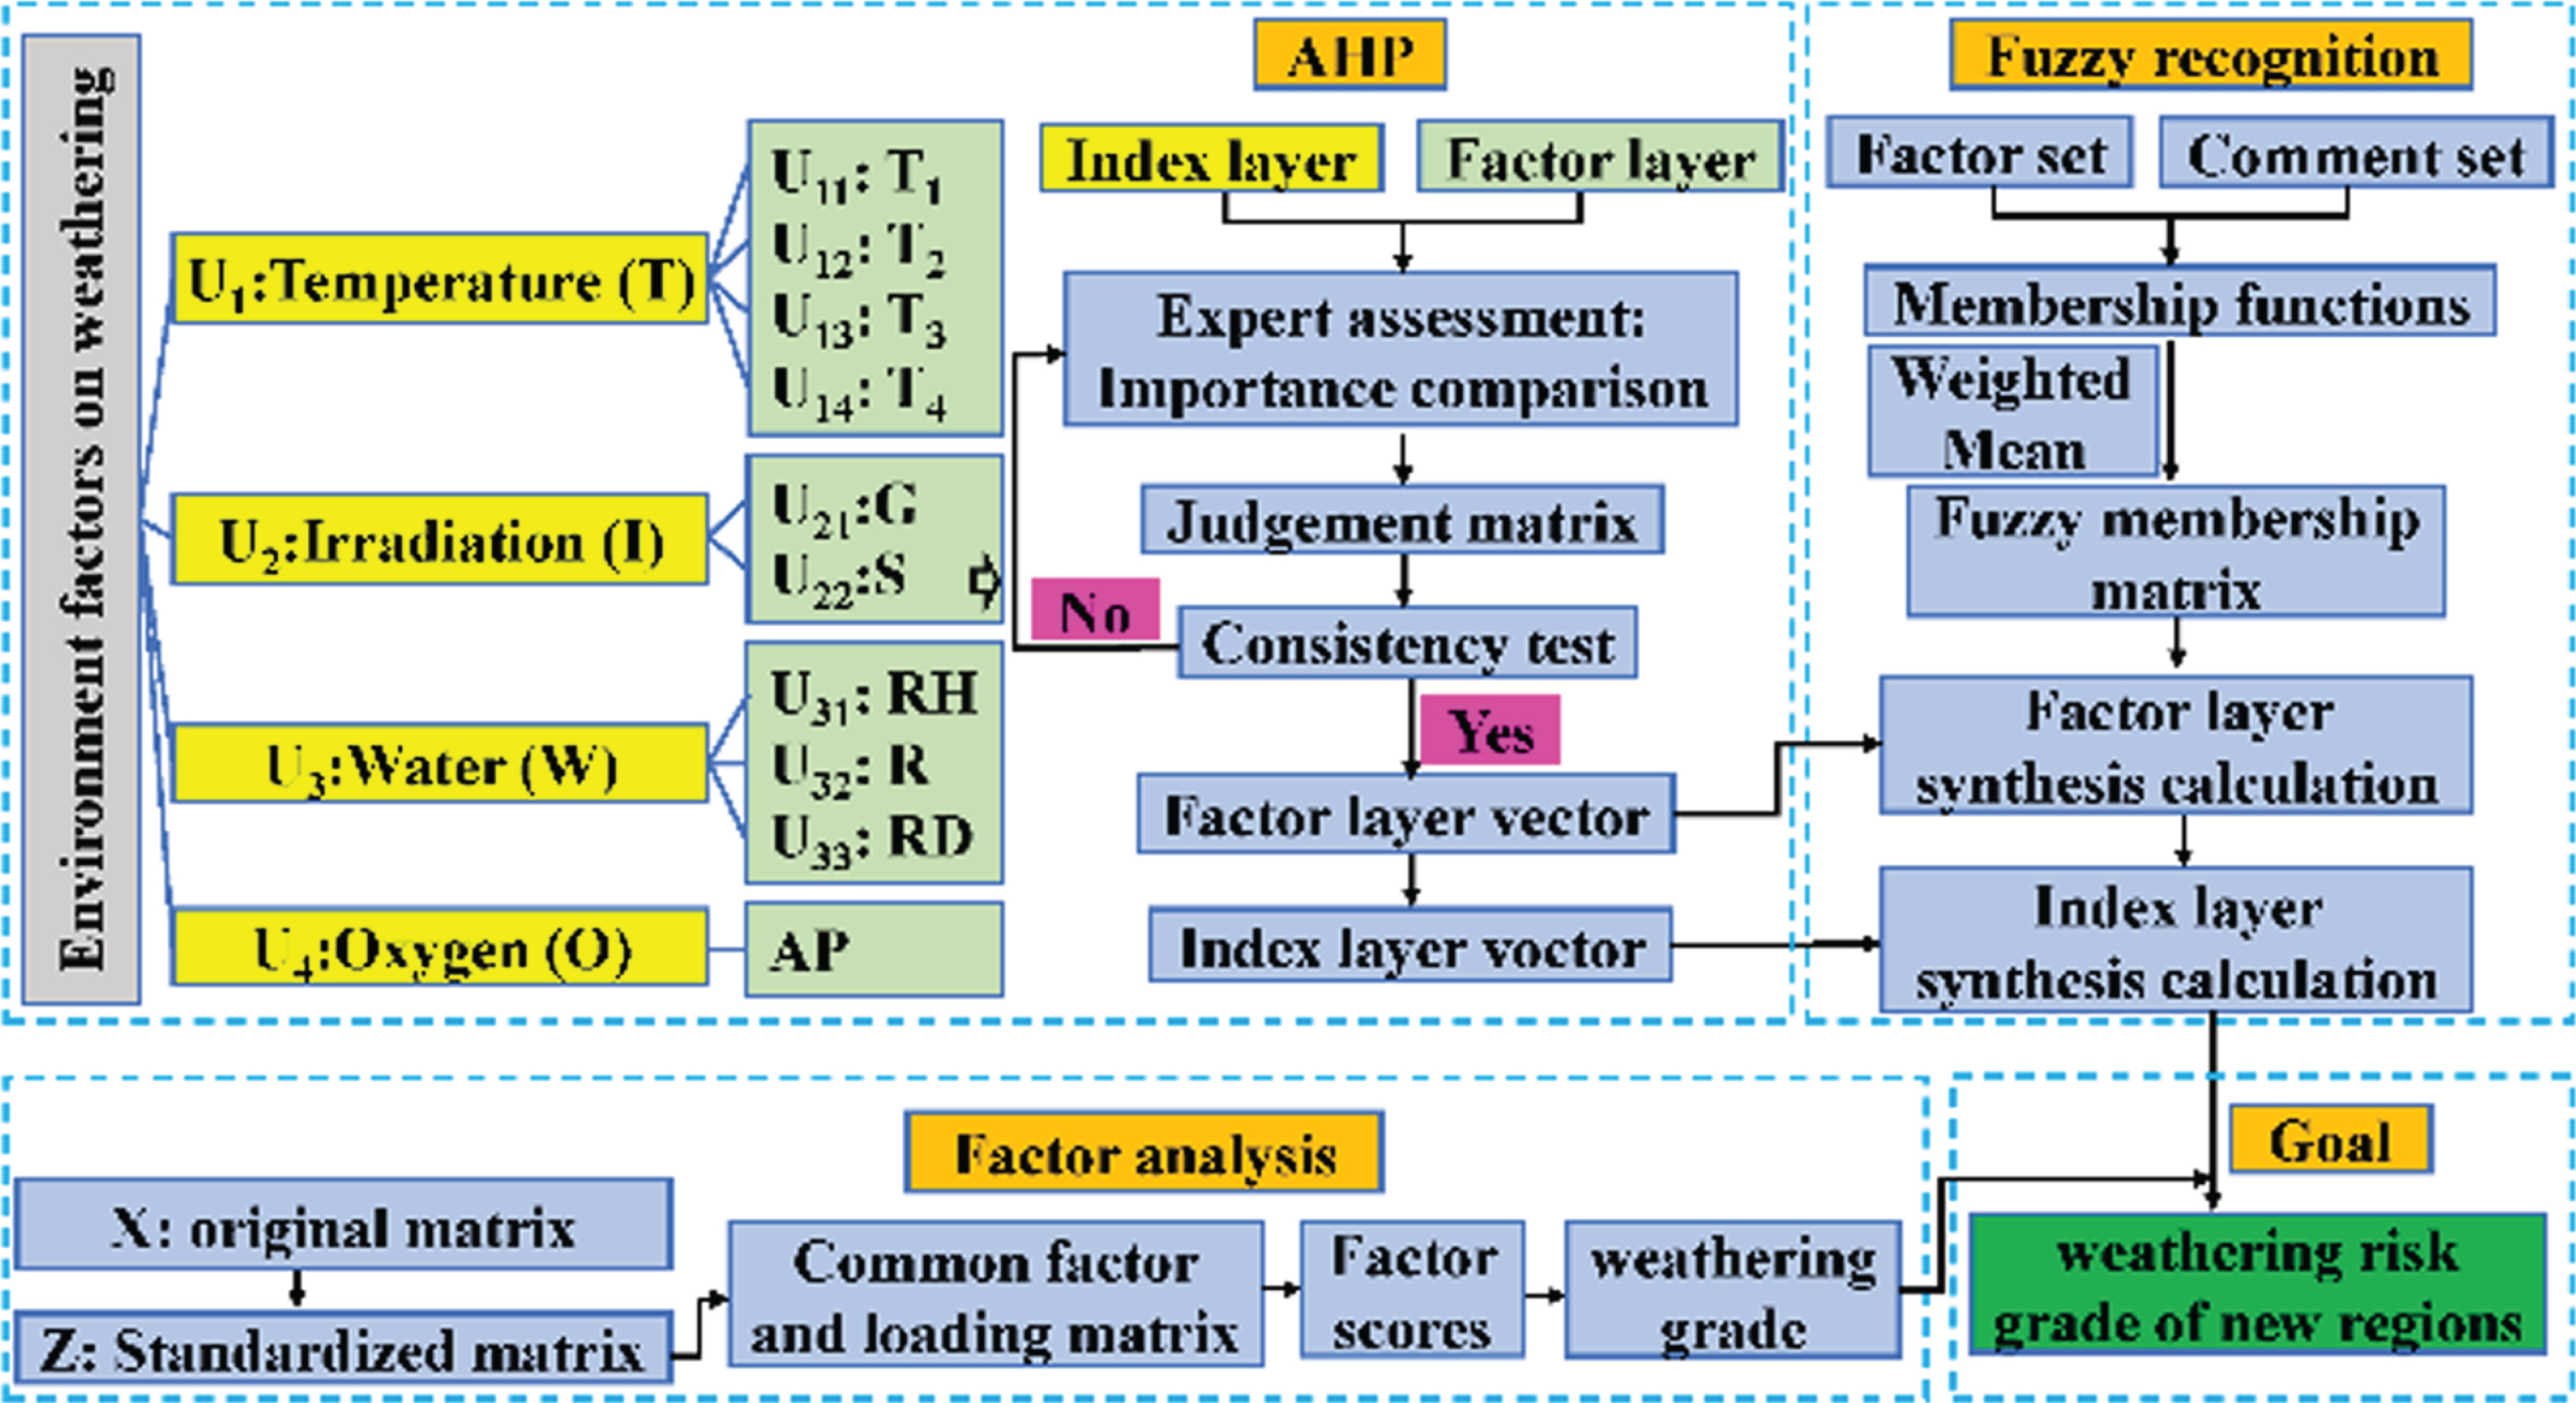
The flowchart of the appraisal AHP-Fuzzy recognition.
Factor analysis is considered to be a powerful mathematical tool for analysing, classifying, and reducing the dimensionality of numerical data sets in a multivariate problem. The main purpose of factor analysis is to describe some of the more basic, but less direct, latent variables that are hidden in a set of measured variables. The basic purpose of factor analysis is to use a few factors, which with less data reflecting the most of original information, to describe many indicators or factors linked [10–16]. In this article, the factor analysis method was used to process the performance parameters of LDPE samples, and evaluate the exposure sites’ environmental harshness according to the factor analysis comprehensive scores. The method was applied using the following steps.
(1) Establishment of the original array X=(x ij ), where i is the ordinal number of samples, and j is the ordinal number of performance parameters of LDPE in the present work.
(2) Considering the different attributes and units of array X, a normalized array Z is used to eliminate possible scale effects. The data scale is compressed at [–1,1], and Z=(z ij ).
(3) According the theory of factor analysis, the following equations can be obtained, Equation (2).
For a given seven indicators of a performance parameter, the n principal axes F1, F2 ... F n are the orthonormal axes onto which the retained variance is at a maximum in the projected space. The seven leading eigenvectors of the variable covariance matrix determine F1, F2 ... F n .
The relationships between the covariance matrix of LDPE weathering, the eigenvectors, and principal axes may be expressed as Equation (3).
(4) Factor scores (FS) for the stations. The contributions of every performance parameter to the major factors may be obtained by factor analysis. Thus, a factor score for each site could be calculated using Equation (4).
where FSm,n is the mth factor score of the nth site. FLk,n is the factor loading, which indicates the contribution of the kth air factor to the nth factor.
Fuzzy set theory was introduced to deal with uncertainty that is due to vagueness or imprecision. A fuzzy set is a pair (X, μ (x) ) where X is a set and μ (x) :X⟶[0,1]. μ (x) is referred to as the membership function, which assigns to each object x a grade of membership ranging from zero to one [17]. The fuzzy set (X, μ (x) ) is often denoted by {μ(x1)/x1, μ(x2)/x2, ⋯ , μ(x n )/x n }.
In the process of fuzzy comprehensive evaluation, obtaining a certain weight set is a crucial step and the AHP method used in this paper provides the advantage of systematically evaluating the weights of factors that impact weathering.
A judgement matrix is constructed in this work, through pairwise comparison of hierarchy factors that belong to the same higher hierarchy. The priorities of each factor were determined according to expert judgements, based on Tables 2 and 3. Pi and bij are the factors of comparison and the scales of comparison results, respectively.
The judgment matrix
The judgment matrix
The scale of the judgment matrix
The weight of every factor, i.e., the importance score for each of the factors in its own hierarchy, is the eigenvector of the maximum eigenvalue of the judgement matrix. The geometric mean method, which includes the following steps, has been used to calculate the approximate eigenvector of the judgement matrix.
(1) Calculate the product (Q
i
) of each row of matrix elements.
(2) Calculate the nth root (M
i
) of Qi.
(3) Normalize the matrix M=(M1,M2, ...,M
n
)T. M is the relative weight of every environmental factor related to LDPE degradation.
In the application of analytic hierarchy process, it is necessary to test the consistency ratio of every comparison judgement matrix. If the consistencies are within the tolerable range, this indicates that the logical determination of the comparison matrix is rational
Where λ max and R . I . (shown in Table 4) are the maximum eigenvalues of the judgement matrix and mean random consistency index, respectively [18, 19].
According to Equation (8), when the C.R. values are less than 0.1, the consistencies are rational [20, 21].
Factor analysis and environment severity classfication
In this section, factor analysis was carried out on the basis of the tensile strength, elongation at break, bending strength, impact strength, yellow index, surface carbonyl index, and the area percent of crack of LDPE samples exposed at the twelve stations. Aim to eliminate the influence of seasons, the data used in the factor analysis were weathering data with the exposure time of the whole year. The principal component method was used for factor extraction, and the stone map is shown in Fig. 3.
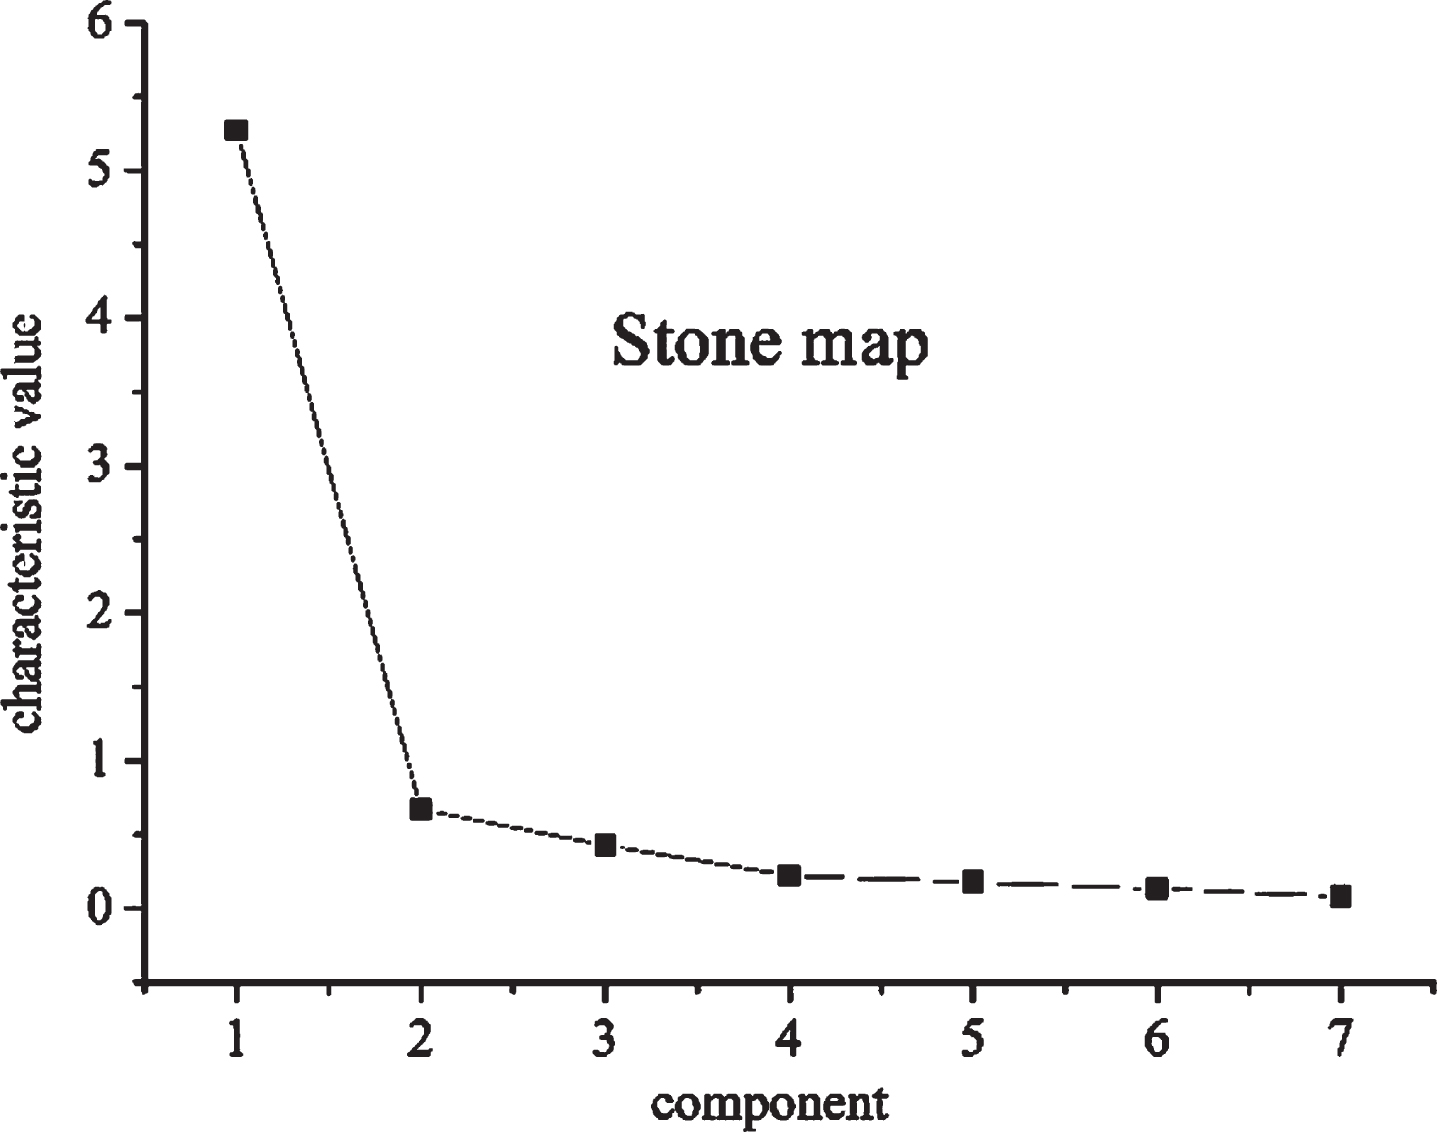
A stone map for factor analysis using the principal component method, for weathered LDPE samples.
The curve has an obvious inflection point. The variance contribution rate of the first factor is 75.348%, which is much higher than those of the second to the seventh factors. The first factor can therefore be used to calculate the factor scores (FS):
Factor scores and LDPE weathering grade at the exposure sites
The surface morphologies, and the changes of mechanical properties and surface optical properties of the exposed samples can be used to further corroborate the factor scores (Figs. 4, 5). The overall performance is that the higher the accumulated temperature is, the more serious the LDPE weathering risk is. The influence of environmental temperature is dominant.

Images and weathering grades of LDPE samples weathered at twelve stations for 36 months.

Changes of elongation at break and carbonyl index of LDPE weathered under twelve outdoor exposure conditions.
The fundamental environment factors and judgment matrix
The deterioration of LDPE materials depends on how and to what extend they interact with their surroundings. Considering the published literatures and the exposure test process [22–25], four environmental factors, such as temperature, oxygen content, irradiation and water, which have a significant impact on LDPE degradation, are listed in this paper. This paper creatively introduced the concept of the daily maximum temperature accumulated temperature in meteorology. The accumulated temperature in different temperature segments contributed differently to the degradation, with high temperature segment contributing more while low temperature segment contributing less.
DH, KL, TLF and LS in western China are all in high irradiation areas, while WN, GZ and BN in southern China are relatively weak in irradiation, but their annual average temperatures are higher due to low latitude. According to the factor scores (Table 5), the environmental factors (Table 1) and the crack distribution and propagation (Fig. 4), the effect of thermal oxidation on the weathering of LDPE is more significant than that of photo oxidation, which is consistent with other literatures [1, 27]. A higher temperature would increase the kinetic energy of molecular chains, exacerbate the diffusion of oxygen into amorphous phase [28], increase the probability of the reaction between molecular chains [29], facilitate the recrystallization of mobile short chain fragments produced from chain scission reaction [30]. Temperature has the most significant effect on LDPE degradation.
LS is located in the Tibet Plateau, the local solar irradiation is extremely strong. But LDPE weathering at LS is similar to that at the MH station, which exhibited the lowest degradation. In addition to the lower temperatures in the two stations, another main reason is that the atmospheric pressure of LS is only about 60% of that of the other stations. So, the atmospheric oxygen content of LS is lower. Comparing the environmental parameters of the LS station with those of the QD station, the accumulated temperature of the QD station is slightly higher than that of the LS station, the irradiation at the LS station is far higher than that at the QD station, and the oxygen concentration of the LS station is lower than that of the QD station. However, the degree of LDPE weathering at the LS station is milder than that at the QD station. In the case of approximate accumulated temperature distribution, ambient oxygen concentration is the decisive factor determining the severity of LDPE weathering [31]. Oxygen can accelerate the weathering of polymer materials by controlling the relative proportion of different kinds of termination process [32]. There is a general correlation curve between air oxygen content and atmospheric pressure. For the convenience of data acquisition, atmospheric pressure data of various test stations are adopted.
The third important environmental factor is irradiation, which often leads to the free radical chain reaction of LDPE. Energetic UV photons have sufficient energy to disrupt chemical bonds in many materials. The absorption of UV energy can cause the breaking and/or crosslinking of the polymer chains, leading to altered chemical and mechanical properties. After disruption of the initial chemical state, the polymers are likely to react with oxygen and/or water vapor causing additional changes [33]. But after the radical formation, the temperature has a stronger influence on acceleration of the degradation [27].
The last environmental factor is water. According to the results of correlation analysis between weathering and water and the existing cases [23], the effect of relative humidity, rainfall and rainfall time should be weak for weathering of LDPE.
Based on the existing literature and the above analysis, in this paper, the evaluation system of environmental grade of LDPE weathering is constructed on the basis of considering the comprehensiveness of indicators and the availability of data. A total of 10 indicators are used to evaluate the environmental grade of LDPE weathering from the four aspects of temperature, irradiation, water, and oxygen, as shown in Table 6.
Evaluation index system of environmental grade of LDPE weathering
Evaluation index system of environmental grade of LDPE weathering
Therefore, according to the principles of Tables 2 and 3, it is assumed that the judgement matrix of temperature (T), irradiation (I), water (W) and oxygen (O) is shown in Fig. 6(a).
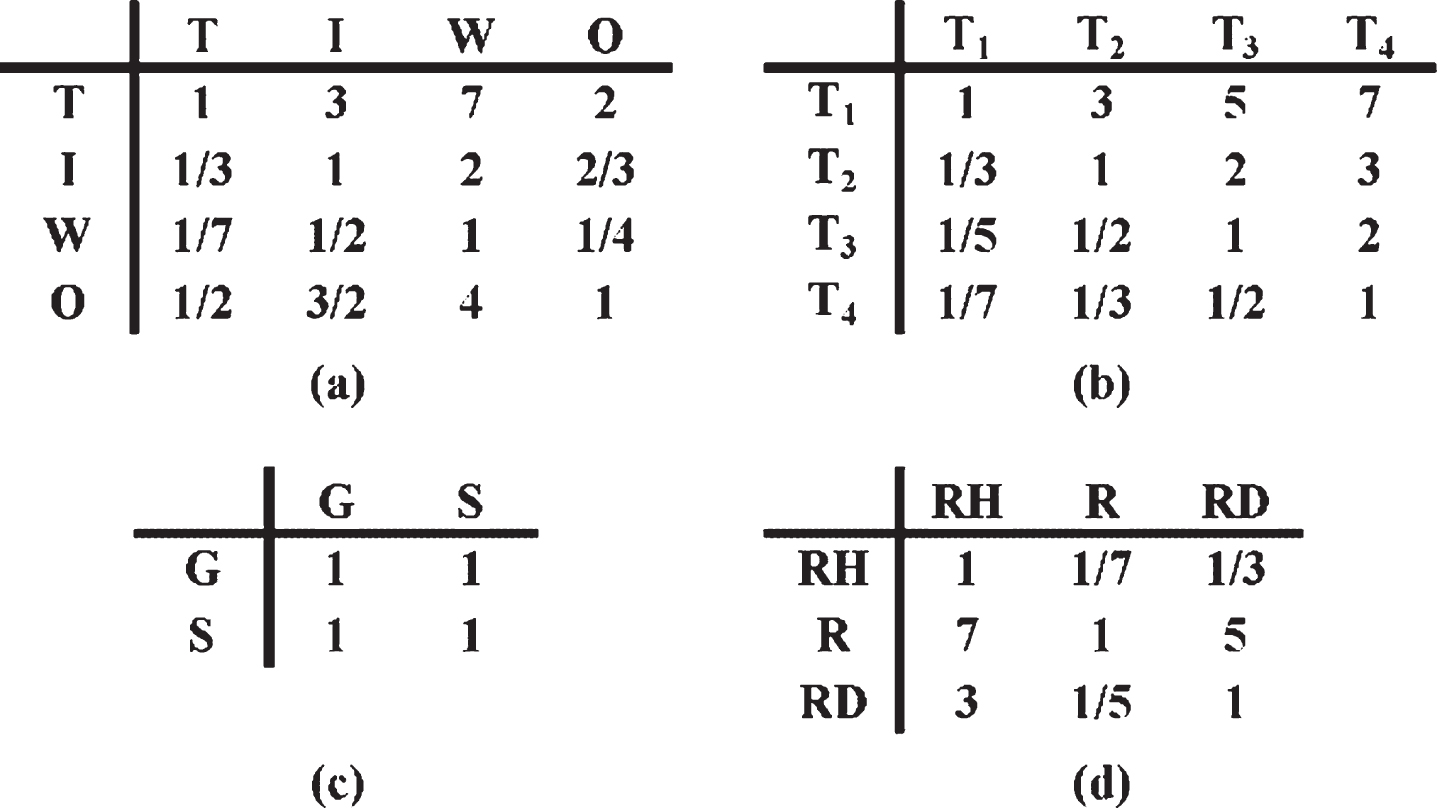
The corresponding judgment matrixes for environmental factors.
As shown in Table 5 and Fig. 4, TLF is one of the most significant LDPE degradation exposure stations, which has neither the highest average temperature, nor is it the most irradiated. However, according to an investigation of extreme climate in China, TLF was found to be the region with the highest extreme temperature, with a highest temperature in history of 49.6°C (historical data, measured at Turpan civil aviation airport on July 24, 1975), which is hidden when we only consider average temperatures. Therefore, the concept of accumulated temperature in meteorology is introduced in this paper. The highest temperatures recorded at different temperature ranges were accumulated (Tab. 1. T1, T2, T3, and T4). The severity of LDPE weathering shows a high correlation with the accumulated temperature of daily maximum temperatures above 20°C in the exposure area. For example, the LDPE samples at the TLF, BN, WN, and GZ sites showed the most significant weathering of all the samples. Accumulated temperature has the most significant effect on LDPE degradation [34]. The higher the temperature, the more significant the degradation of LDPE materials is, and the judgement matrix of T1, T2, T3 and T4 is shown in Fig. 6 (b).
The irradiation parameters should be the ultraviolet radiation intensity and the total sunshine time of each year. However, due to the difficulty in obtaining the countrywide ultraviolet radiation intensity data, the annual total radiation intensity data of each region are adopted. Total solar irradiance and sunshine hours are equally important, the judgement matrix of G and S is shown in Fig. 6 (c).
This paper adopted three secondary factors of relative humidity, rainfall and rainfall time in water parameters. Rainfall is easy to form continuous water film on the surface and infiltrate the sample. Repeated extraction in the soaking-drying cycle can accelerate the degradation process. The factors rainfall and rainfall time are more important than relative humidity on degradation of polymers. The judgement matrix of RH, RD and R is shown in Fig. 6 (d).
The above calculations provide details as to the weathering situation of LDPE in the twelve stations, which are distinct. However, there is a lack of accurate judgment in other areas in relation to LDPE weathering. In the past, climate classification was used to simply classify the environment, and climate zoning is an important tool for studying the adaptability of materials to an environment. However, in the case of polyolefin materials, it is not helpful to divide weathering environmental classifications by climate type. For example, China’s climatic environment can be divided into seven major climatic zones (Fig. 1). TLF and KL belong to the same type of climate, but their environmental effects on LDPE are very different. On the other hand, the climate types of MH and LS are completely different, but their environmental effects are similar. The boundaries between climatic parameters in adjacent regions are fuzzy, and so it is biased to regard climatic boundaries as strict dividing lines for the LDPE weathering grades.
Fuzzy recognition
All environments have the same kinds of environmental parameters, which provides an application basis for fuzzy recognition between different environments, like face recognition. Prior to fuzzy recognition check, nine exposure sites, the TLF, JJ, WN, BN, KL, GZ, SY, LS, and MH stations, were selected as the known environmental factors and weathering grades. The nine exposure sites included all the extreme cases of environmental parameters. At the same time, the DH, WH, and QD stations were used as exposure sites with known environmental factors and unknown weathering grades, where the LDPE degradation degree in these areas must still be evaluated. Therefore, the final result was used to predict the LDPE degradation in the same period of time as at the other exposure sites, at DH, WH, and QD.
(1) Create a certain factor set
The main factors that influence degradation are temperature (U1), irradiation (U2), water (U3), and oxygen (U4). These first-degree factors are further divided into second-degree classification factors.
The first-degree factor set U = [U1, U2, U3, U4] = [T, I, W, O]. For the second-degree classification factors, U1 = [T1, T2, T3, T4], U2 = [G, S], U3 = [RH, R, RD], and U4 = [AP].
(2) Create certain remark set
The remark set V = [TLF, JJ, WN, BN, KL, GZ, SY, LS, MH].
(3) Create certain weight set
The relative weight of each environment factor was calculated as Fig. 6, Equations (5), (6), and (7), as shown in Table 7.
Evaluation index weight value
Evaluation index weight value
(4) Create the certain fuzzy relation matrix R.
The fuzzy relation matrix R is based on a single-factor fuzzy evaluation model. For a new service environment of LDPE, first establish each factor’s membership function to the remark set. To better understand this process, consider the total solar irradiation (G) of the DH station (Table 1), for which the membership function has been built, as shown in Fig. 7. The Gmin and Gmax refer to the extremes of total solar irradiation in the measured values and both the memberships are zero, with a corresponding membership for the DH exposure site of 8436, and the total solar irradiation of DH is 1. The closer the G of a station in remark set V is to 8436, the closer its membership is to 1, which means that the Gs of DH and the station are more similar. On the contrary, the closer G is to Gmin or Gmax, the closer the membership is to 0, and the lower the similarity between DH and the station.
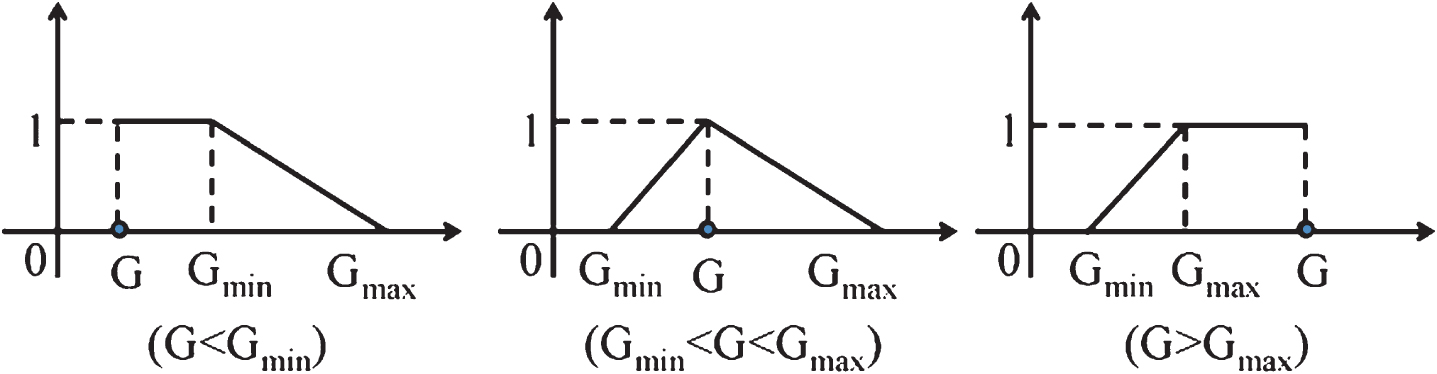
Total solar irradiation membership functions between DH and the remark set.
From the membership functions that were built for total solar irradiation, Gmin =2733 <GDH <9448 = Gmax, and so μ(x) is:
The calculation of the total solar irradiation membership of DH to the remark set as shown in Table 8.
The total solar irradiation membership of DH to the remark set
According to the same methodology, the normalized membership of DH to the remark set have been calculated for other environmental factors, see Table 9.
Normalized membership of DH to the remark set for all factors
(5) Multi-index synthetical evaluation
The major process sequence of multi-index synthetical evaluation is from the lower to the higher levels of Table 6, and the evaluation of higher levels takes place after normalization of all the lower levels.
Consider the case of DH. The membership of temperature to the remark set is the fuzzy multiplication of the weights and normalized memberships of all its lower levels factors.
Similarly, the memberships of irradiation, water, and oxygen can be calculated by the same procedure, resulting in:
The normalized memberships of temperature, irradiation, water, and oxygen are then given by RU.
(6) Result of fuzzy synthetical evaluation
Repeating the above process, the result (R) of fuzzy synthetical evaluation of the highest level is the membership of DH to the remark set, i.e.:
The results may be presented in the Zadeh representation:
In this work, the maximum membership degree of DH to the remark set is 0.261, and this value corresponds to that of KL, which means that the LDPE weathering at the DH exposure site is the most similar to that at KL. By the same principle, WH and QD correspond to JJ and SY, respectively. These inferences are consistent with the corresponding FSs. If other parameters and weights remain unchanged, the simulation results for annual average temperature show that the sites closest to DH, WH, and QD are KL, TLF, and KL respectively, which is quite different result from that procured using factor analysis.
Higher temperature has a dominant effect on the weathering rate of PE [1, 26]. According to Fig. 8, the meteorological data of 2013 in KL and TLF, the daily maximum temperature curve of KL is very similar to that of TLF. But in the summer, the daily maximum temperature exceeds 40°C on 43 days in TLF, compared to no such days in the case of KL. It is possible to infer that this temperature difference results in a significant difference LDPE weathering in the two regions.

The comparison of daily maximum temperatures for KL and TLF. The data were collected from the meteorological data of 2013 in KL and TLF.
Subsequently, on the basis of collecting environmental factors in thirty-four locations in China, the degradation risk grade map generated using the aforementioned fuzzy recognition method and inverse distance weighing (IDW) is shown in Fig. 9 [35, 36].

The degradation risk grade map for LDPE in mainland China.
In this study, the long-term outdoor weathering of low-density polyethylene (LDPE) was investigated over a three-year period in twelve natural exposure stations in China, which belong to seven different climate types. Mathematical methods involving factor analysis and fuzzy recognition were employed, and the following conclusions may be drawn.
(1) In terms of establishing an accurate LDPE weathering model, employing the segmented accumulated temperature of daily maximum temperature is more effective than using the annual average accumulated temperature. The daily maximum temperature distribution effectively explained the different weathering results for LDPE after three-year exposure in Turpan and Korla, which is due to that the daily maximum temperature of Turpan is more extreme than that of Korla in summer. The stations both belong to the warm temperate desert climate, and are adjacent regions.
(2) The LDPE weathering model was established using a fuzzy recognition method based on an analytic hierarchy process (AHP). The model can determine the weathering risk of an environment using its known environmental parameters and prior database.
(3) On the basis of environment factors in thirty-four regions of China, a weathering grade map for LDPE in mainland China has been established through factor analysis and fuzzy mathematics recognition. These findings are critical to the environmental suitability assessment of LDPE, both in wide areas or under widely varying exposure conditions, and could be extended to other regions worldwide.
Footnotes
Acknowledgment
We are grateful for the financial support of the National Natural Science Foundation of China (No. 51133009). We thank Mingshu Yang team of the Institute of Chemistry of the Chinese Academy of Sciences for their assistance in samples preparation, Testing Center of Huazhong University of Science and Technology for their help in infrared testing, and Wuhan materials corrosion of atmospheric environment national observation and research station for the exposure test.