
Abstract
This study presents a fuzzy brain emotional learning classifier (FBELC), combined with a modified particle swarm optimization (PSO) algorithm, that allows a network to automatically determine the optimum values for a reward signal and a classification threshold. The designed FBELC model imitates the brain decision process including the emotion information. To verify the predictive performance, a novel fitness function based on the accuracy of the training and cross-validation datasets is used for a PSO algorithm. This PSO-FBELC model is used to diagnose breast tumors and heart diseases. A comparison of simulations using the proposed PSO-FBELC with other processes shows that the proposed model performs better in terms of recognition accuracy.
Keywords
Introduction
A brain emotional learning (BEL) model is a model of the emotional processing mechanism in the human cognitive system. It simulates emotional information that passes the amygdala-orbitofrontal cortex in the human brain. In 2000, a brain emotional learning calculation model was created by Moren [1]. It uses the mechanism for emotional response between the frontal cortex and the amygdala in the human brain. In several studies, the model has been used for control [2–4], classification [5–7], prediction [8–10] and filtering [11].
Some optimization algorithms have been used to enhance the performance of intelligent systems in different applications, the most common of which is the particle swarm optimization (PSO) algorithm. A PSO algorithm is a stochastic optimization algorithm that was proposed by Kennedy and Eberhart in 1995, which is inspired by the social behavior of animal groups such as flocks of birds [12]. It is easy to use, highly accurate and with rapid convergence [13–18]. Compared to other evolutionary computation algorithms, such as an artificial bee colony algorithm (ABC) [19–21] or a genetic algorithm (GA) [22–24], PSO has fewer adjustable parameters and is easier to implement.
Some studies have combined brain emotional learning and PSO algorithms. In 2011, Dorrah et al. used PSO to optimize the BEL model’s reward signal and replace the PID-controlled reward signal [25]. In 2018, Mei et al. used a PSO algorithm to optimize the weight for the BEL model for facial expression recognition [26]. Fakhrmoosavy et al. used a PSO algorithm to determine the best learning parameters for an artificial seismic record BEL model [27]. Le et al. used PSO to determine an optimal learning rate for an interval type-2 fuzzy brain emotion learning controller [28]. Most studies seek to enhance the performance of the BEL model using a PSO algorithm. An appropriate choice of optimization parameters, learning rates, or fitness function for a PSO-BEL algorithm is necessary for different applications. The field of classification by using the BEL model is a new area of study. A previous study by the authors created a fuzzy brain emotional learning classifier and defined the reinforcing signal, especially for classification problems [29]. A simulation demonstrated that it is difficult to define appropriate values for some parameters in the FBELC, such as the weights for the reinforcing signal and the classification threshold. These are usually determined by trial-and-error to achieve the satisfactory performance.
This study proposes a fuzzy brain emotional learning classifier, combined with an adaptive PSO algorithm (PSO-FBELC); and apply it for the medical diseases diagnosis. The specific contributions of this work are: (1) An effective FBELC with optimization laws for the reward signal and the classification threshold is developed using an adaptive PSO algorithm; (2) a novel fitness function is defined for the PSO algorithm, which assures the accuracy of the training set and the cross-validation (CV) set. (3) the proposed method is used to diagnose breast tumors and heart disease.
The remainder of this study is organized as follows: Section 2 describes the structure of the fuzzy brain emotion learning classifier that uses a modified particle swarm optimization algorithm. Section 3 details the simulation results and compares the performance of the proposed classifier with other systems. Conclusions are detailed in Section 4.
PSO-FBELC design
A block diagram for the PSO-FBELC system is shown in Fig. 1. This classifier model comprises two parts: the fuzzy brain emotional learning classifier and the particle swarm optimization algorithm. The PSO algorithm works iteratively to achieve the solution that gives optimum parameters of the FBEL model. Therefore, the fitness value for each particle is defined using the FBEL model and is delivered to the PSO algorithm to update the values of the parameters. These updated parameters are then returned to the FBEL model and used for the next learning process. The details of the algorithmic procedures are described in Section 2.3.

Block diagram of the PSO-FBELC.
As shown in Fig. 2, the fuzzy brain emotional learning classifier comprises an input space, a sensory cortex, an orbitofrontal cortex, an amygdala, a thalamus and an output space. When the stimulus signal enters the sensory cortex, the input signal corresponds to each node of the amygdala and the orbitofrontal cortex. All of the outputs from the orbitofrontal cortex and the amygdala are sent to a common output node, y0, which is then processed to obtain classification y.
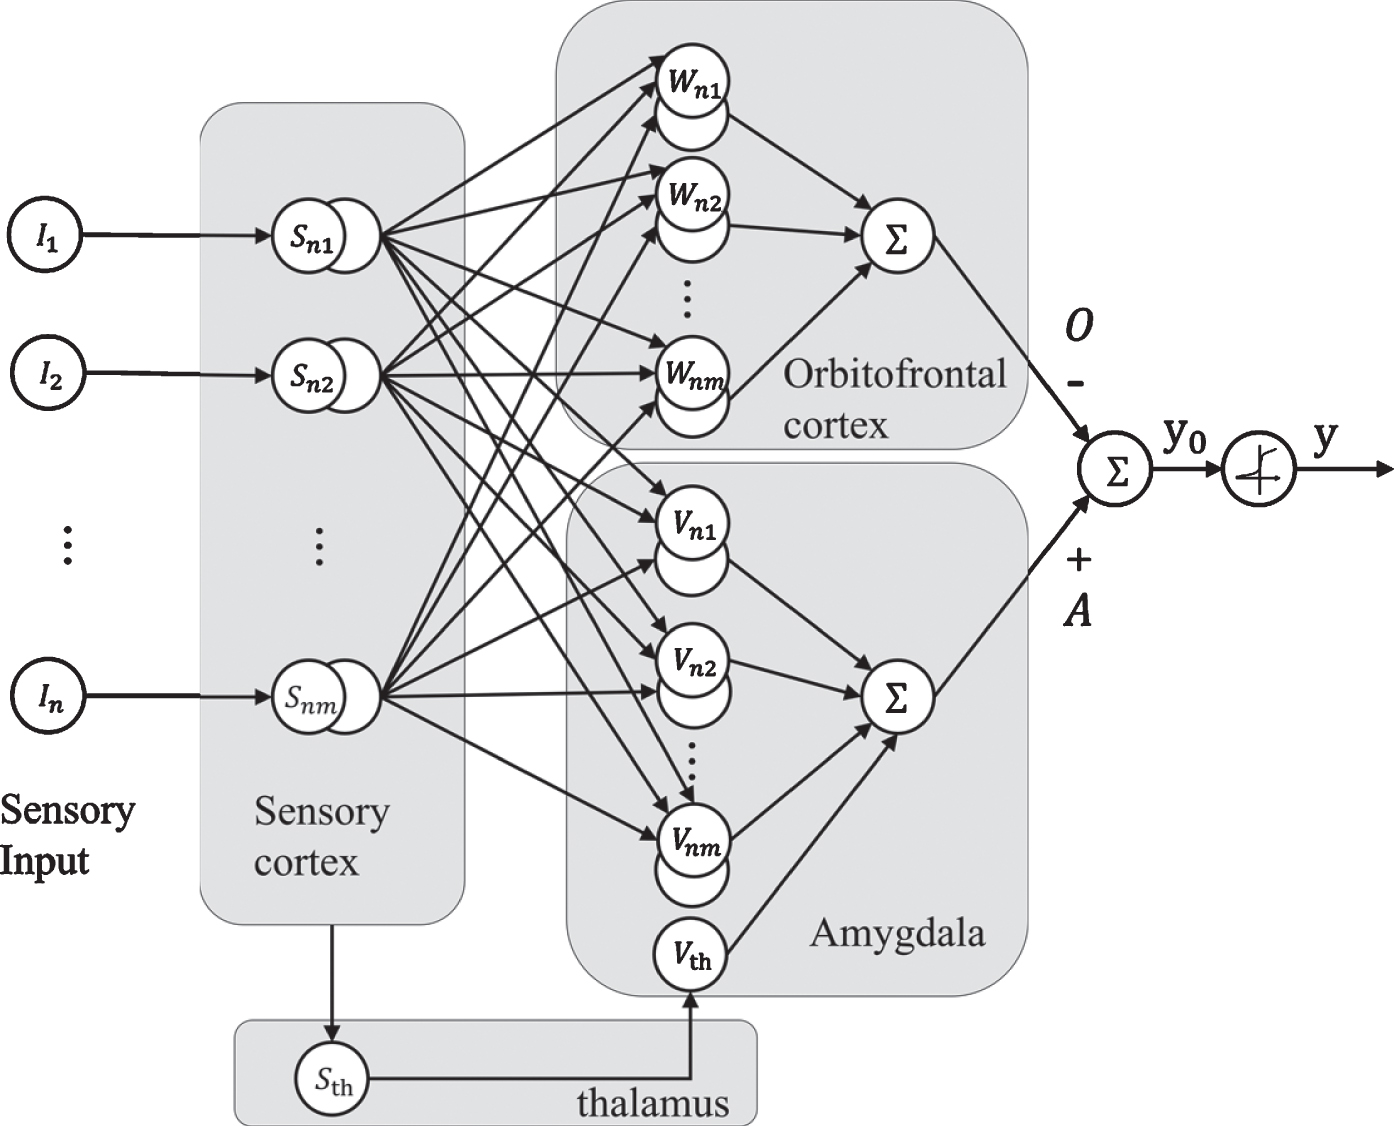
Structure of the fuzzy brain emotional learning classifier.
The fuzzy inference rules are defined as
where N represents the number of input dimension, while M represents the number of blocks; S nm represents the fuzzy set for the n-th input and the m-th block; A is the output of amygdala and O is the output of orbitofrontal cortex; V nm is the output weight of amygdala, and W nm is the output weight of orbitofrontal cortex.
The input signal is written as I = [I1, ⋯ , I
N
]
T
. In contrast to a normal BEL sensory model, this fuzzy brain emotional learning classifier only confirms a few activated neurons entering into the subsequent space. And each block performs a fuzzy set excitation of the sensory input. Gaussian function is used as the activation function to increase the generality of the model. This is expressed as:
The thalamic input is the maximum over all S
nm
and is written as:
The amygdala receives the signal from the corresponding nodes, so the output of amygdala is written as:
Finally, the output of FBELC is:
The reward signal REW is defined differently in different fields. For classification problems, the formula is determined based on knowledge of the problem. For this study, the reward signal is defined as a function of the error signal and the model output, as [29]:
Equation (7) shows that the output of the model y is adjusted by a sigmoid function to a value between 0 and 1. For a binary classification problem, if the identified output value is greater than a specific threshold, then the data sample is classified as positive; otherwise, it is classified as negative. A suitable threshold is required for a binary classification problem.
The weights for the amygdala and the orbitofrontal cortex are adjusted by feeding back the reward signal and the learning rules [30]:
In most cases, the sensory input for the FBELC is calculated in the sensory cortex and is directly sent to the orbital cortex and the amygdala. There is no learning process in the sensory cortex. In the proposed model, the mean and variance of the Gaussian function are updated. The gradient descent method is used to adjust the mean and the variance of the Gaussian function, so the output error e is reduced as quickly as possible.
Define
Then
The structure and the learning rules for the FBELC mean that all important parameters, except the weights of the reinforcing signal and the threshold, are updated in the learning phase, so there is a minimal error. The threshold is usually chosen as 0.5, but this may be not suitable for all situations. The PSO algorithm is used to search for the optimal weights and the threshold value for the FBELC.
Particle Swarm Optimization (PSO) algorithm mimics the foraging behavior of birds to search for the individuals that are closest to the food in the flock. Individuals are abstracted into particles that have no mass or volume: only speed and position. The speed of the particles is dynamically adjusted according to the optimal position of the particle history and the optimal position of the population history. Adding a random variable renders the simulation more real [31–33]. The following equations describe the working principle and updating laws for a PSO algorithm
Decreasing the value of q
j
will increase the ability of the algorithm to search locally. By assigning a suitable inertial weight, a modified PSO is used to avoid becoming trapped in a local optimum.
This section describes the procedure for the proposed PSO-FBELC. The optimization parameters and the fitness value for the objective function are the most important aspects of the FBELC and the PSO algorithm. The former affects the results of the FBELC and the latter affects the optimization effect of the PSO. As shown in Section 2.1, in the FBELC model, only the weights of the reinforcing signal (c1 and c2) and the threshold are not assigned using learning laws. Typically, c1 is larger than c2 because the error in the model decreases during the learning process. In general, a cut-off threshold is predefined as 0.5, to produce two categories. However, this value may be not the most appropriate for different classification problems so this parameter will be optimized using a PSO algorithm to achieve better classification performance. The classification accuracy of the training set is used as the fitness function for PSO. This study uses part of the training set as a cross-validation set. The fitness value combines the accuracy of the training set and the cross-validation set and is written as:
Figure 3 shows the flow chart for the proposed PSO-FBELC. The system comprises three phases. In the first phase, the parameters of PSO algorithm are initialized by setting the initial position and speed of the particles, the inertial weights and other values. In this step, the initial values of c1, c2 and the threshold of the BEL model, which are the parameters to be optimized, are transmitted to the FBELC training stage. The outputs of the FBELC training stage are the accuracy of the training and CV datasets. The parameters of the FBEL model are firstly initialized and then adjusted using the learning laws. In the second phase, the fitness value of the particles is calculated. This value is a combination of the accuracy of the classification and CV. The extreme values for the individual and the group are then updated according to the fitness values. If the stop criterion is not fulfilled, these updated values are sent to the FBELC training process, which calculates the accuracy, and the process returns to the second phase. If the termination conditions are satisfied, in the third phase, the optimal parameters for the PSO-FBELC are determined and the final classification model is defined. The performance of the test is then calculated.
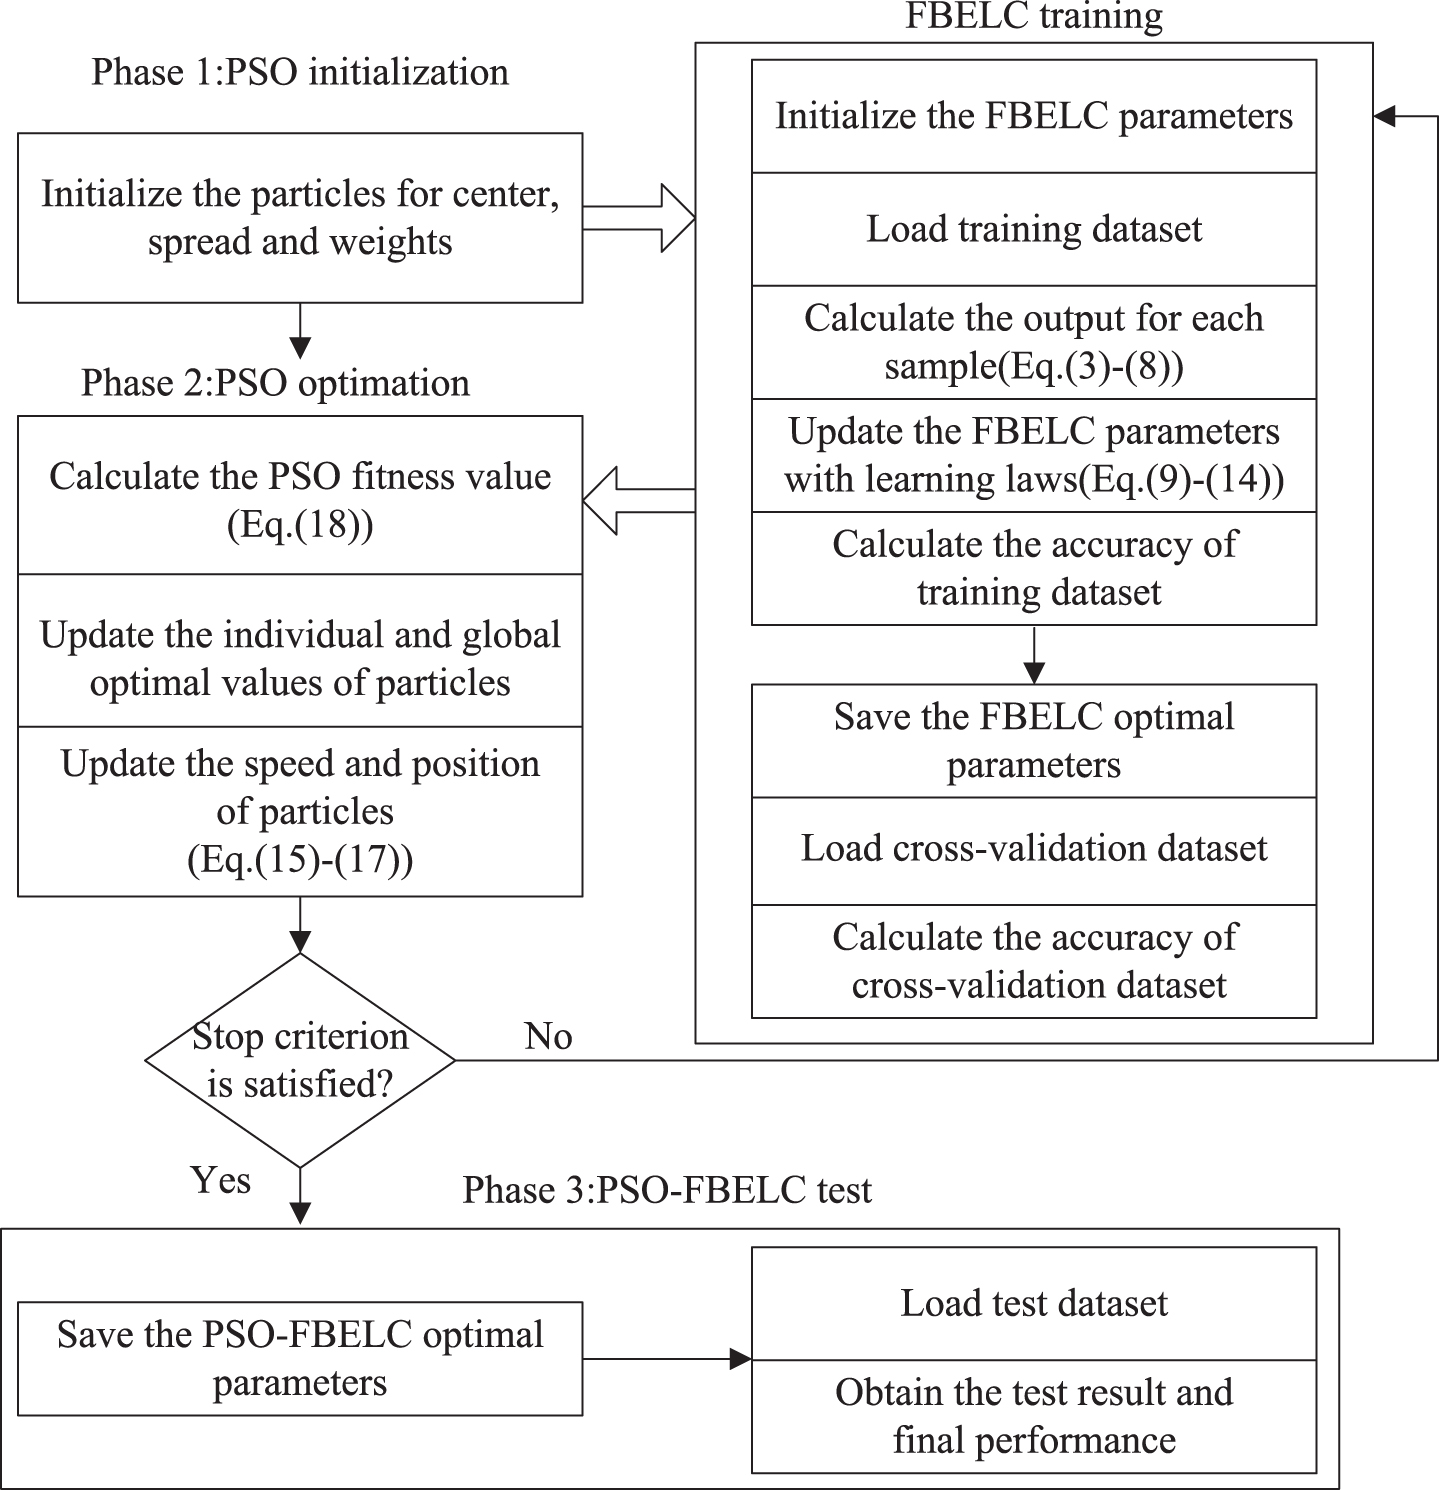
Flow chart for a PSO-FBELC.
Description of datasets
To verify the performance of the proposed model, two illustrative examples are demonstrated; they are Wisconsin Breast Cancer Data (WBC) dataset and the Statlog heart disease dataset [34]. The WBC dataset contains 683 samples, including 239 malignant cases and 444 benign cases. Each sample includes 9 different features. The Statlog heart disease dataset contains 270 samples and every sample includes 13 different features.
Experimental results
This study uses 70% of the dataset samples for training and 30% for testing. In the training sample, 30% of the samples are used again for cross-validation, so 49% of the samples are used as training data for iterative training and 21% are used for cross-validation. The parameters for the FBELC, including μ nm , σ nm V nm , W nm are randomly initialized. Table 1 shows the parameters for the PSO algorithm.
Parameters used for PSO
Parameters used for PSO
The classification result for the PSO-FBELC on WBC dataset and Statlog dataset are shown in Figs. 4 and 5, respectively. There are four parts in each figure: (a) a confusion matrix (b) a confusion matrix for training samples; (c) a confusion matrix for CV samples and (d) a confusion matrix for testing samples. For each part, the simulation performance is expressed in terms of 9 evaluation indexes: true positive (TP), false positive (FP), true negative (TN), false negative (FN), accuracy (ACC), sensitivity (SEN), specificity (SPE), positive predictive value (PPV) and negative predictive value (NPV). The accuracy, sensitivity, specificity, positive predictive value and negative predictive value are described in the following equations [35]:

Classification result for the PSO-FBELC on WBC dataset.

Classification result for the PSO-FBELC on Statlog dataset.
As shown in Fig. 4(d), TP is the number of true positives, so 128 breast cancer cases (positive) are correctly classified as positive. A false positive FP value of 0 indicates that no healthy individuals are incorrectly classified as having breast cancer. The FN value of 3 indicates that 3 breast cancer patients are incorrectly classified as healthy. The value for TN of 74 indicates that 74 healthy individuals are correctly classified as healthy. Figure 4(d) shows that the respective SEN, SPE, PPV, NPV and ACC values for the WBC test dataset are 97.71%, 100%, 100%, 96.10% and 98.54%. Figure 5(d) shows that the respective SEN, SPE, PPV, NPV and ACC values for the Statlog test dataset are 97.83%, 88.57%, 91.84%, 96.88% and 93.83%.
In order to illustrate the effectiveness of proposed algorithm, it is compared with different BEL models. Tables 2 and 3 show the parameters for the FBELC for three algorithms on two different datasets. The first algorithm for a FBELC is a traditional fuzzy brain emotional learning classifier without PSO. The values for threshold, c1 and c2 are set using experience and are not updated in the learning phase. The other two algorithms, PSO-FBELC (without CV) and PSO-FBELC (with CV), are both fuzzy brain emotional learning classifiers that use an adaptive PSO algorithm. The former separates the dataset into training and test parts and the fitness value is only related to the training accuracy and the latter is the more complete algorithm, for which the fitness value is the product of the accuracy of the training and CV datasets. Tables 2 and 3 both show that due to using PSO for optimization, appropriate values for the three parameters, threshold, c1 and c2, are determined and the training epochs are decreased. Besides, the optimal values of threshold, c1 and c2 for the two datasets are completely different. This also explains the difficulty of the selection of the parameters and it is necessary to introduce PSO algorithm to optimize the parameters.
Comparison of the parameters for different BEL models on WBC dataset
Comparison of the parameters for different BEL models on WBC dataset
Comparison of the parameters for different BEL models on Statlog dataset
“*” refers to the parameter value after PSO optimization.
The initial values for the FBELC model are chosen randomly. For comparison, the simulations are repeated for 20 runs for each algorithm. Besides, for a binary classification problem, accuracy and other statistical performance measures such as precision and recall are used. The precision and recall are represented as [36]:
The F-measure is defined as the weighted harmonic mean of precision (P) and recall (R) and is a single performance measure that is calculated as [37, 38]:
Table 4 shows the accuracy and the F-measure values and compares the results for the three classifiers for 20 runs on WBC dataset. These indices determine how well the classifier behaves for the given feature subset. The maximum accuracy of three algorithms is 97.56%, 98.05% and 98.54 and the average values are 96.51%, 97.10% and 97.83%. The maximum value for the F-measure for the three algorithms is 98.10%, 98.46% and 98.84 and the average values are 97.29%, 97.73% and 98.29%. Likewise, the performance comparisons for the three classifiers on Statlog dataset is shown in Table 5. The results show that the PSO-FBELC (with CV) is more accurate than the other methods on average and the proposed method has a better value for the F-measure than the other methods. Therefore, in general, the proposed method performs better than other FBELC models. This demonstrates that using a PSO algorithm to train the FBELC model and using the accuracy of training and CV datasets to construct the fitness function can enhance the performance of the fuzzy brain emotional learning classifier.
Performance comparisons on WBC dataset
Performance comparisons on Statlog dataset
This study constructs a PSO-FBELC algorithm to diagnose breast tumor and heart disease. The major feature of this study is the use of modified PSO to optimize the weights of the reward signal and classification threshold for a fuzzy brain emotional learning classifier. PSO is used to automatically search for appropriate values for these parameters. The fitness function for the PSO algorithm is the product of the accuracy of the training and cross-validation datasets. This determines the predictive performance of the classification model. Numerical simulations show that the proposed method offers a more accurate diagnosis of breast tumor and heart disease. The comparison results show that the proposed algorithm is accurate, precise and has better recall than a conventional FBELC. The results show that the proposed method is a viable diagnostic tool and this classifier is also applicable to the other classification problems.