
Abstract
When users choose a product, they consider the emotional experience triggered by the product form. In view of the fact that traditional kansei engineering can not effectively reflect the complex and changeable psychological factors of users, and it has not explored the complex relationship between customer satisfaction and perceptual demand characteristics. To address this problem, some uncertainty techniques including rough sets and fuzzy sets are applied to capture more accurate emotion knowledge. Therefore, this research proposes an integrated evaluation gird method (EGM), rough set theory (RST), continuous fuzzy kano model (CFKM), fuzzy weighted association rule mining method to extract the significant relationship between user needs and product morphological features. The EGM is applied to analyze the attractive factor of morphological characteristics of the product, and then the demand items with the highest satisfaction are analyzed through CFKM. The semantic difference method is combined to construct a decision table, and through attribute reduction and importance calculation to obtain the weight of the core product design items. In order to explore the non-linear relationship between design elements and kansei images, the fuzzy weighted association rule mining method was applied to obtain the set of frequent fuzzy weighted association rules based on evidence theory’s reliability indices of minimum support and confidence so as to realize user demand-driven product design. Taking the design of electric bicycle as an example, the experiment results show that the proposed method can help companies or designers develop products to generate good solutions for customer need.
Introduction
Today, in the background of the dynamic customer demand(demand pull) and rapid technological advancement(supply push), companies are encouraged to develop and launch products in extremely crowded markets [1], which make this competable environment in the product market has become more intense and dynamic, and then the product development companies can effectively use resources to develop a wide variety of products to maintain their competitiveness [2]. Meanwhile, when users face the variety product selection of consumer productions, they has become more concerned with the emotional needs of than ever before and they could hope that productions can reflect their own personality, preferences and cultural values [3]. Therefore, production development and manufacturing companies are increasingly focusing on developing products and exploring customer psychological needs in the way that increases customer satisfaction to provide decision support for innovative product design [4]. To this end, a Japanese scholar, Nagamachi, developed the Kansei Engineering(KE) which is a new product technology for consumers and it could transform consumers’ perceptions and imaginations for products into design elements [5, 6]. Kansei engineering exploration and development system can correlate the word “kansei” with product attributes and generate solutions and alternative concepts for products based on user’s visual stimulation analysis [6, 7], as shown in Fig. 1. Specifically, when Kansei Engineering is used in the design method, we will pay attention to user’s imagery or behavior when perceiving objects, and explore the effect of their personal preference or cultural basis for their psychological feelings [2].

The production design based on Kansei Engineering.
In pratice, the product innovation design plan is affected by many factors such as the diversity of evaluation criteria, the ambiguity of evaluation information, the uncertainty of index weight, etc., which is a complex decision-making process with multiple goals, multiple levels and multiple uncertainties. Hence, some multiple criteria decision making(MCDM) techniques such as analytic hierarchy process (AHP) [8], analytic network process (ANP) [9], quality function deployment (QFD) [10], technique for order preference by similarity to ideal solution [11] have been integrated widely with fuzzy set [12] to deal with uncertainties problems in production development. In particular, the fuzzy set theory can effectively deal with uncertain information. However, there are two limit factors in the implementation process of fuzzy set. Firstly, in fact, the fuzzy set theory has been widely used to simulate human cognitive processes, but the determination of relational functions is usually based on expert experiences and intuition factors [13], so that the calculation result is still subjective. Secondly, the boundary interval of the fuzzy number is rapidly expanded by the fuzzy arithmetic operation, which may affect the accuracy of priority for customer ultimately needs [14].To this end, a method named rough set [15] was first described by Polish mathematician Z Pawlak, this method can effectively deal with fuzzy data in the product development process. The rough set theory expresses ambiguity through set boundary regions instead of using membership functions [15], which is the unique advantage for dealing with ambiguity and uncertainty factors [16]. Rough set theory is used for data analysis without artificial assumptions, and it only uses the provided information to maintain the objectivity of the information. In fact, in the design of new products, it is difficult to obtain a large amount of design information, so the data size is usually not large, which makes rough set theory become a more suitable tool for dealing with inaccurate information in product development [17]. Furthermore, rough set can eliminate redundant information through attribute reduction, and compare the roughness of knowledge, and calculate the dependence and importance of knowledge attributes. To date, RST has been widely applied in data mining [18], decision analysis [19, 20] and KE [17, 21–24].
The nonlinear relationship between user emotional needs and satisfaction needs to further explore. The satisfaction can be defined as the attitude of the actual users to the product, because it not only affects the user’s loyalty, trust, purchase intention and other behavioral results, but also is a key factor in corporate profitability [25]. Some researchers have established various models to explore user satisfaction from different perspectives. The two-dimensional quality model [26, 27] was employed to effectively determine the true emotional satisfaction factors during product design and development. The Kano model is a theory developed in 1984 based on Herzberg’s motivational stimulation method, and is also called the attractive quality theory [28]. Through the Kano model questionnaire survey to understand the impact from products and services for customer’s demand, and then to improve user satisfaction. However, the traditional kano model ignores the uncertainty factors of the tester’s thinking in the process of classifying the needs of consumers. To overcome this problem, the continuity fuzzy kano model [29] can be further quantified to determine the priority items of satisfaction. Therefore, based on the CFKM, the user’s satisfaction with a certain image can be explored accurately, and the degree of satisfaction of the product’s image attribute items can be calculated objectively so as to clarify user demands.
In addition, data mining can be used to discover non-trivial, implicit, previously unknown, and potentially useful relationships from large kansei data sets [30]. Association rule is a data mining method [31], which can find hidden connections and potential correlations of data. Among them, the Apriori [32] algorithm has been used in KE to mine design rules [21, 30]. Through the preset thresholds of minimum support and confidence, frequent sets can be filtered and mined, which could provide managers with a systematic and effective method and enable managers to extract knowledge from customers to identify their preferences, and then prompt the company to develop appropriate products to gain competitive advantage. However, rules with high confidence levels may be boring, and rules with much lower confidence levels are also worth to consider. The key features of useful association rules are novelty, external saliency, unexpectedness and operability [33]. Furthermore, traditional association rule mining algorithms have certain assumptions, that is, the importance of each item in the database is the same and the item distribution is even, which undoubtedly may ignore the relative importance of different items in practical applications [34]. Hence, the high importance and low frequency rules are eliminated. In addition, when using traditional association rule algorithms to extract frequent itemsets, it is necessary to use the partitioning method to discretize quantitative attributes so as to result in the stiff boundary problem and the loss of key and effective information for people’s fuzzy cognitive model.
Therefore, the main purpose of this study is to investigate consumer preferences and develop product styles that meet consumer needs so as to use the qualitatively and quantitatively way to find out the key perceptual demand of modeling factors of users based on rough set theory and fuzzy set theory. In the first stage, the EGM interview method was used to explore products’ attractive modeling characteristics(lower level) and kansei imagery factors(upper level). In order to explore the emotional satisfaction quality attributes of user’s need, we introduce the continuous fuzzy kano model to further quantitatively analyze the user’s needs and preferences so as to dig out the users’ key demands. In the second stage, the semantic difference method(SD) of KE is utilized to test the user’s preference characteristics for perceptual images quantitatively, and then a knowledge expression system for decision table is constructed from the perspective of the user’s preference and psychological demand. In the third stage, the rough set theory is effectively applied to extract the core item attributes of the product so that the key design elements of the product can be quickly and accurately obtained, and the weight value of the modeling attribute can be calculated. In the fourth stage, a fuzzy membership function is constructed to transform the data investigated by SD method from user preference, and the fuzzy weight association rule mining algorithm(FWARM) is adopted to analyze the specific characteristic factors of product modeling that satisfy the user’s kansei image by integrating RST with CFKM, and the specific design principles is obtained based on the experimental results. Accordingly, this proposed method could not only consider the influence of different item weights based on fuzzy association rules, but also more accurately obtain the significant influence of the overall composition design of product elements for user needs. Consequently, this proposed method could enable designers to design products with higher level of customer satisfaction, help designers to capture user needs accurately, so that the design quality and efficiency is improved and enhanced.
The remainder of this paper is organized in the following way. Section 2 introduces literature review as to RST, CFKM and Data mining. Section 3 describes and analyzes the application framework of this proposed method. A case study is provided in Section 4 to show the detailed procedure of this proposed method. The results and discussion are illustrated in Section 5. Section 6 concludes the significance of this paper.
Rough set
The theory of rough set [15] was first described by Polish mathematician Z Pawlak, which was used to deal with the problem of inaccuracy, ambiguity and uncertainty. Rough set theory expresses fuzziness through the boundary region of the set [15], which is different from fuzzy set and probability theory. At the same time, the axiom system in rough set has clear objectivity, and rough set theory does not require any external information or additional subjective adjustments for data analysis [35]. It only uses the information provided in the given data and maintains the objectivity of the information. Therefore, it becomes a more suitable tool for dealing with inaccurate information in product development. Pawlak [36] summarized the basic concepts of rough set theory which including indiscernibility relation, approximations, rough membership, dependency of attributes, and reduction of attributes, and then he proposed decision tables and decision algorithms, and discussed its application prospects in the decision support process. In KE, Zhai et al. [16] scholars adopted rough set theory to analyze consumers’ imprecise emotional responses, acquire design knowledge, and improve consumers’ satisfaction with product design. Shi et al. [21] developed an innovative approach of Apriori and rough set theory to extract kansei knowledge of mobile phones; Akgül [37] proposed a market-oriented baby cradle design method in which rough set theory is used to extract new product strategies based on association rules mining. Shieh [38] developed a systematic approach to explore the relationship between shape and color in product evaluation. They applied KE and RST to carry out the visual design of toothbrushes. Wang [24] introduced rough set theory (RST) to derive decision rules to correlate user perception with demographic variables (ie age, gender and Occupation) so as to complete the product recommendation and innovation. Li and Zhu [35] proposed a design knowledge extraction approach based on multi-objective optimization and rough sets, and took car shape design as an example to demonstrate the effectiveness and rationality of they proposed method. Wenyan Song and his team [39] proposed a comprehensive rough group analytic hierarchy process to effectively evaluate customer needs with uncertainties and vagueness factors for industrial product service systems. Shao et al. [40] linked demand configuration with engineering configuration to guide customers to find the most dependent design specifications, but it lacks the consideration of users’ psychological characteristics and emotional satisfaction factors.
To review the previous literature research experience, it can be found that RST is not combined with KES in product innovation design. Most of these research mainly involves rough set attributes reduction algorithms to find the core items of the product [21, 38], and then combine with other data mining methods or statistical theories for further decision-making exploration. However, the weight calculation of rough set is not integrated into the derivation process of the styling elements in KE. At the same time, the previous decision table construction process of RST has not been fundamentally combined with user preferences, so that the experimental results obtained may not be able to attract users. Therefore, in this study, we introduced the attractive element research method of EGM to extract product styling elements, and then construct a decision table based on the experimental results, so that a decision-making system based on the actual attractive elements of the product is effectively constructed. What’s more, the attribute weight obtained by rough set is an objective result of reasoning. Thus, we incorporate it into the method of fuzzy weight association rules mining to obtain product design rules that conform to user preferences.
Continuous fuzzy kano model
As an effective theoretical method for studying human emotional needs, the kano model is a theory developed in 1984 based on Herzberg’s motivational stimulation method, known as the attractive quality theory [26], which could develop an efficient model to explore the different demand attributes of users, and divides customer preferences into five categories, namely, “attractive”, “one-dimensional”, “must-be”, “indifferent” and “reverse” based on the respondents’ opinions [41]. Therefore, the two-dimensional concept in the Kano model can clearly explore the relationship between customer satisfaction and product or service quality [42]. Understanding the impact of customers on products and services through the Kano model questionnaire can improve customer satisfaction [43]. Using the Kano model to define quality categories could help designers determine the true needs of consumers and enable them to more accurately control quality and satisfaction during product design and development process [28]. However, when consumers are uncertain about the answer given by a certain product attribute, the traditional Kano model’s survey data for this part of survey result from customers is not accurate [44]. In order to improve the accuracy of emotional capture, fuzzy set [12] should be used to imitate human emotional cognitive model. The cognitive response of using decimals between 1 and 0 instead of integers can better reflect the real user psychological characteristics. Moreover, in view of consumers’ internal requirements and evaluation of products are consistent, Wu and Wang [29] proposed a CFKM model based on consumers’ demands for products and the quality attributes were determined through the results of the quality two-way questionnaire, and a standardized influence value matrix was introduced to correspondingly adjusted the values of other qualities on the upper-right quadrant (Table 1) so as to further quantify the factors that determine the user’s product quality requirements, which plays an important and positive role in the quantitative research of users’ fuzzy and implicit demand. Hence, CFKM has been used by some scholars to discuss user needs and satisfaction. Chai et al [45] applied CFKM to quantitatively analyze the relationship between different cultural elements and user satisfaction, and thus important cultural elements are identified. Wu and Wang [29] proposed CFKM to solve the uncertain and ambiguous factors in user needs. It can be seen that the application of CFKM is involved in both products design and culture innovation, which is demonstrated this method is more advanced and rational than traditional kano model. Therefore, this research attempts to use the satisfaction coefficient of the continuous fuzzy Kano model to further calculate the demand impact priority of kansei images so as to clarify the key kansei factor of user’s emotion.
Influence values of the combinations
Influence values of the combinations
Data mining
Through data mining methods, the required information can be mined from large amounts of data [46, 47], and the associate rule mining is an important issue in data mining [31], which is used to discover interesting relationships between variables in large databases. The Apriori is suggested by Agrawal et al. [32] has been widely used to discover the relationship between variables in large databases. There are two basic measurements to evaluate the association rules, namely, support and confidence. However, only using confidence and support as criteria, which will not produce useful rules from a practical perspective [48]. Some data quality indicators, such as understandability, interest, and timeliness, can be applied to the generated rules [49]. To reference previous publications [21], the main steps of this algorithm are as follows:
In the decision table (DT), c∈C is condition attribute, d∈D is decision attribute, rule c⟶d represents the relationship between condition attribute c and decision attribute d, and support refers to the frequency of occurrences of a set of items in the database, and it often expressed as support(X). The higher support means that the more popular of this project set in this database. In this paper, the support of rules in this decision table is expressed in support (c⟶d), and its calculation formula is as follows:
When the association rule is mined, it is necessary to set a threshold value of the support degree. which is called the minimum support degree (Min-Sup). What’s more, the confidence degree of the association rule is further defined. If the association rule is c⟶d, the confidence degree refers to the conditional probability which d will also appear under the condition that c appears, and it could be defined in Formula (2):
If only relying on the “support-confidence” approach will lead to a large number of trivial rules [48]. To this end, many researchers have proposed new methods for evaluating association rules, and other evaluation methods include lift and leverage [50]. Lift represents the measure of strength relative to random occurrence by a given rule. Leverage ratio could measure the degree of dependence between the antecedent and subsequent. These index quantify the reliability of the rule and are defined as follows:
In addition, the rules obtained should also be interesting and understandable. Ahn and Kim [51] proposed an interest metric called netconf to evaluate the interest of association rules. The netconf rule c⟶d is defined as follows:
Moreover, the comprehensibility is measured by the number of attributes involved in the rules, and attempts to quantify the comprehensibility of the rules. If the antecedent conditions of the rule are less, it is easier to understand [52]. The comprehensibility of the rule c⟶d is defined as follows:
When the association rule is mined, it is necessary to set a threshold value of the support degree. which is called the minimum support degree (Min-Sup). Similar to the minimum support level, by setting the minimum confidence value(Min-Conf), the association rules with less confidence thresholds are deleted directly. Hence, if Support (c⟶d) is greater than the minimum support and Confidence (c⟶d) is greater than the minimum confidence. Hence, the rule c⟶d is called the rule set. Moreover, we could determine the union of rule sets by Apriori algorithm. The rule set R
k
generated by the minimum support Min-Sup(i) and the minimum confidence Min-Conf(i) merged by the i rule. Then, to calculate the support and confidence of each rule in the candidate set C
k
. The combined support and confidence can be calculated as follows:
Finally, some rules according to Minimum-Support and Minimum-Confidence could be deleted to form R k so as to make the excavated results more efficient.
In fact, the conventional data association mining technology uses support, confidence and other evaluation index to mine the corresponding rules. Although this method is valid, the interval division boundary is still sharp and rigid. Fortunately, the fuzzy set theory could provides a new method for improving traditional Apriori algorithm [53], which could make the information and knowledge mined more compatible with human cognitive understanding pattern. Fuzzy association rule mining was first proposed by Kuok et al. [54]. Fuzzy sets can deal with the problem of sharp boundaries and make the discovered rules easier to understand. Furthermore, different attribute values belong to a certain interval with different degrees of membership, and the association rules of fuzzy sets are obtained. Chiu et al. [55] proposed the fuzzy association rule mining method to calculate the confidence level so as to discover the relationship between the transaction database and the browsing information database. Pei et al. [56] introduced a novel Shannon-like Entropy, and then proposed the support and confidence of fuzzy probability database to quantify association rules. Finally, the FARP algorithm is developed to use the proposed interest measure to discover frequent fuzzy-probability item sets and fuzzy association rules. Yan et al. [53] proposed an improved fuzzy association rule of Apriori algorithm based on fuzzy c-means. Wu et al. [57] have proposed a fast list-based multiple fuzzy frequent itemsets mining algorithm (LFFT2), which is used to test multiple fuzzy frequent itemsets to present more useful and meaningful knowledge so as to formulate effective strategies. In fact, different items often have different importances in data set. However, fuzzy association rule mining ignores the different importances of each item, which will further lead to the fact that the frequent itemsets mined are not combined with the weight of the items, so that only the frequency in the data set is considered. Thus, the mined results is often unreasonable. To handle this problem, Cai et al. [34] proposed a weighted mining method to reflect the different importance of each items, which could assign different importances to the items to further mine the association rules. Yue et al. extended their concept to fuzzy term vectors [58]. Yun scholar [59] proposed a new measurement weight reset reliability method to mine related patterns with affinity weight. Hong [60] proposed a new weighted data mining algorithm, which can extract weighted association rules from quantitative transactions. Obviously, the application of these methods in actual projects has achieved positive value. However, In KE study, this kind of fuzzy data mining method based on weight is rarely applied.
Therefore, in order to solve the problem of the traditional Apriori method for assuming that the item weights are the same, this study uses the FWARM method and combined with the objective item weights obtained by the rough set method to make the mining of association rules more reasonable and accurate. Then, the CFKM is used to obtain the emotional satisfaction impact value of user needs, and further in view of item weights and emotion fuzzy interval to effectively mine significant association rules.
Proposed methodologies
This research proposes a product design rule mining method driven by user kansei image using the combination method of Rough Set and CFKM. In particular, based on the EGM interview method, the reasons of why users love this product is analyzed, and further explore the specific product form characteristics and kansei image factors of the product which could attract users. Then, the CFKM was used to analyze the user’s emotional preference of demand items, and a decision table is constructed with attractive form attributes and user’s emotional demands, the attributes are further reduced by using the RST method to deals with ambiguity and inconsistency knowledge for extracting core modeling features and calculating the attribute weights. Furthermore, fuzzy weight data mining technology is used to obtain the mapping relationship between modeling features and kansei images. Finally, the design rules set is filtered out so as to guide the positioning of product shape design and development, and then optimizing the product concept design process. As Fig. 2 shows, the operation procedures of this research framework includes the following steps: Initially, through EGM to explore the relationship between the key kansei image that attracts consumers and the specific morphological characteristics of the product, so that the product shape and kansei intention with attractive characteristics is excavated. The continuous fuzzy kano model is utilized to judge and analyze the user’s emotional satisfaction so as to effectively quantify and analyze the user’s fuzzy and uncertain emotional demands. Thus, the key demand factor of kansei semantic items of the product is screened out based on the ranking result. Then, the SD method is applied to investigate the cognition of emotional image vocabulary, which could be used as decision attributes to construct a decision table (DT). Through the application of RST mothod, the attribute reduction is performed, and then the weight of the key items of the product modeling are calculated. Finally, the experimental result of SD is converted into a fuzzy interval. Then, the fuzzy weight association rule mined method is used to explored the relationship between the product modeling feature and the overall perceptual image effectively, so that the strong rules set can be obtained to promote the generated rules to be more accurate, interesting and easy for desigers to understand.
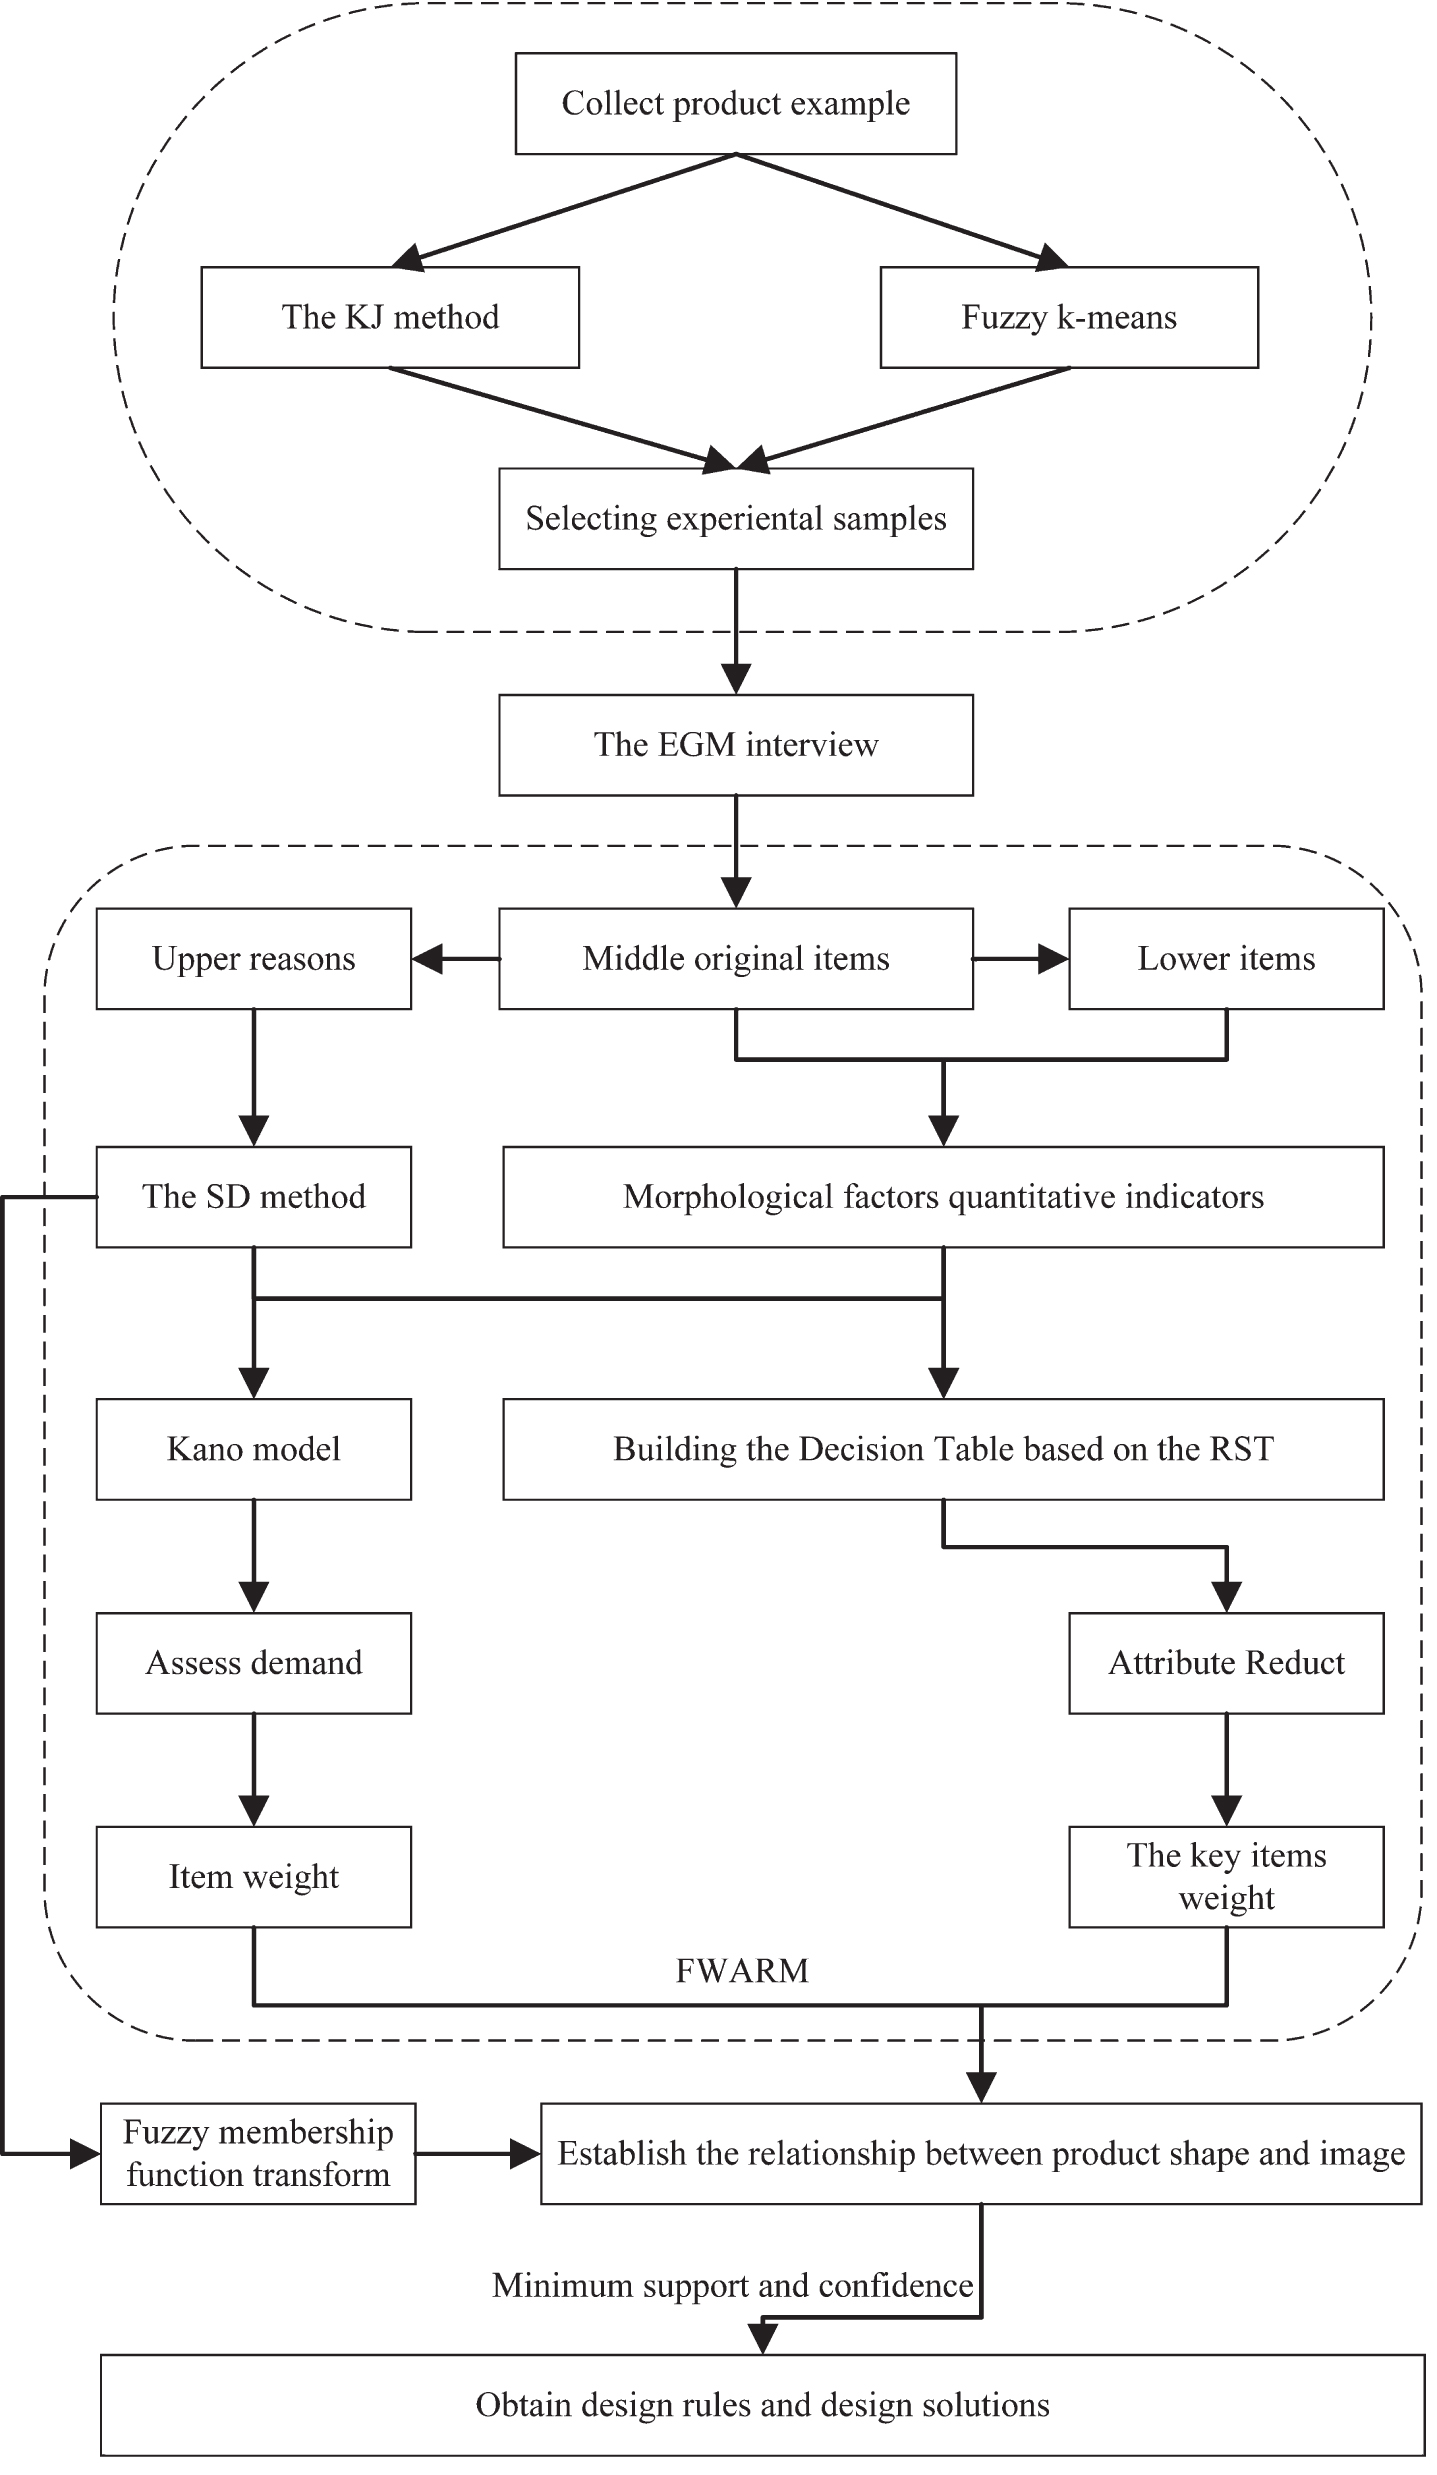
The research framework for this study.
“Miryoku” is a Japanese word meaning “power of attractiveness”, which makes products have favorite style, taste, texture and uniqueness features and these qualities could attract the attention of users. Simply speaking, Miryoku Engineering [61, 62] recommends Preference-Based Design, a technical system to find the attractiveness from users’ preferences. Then, the relationship between the preference and the attractiveness could also be uncovered [63]. The evaluation Gird Method (EGM) as an expert evaluation tool for Miryoku Engineering, which further developed by Sanui [64] in 1996 based on Kelly’s repertory grid method [65], the goal of this method is to extract the consumer language to understand the various factors of the evaluation project and the composition of the grid. Through the in-depth investigation, the hierarchical relationship between the image semantics of the upper level of attractiveness factors and the specific attractive features of the lower level could be constructed based on the abstract to the concrete evaluation of the original project. Therefore, the consumer value structure is visualized and immobilized [64, 66]. This method has been widely used in product design [67, 68]. The evaluation gird method(EGM) operation procedures are specifically described as follows:
1. Firstly, select the more classic experimental samples on the market, print all the product sample images in the form of A4 printing paper and ask interviewee to select they like; 2. Let the interviewee express reasons for their preferences in order to build production original evaluation items; 3. Ask them about the psychological feeling (upper-level) and the concrete feature traits (lower-level) from original evaluation item; 4. Investigating the user for all favorite sample pictures and connect the corresponding items by straight lines to show the hierarchical relationship between Kansei word and modeling elements; 5. Merging and classifying the same or similar of upper-level (kansei image) and lower-level (specific modeling features) by KJ simplification method. The number of times after merging is equal to the sum of the number of times mentioned by all users before merging. Therefore, the hierarchical relationship between the kansei image semantics of the upper layer and the specific modeling attractive features of the lower layer is constructed.
Continuous fuzzy kano model
In this stage, continuous fuzzy Kano calculation questionnaire (CFKQ) and continuous fuzzy Kano models(CFKM) are used to truly capture the emotional needs of users. The upper level images semantic items explored in the EGM interviews could be inported into the continuous fuzzy Kano model for quality classification. In view of the positive and negative questionnaire, one of these can be “when attributes are sufficient, what about customer satisfaction?” and the other “when attributes are insufficient, what about customer satisfaction?” Then, to investigate the user’s response when the semantic performance of each image is sufficient or insufficient so as to determine the quality attributes of the product image semantics based on the experiment results, and further analyze the uncertain relationship between product attractiveness factors and customer satisfaction. What’s more, the setting mode of CFKQ questionnaire could enable respondents to more comprehensively and accurately express the ideas and solutions when they usually face, and fit them with the human thinking model. Thus, this CFKQ should assign the corresponding proportions according to the user’s fuzzy emotional thinking, and the settings way of CFKQ is shown in Table 2.
Continuous fuzzy kano questionnaire
Continuous fuzzy kano questionnaire
Cronbach’s a coefficient is generally used to test the effectiveness of the questionnaire on production satisfaction to implement the Kano model. The coefficient is used to estimate of questionnaire reliability and stability. Cronbach’s a coefficient is defined as Formula (16) [69]:
Where K is the number of items in a scale,
Simultaneously, the basic steps of the CFKM algorithm can be computed as:
Wu and Wang [29] defined the continuous fuzzy kano model as: from the subjects’ responses on the element quality, the subscript n represents the subject n; Fn is the membership degree of i th standard answer to the functional question; fn is the specific value of each score for the five i th standard answers by each participant. Similarly, Dn is the membership degree of the j th standard answer to the dysfunction problem, and dn is the specific value of each score for the five i th standard answers by each participant. Therefore, Fn and Dn can be constructed as:
The quality matrix Un is the product of Fn and Dn, and it can be calculated as:
Next, this article introduces an “impact value” to represent the contribution of each 25 combinations of participants satisfaction. In practice, the influence values can be determined by the researcher for his experience. Therefore, in this study, the value of each quality of NIV (Normalized Influence Value Matrix) is half of each quality value about the Kano evaluation table. Therefore, the NIV could be constructed as [29]:
The individual participant satisfaction (sn) for the quality of a certain element can be obtained by mathematical aggregation of the influence value weighted by the corresponding degree of membership. The continuous sn value can be used to quantitatively analyze the participant’s response [45]. sn can be weighted as:
The quality of each element with the same sn value can be assessed by participants with different importance. With the help of importance score (w), a more accurate personal customer evaluation can be calculated. The range of (w) is [0, 1]. In the C-FKM two-way questionnaire with N number of respondents and importance score (w), the evaluation index (EI) value of a certain element represents the average influence of the element, which can be calculated as follows [45]:
EI is the affective value of a certain element’s emotional satisfaction. Doubtless, it has the characteristic of continuity, so the final weight of each evaluation index can be standard calculated as follows:
In this study, the product modeling elements are mainly analyzed on the basis of decision tables, including conditional and decision attributes steps. In the rough set theory system, knowledge expression is a key point. The rough set could abstract the research object into the information system or knowledge expression system, which can be represented by a four-tuple information and is usually defined as [38]: S = (U, A, V, f), where U is a finite set of objects (universe); A is the knowledge attribute set, V is the knowledge attribute value set, f is the knowledge function, U×A⟶V. If A = C∪D and C∩D=ø, then I = (U, C, D, V, f) is called the decision table, where C is the conditional attribute set and D is the decision attribute set. The important technique of rough set could include lower approximation(
In general, the upper and lower approximations include elements which could undoubtedly/may belong to a related set. In knowledge expression systems, to delete some knowledge does not weaken the classification ability of knowledge databases, that is to say, not all design attributes and elements could impact on the strength of images of the product. The purpose of attribute reduction is to find the necessary design elements from all design elements. The set of all necessary original relationships in C is called the D core of C, and is recorded as CORE(C) [24]. In order to determine the importance of the condition variable a, the coefficient γ (C, D) is used to decide what would happen if the variable is deleted. If (γ (C, D) -γ (C-{a}, D)) is large, the variable “a” is essential for the entire system. Hence, these indispensable variables are considered core features, which are mathematically equivalent to the intersection of all possible reductions. Finally, the importance of attribute a is measured by calculating the change for the value of γc (D), and each attribute is calculated in turn, and then to arrange these attributes in order from large to small. Therefore, the ranking of the degree of influence of conditional attributes on decision attributes is obtained.
The definition symbol of FWARM used in this research is as follows [60]: The n is the total number of the data, m is the total number of items, u is the total number of membership functions for item importance; D i is the i-th record in the data, 1≤i≤n, A j is the j-th item, 1≤i≤m, h is the number of fuzzy regions for each item, R jl is the l-th fuzzy regions for A j , 1≤i≤h, V ij is the quantitative value of A j in D i ; f ij is the fuzzy set converted from V ij ; f ijl is the membership value of V ij in Region R jl ; count jl is the summation of f ijl , 1≤i≤n. wsup j :is the fuzzy weighted support of item A j , α is the minimum support value; wconf R is the fuzzy weighted confidence of rule R; β is the minimum confidence value; C r is the set of candidate weighted itemsets with r items; L r is the set of large weighted itemsets with r items; W j is the weight for importance of item A j .
To calculate the fuzzy weighted support for each 1-item sets and filtering by the minimum support, all frequent 1-item sets can be found. Then, the 1-item sets are combined to form candidate 2-item sets, and the same process is used to find all frequent 2-item sets. Then, to repeat this process until to find all items set. Finally, through β to filter rules that meet the consistency requirement to find interesting association rules. The FWADM algorithm can be divided into ten steps as follows [22, 60]:
Step 1: Through specified fuzzy membership function, convert the original data V
ij
of each item A
j
in the database into the fuzzy set f
ij
’s presentation way.
Where h is the number of regions for A j , R jl is the l-th fuzzy region of A j , 1≤l≤h, and f ijl is V ij ’s fuzzy membership value in region R jl .
Step 2: the count of each fuzzy region R
jl
is calculated in the data as follow:
Step 3: The fuzzy weighted support wsup
jl
of each item A
j
can be calculated as follow:
Step 4: Then, the candidate itemset C1 based on the fuzzy regions of all items. Determining the minimum support a and check whether the wsup
jl
of each item A
j
is greater than or equal to the minimum support a. If wsup
jl
is equal or greater than a, and then it should be included in L1,which is expressed using the following formula:
Where the threshold of a will be arranged on different value based different stage.
Step 5: If L1 is not empty, then go to step(7), else end the process.
Step 6: To set r = 1, where r is used to represent the number of items retained in the current item set, and then generate candidate set Cr +1 from L r , this method is similar to the Apriori method [32]. In other words, the algorithm first connects two attributes together in the L r , and then assuming that the r-1 items in the two itemsets are the same, and the other itemsets are different. Thus, it saves the itemset in Cr +1, where all the sub item sets of item r exist in L r .
Step 7: Subsection for L
r
joining as following:
Step 8: Let s be the (r + 1) item set of Cr +1, to calculate the weighted fuzzy set (W
fis
) of s in each transaction data D
i
as:
Where f isj is the membership value of s j in D i , W j is the j item weight.
Step 9: The fuzzy weighted support of itemset s is calculated as:
To check whether the weighted support (wsup s ) of the item set is greater than or equal to a. If wsup s is greater than or equal to a, put s into the frequent itemsets Lr +1.
Step 10: The association rules from each weighted q item set s is constructed with items (s1, s2, ... , s q ), q≥2, then using the following substeps:
(a) All possible association rules are formed as follows:
(b) To calculate the fuzzy weighted confidence value wconf
R
of each possible association rule R as:
Where
(c) To check whether the wconf R is greater than or equal to the minimum confidence β. If wconf R is great or equal to β, rule R could be selected in the interesting rule set.
In this section, we choose electric bicycles as research objects. The China’s Ministry of Industry and Information Technology has revised the mandatory national standards for the “Electric Bicycle Safety Technical Specifications” since April 15, 2019. The policy of the new national standard has reduced the size of products and improve the product safety factor. Thus, enterprise manufacturers have to redesign products to meet this standard. Thus, the electric bicycle production are used to verify the effectiveness of the proposed research method.
Selecting experimental samples based on the K-means
Firstly, we select electric bicycle samples from 20 different manufacturers, and these electric bicycles have entered the market from 2014 to 2019, and then a total of 80 product samples were selected to conduct effective experiments, which are as similar as possible in terms of contrast and size. Furthermore, these sample pictures also have excellent quality and shadow so as to represent the real three-dimensional shape of the product. Then, we need to select representative products from most samples to improve the efficiency of subsequent emotional cognition experiments. Therefore, eight designers had at least five years’ product design experience with the background in industrial design were recruited to conduct sample screening experiment. The group was asked to use the Kawakida Jirou method [70] to classify the same products into the same category based on their similarity. The number of product groups and the number of products in each group are not limited. Then, we built a similarity matrix from the previously obtained experiment result. The similarity matrix was transformed into a dissimilarity matrix so as to reflect the cognitive gap factos of user’s psychological model.
The Ward method in cluster system is used to cluster the distance matrix to cause the smallest variance of the merged group. Therefore, the distance matrix is clustered by the Ward method through the SPSS software, and the output result of clustering tree diagram is analyzed, so that products are classified into 31 categories. Then, we use the K-means clustering algorithm [71] through SPSS, and set the number of clusters centers to 31, and get the distance between each product and each cluster center (as Table 3). Eventually, the sample which has the smallest distance can be selected for each group’s representative sample. However, some electric bicycle samples have similar distances, and we ask for the opinions of designer group. Although two products belonging to the 30th category have the same distance(13.058), they have some obvious differences in the styling characteristics of the products. Hence, these two products are selected together. Finally, 32 representative electric bicycles are selected to conduct the next experimental research.
Euclidean distance between each sample and cluster center based on K-means
Euclidean distance between each sample and cluster center based on K-means
Investigating product attractive elements based on the EGM interview
The 32 samples are processed into A4 paper size by the computer software PS, and the resolution of the picture is set to 200 dpi. Then, the picture is decolored which makes the picture samples uniform. At the beginning of the experiment, a total of 12 people group of 6 production designers with rich design experience and 6 graduate students with three years production research experience were recruited to the EGM process for obtaining product form attractive factors. Through to use the EGM method, the original evaluation item (median-level) of the specific attraction is requested, and the form attractive characteristics (lower-level) and the emotional factors (upper-level) generated by the sample are asked. Then, the similar evaluation item are further merged by the KJ method. Therefore, the experimental result revealed that six median-level evaluation projects, 28 lower-level evaluation projects and 14 upper-level evaluation projects are obtained. Furthermore, the hierarchical structure diagram showed in the Fig. 3.

The hierarchical diagram of electric bicycle.
According to the number of times users mentioned in the EGM interview process, there are 14 kansei adjectives(upper-level) could be obtained, which are modern and succinct, technology and delicate, safe and stable, light and lively, novel and personality, fun and cute, sporty and speed, graceful and beautiful, powerful and ferocious, mellow and full, small and flexible, stylish and tasteful, retro and classic, common and popular. Thus, the specific mentions times of 14 kansei words is shown in Table 4. However, in view of the mention number of items in the EGM interview process is still a subjective judgment method based on experts, the real emotional needs of users are actually uncertain and vague. To this end, this study screened out eight semantic words of the corresponding experts evaluations times ranked from high to low, and then further conducted two-dimensional emotional satisfaction analysis so as to analyze the user’s key emotional need with uncertain factors.
User image semantic evaluation item mentioned times
In order to comprehensively consider the user’s implicit emotional satisfaction factors, the continuous fuzzy kano model is introduced to explore the user’s satisfaction with eight image vocabularies (as Table 5) which have the highest number of mentions. The experiment selected 81 graduate students and undergraduates majoring in industrial design, and designed the CFKM questionnaire for investigation (Table 2). Finally, all the questionnaires were collected, and then the reliability of the questionnaire was tested by calculating the Cronbach’s α coefficient. Then, the results were 0.79, which could means that the reliability of this experimental investigation is acceptable. Then, according to formulas (9)–(16), the satisfaction impact values and weights of the eight evaluation items are calculated. The results obtained from the experiment are shown in Table 6. In addition, the change and contrast of weight value for eight items are shown in Fig. 4.
Frequency of mentions for eight evaluation kansei words
Frequency of mentions for eight evaluation kansei words
Evaluation item satisfaction EI value and weight

Kansei words affective satisfaction influence weight analysis.
According to Table 6, it could be found that among all the frequently mentioned words, the influence of K3(technology and dazzling) is 1.4097, which is the highest among the eight kansei items, and its weight value W is 0.2779. Therefore, according to the experimental results, the item with the highest number of mentions is K3, and this item satisfaction weight W is also at 0.2779. Therefore, we choose the kansei image of the K3 for subsequent user preference measurement.
In order to more accurately quantify the user’s preference of the technology and dazzling Kansei semantic of electric bicycle products, the 5-point SD method was used to further experimentally measure [72]. The SD method has been widely used in the KE, and it could relatively easy to experiment and the cost is also low, and then it has high reliability and validity [73]. Therefore, in this study, we used a pair of adjectives to aggregate the of technology and dazzling and its antonyms into adjective groups, and then surveyed 157 participants preference strength on a scale of 1–5 to evaluate the outdated and ordinary image and technological and dazzling of the shape for electric bicycles. Moreover, the experiment results for the 157 participants of the SD experiment could be calculated by using the method of sample mean statistics.
Building the product decision table
The rough set theory could provide a very effective tool to deal with discrete nonlinear attributes, but RST could not directly deal with continuous attribute variables. Therefore, before applying the reduction attribute process, the data should be discretized. Some scholars have pointed out that there are three methods for discretization of continuous attributes, namely S, H and L method [74]. In this study, the L method proposed by Lenarcik is used to make kansei image scores obtained by the SD to convert into discrete datas. Specifically, the emotional image evaluation results are in the interval [1,2.5] which coded number 1, the result in the interval [2.5,3.5] which coded number 2, and the result in the interval [3.5,5] which coded number 3. Moreover, the discretized kansei words evaluation value is used as the decision attribute D, which is combined with the condition attribute C so as to construct the decision table (DT) for the electric bicycle product design. In addition, the classification of design elements is based on the principle of user emotional preference, and is divided by the low-level results of EGM interview. Therefore, the coding method of product form is further concretely constructed, as shown in Table 7. Finally, a decision table for the design of electric bicycles could be established (as Table 8).
Deconstruction table of electric bicycle modeling features
Deconstruction table of electric bicycle modeling features
The production decision table
According to formula (17)–(23), design attributes of electric bicycle production is reduced based on Table 8, and then it could be found that C1, C2, C3, C5, C6 are necessary core attributes and C4 is unnecessary attribute in C of D. Hence, the C4 is the redundant attribute which should be deleted. Accordingly, the core attributes of electric bicycle production is C1, C2, C3, C5, C6, and the main product features that affect the user’s emotional imagery of “technology and dazzling” are the front structure, the wheel hub, the waist line, the headlight and the fender. However, the cushion attribute has less influence and its relevance of the decision attribute image D is lower.
Then, the importance of each condition attribute is calculated according to formula (22), and obtaining the importance of attribute C3 as 0.333, the importance of C1 as 0.286, the importance of C5 as 0.191, and the importance of C6 and C2 as 0.095 (as Table 9). Thus, the rank for importance of the electric bicycle product development of “technology and dazzling” as: Waist line (C3)>front structure(C1)>front light(C5)>wheel hub(C2)=fender(C6). Accordingly, in the development and design of electric bicycle products, the user should pay more attention to the design of the waist line and front structure for the “technology and dazzling” kansei image (see Table 9), followed by the design of the front light, and finally is design feature of wheel hub and fender.
The design attributes weight calculation results
The design attributes weight calculation results
To apply FWARM to the development of new products, and combine the product item weight calculated by rough set and the weight value of user emotional satisfaction calculated by CFKM, and further analyze the potential relationship between kansei image and product design elements. Through the pre-defined minimum support and confidence, the interest rules and design elements are mined to guide the designer’s practice and research of production.
Firstly, product examples form data is converted into the corresponding data set. In fact, the set of styling items for electric bicycles is a clear division. For example, for a sample whose morphological characteristics belong to the second key lower-level item, it is marked as 1, and 0 is no. In addition, the data obtained by the original SD investigation needs to be further transformed into a continuous fuzzy value in the form of equation (24) from the pre-defined fuzzy membership function (see Fig. 5) in order to in line with people’s cognitive thinking mode. The transformed values of all SD data are as shown in Table 10. Thus, an evaluation matrix combining the membership degree of product modeling features and the fuzzy image of technological sense is further constructed, as shown in Table 11. Then, Equations (25)–(26) are used to find the sum of the fuzzy intervals of each item, and then multiply the corresponding weight of the item obtained by the rough set and the satisfaction weight of the user’s kansei image of technology, thus the fuzzy weighted support is obtained. Furthermore, we calculate other fuzzy intervals and compile them into candidate 1 item set, named C1, as shown in Table 12. Then, we filter out frequent sets according to the minimum support a. The minimum support a of each stage is different, so that different α thresholds are set. Specifically. L1 is set to 0.65, L2 is set to 0.60, L3 is set to 0.4, and L4 is set to 0.25. Accordingly, the experimental results show that the fuzzy weighted support values are greater than the minimum support value is bolded (as Table 12), which corresponding items are classified as frequent 1-item sets (L1).
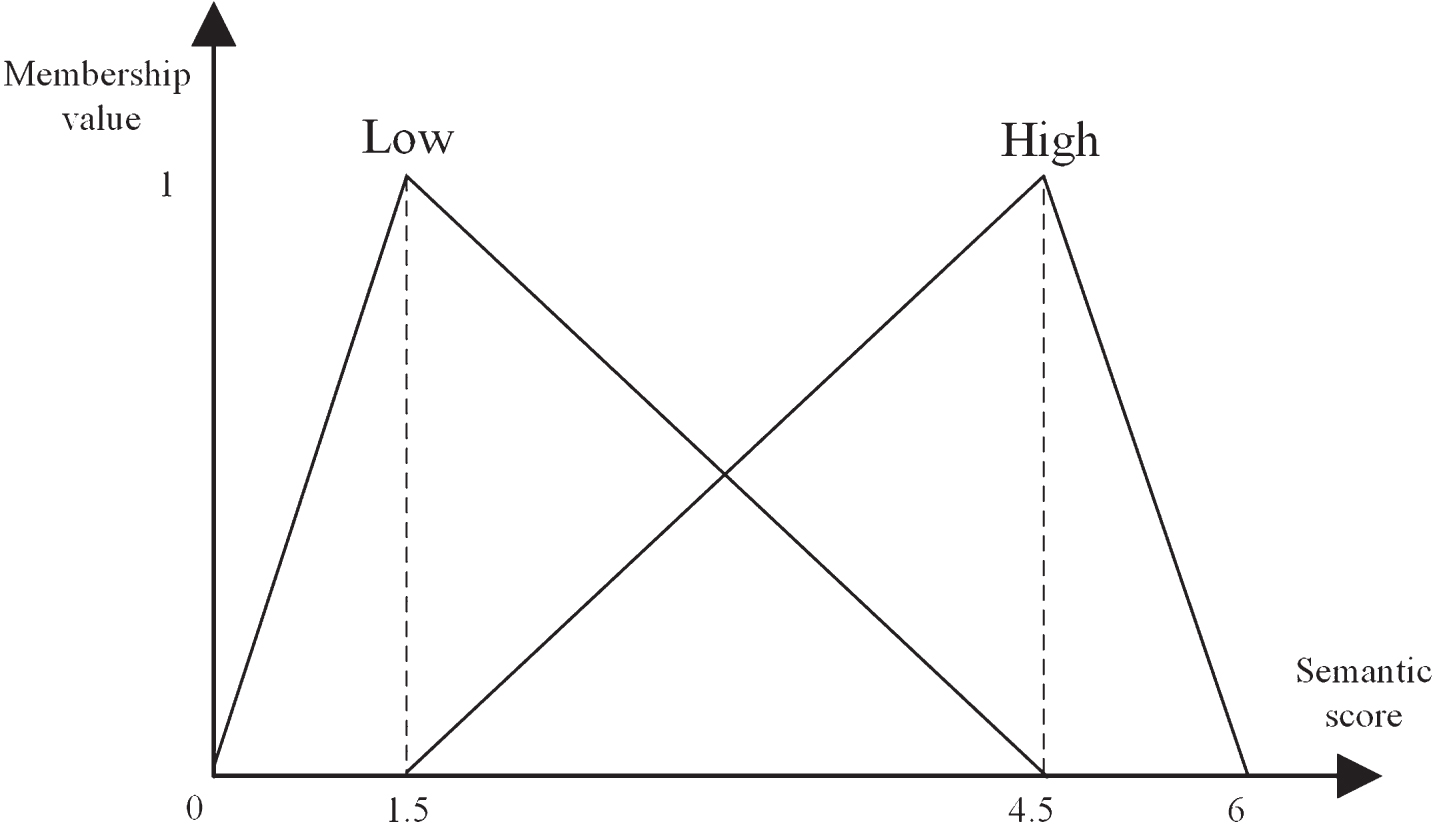
The membership functions for item SD score.
The score of decision attribute transformed by fuzzy membership function
Design feature categories of representative samples and user fuzzy emotional demand
Candidate 1-itemsets
According to the Apriori method, any two items in L1 are connected through a connection step to generate a candidate set of 2-items C2. According to equation (28-30), we could re-evaluate their fuzzy weighted support, and then generate a total of 23 frequent 2-item sets (Table 13). In a similar way, the experimental results of higher-level item sets are explored until no available combination item set is found. Tables 14 and 15 show 12 three-item sets L3 and two 4-item sets L4. Therefore, based on the screening of the minimum support value a, there are a total of 37 frequent itemsets that meet the conditions of electric bicycle product design.
Frequent 2-itemsets of association rules
Frequent 3-itemsets of association rules
Frequent 4-itemsets of association rules
Then, the 37 frequent item sets are further filtered through the confidence of Apriori method evaluation index to ensure rules could be more efficient. The product item characteristics could constitute the antecedent part of the rule, and the user’s cognitive scores for kansei word of technology could constitute the subsequent part of the rule. According to Equations (31)–(32), the confidence result of each fuzzy weighted association rule is calculated. The confidence of 37 rules could be obtained in the experimental results as shown in Table 16. Furthermore, the minimum confidence threshold β is predefined as 0.06. After deleting rules below the threshold β, a total of 25 interesting rules are extracted. However, some of the 25 rules have overlap factors, such as If C12, then T1, and If C12, Then T2, and then analyze the correlation between the design elements and the kansei image of technology. These rules can generate weak sense of technology, but also generate strong sense of technology. In fact, a strong sense of technology undoubtedly includes a weak sense of technology. Therefore, in order to avoid count repeatedly, these design rules should be streamlined and merged, and T2 is the actual result of “Then” for this rule. In the end, this experiment obtained 18 interesting rule sets (as Table 17). Moreover, these 18 rules also meet the pre-set conditions of minimum support and minimum confidence, and thus have high usability and practical application value. Consequently, when electric bicycle product satisfies such a combination of styling design elements, and it can convey the semantic image of technology and dazzling, and the real demands of users could be satisfied.
All rules that meet the requirements of fuzzy weight support
Interest rules
In an extremely competitive market, whether a product can quickly become the focus of the consumer’s perspective has become a key core factor for product success. Generally speaking, the previous KE research mostly used the SD semantic difference method combined with statistical methods to construct the matching relationship between product design elements and user needs. Doubtless, this is an intuitive, easy and feasible method. However, the SD results ignore users vague emotional cognitive needs. In fact, the real needs of users are hidden and uncertain. Therefore, in this study, we use the rough set method to accurately assess the customer’s psychological cognitive needs for products, and then extract core attributes which are strongly related to kansei image, and the attribute weight could be calculated. Furthermore, the two-dimensional quality model judgment are used to explore the user kansei demands, and the emotional satisfaction influence value is obtained in a quantitative way to mine the real and uncertain needs of users precisely.
In this study, in order to quantify the implicit preferences of users and refine the rules between product semantic image and product styling elements, we use the expert interview method to extract attractive factors of electric bicycle styling, and use KJ method to further merge similar kansei images and specific modeling features, and resulting in 6 median-level evaluation items, 28 lower-level evaluation items, and 14 upper-level evaluation items, so that an evaluation structure diagram of the electric bicycles is constructed. According to Table 4, it can be found that the times of 14 attractive perceptual images mentioned by experts is different, and “K3” is the most frequently mentioned word (95 times). In order to further quantify and analyze emotional satisfaction attributes of kansei image factors, the CFKM is used to quantify and compare perceptual image items, in which the kansei image of technology has the highest degree of influence. Therefore, the user’s main and key demand for electric bicycle products is technology kansei style. In order to further quantify the preference of technological kansei image as the product’s main styling factor, then conducting the SD quantitative evaluation experiment. Hence, a decision table is constructed based on experimental results, and rough set theory is further used to reduce the attributes of the knowledge expression system to extract the necessary core attributes. According to the experimental results, five electric bicycle styling items which is “front structure”, “wheel hub”, “body line”, “front lighting” and “fender” are key factors that influence consumers to produce technology and dazzling image. The importance of these 5 styling items of electric bicycle could be further calculated.
In order to determine and explore the relationship between the technology image and the product modeling elements, the corresponding rules can be extracted by using the traditional Apriori method, we use the traditional Apriori [32] method to mine association rules. In order to extract decision rules, we set the minimum support is to 3/31, the minimum confidence is to 0.5, and the minimum lift setting is 1. According to formulas (1)-(8), the decision rule for the emotional response is effectively derived (Table 18). Obviously, it can be found that the number of rules extracted by the traditional Apriori is only 9, which is significantly smaller than 18 experimental results of proposed method in this research. Therefore, this research can generate more interesting and effective decision rules based on the consideration of fuzzy and weight factors.
Decision rules for the “Technology and dazzling” using the traditional Apriori method
Decision rules for the “Technology and dazzling” using the traditional Apriori method
Furthermore, in the process of mining association rules, the method proposed in this paper accurately mines the user’s implicit emotional preference factors through the kano model to reflect the actual demands of the user. The satisfaction degree factors investigated by CFKM are also cleverly integrated into the FWARM as the importance of the kansei image. Undoubtedly, it provides a basis for the subsequent mining of association rules based on the real needs of users’ emotions. At the same time, it also incorporates the weight of each item obtained from RST to discuss each importance of products based on user need. Hence, the experiment results could not only reflect the fuzzy perception of users emotion, but also can meet the actual needs of customers. Therefore, the kansei-driven method composed of RST, SD, CFKM, and EGM proposed in this paper can be effectively applied to discover the mapping relationship between real and key kansei need of products and product feature combinations so as to provide theoretical guidance for the development and decision-making of enterprises.
In short, the decision support model proposed by this research can help designers develop new products that meet customer needs. This study uses electric bicycles as an example to verify the effectiveness of the proposed integration method. As a result, 18 interesting rules can be found that can improve customers’ demand. Among them, 12 rules have significantly improved the kansei image of technology, and 6 rules are improving low technology image (see Table 17). In summary, this research explores product design schemes that meet user needs through the adopted research framework, which can capture customers’ vague psychological needs and effectively solve uncertain emotional evaluation issues. An overall comparison between this paper and the past studies is described in Table 19. Obviously, the limitations of this study are as follows:
An overall comparison between this proposed approach and other studies
QFD: quality function deployment, CA: conjoint analysis, FA: factor analysis, KE: Kansei engineering, EGM: evaluation gird method, NLP: natural language processing, RST: rough set theory, ARM: association rule mining, GA: genetic algorithm, SVR: support vector regression, TRIZ: the theory of inventive problem solving, DT: decision tree.
Although these 18 product design rule schemes recommended by the results of this research could provide a reference for product design decisions. However, in view of the product has too many subdivided modeling condition attributes, the similarity of the rule schemes inevitably still exists, so that an effective rule screening process must be implemented to delete rules with higher similarity. In future research, it is necessary to propose a new method to measure the similarity of rules which could generate consistent rules with minimum overlap so as to further improve the design efficiency and success rate.
During the research step of user needs, participants and sample size are limited by time and resources. The results obtained may not represent all users’ preference for emotional satisfaction with the kansei image of electric bicycles. The number of surveys will be further expanded in the future which make this research results more accurate and effective.
In addition, the design rules extracted in this study can provide designers with design insights, but there is no in-depth study of this relationship between design variables and emotional responses. Future research should focus on the internal mechanism of these design rules to explore and analyze their coupling principles.
In this study, a user demand-driven product form design method is constructed to explore the product design and development process based on the user’s actual demand so as to reduce the subjectivity and uncertainty factors in the decision-making process. Firstly, the expert interview EGM method is adopted to explore attractive forms and kansei images of production. Next, the CFKM model is used to explore the demand items with the highest degree of satisfaction, which are used as the decision-making attributes. Based on the SD quantitative experimental results, a decision table (DT) is built to perform reduction and weight calculation of rough set theory. Then, the experimental results of continuous fuzzy kano model should be transformed into the weight of the image item, which could fully consider the degree of satisfaction for customer needs and preferences. Furthermore, in order to quantify the relationship between the combination rule of product modeling feature items and the kansei image of technology and and dazzling, the fuzzy weight association rule mining method is used to extract the kansei knowledge of product modeling design elements with significant relationships. Through the calculation of support and confidence for all rules, and then all efficient and interesting rules are acquired accurately. Following are the conclusions of this research. Using EGM method to accurately and quickly extract the kansei image and attractiveness factors of the product, and transform the evaluation items of attractiveness elements into the decision table, and convert the key upper perceptual image into the decision-making attributes, which enable the structured design decision table to be closely integrated with user’s real attractiveness factors. Based on the RST attribute reduction, the product modeling items closely related to the emotional image of the product are explored, and the item importance of the product is accurately calculated. For this reason, designers can further grasp the key points in product design process. The CFKM model is used to further accurately evaluate the user’s emotional needs and then the degree of satisfaction is obtained, which could effectively solves the subjectivity and uncertainty of user needs. Through the application of fuzzy weight association rule mining method to further explore the interactive relationship between the user’s kansei image and the modeling feature based on the user’s fuzzy cognitive characteristics. The product modeling development design plan that meets the needs of users is explored so as to guide the designer to correctly identify the design module parameters in the actual project. According to this proposed method, designers can quickly and efficiently obtain design plans that meet the emotional image needs of target users, and improve design success rate.
In the future, we propose to continue this research in several directions.
In view of the emotional experience of consumers caused by a certain design element of the product changes over time. This article digs out the mapping relationship between perceptual demand and product elements from the previous survey data, and this mapping relationship may change in the future. Therefore, in future research, we must first consider responding to dynamic users’ needs.
We used the rough set algorithm to determine the core attribute items of the product. When decision makers have conflicting views on a plan or proposal, which should also be considered. Thus, in future study, we should try to improve the rough set model to further determine and analyze the core attributes of the product. The main advantage of the the cover based q-rung orthopair fuzzy sets (Cq-ROFRSs) model proposed by Hussain [86] is the effective expansion of rough sets theory, which can handle more complex situations with complexity and uncertainty. In addition, soft rough Pythagorean fuzzy set and Pythagorean fuzzy soft rough set [87] should also be included in the environment of complex decision-making for further exploration of the ordering of product form elements.
Footnotes
Acknowledgments
The authors thanks for the anonymous reviewers for their help to improve this work.