
Abstract
Paroxysmal Atrial Fibrillation (PAF) is a special class of Atrial Fibrillation. Predicting PAF events from electrocardiogram (ECG) signal streams plays a vital role in generating real-time alerts for cardiac disorders. These alerts are extremely important to cardiologists in taking precautions to prevent their patients from having a stroke. In this study, an effective predictive approach to PAF events using the Extreme Learning Machine classification technique is proposed. Besides, we propose a feature extraction method that integrates new ECG signal features to its time-domain ones. The new features are based on the construction of sparse vectors for peaks in ECG signals that provide high overlap between similar ECGs. The proposed prediction approach with the new ECG features representation were evaluated on a real PAF dataset using the five-fold cross-validation method. Experiments show promising results for predicting PAF in terms of accuracy and execution time compared to other existing studies. The proposed approach achieved classification accuracy of 97% for non-streaming ECG signals mode and 94.4% for streaming mode.
Keywords
Introduction
Paroxysmal Atrial Fibrillation (PAF) is an episode of Atrial fibrillation (AF) that ends spontaneously or with intervention within seven days [1]. AF is known as the existing of sustained arrhythmia in clinical domain and increases a mortality risk. Atrial fibrillation lasts for more than 30 seconds [2]. The prevalence of atrial fibrillation in the population grows with age, therefore it can affect the population above the age of sixty [3]. AF can affect the life quality, resulting in dizziness, feeling of excessive fatigue and chest pain [4]. If PAF is identified early, possible complications can be avoided [2].
Classification of ECG signals has been extensively applied to detect abnormal heartbeats which helps in diagnosing many heart diseases, which is considered the main reason for early death worldwide [5]. ECG analysis gives cardiologists important information about the heart function and rhythm. Nowadays, there is an exponential growth in streaming data due to the growth of the Internet of Things and a huge number of live applications with sensors. Efficient analysis of streams provides important information for many applications and use cases. In particular, the detection of a point of a change in time where data differs from last normal behavior is an important task to trigger alerts in critical scenarios. As such, we are interested in the online classification of ECG data, as it is being an increasingly essential tool for providing reports to cardiologists to take appropriate actions.
We introduce a prediction approach for PAF events. The proposed approach consists of pre-processing, feature extraction, and classification phases. The feature extraction method depends on the integration of time-domain features with a new representation of signal features. It presents these features in sparse vector. The extracted features are passed to a classification technique called Extreme Learning Machine (ELM). The ELM technique learns optimal weights between the output layer and the hidden layer analytically. We evaluated the proposed PAF prediction approach in the non-streaming and streaming modes to confirm the validity of our approach. In the non-streaming mode, the ECG signals were segmented into short-term intervals, then feature extraction and ELM classification were applied. In the streaming mode, we developed our approach on the Apache Spark streaming platform to classify the ECG streaming signals.
The main contributions of this paper: A new method of representing the signal features in sparse vector is presented. The features extracted from our new method were integrated with the time domain method and then passed to the ELM. Our PAF prediction approach is presented by experimental exploration of ELM capabilities for ECG classification in streaming mode. This differs from existing research that introduces ELM in non-streaming environment. We evaluated the proposed PAF prediction approach in non-streaming and streaming modes, taking into consideration computational complexity and execution time.
This paper is organized as follows. In Section 2, a review of current works in the ECG classification field is presented. In Section 3, the ECG signals and characteristics of the dataset are described. Next, the architecture of our approach is proposed. In Section 4, the experimental setup used in the development of our proposed approach is described. The experimental results of the proposed approach are discussed in Section 5. Finally, the paper is concluded in Section 6.
Related work
Various techniques were applied in analyzing the ECG signal. Existing research in this area can be divided into these areas; noise filtering, extraction of various ECG sub-waves characteristics and identification of abnormalities in ECG [6, 7]. In [8] they presented an approach to detect differences in heartbeat morphologies based on abnormalities. Their methodology is based on methods for detecting statistical outliers and time-series data mining. The detection performance of these statistical techniques may be sensitive to thresholds and the size of windows. This sometimes results in many false positives in the detection of anomalies, as data change, frequent updates of thresholds are required. Therefore, there is still a need to improve existing methodologies and schemes.
Other research focuses on extracting features and classification of ECG signals. Each research in the field of ECG classification has specific manner of using feature extraction methods in order to pass the extracted features to the classifier. The authors of [9] proposed Discrete Wavelet Transform (DWT) for ECG signals analysis, and then they used support vector machine technique for ECG classification for heartbeat diagnosis. In [10] introduced an approach dealing with a different ECG features which passed to many machine learning classification techniques as decision tree, random forest, k-nearest neighbor. There are many algorithms proposed for the detection of PAF. The techniques developed either rely on ECG signal fiducial points such as RR variability or examine P-waves duration [11, 12]. Also examine P-wave spectral changes as in [13]. However, the P-wave has a low amplitude due to noise corruption. Hence, detecting the P-wave point is considered a very difficult task. Other techniques do not require locating the P-wave, but are based on identifying RR intervals such as [14, 15]. They developed a detector for AF based on the RR interval difference. The authors of [16] proposed AF detection technique. It was relied on statistical calculations that compute randomness, complexity and variability obtained from the difference in heartbeat interval peaks. In [17] they developed a feature extraction technique that combines Heart Rate Variability (HRV) frequency domain, time domain measurements that detects ventricular and atrial ectopic beats features on data segments.
In [18] they were interested in identifying R-peak positions and QRS boundaries. This was accomplished by investigating certain time windows for a reference point to estimate time points for each onset and offset for each wave. Moreover, in [19], they focused on the RR interval which considered the main feature for defining irregular heart rhythm. They used time-domain feature extraction methods. They obtain the ratio to the preceding value of each R peak and its difference from the mean value to describe the ECG waveform. A group of features in both frequency time and time domains were computed in [20]. They studied the inaccuracies that can occur in the estimates of time domain fiducial point with the spectral domain features. The authors of [21] examined the statistical analysis of the features calculated for the cardiac arrhythmia classification, such as the standard deviation of R-peak intervals, the difference of successive root mean square intervals. Their method achieved overall accuracy of 93.75%.
There are also many researchers used the ELM technique for ECG classification. In [22], they used ELM to automatically select the best set of features from the whole features space to be passed to the classifier. They achieved classification accuracies of 89.78% and 89.74. The authors of [23] investigate the choice of sigmoid, sin and hardlim activation functions in the ELM algorithm to demonstrate which one can achieve high prediction accuracy. An ELM tree model was generated in [24] as application to enhance data transmission for ECG signals to their system. In [25], the authors exploit an evolutionary algorithm to select the hidden biases and input weight for the ELM before training it. Their approach has classified binary medical dataset such as breast cancer and diabetes. The authors of [26] introduced a diagnostic model of coronary artery disease, they used a particle swarm optimization algorithm to optimize the ELM. In addition, they used feature selection algorithm to find a more distinctive subset of features. Their dataset contains features such as demographic, symptom and examination of patients.
The gap in existing works that motivated us to adopt this research that the literature developed for PAF prediction has been performed in asynchronous environments and non-streaming mode. They were not evaluated for scalability as mentioned in [17, 27]. Furthermore, the existing models for PAF prediction have not been developed for online processing. Moreover, they have restrictions in terms of computational complexity and execution time [28]. The online classification of data streams poses some challenges, including learning of new concepts and developing algorithms operating in time sensitive and computationally constrained environments [29]. Some works such as [25, 26] did not apply their techniques on time series data. In our paper, we used the ELM in the streaming environment unlike previous research. In addition, we developed a new method of representing feature space with sparse vector. The output vector is integrated with the time domain feature method. Our new method of features representation that passed their output features to the ELM confirms its effectiveness in the classification method compared to traditional methods in the literature.
Materials and methods
Description of ECG signal
ECG is defined as a periodic signal reflecting the heart activity. The ECG records the magnitude and direction of electrical activity of the heart, which is produced by depolarization and polarization of the ventricles and atria. ECG investigation was exploited for diagnosis and treatment of number of cardiac diseases. An ECG signal is composed of intervals, waves, and segments. They are measured in terms of duration and size. Deviations in the expected norm for the components mentioned above indicate various cardiac disorders such as arrhythmia [30].
The major peaks of ECG signals are labeled alphabetically P, Q, R, S and T as presented in Fig. 1. Each of these peaks represents a specific function of the heart cycle. The most notable part of the ECG is QRS complex because of its high amplitude compared to the P and T waves. Most of the important characteristics of the ECG are generated at intervals and amplitudes. These characteristics are known as ECG features [31]. The major importance is to develop quick and accurate techniques for automatic feature extraction for the ECG. The purpose of feature extraction is to detect possible ECG characteristics that would allow efficient and successful prognosis.
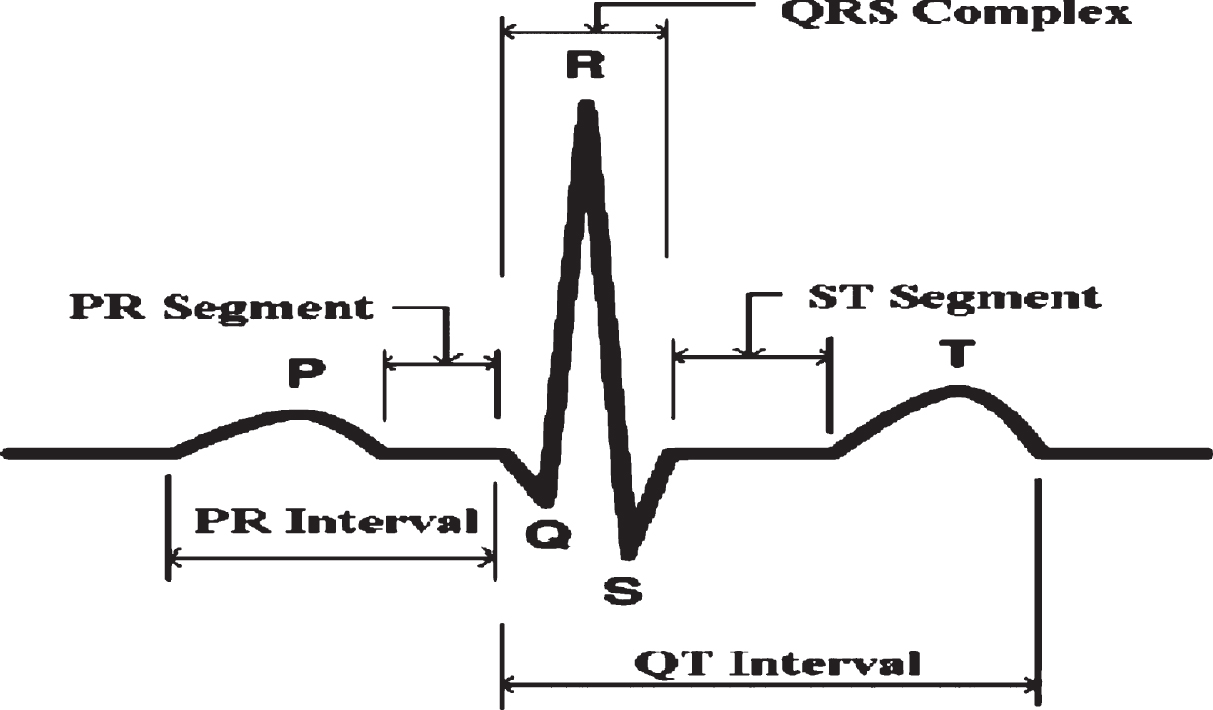
Single cardiac cycle.
Our approach for PAF prediction is evaluated on a real ECG database created for PAF prediction challenge [32]. The database is available in open access on the Physionet website [33]. Recordings from the ECG dataset were sampled at 128 Hz. The ECG dataset consists of 100 subjects. All of them are a 30-minute ECG recording. These ECG recordings subjects are divided into two groups as presented in Fig. 2. The first group includes 50 normal subjects. The second group includes 50 PAF subjects. The second group is divided into two parts. The first part includes 25 subjects away from PAF event (the PAF event did not occur for 45-minute before the starting of the 30-minute record or after its end) is represented as (PAF_Distant). The other part has 25 subjects containing the ECG immediately preceding a PAF event (represented as PAF).
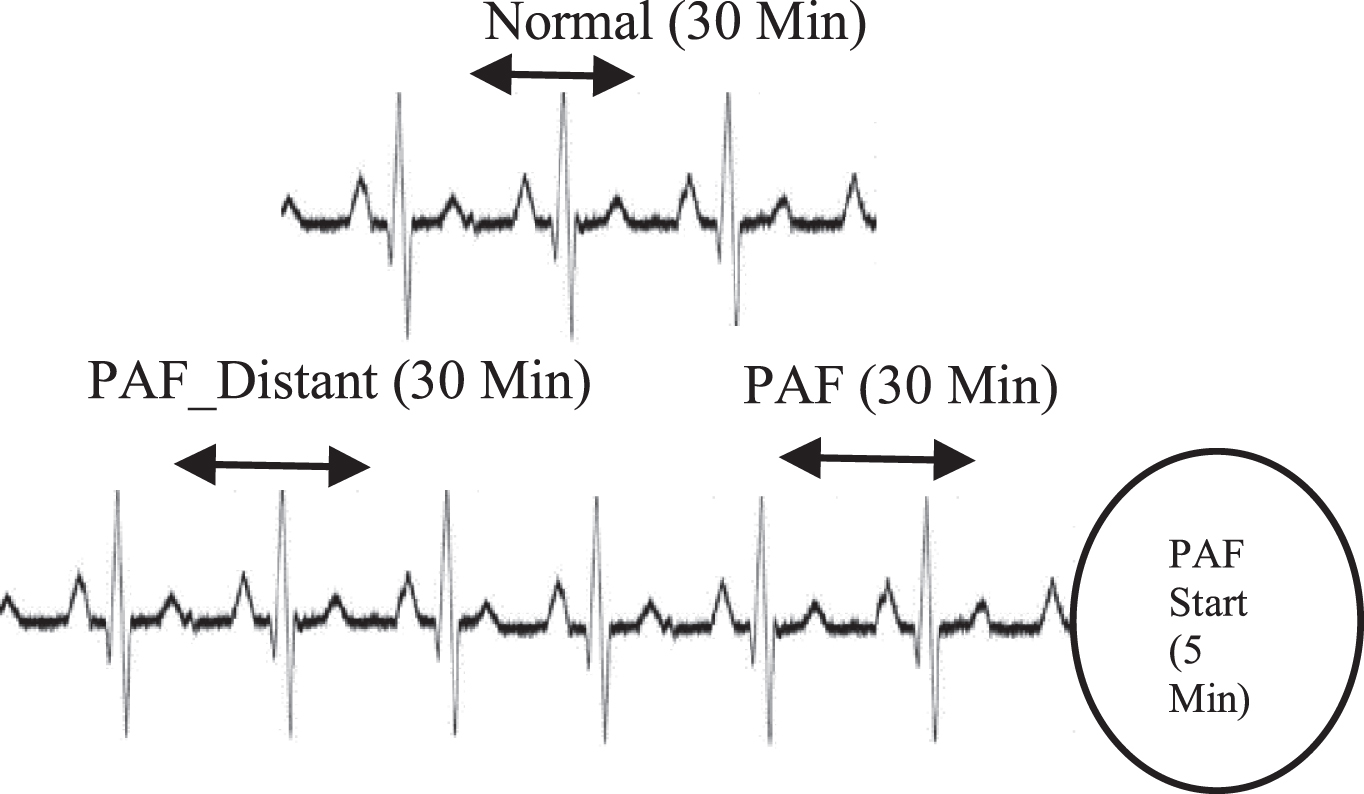
Different groups of ECG subjects used in our evaluation.
ECG data analysis is considered the most important task to guarantee a successive prediction of PAF event. In the ECG analysis, ECG subjects are divided into group of segments. For each of the ECG data segment, an analysis and classification are applied as presented in Fig. 3.
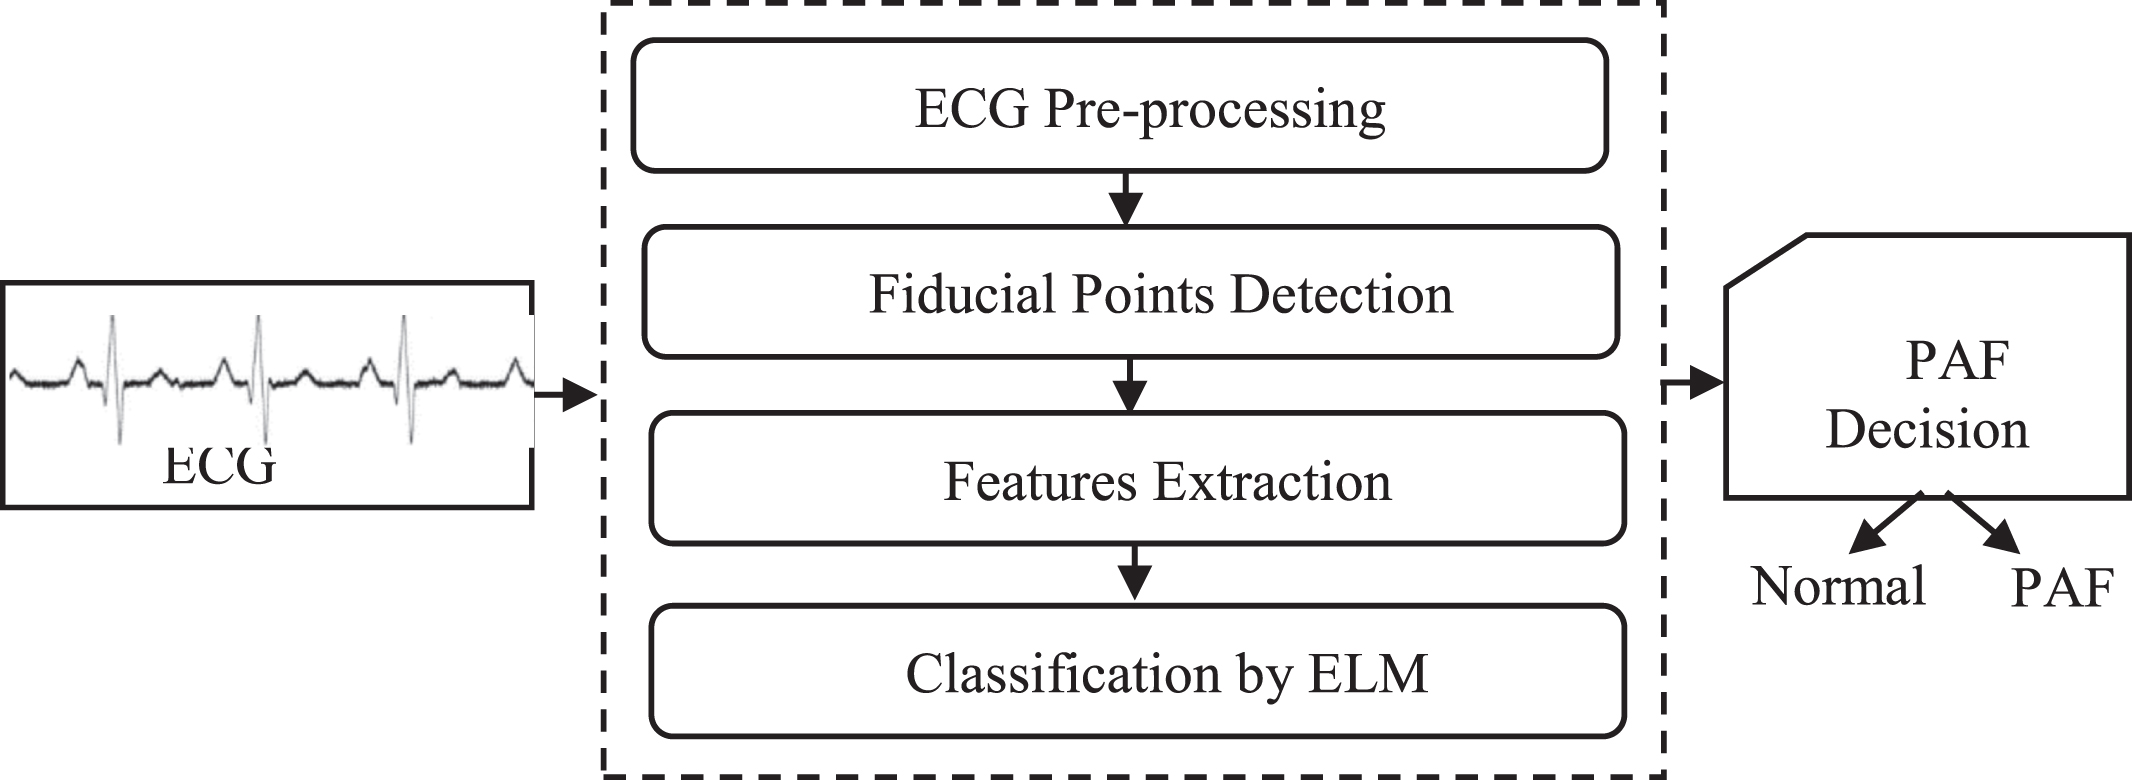
Our paroxysmal atrial fibrillation prediction approach for ECG subjects.
Initially, the ECG segment must be smoothed through band pass filter as pre-processing step. This filter removes undesirable frequency noise components originated by the functioning of other organs. Since the existence of noise makes it more difficult to achieve reliable detection of the fiducial points. Base-line wandering can mask some important features of the ECG, caused by changing electrode-skin impedance, breathing and patients’ movements.
In the ECG pre-processing process, three steps are taken to remove the undesirable noise [34]:
We presented the ECG signal as ECG = Nsamples → R peaks which it was sampled uniformly over time and pre-processed to accurately locate the R-peaks. We segment the signal into a set of groups g and then extract index of R-peaks in g. Also, we get neighbor of extracted R to get every 2 R in g to exploit them in statistical analysis in our feature extraction method.
Fiducial points detection
After the pre-processing step, each segment is represented by a group of features. The main goal related to the feature extraction in the proposed approach is to avoid complex features that have a high computational cost. As our goal is to design a fast PAF prediction approach. Therefore, we focus in locating the QRS complex and ECG wave boundaries in each ECG segment using the Pan-Tompkins algorithm [35]. The Pan and Tompkins algorithm was selected due to its relatively simple filters, decision methods and non-linear transformations. However, it is sufficiently accurate and has enough sensibility values [36]. As shown in Fig. 4, it relied on the emphasis put on the slopes of R wave by applying a derivative function. Then, apply a quadratic function to the signal generated by the derivative function to enhance the high frequency QRS characteristics and detect R peaks within each ECG segment [35].
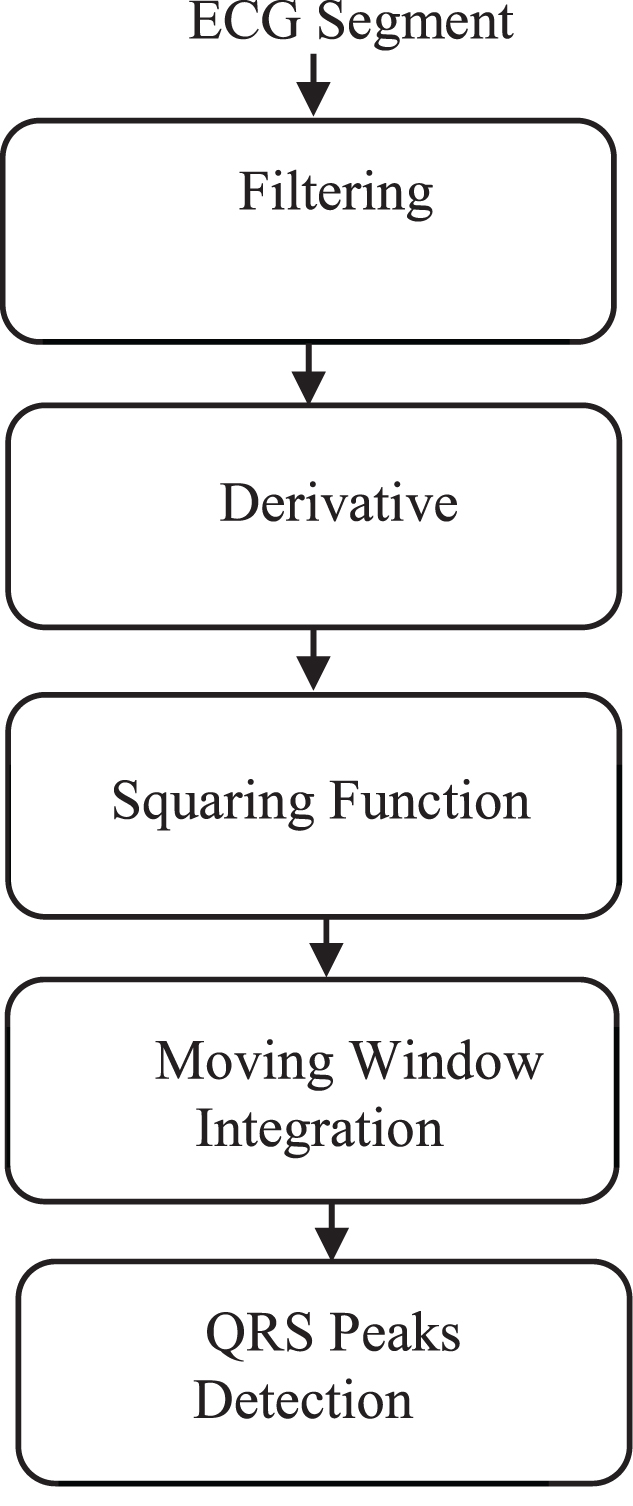
Description of ECG pre-processing steps.
After filtering step applied on raw ECG signals in previous ECG preprocessing section, derivative step is applied to the filtered signal to highlight the QRS complex and decrease the influence of P and T waves in comparison to the R wave by cutting the ECG signal horizontally. The derivative step gets information about the QRS slope and provides it to squaring step.
In the squaring step, the output signal from the derivative step is squared and amplified to emphasize the high frequencies in the QRS complex. This step decreases the possibility of recognizing a T-wave as an R-peak incorrectly. It uses the information of slope to restrict false positives that can be caused by T waves. Equation 1 shows the squaring step that makes all points through signal are positive.
Then, a moving window integration is applied to obtain information about the QRS complex duration.
In general, the width of window should be almost the same as the widest possible QRS to avoid merging the QRS and T complexes together or producing several peaks in the output signal by mistake. Equation 2 describes the moving window integration step
A PAF event begins at an atrial fibrillation “AFIB”. This can cause ventricular depolarization timing changes that can lead to an irregular interval of RR over QRS complex in segments. Therefore, after detecting the R-peaks, they are used in the feature extraction process to find the segment’s features. We depend on the time-domain features method as it is the simplest method to calculate RR measurements and achieve a low computation cost [37] which will be beneficial when applying our approach in streaming mode. Furthermore, we have developed a new feature representation method that also depends on the R peaks values over the QRS complex. It uses sparse vector to describe R positions in each segment. The feature vector is a combination of the features extracted from the two methods.
3.2.3.1. Time-domain features. The peaks values can describe the ECG features. They indicate the heart’s electrical activity and are used for further investigations. Examples of ECG features are QRS complex duration (the interval between current and previous beat of the peaks of the QRS) and RR interval is known as the period among two sequential R peaks over beats in each segment. These features are defined as time-domain features. They are calculated as follows; assuming ΔRR is a difference between successive RR intervals and let N be number of RR intervals: Mean of ΔRR:
Standard deviation of ΔRR:
Root Mean Square of differences between successive ΔRR:
Standard deviation of differences between successive ΔRR:
Number of differences between successive ΔRR>50ms:
Number of differences between successive ΔRR>20ms:
Minimum of differences between successive ΔRR:
Maximum of differences between successive ΔRR:
3.2.3.2. Feature representation method. We developed a new representation method for R features. The main idea of our method is to construct sparse vector that represents R positions for each segment. A key property of sparse representations is to store the transitions between different sparse representations of R positions. Therefore, segments with similar RR variability will mostly match a portion of pattern of the sparse representation. A “Sparse” means 50% or more of data are zero data elements [38]. Large number of zero elements leads to easy storing of data and reduces the computational time. There are three phases required to be applied on each segment as shown in Fig. 5 to construct the new representation of R peaks.
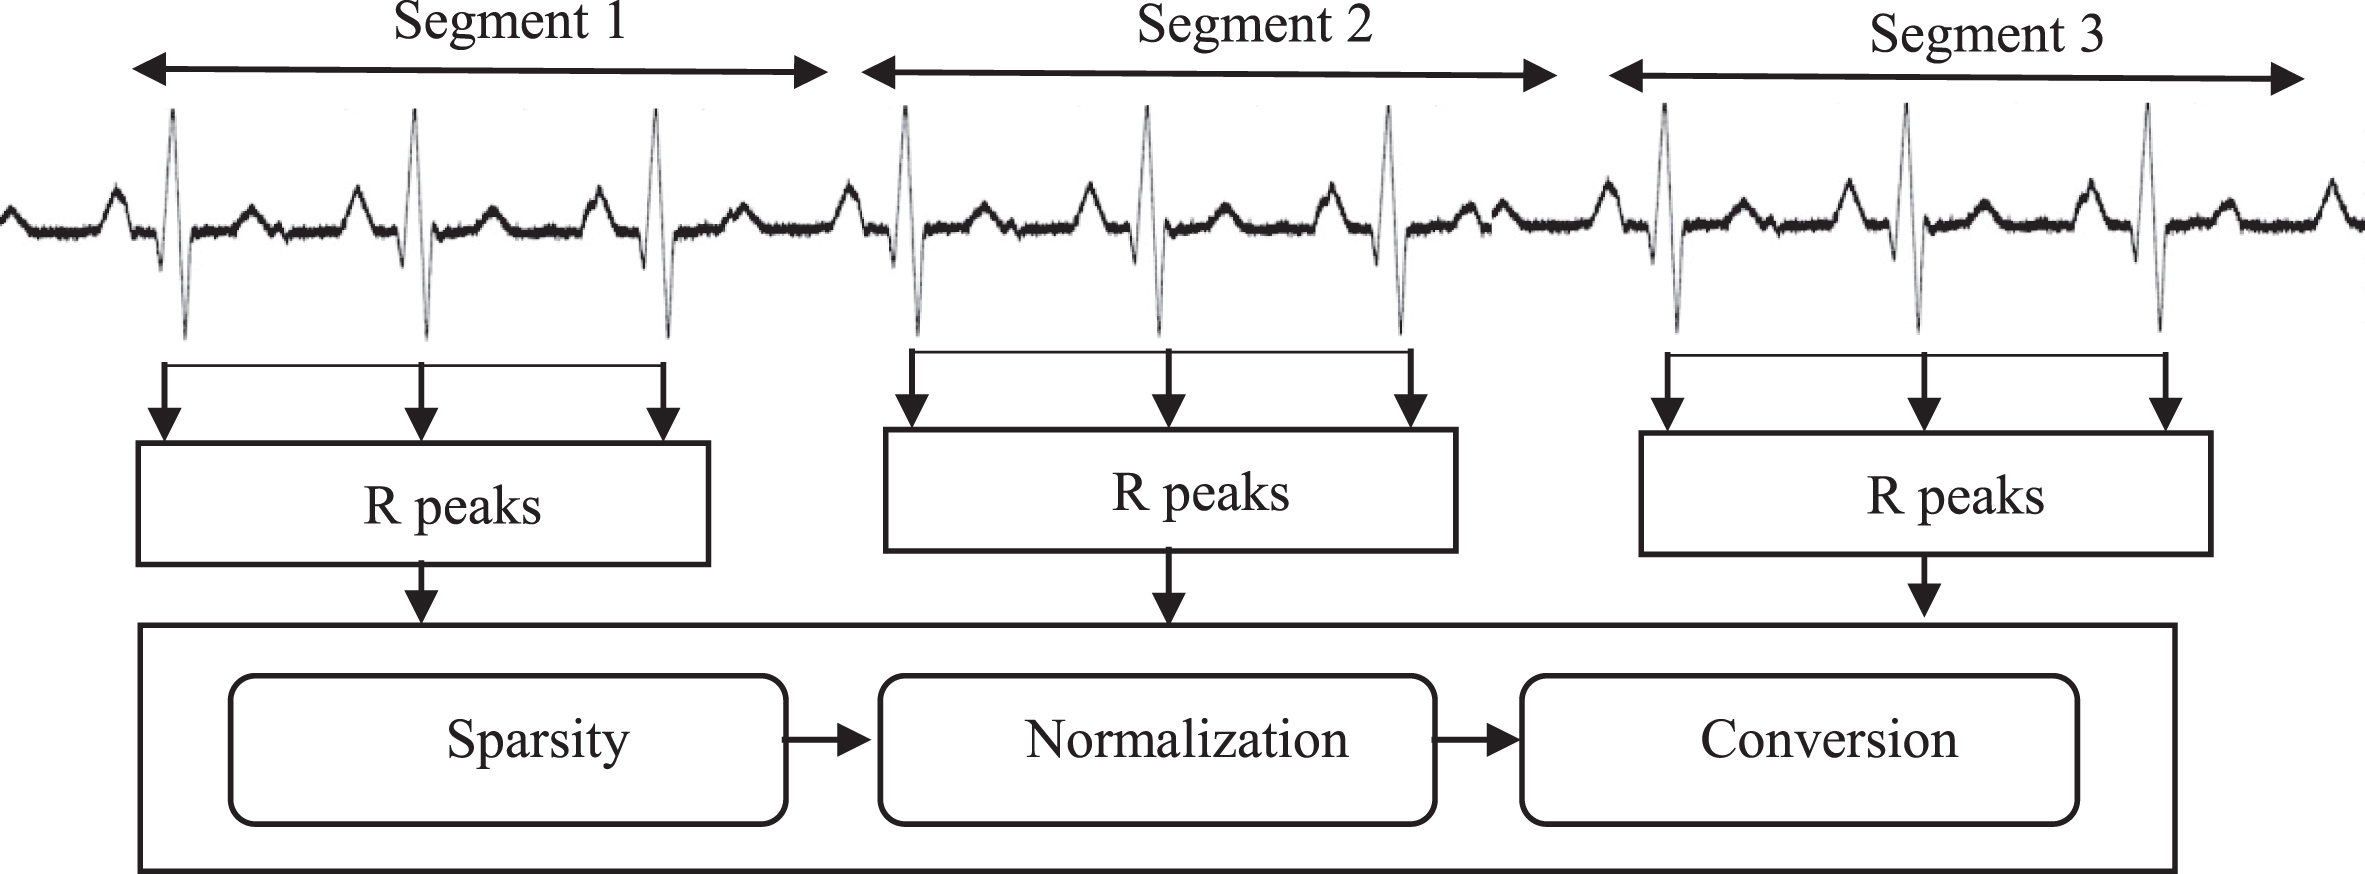
Phases for new representations of R Peaks.
The first step in our proposed method is Sparsity phase. The goal of this phase is to determine the size of sparse vector based on R peaks numbers (NR) in each segment. Positions of ones in the sparse vector can be determined by normalizing each R value in the segment. We set the sparse percentage by 20% as inspired by [39] work in presenting sparse vector.
The second phase is Normalization. The main goal of this step is to normalize each R value to new value that located in specific range of vector [x, y]. Given each ECG subject was divided into group of segments. Given each segment (S) has number of R peaks (R = [r1, r2, ... , rNR]). First normalize each r value to [0, 1] via Equations 12 and 13
Then scale to [x, y] range where x and y are vector boundaries via Equation 14 and Equation 15
The third phase is Conversion; the aim of this phase is to determine the positions of ones in the sparse vector. It ensures that positions of R values in sparse vector are ones and zeros elsewhere. A new input leads to a sparse set of R positions in each segment. Different input patterns cause different sparse representation for R peaks.
Let V be a sparse vector that has all elements zeros except elements of i that their positions belong to the output of normalized values of R positions. The final output of V would be set of zeros except ones that their positions present the normalized values of R peaks as shown in Equation 16.
The characteristics of these sparse vector representations allow such a method to have highly overlap between similar ECGs subjects which has a benefit in the classification performance. The generated features for each ECG segment are provided to ELM classifier to generate output decision, namely whether near PAF event is existing or not.
The ELM is developed without tuning in iteration, no intervention from users is needed. So, the ELM learning speed is fast compared to other existing methods. The ELM makes up for the defects of gradient-based learning by analytically computing the optimal weights of Single-Hidden Layer Feed Forward Neural Network (SLFN). The ELM is defined as a single step training task with batch processing [40].
The structure of the ELM [41] is presented in Fig. 6. It is a generalized SLFN model [42]. All hidden nodes in the ELM learning are randomly generated to be adjusted in feed-forward neural networks unlike traditional principles in neural networks. Parameters of hidden node are not dependent on training data or target functions. The ELM generates hidden node parameters randomly and hidden layers before seeing training data [41].
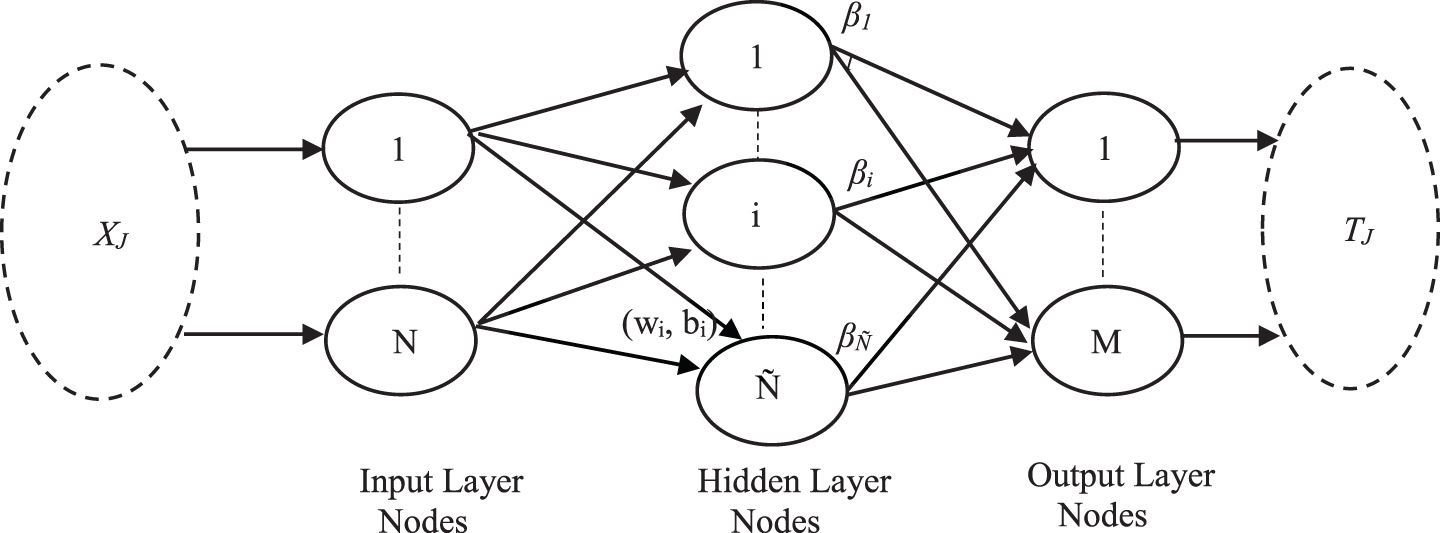
Extreme Learning Machine structure [41].
Given the input of ELM is N training set with randomly different samples (xi, ti) ∈ RN×RM)i=1,.., N), the activation function f(x) and the hidden node number
Equation 17 can be represented as a matrix form as in Equation 18
H is the resultant matrix of hidden node. To decrease output error ∥O - T∥, the learning parameters of hidden nodes wi and bi are assigned randomly without taking into consideration the input data. Then, Equation 18 can be transformed into linear solving by finding a least square solution as in Equation 19
After applying ELM on the features obtained from the feature extraction process, we can evaluate our prediction approach on ECG segments to classify them either normal or have near PAF events.
The experiments were conducted on the Windows7 machine, Intel Core 7, 6 GB main memory, and 1TB hard disk. The proposed prediction approach is implemented using MATLAB 2018 software. We evaluated our approach with non-streaming and streaming modes.
In the non-streaming mode, each 30-min subject was divided into 5-minute segments based on the short-term HRV analysis standards recommended by the Task Force group [45]. The proposed feature extraction and classification methods were applied to each segment in the training and testing datasets.
The streaming mode of our approach is shown in Fig. 7. Tn in Fig. 7 is a timer that Apache Spark Streaming platform was triggered to fetch new rows from the queue of message ranging from one to five second intervals from ECG buffer. Apache Spark was used on a Windows7 machine as a master node. RabbitMQ software was installed in a virtual machine running Ubuntu 16.04 LTS operating system using Vmware Workstation. The RabbitMQ is a popular message queue service [46]. An assistant program in Java is programmed to manage the flow of streaming data into the queue of messages to assess several data flows from the virtual machine to the master node.
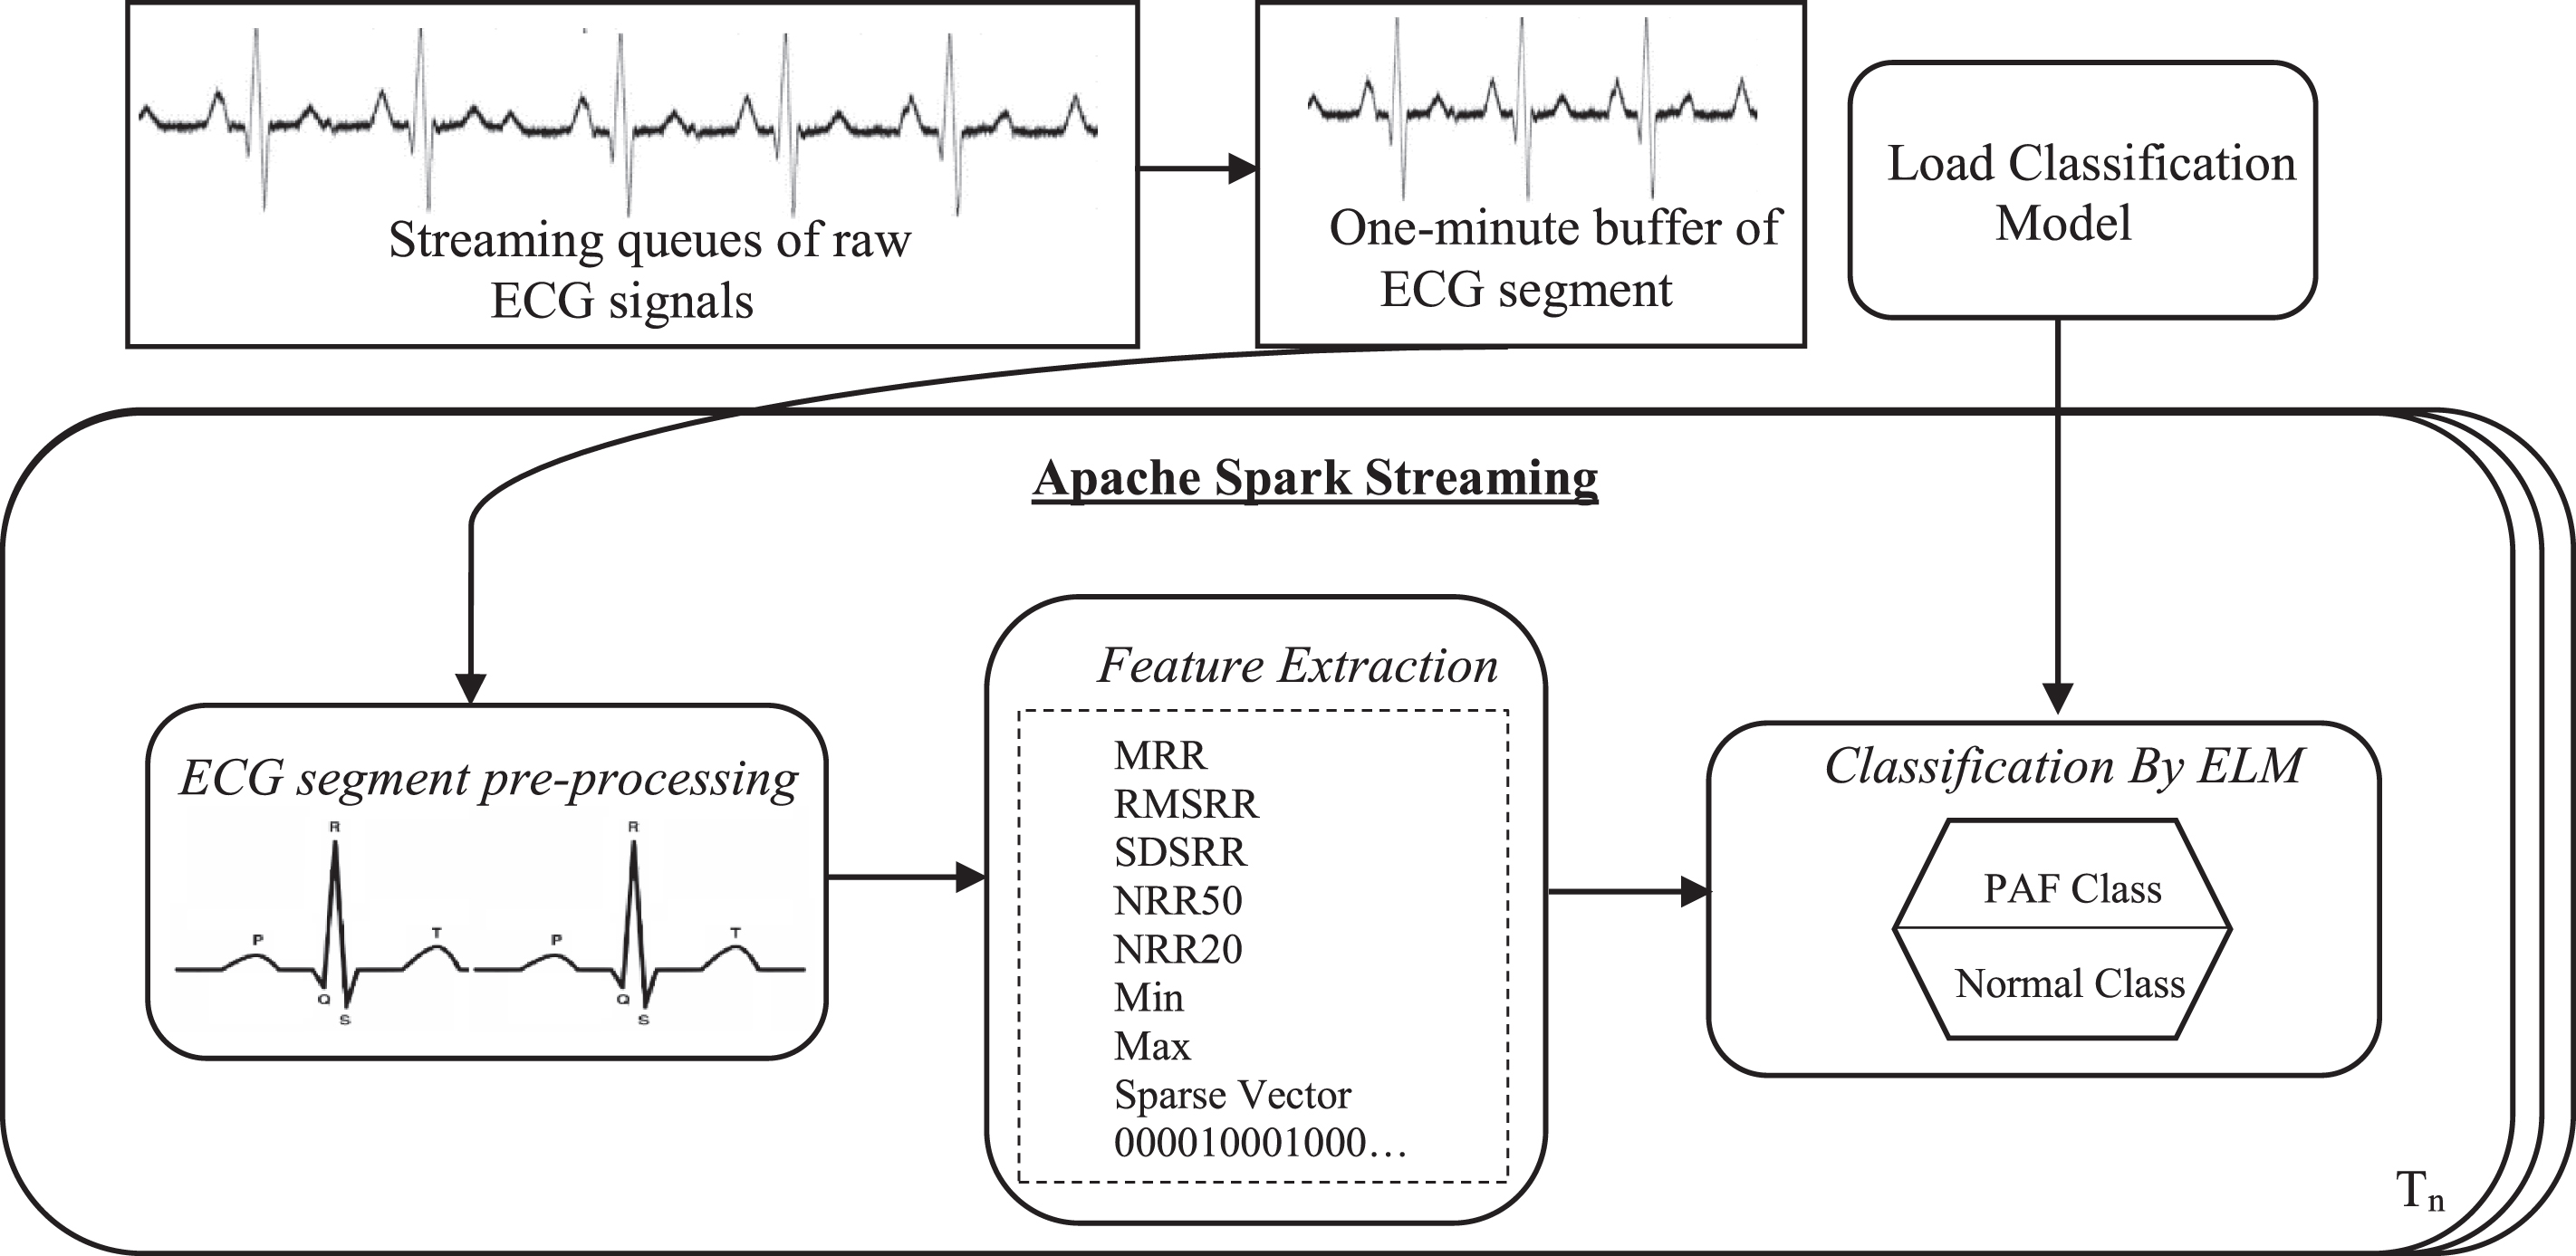
The proposed approach in streaming mode.
The proposed approach for PAF prediction was evaluated by calculating a confusion matrix as in Table 1. Accuracy, Sensitivity and Specificity are computed to measure how the proposed approach can performance classify ECG segments successfully. The main metr ics used to track the are presented in Table 2, where:
Definition of confusion matrix and parameters used in performance evaluation
Definition of confusion matrix and parameters used in performance evaluation
The main performance metrics
True positive (TP): count of subjects who has near PAF event and were correctly identified. False positive (FP): count of subjects who has no near PAF but diagnosed as near PAF. True negative (TN): count of subjects who has no near PAF and diagnosed with absence of PAF as well. False negative (FN): count of subjects who has near PAF but diagnosed as no near PAF.
K-fold cross-validation method was applied to evaluate the performance of our classifier. The metrics calculations were repeated k times and averaged. The dataset was divided into train and test groups. The data was segmented into k groups. For testing, one of the k groups was used for training, the other k –1 groups were used. We set k = 5 for evaluating our classifier.
Initially, we proved the validity of our proposed approach using non-streaming mode. It was compared with [37, 51]. These approaches used the heart rate variability (HRV) analysis. They used the same dataset [32] and divided each dataset into 5-minute segments to apply the short-term HRV analysis. They calculated frequency-domain and time-domain measurements for features in each HRV segment. Time Local Subset Feature Selection Algorithm in [48] and Genetic Algorithm in [37, 47] were used to select different combinations of the HRV features. Each approach used a different classification technique; [37] applied k-nearest neighbors, [48] applied Mixture of Expert (ME) and [47, 50] applied Support Vector Machine (SVM) for classification. In [51], they used morphologic variability of QRS complexes for ECG analysis.
Table 3 shows the details of computed confusion matrix for each fold. Table 4 presents the performance evaluation comparison against existing approaches. Our proposed approach achieves higher sensitivity of 8% and specificity of almost 6% and overall accuracy of almost 7% from the compared approach in [37] which applied k-nearest neighbors’ technique for classification. Our proposed approach also has higher sensitivity of almost 13%, 4%, 4% and specificity of almost 6%, 1%, 23% and overall accuracy of almost 10%, 3%, 13% compared to the other compared approaches in [47, 50] respectively, which applied SVM technique for classification. Our proposed approach achieves higher sensitivity of 11% and specificity of almost 5% and overall accuracy of almost 8% from the compared approach in [51] which applied morphologic variability of QRS complexes for ECG analysis. As well, our approach achieves the same results of sensitivity and close specificity and accuracy results with [48] which applied their ME technique for classification.
Detailed results of our proposed approach for each K-fold
Detailed results of our proposed approach for each K-fold
Classification performance of our approach in comparison with other approaches
The optimization process in previous research takes a long time, as multiple evaluation processes are performed by feature selection algorithms.
Also, most of the previous approaches were performed in non-streaming environments. The existing models for PAF prediction have not been developed for streaming processing; moreover, they have limitations in terms of processing and learning time.
After evaluating our approach in non-streaming mode, it was applied in streaming mode. Each dataset was segmented into 1-minute segment. The input to our system was a stream of ECG signals acquired at predefined intervals; these intervals were acquired from each one second to every five seconds, and then they were transmitted via a RabbitMQ to the Apache Spark Streaming platform. The fetched intervals were used for feature extraction method and classification using ELM. We compared the proposed approach in streaming mode with the PhysOnline framework [28], which was the first study to propose an online classification approach for predicting PAF [28]. They built their approach on Apache Spark platform. In addition, they proposed a real-time online feature extraction using the Probabilistic Symbolic Pattern.
Recognition (PSPR) with random forest (RF) algorithm for classification. The PSPR method is based on a symbolic pattern recognition to discretize waveforms using alphabet symbols. We deployed the PhysOnline in our spark streaming environment, guided by their work [28].
To assess our approach evaluation time, several trials were performed to compare the proposed approach with PhysOnline [28]. Each trial was a new set of randomly selected training and testing signals. The results obtained from the test set trials were averaged. We inserted timers into the implementation to measure the time needed to finish the feature extraction and classification tasks. Table 5 reports the evaluation time.
Evaluation time for our proposed approach and the PhysOnline [28]
As shown in Table 5, our approach significantly reduces the time to compute the feature extraction method. PhysOnline consumes more time in applying PSPR to discretize the ECG waveforms using symbols from an alphabet. They also depend on the calculation Euclidean distances to measure matching to a stored reference database. For our approach, training and testing times are improved by using ELM because it is implemented without any intervention of users is required. So, the ELM learning speed is fast compared to other existing algorithms. In addition to, the ELM randomly assigned the learning parameters and input weights of the hidden nodes [40]. Thus, the training process completed without time-consuming.
The number of hidden neurons is an adjustable parameter that affects the classification performance of ELM [52]. The decrease in the number of hidden nodes less than in non-streaming mode demonstrates that our approach could reduce the computational complexity to be suitable for streaming environment. The final performance evaluation of the PhysOnline [28] is reported in Table 6 and Fig. 8.
Our performance in classification accuracy against the PhysOnline [28]
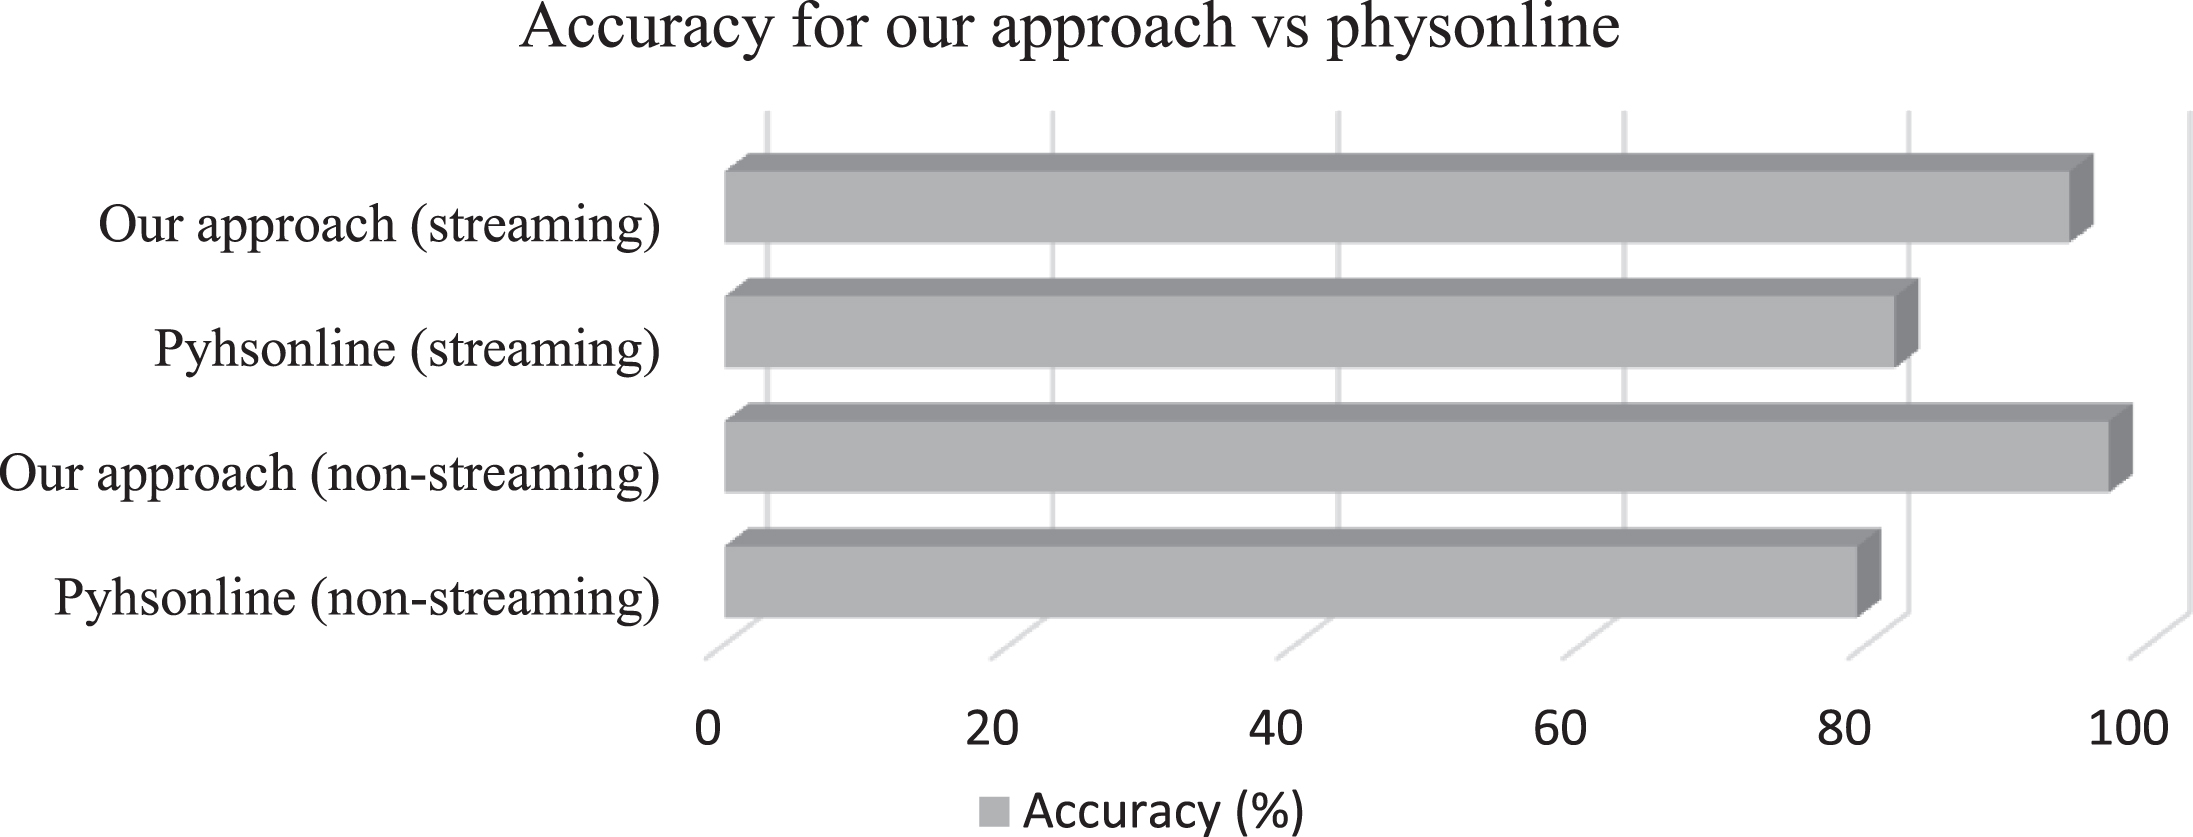
Accuracy for our proposed approach against the PhysOnline approach.
Our approach achieves higher recall for no near PAF subjects of almost 17% and overall accuracy of almost 12 % against the PhysOnline [28]. The results demonstrate that applying ELM technique improves the classification accuracy compared to the random forest classification technique in the PhysOnline [28]. Figure 8 shows the final comparison between our approach and the PhysOnline in the two different modes. The results demonstrate that the proposed approach provides better performance of classification than similar approaches in the literature as our approach combines time-domain features with a new feature representation method that improves the performance of the ELM classification technique. Therefore, we propose a better classification to predict near PAF events within input the ECG signals.
Predicting PAF cardiac disorders within ECG data is an important task in triggering alerts to cardiologists. In this study, we propose an efficient prediction approach for PAF events in terms of fast execution time and classification accuracy. A feature extraction method based on sparse vectors construction for R features in ECG signals with the integration of its time-domain features is presented. Our feature extraction method improves the ELM classification performance for input ECG signals. The evaluation was conducted on streaming ECG signals processing. We assess the validity of our proposed approach by comparing results using non-streaming implementation. The results obtained confirm a better classification performance of the proposed approach on PAF events compared to the existing studies. In the future, we will seek to extend and apply the proposed approach to other different datasets to diagnose different heart diseases.
Footnotes
Acknowledgments
The authors would like to thank Prof. Mohammed J. Zaki –Rensselaer Polytechnic Institute, New York, USA, for his valuable suggestions, comments and guidance.