



Abstract
Wireless Sensor Networks (WSNs) are consistently gathering environmental weather data from sensor nodes on a random basis. The wireless sensor node sends the data via the base station to the cloud server, which frequently consumes immoderate power consumption during transmission. In distribution mode, WSN typically produces imprecise measurable or missing data and redundant data that influence the whole network of WSN. To overcome this complexity, an effective data prediction model was developed for decentralized photovoltaic plants using hybrid Harris Hawk Optimization with Random Forest algorithm (HHO-RF) primarily based on the ensemble learning approach. This work is proposed to predict the precise data and minimization of error in WSN Node. An efficient model for data reduction is proposed based on the Principal Component Analysis (PCA) for processing data from the sensor network. The datasets were gathered from the Tamil Nadu photovoltaic power plant, India. A low cost portable wireless sensor node was developed for collecting PV plant weather data using Internet of Things (IoT). The experimental outcomes of the proposed hybrid HHO-RF approach were compared with the other four algorithms, namely: Linear Regression (LR), Support Vector Machine (SVM), Random Forest (RF) and Long Short Term Memory (LSTM) algorithm. Results show that the determination coefficient (R2), Mean Square Error (MSE), Root Mean Square Error (RMSE) and Mean Absolute Error (MAE) values of the HHO-RF model are 0.9987, 0.0693, 0.2336 and 0.15881, respectively. For the prediction of air temperature, the RMSE of the proposed model is 3.82 %, 3.84% and 6.92% model in the lowest, average and highest weather days. The experimental outcomes of the proposed hybrid HHO-RF model have better performance compared to the existing algorithms.
Keywords
Introduction
Internet of Things (IoT) and Wireless Sensor Network (WSN) is the predominant role in environmental weather monitoring and data acquisition system for the Photovoltaic Plant (PV) application. An exhibition PV real-time weather monitoring system is of growing importance to evaluate all significant parameters such as irradiance, surface temperature, and ambient temperature. The prediction of accurate weather is an essential function for a PV plant. The IoT was developed rapidly, in which wireless sensor networks are becoming famous and mainly used in a remote location to acquire information from the exterior environment and send data consistently to the cloud server. The sensor node comprises a microcontroller, communication transceiver, sensing unit, memory and constrained battery capacity. The sensor network will be utilized in numerous applications such as target tracking, event detection and solar plant weather forecasting [1]. For all applications, the environment weather data monitoring is an essential scenario for the sensor node collecting comparable data regularly from a particular region.
Consequently, information gathering is periodical; the overlapping of data sent to the sink node causes decreases the battery energy, diminishing the system lifetime and increasing the networks data traffic. Sometimes the WSN node transmits inaccurate data, noisy information and missing data that influence the entire network of WSN [2]. To overcomes this problem, a high quality data prediction model is proposed to limit data transmission unnecessarily.
Each WSN node transmits the determined values to the end node until the source nodes estimated error is lesser than the threshold value. There is no essential for further transmission of the WSN node. If the estimated error is above the threshold value, the WSN node has to send the measured data to the cloud. It is an excellent way to enhance data collection and expand the network lifetime in WSN environments [3]. The motivation of the data prediction approach is used to minimize errors and data traffic to the sink. Several literature papers help to predict missing and accurate data [5]. It diminishes the overall power consumption of the network system. Some machine learning algorithms [18] and optimization approaches provide low prediction stability and precise data based on historical datasets. During the prediction process, the different evaluation factors play a dominant role in predicting accurate data. In the WSN node, sensor data is missing or lost compared with actual data; the data preprocessing technique was introduced to extend data quality. Predicting the data with the least RMSE is a method to limit excessive energy utilization without compromising data quality.
The main contribution of this work includes; 1) the experiment was carried out and the dataset was collected from the Tamil Nadu photovoltaic using the Internet of things. The portable weather monitoring sensor node enables sensors to measure and collect PV plant weather data such as surface temperature, solar radiation and ambient temperature. 2) A novel data prediction model was proposed using a hybrid Harris Hawk Optimizer with a Random Forest (HHO-RF) model to maximize data prediction accuracy. In this way, the prediction algorithm enhances the data quality and minimizes prediction errors for WSN Applications.
The rest of this paper is organized as follows: Section 2 discusses the related work. Section 3 briefly explains IoT-WSN architecture and weather data collection in the PV plant. Section 4 presents the suggested hybrid HHO–RF model for data prediction. Section 5 presents results analysis and performance evaluation of the HHO-RF model compared with existing algorithms. Finally, Section 6 presents the conclusion and future direction.
Related work
Hisham Gad et al. (2015) presented data acquisition and transmission systems for photovoltaic plant weather monitoring. An atemga2560 and secure digital card-based data acquisition were proposed to continuously monitor the ambient temperature and recording the data directly in a CSV file with date and time. Still, the primary drawbacks are a massive amount of memory space required for storing the data was presented in this paper [1].
Devaraju and Carlos et al. (2015) proposed the wired and wireless portable weather station monitoring system using PIC16f877. It offers fast and reliable real-time weather station parameters monitored and communicated via wired or wireless Zigbee pro radio module to a local server or upload data in MySQL [2]. Carlos and Jorge Pablo Diaz et al. (2018) constructed the WSN based weather station electronic model for renewable energy systems; it has a robust and less expensive automatic weather station using Raspberry Pi [3]. Pereira et al. (2017) present the new idea of an open-source and minimal effort information procurement and transmission framework using Raspberry Pi. This author invents the PV parameter monitoring system designed using the Message Queue Telemetry Transport Protocol (MQTT) [4].
Hongju Cheng et al. (2019) constructed a multi-node multi-feature using a bi-directional Long Short-Term Memory (LSTM) network. This approach examines the different fundamental factors based on the temporal and spatial correlation between historical and sensory data. The wavelet threshold denoising and quartile approach were introduced to improve the data quality. The suggested model results provide tremendous advantages compared with Elman and NARX and more enormous gains than GRNN in terms of RMSE and R2. This approach offers immoderate prediction accuracy and realistic prediction bias [5].
El-Sayed et al. (2019) presented a distributed data predictive model to enhance the network lifetime and reduce energy consumption for WSN nodes. The suggested model was constructed using a Recursive Least-Squares adaptive filter built-in with a Finite Impulse Response (RLS-FIR) filter. This work has been developed to eliminate noisy value, minimize the amount of transferred data and reduce mean square error [6].
Abdallah Makhoul et al. (2019) introduced a multilayer perceptron to predict energy consumption based on collected environmental data. Some classes of information like humidity, temperature, light energy and days are gathered from a WSN implemented in a two-story building. The proposed multilayer perceptron performance was compared with four ML algorithms, such as LR, SVM, and RF algorithms based on the evaluation parameter determination coefficient (R2), RMSE and MAE [7].
Xiangyun Qing et al. (2018) suggested a novel LSTM prediction model for an hourly based day-ahead solar irradiance using weather forecasting data. This work evaluates and compares the persistence algorithm, least-square linear regression and multilayered feed-forward Back Propagation Neural Network (BPNN) algorithm. This algorithm analyzed the performance metrics of solar irradiance. The suggested LSTM approach prediction accuracy is 18.34% better than the BPNN method in terms of RMSE. But time consumption is high [8].
Jianzhou Wang et al. (2020) utilized an innovative Multi-Objective Harris Hawk Optimization (MOHHO) algorithm with Ensemble Learning Model (ELM) to predict air pollution accuracy. Specifically, an efficient data preprocessing technique was introduced. Comparing the suggested hybrid MOHHO model was a perfect prediction of air pollution primarily based on prediction stability and accuracy [9].
Beeharry et al. (2018) proposed the performance evaluation and implementation of the adaptable weather forecast unit. Different prediction algorithms were experimented with using a multiple linear regression model and K-nearest neighbor classification algorithms. The experimental outcomes of proposed algorithms can predict other weather parameters with better accuracy in statistical error criteria [10]. Essa et al. (2018) introduced an Artificial Neural Network with the Harris Hawk Optimizer (HHO-ANN) for an active model to predict solar productivity. But it requires more time to train the ANN model. The proposed method offers a better predictive model than SVM and ANN [11]. Edwin Premkumar et al. (2019) constructed a new time series trust model for secure data prediction, data construction and data aggregation in a clustered WSN. The performance assessment of statistical error parameters was significantly improved [12].
Renata Pereira et al. (2019) designs and implements the IoT based metrological data monitoring system for the PV plant. In this work, the ambient air temperature, solar radiation and panel temperature are monitored on different weather days. The power generation in the photovoltaic system was analyzed based on weather data [13]. Muhammad W.A et al. (2018) present the prediction for photovoltaic power production with RF and additional tree method. This algorithm is suitable for predicting PV plant metrological data as it reduces bias and displacement by combining different machine learning techniques. This ensemble method improves the stability, computational cost and accuracy of predicted hourly PV output. But the prediction error is based on construction of trees. Different statistical evaluation parameters of RMSE, MAE and R2 were used for performance analysis. This ensemble method has been shown to work slightly better than support vector regression [14].
Alireza et al. (2018) presented the comparative study of forecasting wind and solar and energy resources based on SVM models. In this work, the SVM algorithm performance provides better performance than existing algorithms such as ANN, AR and BP. This SVM model is easy to use, reliable and provides better prediction accuracy results [15]. Stefan Preda et al. (2018) show a short-term solar power prediction using an SVM algorithm based on a statistical evaluation parameter. A sigmoid function normalizes solar irradiation inputs. SVM has a more extraordinary ability to capture nonlinear and time differentiated solar radiation data than an autoregressive algorithm [16].
Edy Tonnizam et al. (2019) constructed the hybrid PSO-ANN method for predicting ripping production in different regions. The proposed model can be applied and ripping production is predicted. The proposed hybrid PSO-ANN method can improve system performance for prediction results [17]. Junho Lee et al. (2020) suggested that an ensemble algorithm based reliable solar irradiance was predicted. This work evaluates and analyzes solar irradiance prediction accuracy results compared with different RF and SVM algorithms based on statistical error criteria. The purpose of the ensemble method is prompted by integrating multiple weak regressors to attain better prediction accuracy. This model indicates the significance of integrating lagged data into the ensemble learning models. Also, they reduce the overall errors in prediction. The results revealed that the ensemble approach gives superior predictive efficiency compare to traditional regressors [18].
Ibrahim Anwar Ibrahim et al. (2017) demonstrated the hybrid Random Forest (RF) and Firefly algorithm (FFA) model for data prediction in the PV plant. In this work, the hourly solar irradiation dataset is used for prediction performance. The proposed FF model is used to refine the RF model by evaluating the better number of trees and leaves in each RF tree. This RF-FFA method is used to find the optimal RF parameters and compare them with data predicted by the Artificial Neural Network (ANN), RF and ANN-FFA. The proposed method demonstrates better performance based on statistical evaluation parameters such as RMSE, MAE, and R2 [19]. Seul Ki et al. (2019) presented the RF based forecast for solar energy production in two steps. The prediction of solar electricity generation is based on actual and predicted weather data models. This work significantly improves the estimation problem of solar energy generation and supports the operation of PV systems [20].
Problem statement and motivation of work
Based on the literature survey, WSN plays a predominant role in photovoltaic applications. In transmit mode, the wireless sensor node intermittently sends the information via the base station to the cloud server. In WSN, sensory data and network size cause severe problems due to limited power, high delay in network transmission and data transmission loss due to network error on the node. The main drawbacks of the WSN node often result in measurable erroneous data and missing data affecting the entire WSN network. To overcome these problems, predicting data helps improve the precise data and minimize prediction error.
The LR, SVM and RF algorithms are used to predict weather data of photovoltaic systems. However, it is doubtful that these models are accurate, especially when handling high-uncertainty data [17, 18]. These algorithms provide low prediction stability and precise data when modeling long-term global weather data and are not recommended when data is missing. Computation time for the prediction process is the major drawback in LSTM [8] and ANN [19]. This work has introduced a useful prediction model using a hybrid HHO-RF due to accurate and reliable weather data prediction. Several new techniques, such as RF techniques, can predict the air temperature, surface temperature and solar radiation more accurately from the PV plant collected dataset.
Additionally, RF has some advantages over other algorithms. In which RF channels can perform both continuous and discrete variables, the RF algorithm does not fit too closely to a predictor. It runs quickly and effectively when handling huge amounts of data. Also, the RF algorithm has only two hyperparameters, such as the number of trees in RF and the leaves per tree. An optimal number of trees and the number of leaves per tree must be found to ensure an accurate prediction of weather data. In general, many of the optimization problems are incredibly non-linear and multimodal under various complex constraints. Thus, the HHO algorithm is typically used to solve continuous multimodal complex optimization problems based on hawk’s social behavior. Therefore, the HHO algorithm can also be used here to support the RF model. The HHO model is used to evaluate optimal RF parameters.
The primary purpose of the work is to evaluate and analyze the prediction accuracy for an improved RF algorithm using HHO. This model is to finds the optimal solution for the RF algorithm. The proposed HHO-RF model has better accuracy in predicting data than other algorithms; RF Algorithm, SVM and LSTM for forecasting weather data. The proposed hybrid HHO-RF method offers better performance and minimizes prediction errors based on statistical error criteria such as MSE, RMSE and MAE.
System architecture
The accurate prediction of weather data (air temperature, irradiance and surface temperature) is essential for analyzing electricity generation efficiency, modeling, sizing, and designing PV systems in the PV plant [20–23]. The proposed research work splits into two major parts. Initially, a low power IoT sensor network was designed and executed to acquire air temperature; PV surface temperature and solar irradiance monitoring make use of DHT 11, pyranometer and PT100. Moreover, to use a specific signal conditioning circuit for measuring PT 100 with calibrated ADC range and resolution. The second part proposes the HHO-RF data prediction model to enhance the WSN data accuracy and minimize prediction errors.
Figure 1 depicts the low power portable internet of the weather monitoring system. In the PV plant, the IoT based sensor node collects enormous amounts of real time weather data via the Internet. The PT100 temperature sensor is connected in the middle of the PV module. It measures real-time PV surface temperature varies from 0 to +90°C. The MCU was once programmed for measuring the air temperature, irradiance and PV temperature from the sensing unit [22]. Each sensor node data can be transmitted into a cloud server. Hence, the solar plant works in parallel, transmitting the real time data from every sensor for 24 hrs/day. The data can be retrieved in Excel format. The web monitor displays real time weather data in numerical data or visualized graph models from sensor nodes using IoT.

PV Weather Monitoring using IoT-WSN.
The proposed sensor node has been developed under the MQTT protocol. It provides authentication mechanisms to identify the appropriate device in the IoT application. The Onetime Password Authentication (OTP) token can help protect the device module from abuse by removing the threat of unauthorized access. With this authentication method, only verified IoT devices could establish communication and data control with the IoT cloud after the device module starts. In this system, the authentication token encryption method provides security for data transmission in real time. With this unique identification, the authorized person can detect all hardware modules, communicate securely between the server and the device and protects it against malicious processes. The proposed IoT and wireless sensor node concept is primarily based on portability, reduction of node cost, modularity and low computation power and will increase the data processing speed. The proposed sensor node was established externally close to the PV module field region [23].
In this work, the solar energy harvesting approach was proposed in the IoT based sensor node. The motivation of the proposed work is used to reduce cable losses. The wireless sensor node is energized through the solar energy harvesting technique for extending the WSN nodes lifespan. The sensor node consists of a 12 V solar panel, DC-DC converter and Li-ion rechargeable battery is 12 V/3000 mAh ratings. The sensor node is powered by a 12 V rechargeable battery connected with a solar panel followed by a DC-DC converter. It is providing sufficient power supply to the WSN node. Table 1 describes the proposed sensor node specification for the PV plant.
PV plant sensor specification
PV plant sensor specification
The experimental work was carried out in a PV plant is depicted in Fig. 2. In the initial phase, three sensor nodes are deployed for testing and deployment. It is used to collect weather data using the internet of things. In this work, the air temperature, irradiance, surface temperature datasets were collected 13 hrs from 6.00 A.M to 7.00 P.M on the lowest weather day, average weather day and the highest weather day in July 2019. The total dataset contains 2340 samples per day.
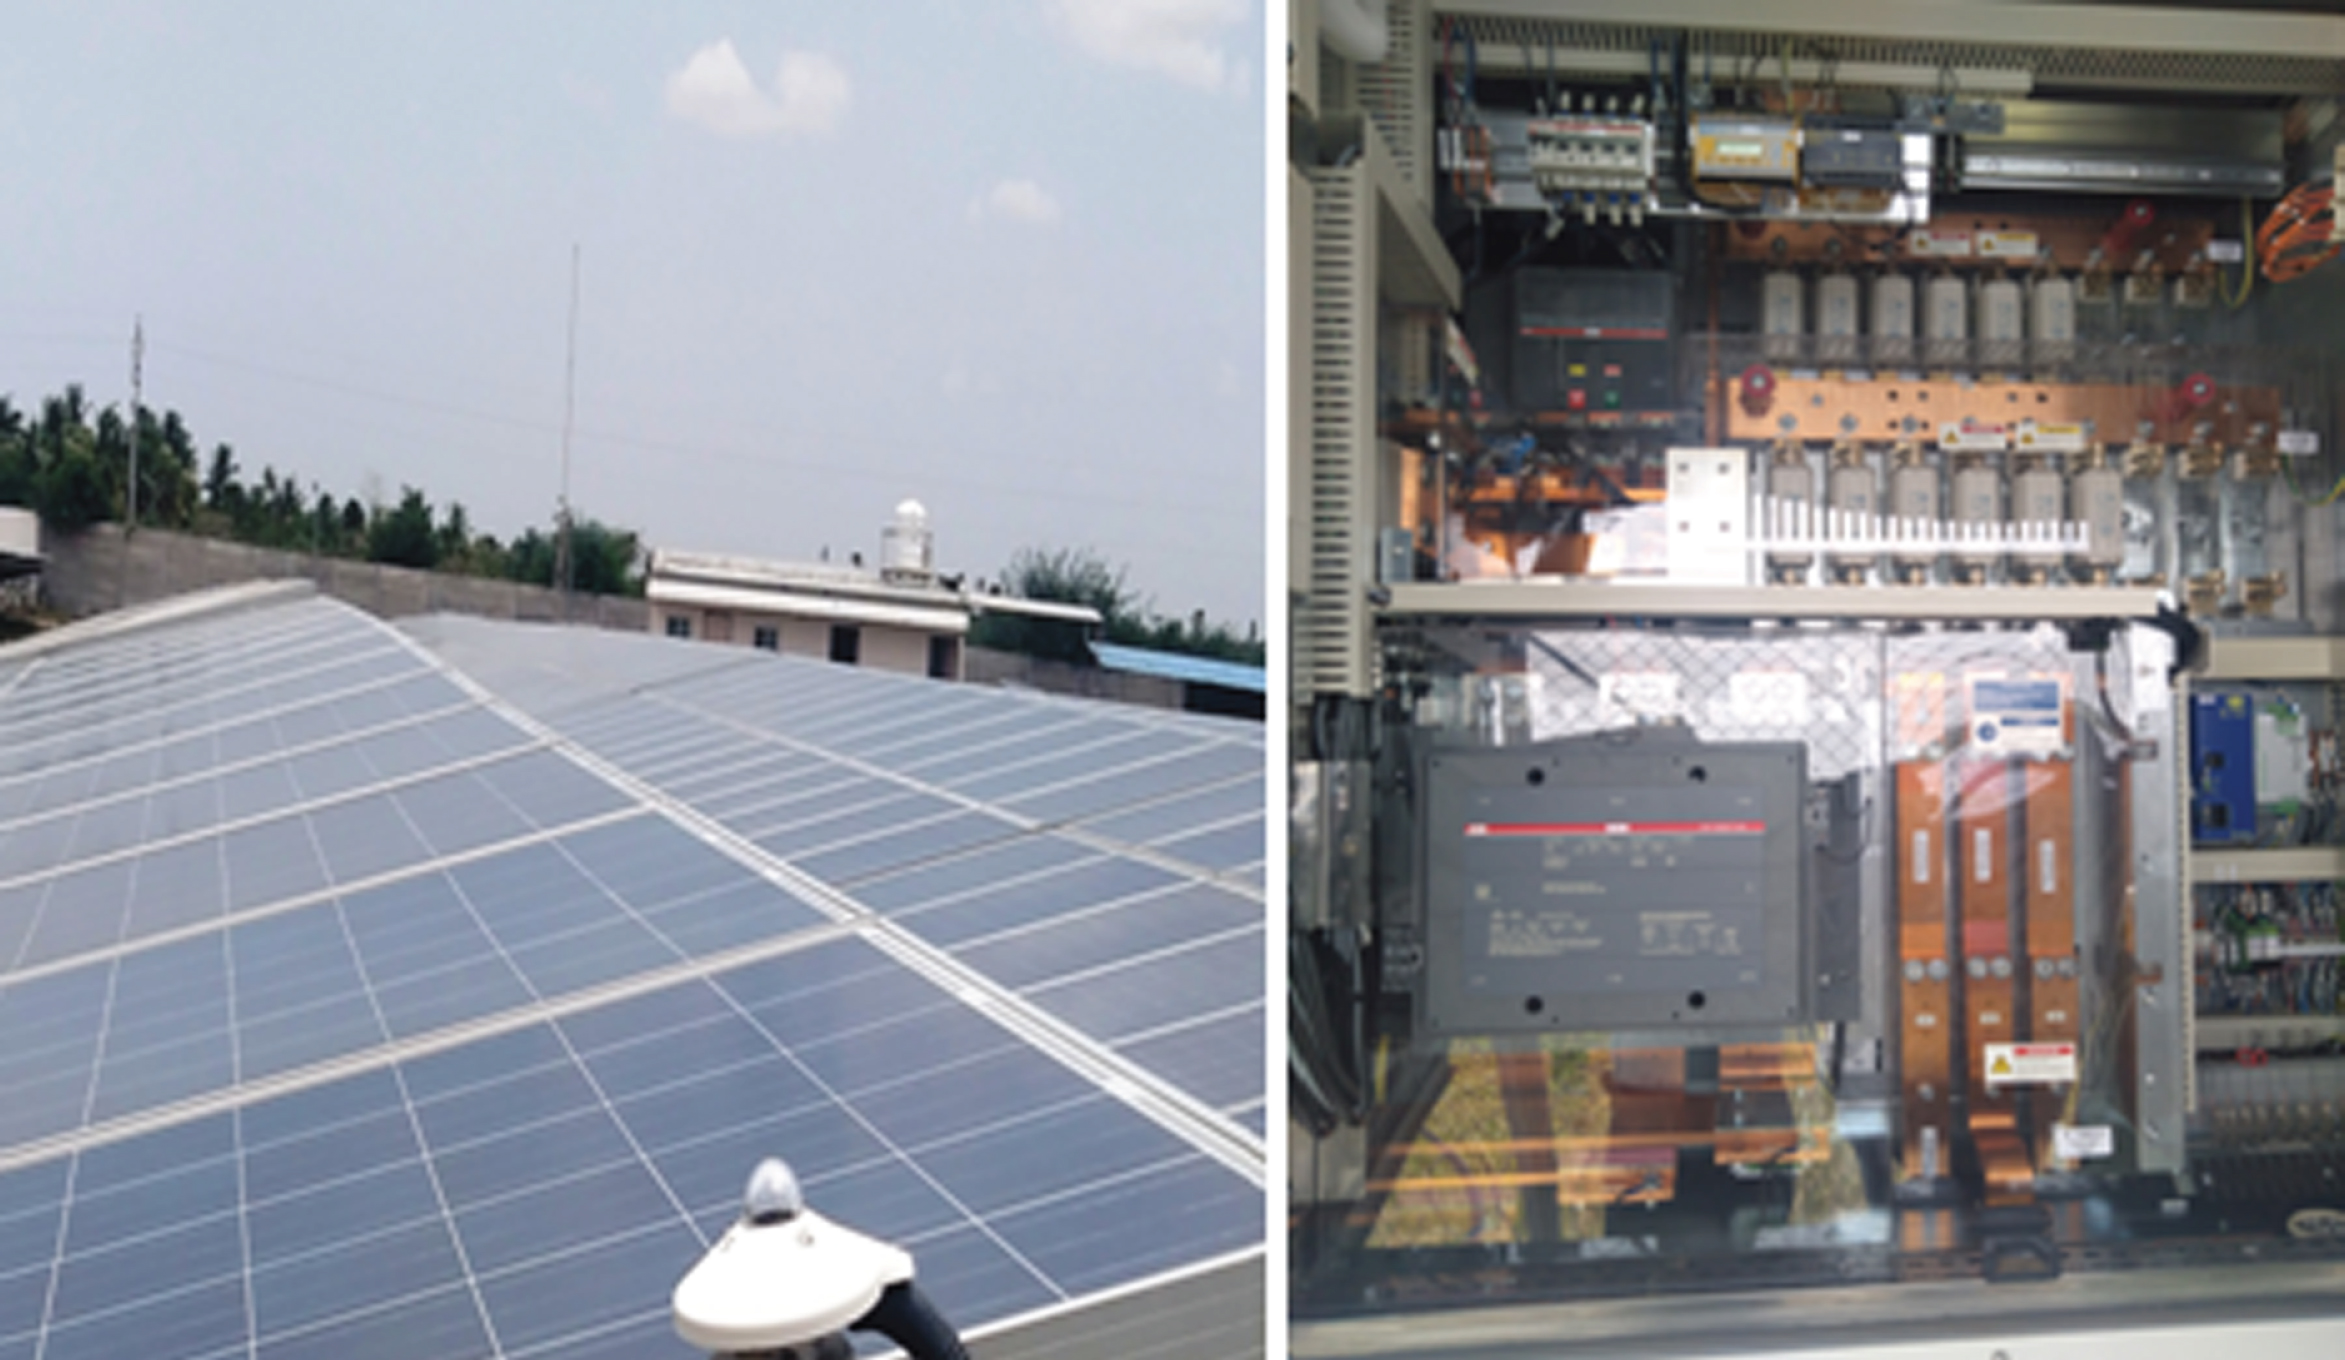
Tamil Nadu PV Plant at Karur.
HHO algorithm
Harris Hawks Optimization (HHO) is the population-based optimization algorithms that have exhibited to work more significant in numerous difficult optimization tasks demonstrated by Heidari et al. [24]. It was usually inspired by using the Harris hawks chasing style and cooperative behavior. The HHO algorithm has been proposed to solve optimization problems with the excellent formulation. Hawks use several stages to capture the rabbit (represent the optimal solution), such as exploration and exploitation. HHO first initializes a set of N solutions (X) and then computes the fitness function for each solution. The next step is to find the rabbit’s position that represents the optimal solution X
b
with the optimal fitness value. The solutions X are updated during exploration and exploitation. Based on the escape energy of the prey E, Harris Hawk Optimizer can change its strategy from exploration to exploitation. The update function of the mathematical model is as shown in formulas (1) and (2):
In this phase, the Harris hawks attempt to search and determine the prey in the desert site [24]. The Harris hawks search hunting areas randomly find the prey through positions of distinctive members of the prey and populations. The HHO use different approaches to capture the prey, which represents an optimal solution as formulated in the below Equation (3),
In this phase, when |E| ⩾ 0.5 and |E| < 0.5, the soft and hard strategies are formed. There are four different methods used based on the value of random parameters.
Soft besiege
In this stage, the prey will have higher energy; when |E| ⩾ 0.5, the soft besiege occurs, the hawk position is updated by the following formula (5).
In this stage, when |E| < 0.5, the prey will need vital energy to decamp capture, the hawk position is updated. The solution can be updated as following formula (8):
Also, another stage is referred to as soft siege with progressive fast dives in which the rabbit still has enough energy. Hence, the hawks can choose the best possible dive towards the rabbit and are shown in the follows formulas (9),
The next step is to compare the current movement with the previous dive and find its best of them. If A is not the best, the hawks start irregular and rapid dives, which are simulated using the levy flight rules as formulated in the following Equation (10).
This levy flight function described as the following formula (11),
Here β denotes given constant value.
The hawks can update their position in the soft besiege from the above equations, as shown in formula (13).
In this phase, the rabbit did not have enough energy; the hawks decrease the distance between their average and the prey. This function is defined in the formulas (14).
The flow diagram of the HHO algorithm is shown in Fig. 3.
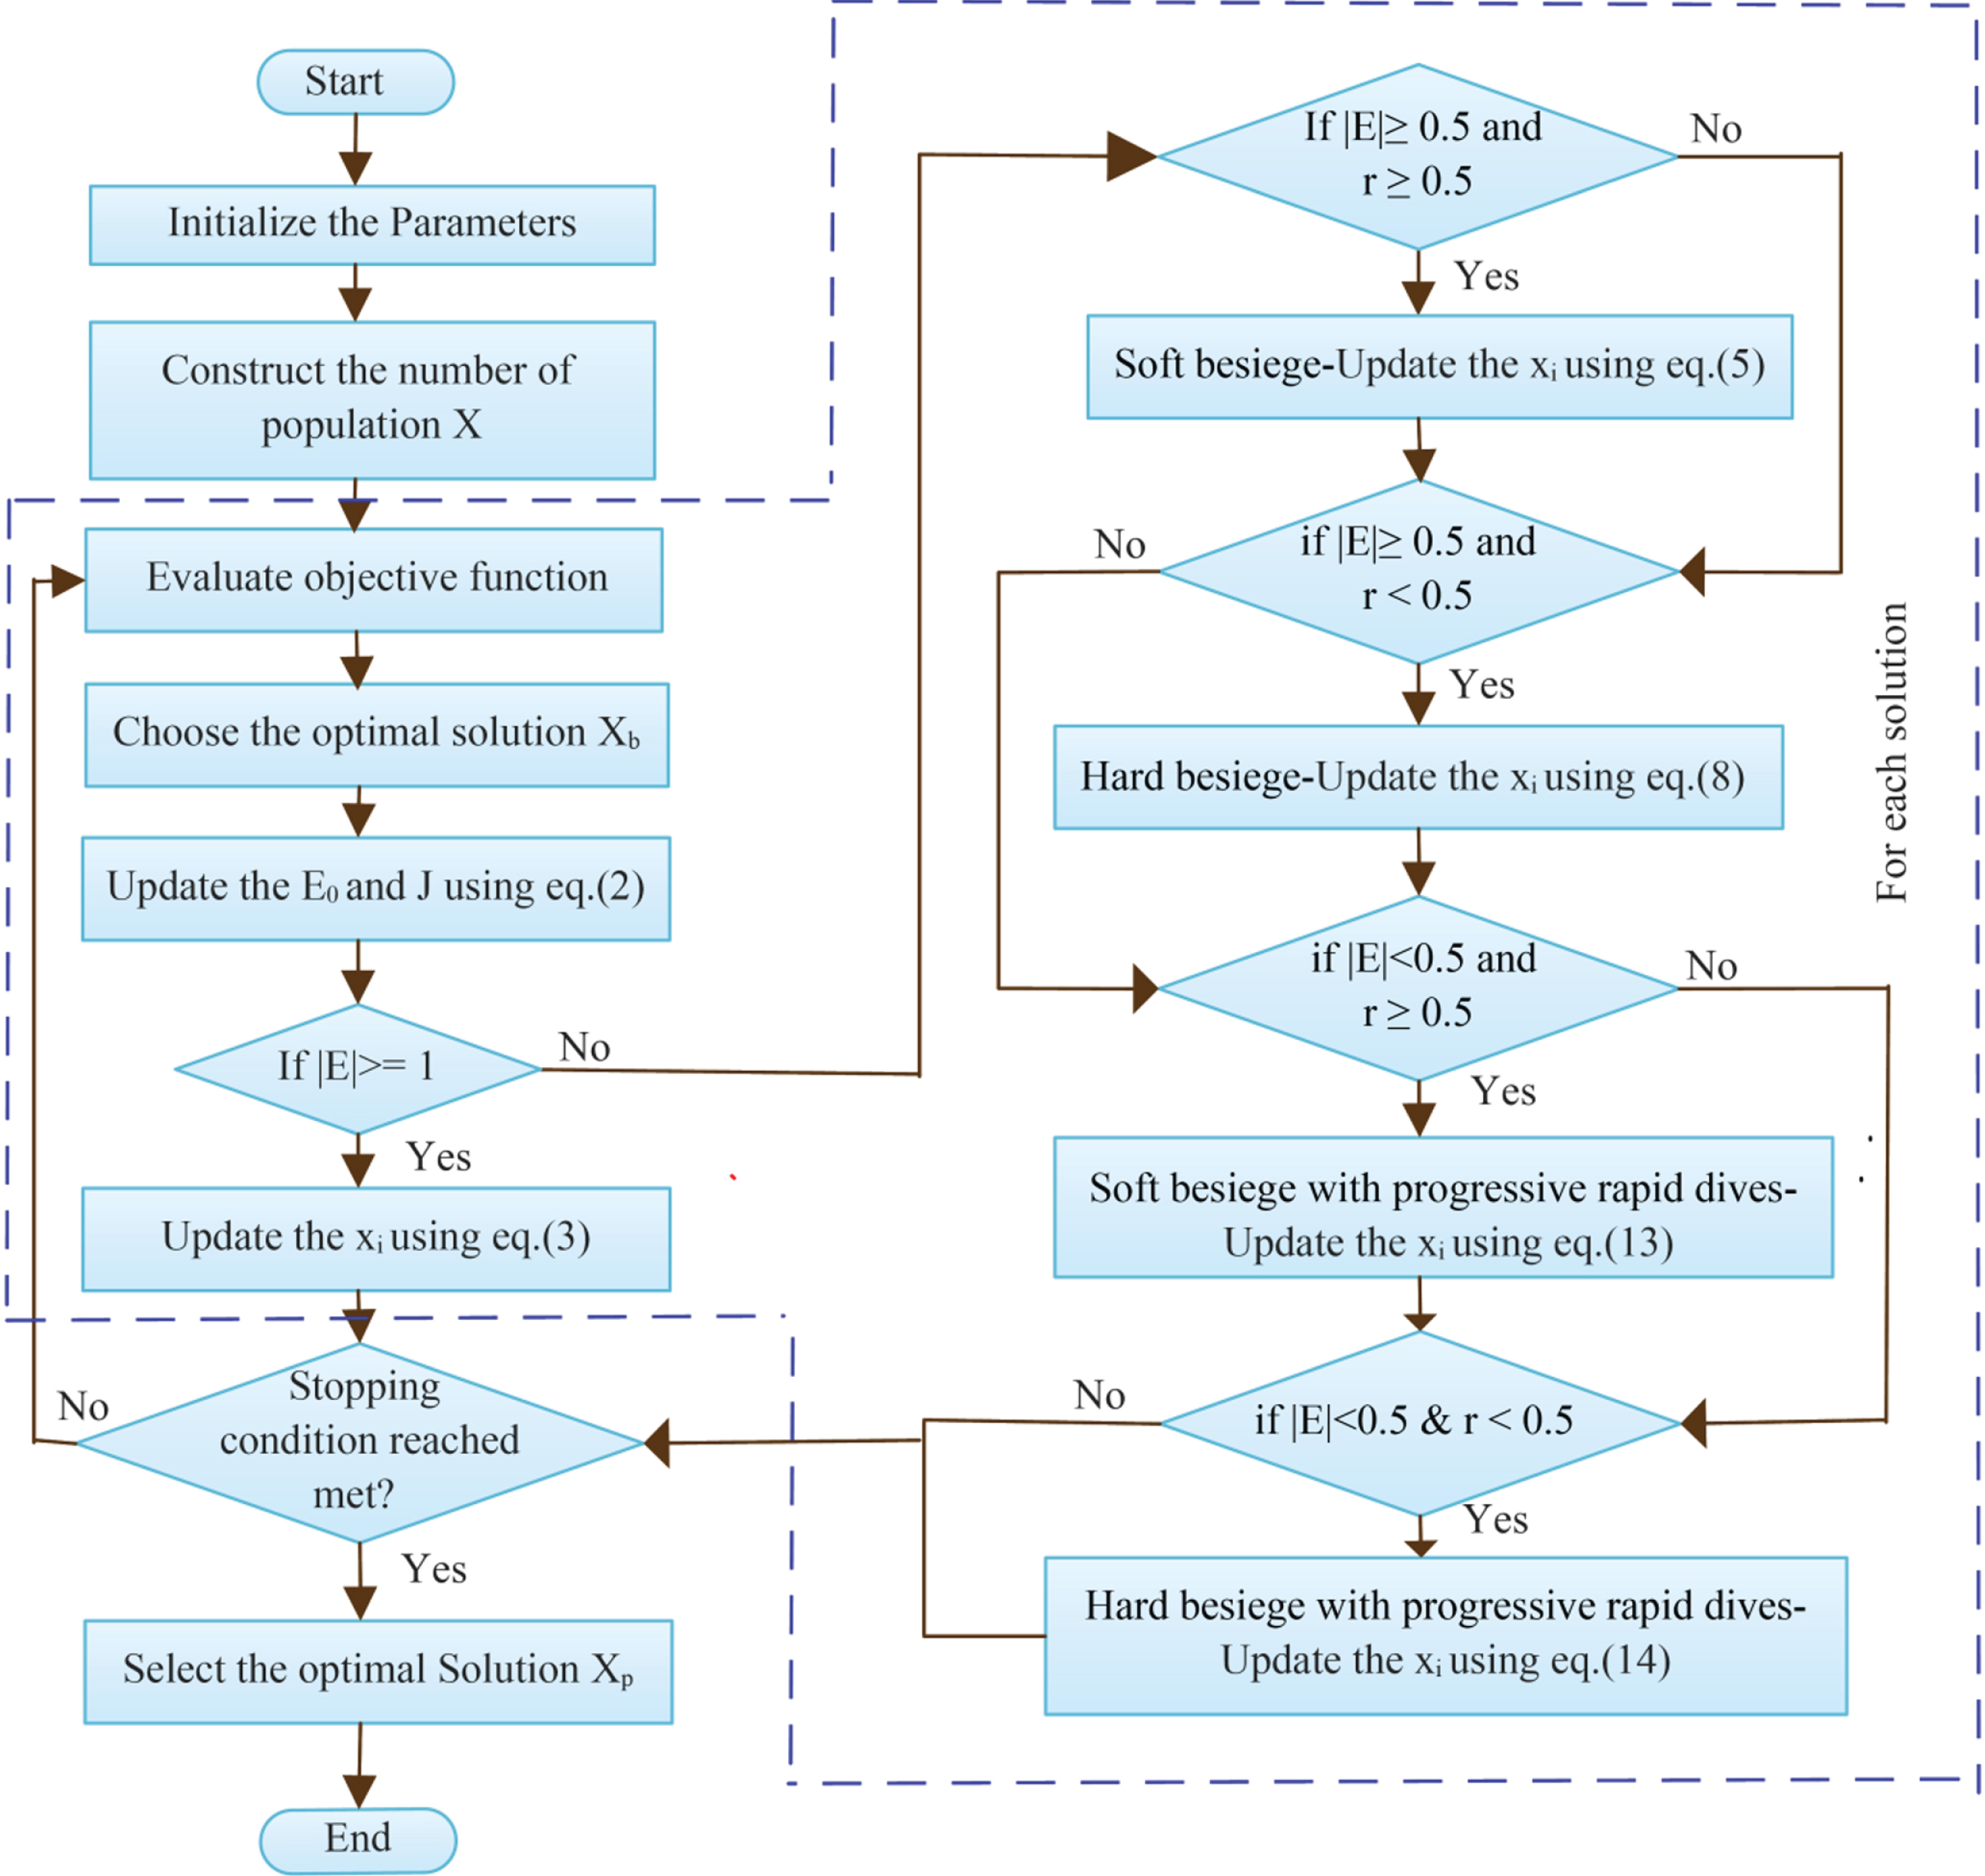
Flow diagram of HHO Algorithm.
Random Forest (RF) is a learning method for solving the classification and regression issues in machine learning data prediction [18–20]. It was constructed by multiple decision trees. It is primarily based on the concept of ensemble learning and extension of the original bagging algorithm. This algorithm extracts the subsamples of data from the observed data using the bootstrap resampling approach and creates decision trees for every sample. This process makes tree-based on graph model is constructed via an iterative method that splits into child nodes through specific rules. As a result, the average prediction of every decision tree generates the final prediction of the RF algorithm [35]. Finally, it gets a better value by averaging the prediction result. It can satisfy both accurate prediction accuracy and convenient interpretation. The primary advantages are to handle high dimensionality data and maintain the accuracy of missing data. It takes less training time as compared to other approaches and minimizes the over-fitting by averaging results. The prediction was calculated by averaging all predictions is mentioned in the following Equation (16),
Here, fi trained on bootstrap data i.
The prediction results effectiveness is lower due to any environmental factor; the proper tuning of RF algorithm parameters will lead to a more effective result. Feature selection is an efficient starting point for the pre-processing dataset before proceeding to an RF algorithm. We can modify the result’s effectiveness by adding more relevant data to the training set in RF. After training based on the training data, the hyperparameters (e.g., the maximum number of features, number of trees, the minimum number of leaves) of the RF are optimized to map the input data to its desired result.
A conceptual hybrid approach based on HHO-RF has been proposed to enhance data prediction accuracy in three different weather days. The proposed solution model contains three sub-modules, preprocessing unit, RF unit and Harris Hawk Optimizer units, depicted in Fig. 4. Weather data are received by using Cloud services from the proposed Hardware Unit. The preprocessing phase receives weather data for a selected period from the historical Cloud database. The HHO-RF model predicts accurate data and evaluates the statistical error performance of weather data. The air temperature, irradiation, surface temperature and time are considered as features of the training process.
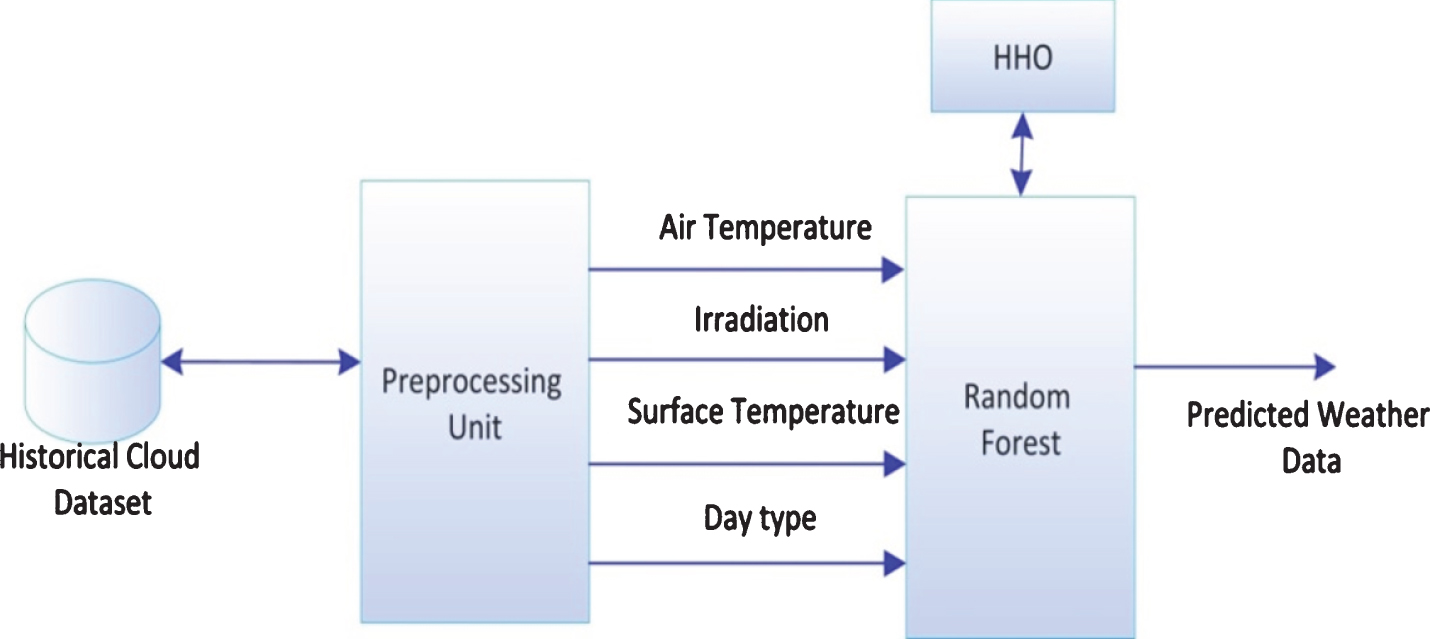
HHO-RF Solution Model.
Data collection and preprocessing are the beginning of the prediction phase because valid data can generate a significant result. The Preprocessing Unit (PPU) retrieves historical weather data from the photovoltaic plant. The dataset contains 2,380 samples of sensory data obtained from five nodes, including date, time, air temperature, surface temperature, and irradiance. Each subarea has multiple sensor nodes to collect sensor data. PPU also communicates with the historical database to obtain historical load data for training and calculates the type of day. Preprocessing is a method of segregating unstructured data into a structured form. Usually, the data set contains noisy and useful information about what useful information is required. As a result of this process, valid data is collected and can be used for further processing.
The Principal Components Analysis (PCA) method is used to reduce and analyze data without losing information. It is an effective technique for determining high-dimensional data [27–30] and minimizes the data with high dimensions into data with lower dimensions and data processing time. It exploits the most significant variations in the variables. The covariance method is one of the strategies for the application of the PCA [31–34]. From a dataset of dimensions H×N where N is the number of observations of variables H, it is possible to obtain a new subset of variables I with I < H is given as follows,
The H×H covariance of matrix C of matrix A is described as the following formulas (18),
The diagonal matrix (D) H × H of eigenvalues of C is formulated by (19);
The H × H eigenvectors matrix G that diagonalizes the covariance matrix C is given by (20)
Also, the G matrix includes the H column vector of each of the lengths H, which describe the eigenvectors of the covariance matrix C. It is essential to sort the columns of the matrix G of the reducing eigenvalue value of the matrix D. The columns of the U matrix of the H×I dimension are the first I columns of the G matrix as follows (21).
In general, the data needs to be structured when the data sample is scattered and the sample period is broad so that the data period was minimized to construct the model and the prediction [31]. In the HHO-RF process model, to increase the accuracy of the prediction and smooth the training process, the several sample data are standardized to fit into the interval [0, 1] by using an appropriate linear mapping Equation (23).
This work presents a novel method for hybrid HHO-RF model to improve sensor data prediction accuracy like air temperature, surface temperature, and irradiation. The HHO is a metaheuristic algorithm that simulates the behavior of the Harris hawks to find the optimum solution of the RF algorithm. Mostly, the main reasons for choosing the RF algorithm have more advantages over other modeling methods. The hawk was performed in different phases to evaluate the optimum solution, such as exploitation and exploration. The RF algorithm runs quickly and effectively when processing huge amounts of data. Figure 5 depicts the procedure of the suggested hybrid HHO-RF method. The experimental data set was used to evaluate and predict weather data from the PV system. The proposed model inputs are solar radiation, air temperature, hours per day and surface temperature. Therefore, the data set for training and test sets are randomly divided into 80% and 20% for data prediction.

Proposed HHO-RF Method.
In the HHO-RF, the first step is to set the initial population X
i
, initial learning rate = 0.1 and the maximum number of iteration becomes 500. The training set will be used to evaluate the optimal performance of the current network (solution) by computing the appropriate fitness function (24). In the training phase, this fitness function can be used to reduce the value of RMSE between actual data and predicted data.
The Harris hawk optimizer is to improve the performance of the RF algorithm, which means the low error rate, low variance and best fitting for the prediction process. The step by step procedure of the HHO-RF model is given below.
Step 1: Initialize the parameters.
Step 2: Set the initial value for population X i and the maximum number of iteration is 500.
Step 3: Evaluate parameters of HHO for the initial population. Then compute the objective function for every X i .
Step 4: Update the hawk position and then evaluate if the global optima value is much less than the local optima value. With the iteration of HHO, hawk positions would be updated to maximize the fitness value. In which the hawks employ different phases to find the optimum solution like exploration and exploitation using Equations (2), (3), (5), (8), (13) and (14).
Step 5: The next step is to find the position of rabbits, which represent the best solution (X b ) with the best fitness value.
Step 6: The process of updating the solutions and choosing the optimal solution is complete when the stop conditions have been met.
Step 7: Stop the optimization process and transfer the optimal solution to the RF model.
Step 8: Construct the RF model based on the best possible solution.
Step 9: Furthermore, the RFs model is evaluated as well as finds the performance of the best solution obtained during the training phase; the testing set is applied to compute the predicted data evaluated by four statistical error criteria.
Step 10: Compared to other existing models, the HHO with Random Forest has the best precision for predicting air temperature, irradiation and surface temperature.
Different statistical error criteria evaluated the data prediction accuracy. The analytical parameters are the coefficient of determination (R2), Root Mean Square Error (RMSE), Mean Absolute Error (MAE). The four analytical error criteria can be formulated as follows (25).
Root Mean Square Error (RMSE) is a way to calculate estimated model accuracy in predicting target values. It compares a predicted value and the actual value is represented as shown in formula (26).
MAE is used to determine the residual for all data points and it describes the typical magnitude of the residuals. A simplest MAE describe the perfect prediction model output as shown in formula (27),
R2 describes the determination coefficient. Here, the R2 value is 1, it represents the predicted data model is accurate and perfect and the R2 value is zero means it represents the entire regression model is a failure. The determination coefficient can be defined as following Equation (28).
In the above analytical equation, X
i
Different algorithms have been demonstrated to predict the accuracy of data like SVM [16, 25] and RF model [18–21]. This model has been used in different alications based on the dataset. The performance and evaluation of the HHO-RF algorithm were compared with LR, SVM and RF algorithm. The weather data conditions such as irradiation, air temperatures and surface temperature also affect the power generation. So weather data monitoring and prediction is essential for solar plant [20, 23]. Tamilnadu photovoltaic weather data types are collected over three different weather days. Weather will vary from minute to minute, hour to hour, day to day, and season to season. Figures 6–8 shows variation of air temperature, irradiation and surface temperatures during the lowest, average and highest weather generation day in July 2019.

Sensor data collected on the lowest weather day-22/7/2019.

Sensor data collected on average weather day-12/7/2019.

Sensor data collected on the highest weather day-15/7/2019.
In the lowest weather generation day, the maximum surface temperature peak was approximately 38°C at 12 pm. On this day, a drop of irradiance was observed around noon due to Cloud weather conditions. The irradiance was also low and oscillating, presenting values below 500 W/m2 throughout the day. The average irradiation is 292 W/m2 and low surface temperature. The average air temperature is 30°C.
Irradiance oscillation is monitored between 6 am and 6 pm, which reflects in the surface temperature curve on average weather generation day. On the same day, the maximum surface temperature and irradiance reached 61°C and 1471 W/m2. The average irradiance and surface temperature of the day is 527.6 W/m2 and 43°C.
In the highest weather generation day, the maximum surface temperature peak was approximately 64°C at 12 pm. On this day, a drop of irradiance was observed around noon due to hot weather conditions. The maximum irradiance values are above 800 W/m2 throughout the day and the peak irradiance value is 1318 W/m2 at 12 pm. The air temperature and surface temperature remained high during this day.
The average irradiation is 774 W/m2 and the maximum air temperature is 40°C. The recorded meteorological data includes ambient temperature, irradiation, surface temperature, date and time are presented in Table 2. The collected weather data are applied to the inputs of the HHO-RF model. The statistical analysis of the collected data was tabulated in Table 3.
Sample recorded value of sensor data
Statistical analysis of descriptive data for a different weather day on July 2019
Performance evaluation of accurate data prediction model for air temperature
The experiment was carried out by the dataset of inputs consisting of 2340 samples with three variables, namely ambient temperature, irradiation and surface temperature. This experiment has been performed by randomly dividing the entire dataset into 80% for training and 20% for testing. The number of trees in the RF is 250 and the leaves for each tree are 5. An initial HHO population is given at random. The maximum number of iterations is 500 and the other HHO factors are defined as the original reference [24]. The performance evaluation of collected weather data is analyzed in three different days, like the lowest, average and highest weather generation day. Figures 9–11 depicts the RMSE, MAE and MSE have the results of minimum statistical error compared with the other three algorithms.

Performance evaluation of air temperature data predictive model based on RMSE and MAE.

Performance evaluation of air temperature data predictive model based on MSE and R2.
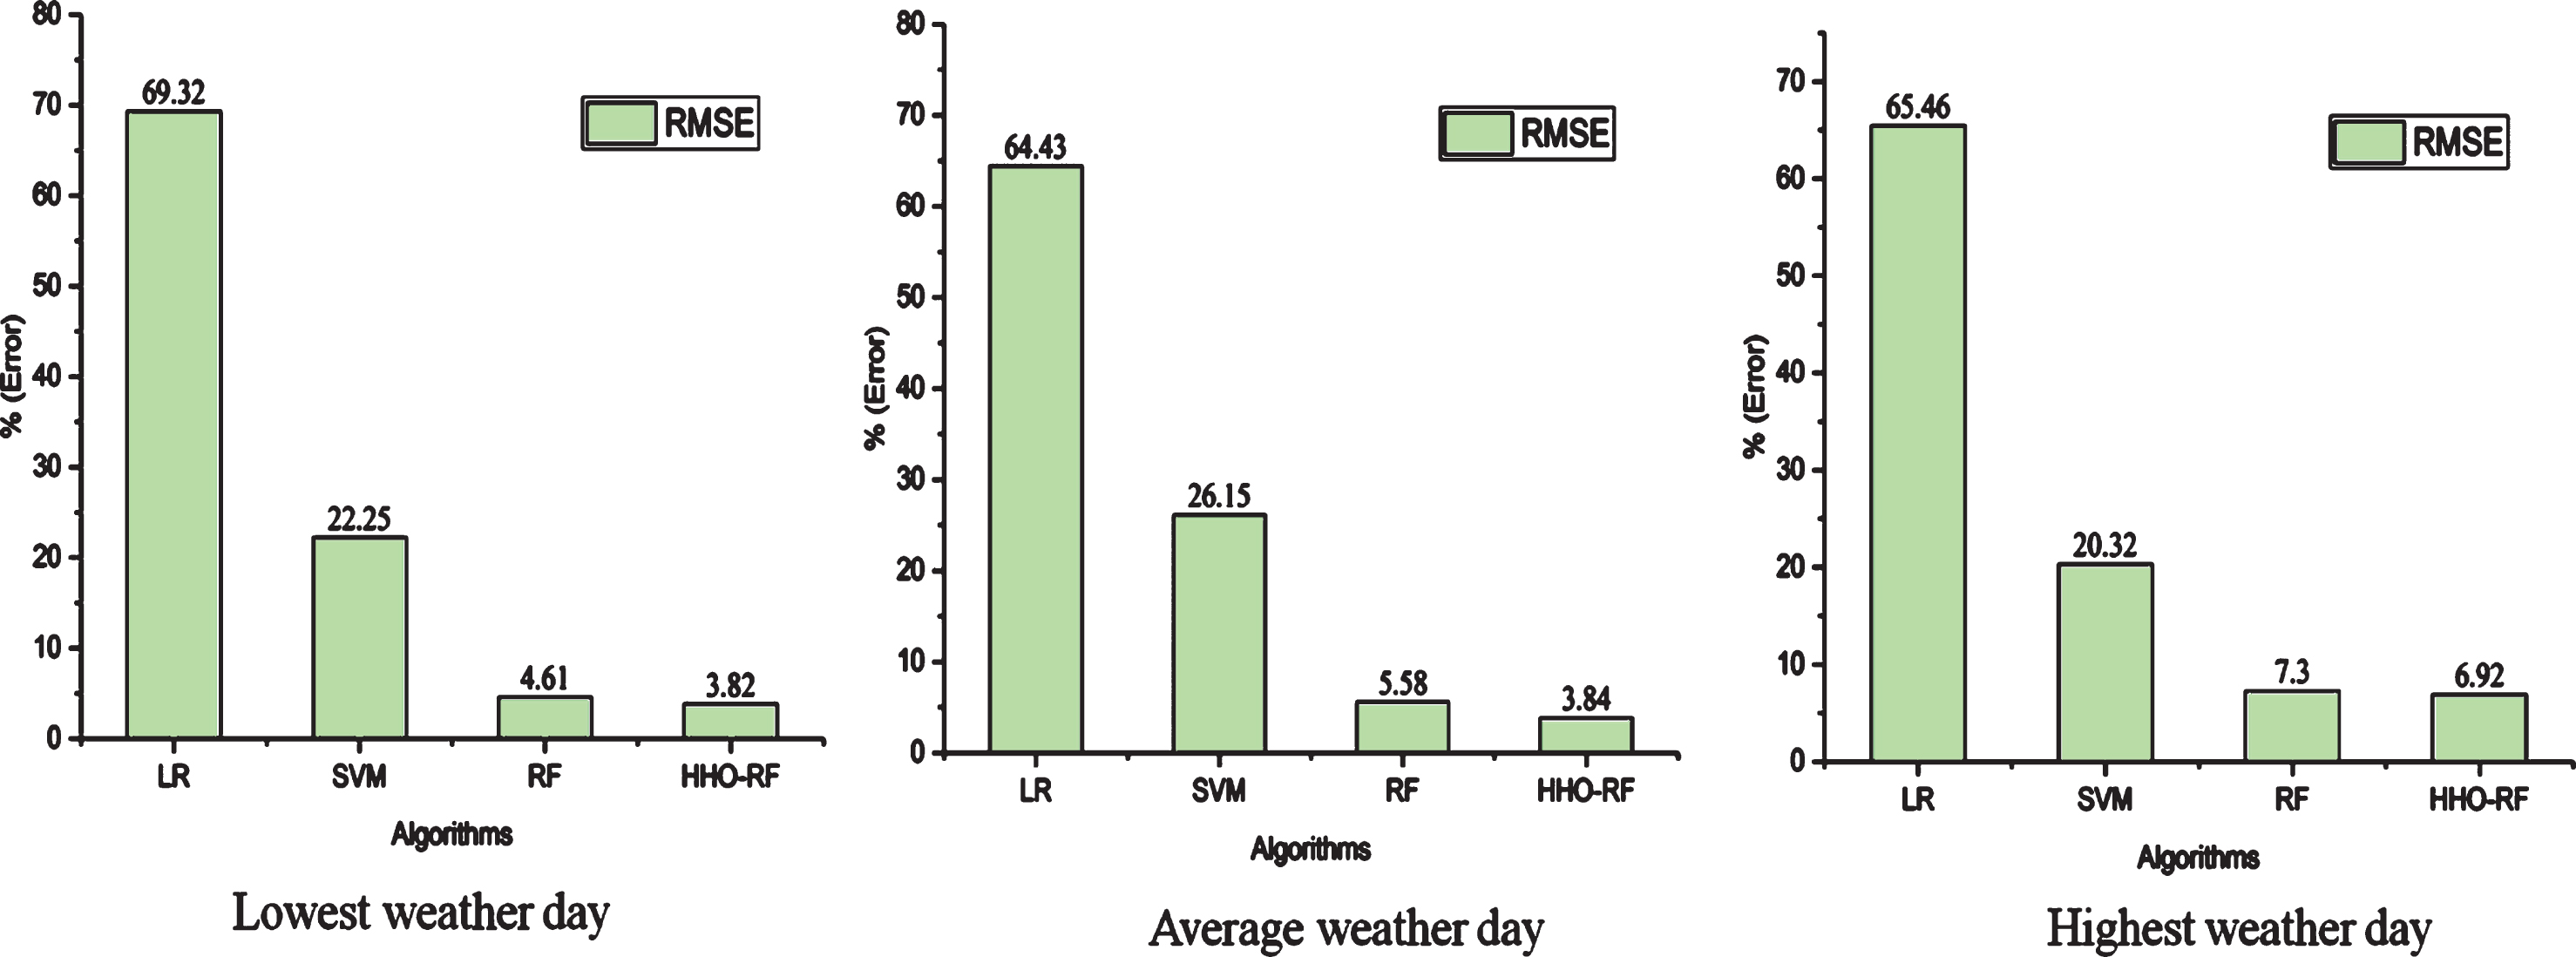
Comparison results of air temperature with different algorithms based on RMSE.
HHO is implemented to optimize the number of trees and leaves per tree based on the minimum root mean square error (RMSE) value. If the number of trees and leaves in each tree is lower than the optimum number, underfitting may occur, leading to high training and error rates. In contrast, overfitting and high variance may occur when the number of trees and leaves in each tree is more than the optimum number. The HHO model enhances the established RFs model performance, which means the best fitting, less error rate, and less variance for the predictive function. This HHO-RF method can significantly enhance the prediction’s effectiveness by reducing the plotted RMSE, MAE and MSE. Table 4 shows the weather data prediction model in the lowest, Average and the highest weather day. During the lowest weather day, the proposed HHO-RF obtained the lowest RMSE value is 0.08011 compared to LR (1.5152), SVM (0.48643) and RF (0.1008).
Different predictive evaluation models for air temperature
Additionally, the proposed HHO-RF obtained the lowest MAE value is 0.05872 compared to LR (1.3313), SVM (0.39364) and RF (0.0706). The proposed model coefficient of determination (R2) is 99.87%, 99.75% and 99.89% in lowest, average and highest weather day. It provides good fitness value compared to LR, SVM and RF model.
Figure 11 shows the comparison result for air temperature with different algorithms based on RMSE. The lowest percentage RMSE of the proposed model is 3.82 %, 3.84%, 6.92% model at the lowest, average and highest weather days. The sample of the observed and predicted air temperature using the HHO-RF model is depicted in Fig. 12. The Random Forest model obtains the percentage of RMSE value at 4.61%, 5.58% and 7.3%. The Harris hawk optimizer is to improve the RF algorithm performance, which means the low error rate, low variance and best fitting for the prediction process.

HHO-RF data Prediction model of air temperature on lowest weather day.
The convergence curve of the HHO-RF for the predicted training process in terms of RMSE is depicted in Fig. 13. The x and y-axis represent the number of iterations and fitness value of the RMSE. HHO displays a faster convergence rate to determine the final global optima. From the results state, the lowest RMSE, MSE and MAE values indicate the optimal prediction accuracy of the developed HHO-RF over the LR, SVM and RF algorithm.
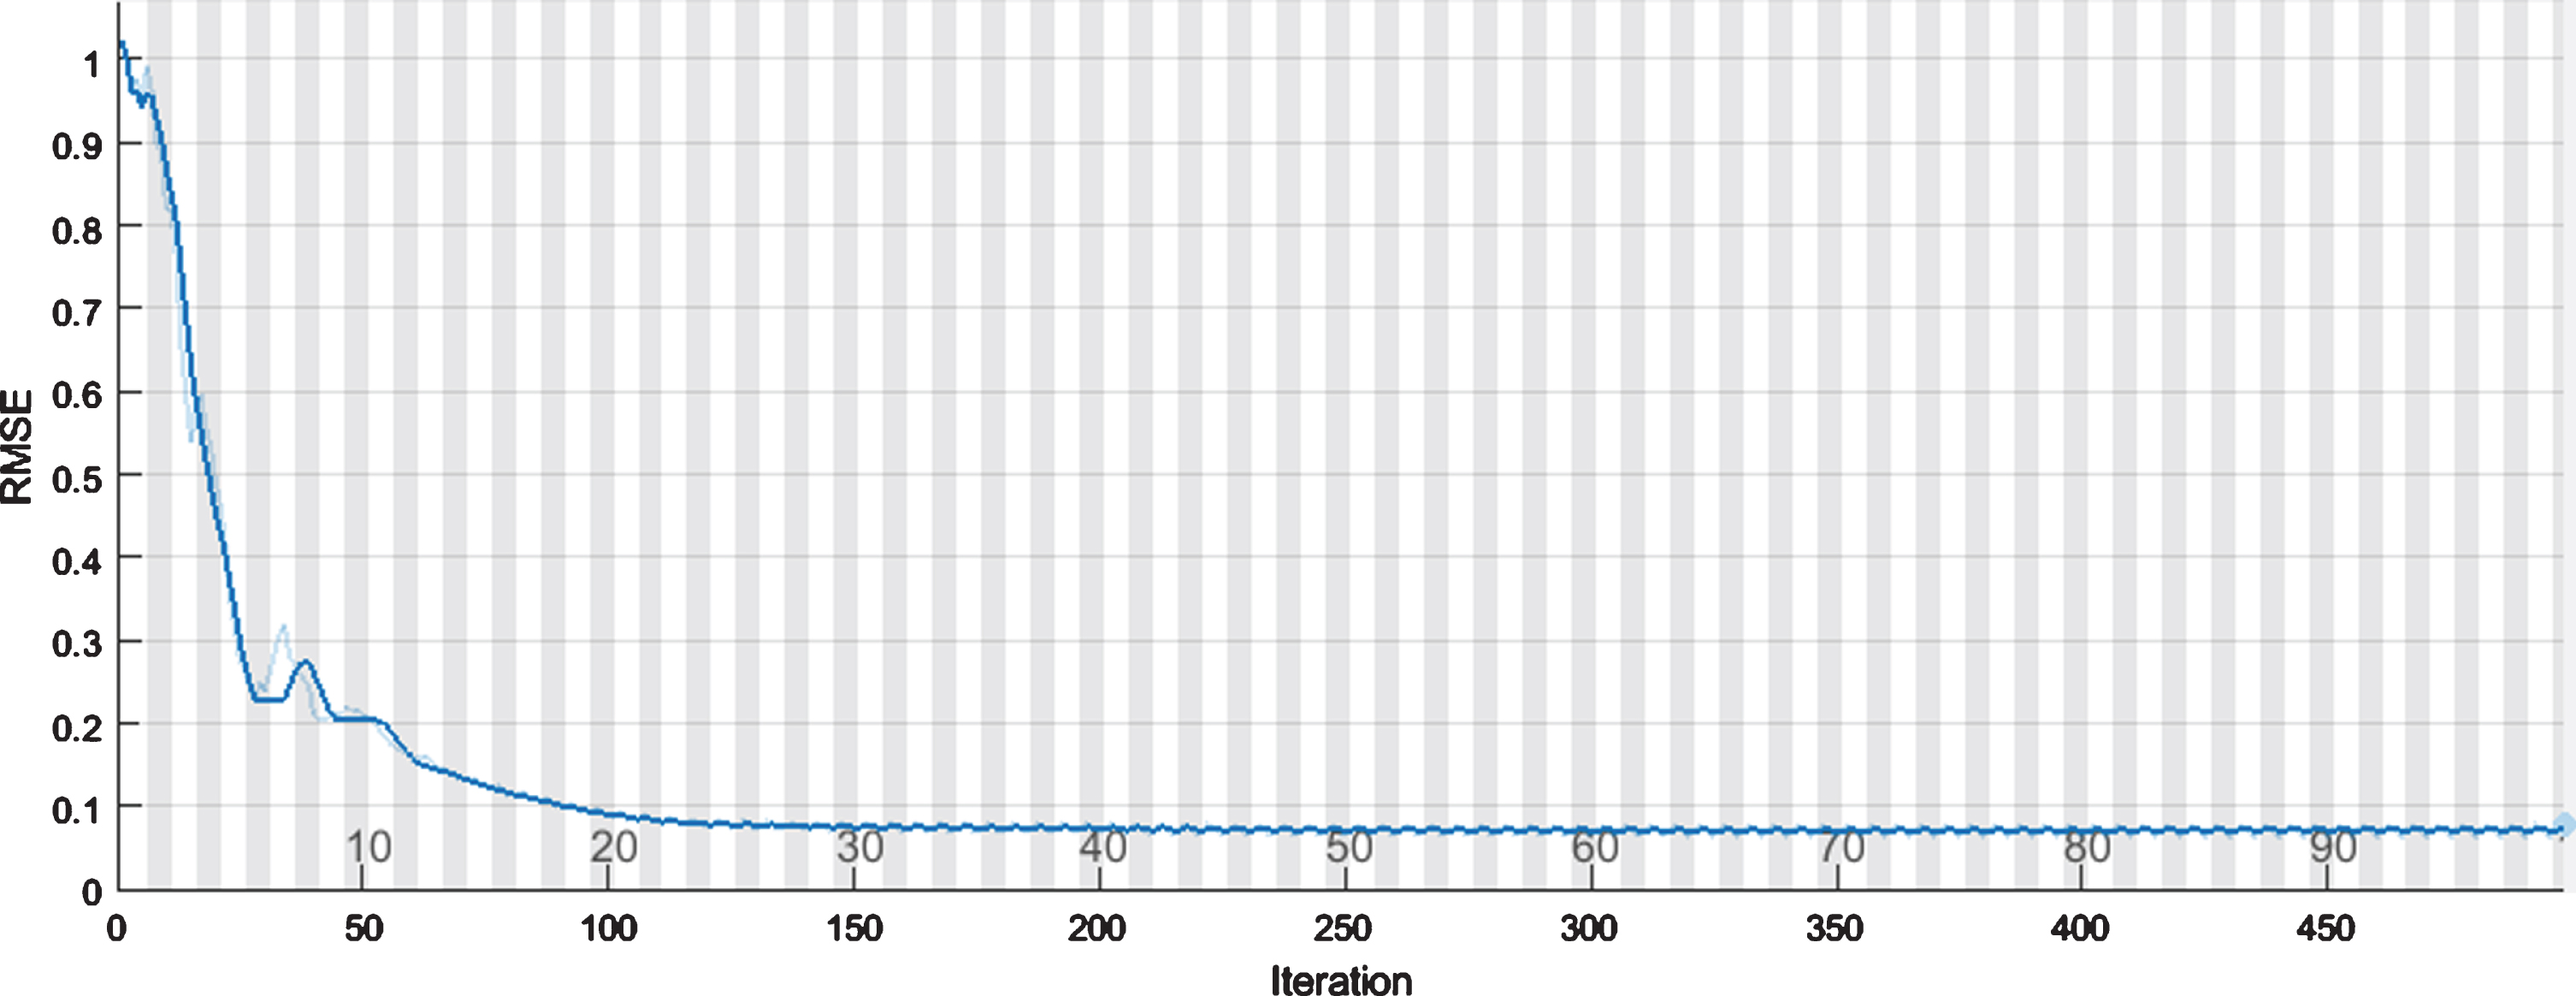
Convergence curve of the proposed model of air temperature on lowest weather day based on RMSE.
Different predictive evaluation models for solar irradiation
The same experiment was performed to predict the accuracy of irradiation on three different days. The comparison results are illustrated in Table 5 and Figs. 14–16. Four statistical error parameters were used to analyze the different algorithms performance to predict the solar irradiation on three different days. The HHO algorithm aims to determine the best number of leaves and trees based on the minimum value of RMSE. It maximizes the prediction accuracy and provides minimum error values. The proposed Hybrid HHO-RF model produces the lowest value of RMSE (3.4848), MSE (12.144), MAE (2.0111) and the determination coefficient is (R2) 99.92% in lowest weather day. During Average weather day, the proposed model provided the lowest RMSE (58.819), MSE (3459.6), MAE (26.927) and determination coefficient R2 is 96.99%. During the highest weather day, the accuracy of prediction results shows the least value of RMSE (90.301), MAE (30.177) and the determination coefficient (R2) is 91.02%. The highest value of R2 indicates the best correlation between the predicted and observed results of the HHO-RF algorithm. The proposed hybrid HHO-RF approach demonstrated better performance over LR, SVM, and RF algorithm based on statistical error criteria. In all three weather days, the lowest percentage of RMSE was achieved by hybrid HHO-RF at 1.98%, 10.11% and 15.59% compared to other algorithms is depicted in Fig. 16. These statistical evaluation parameters indicate the outperformance of HHO-RF over different approaches.
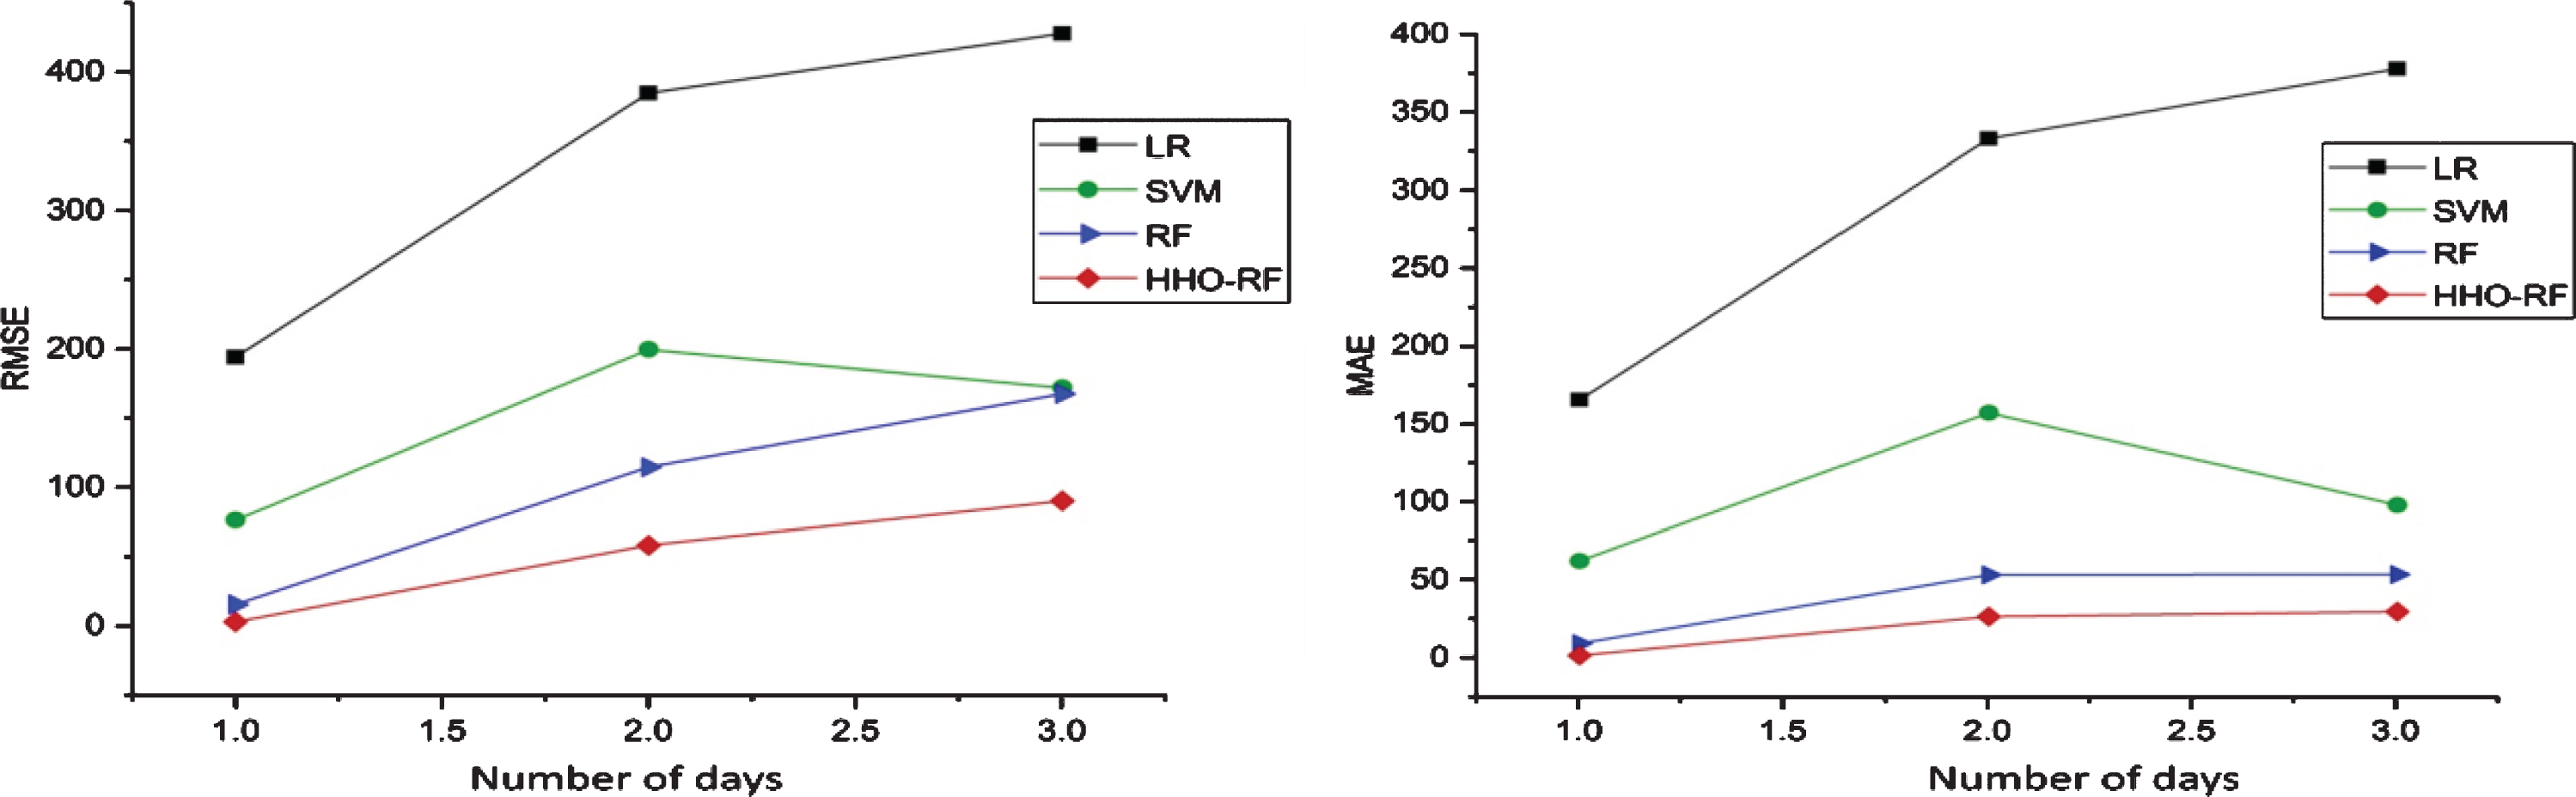
Performance evaluation of irradiation data predictive model based on RMSE and MAE.
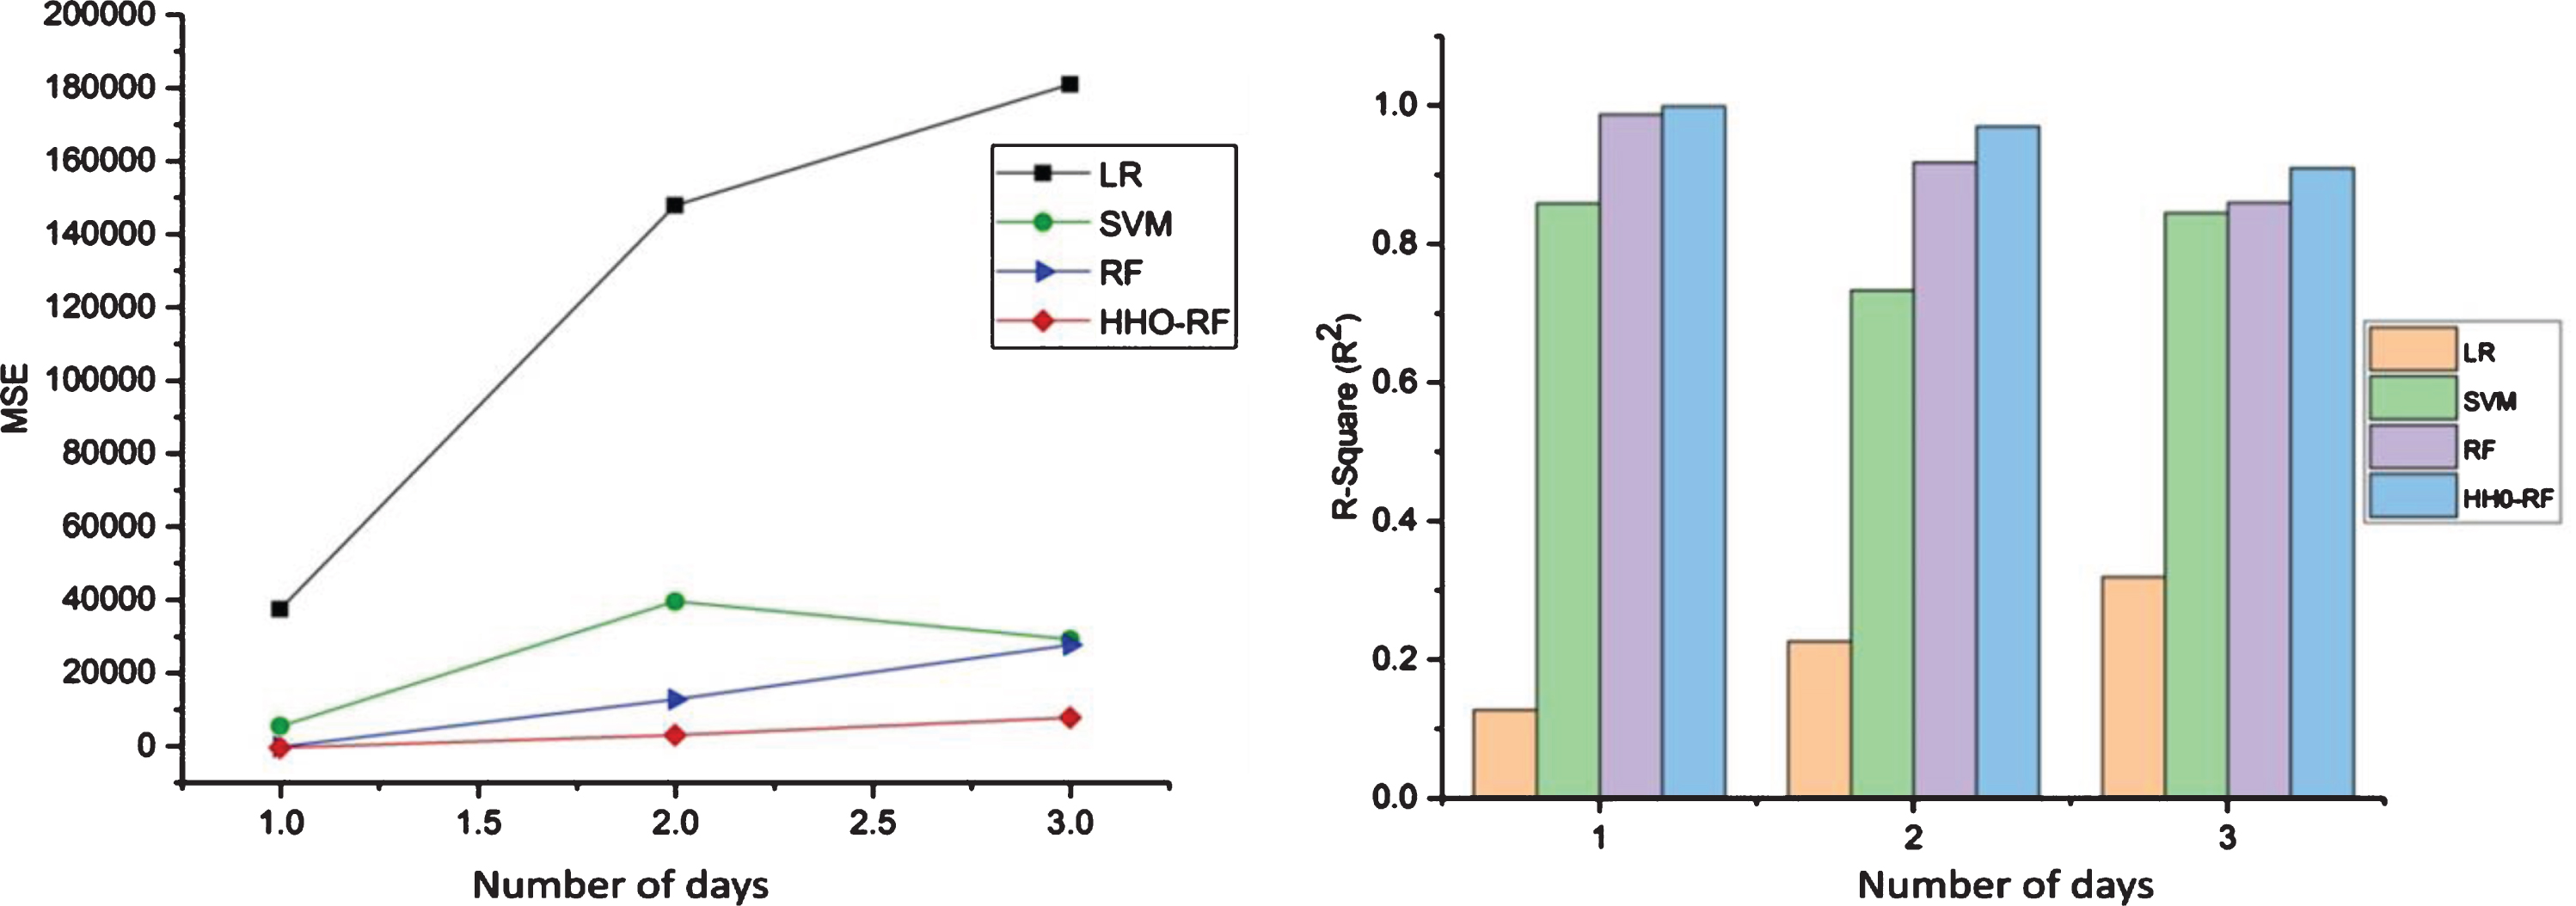
Performance evaluation of irradiation data predictive model based on MSE and R2.
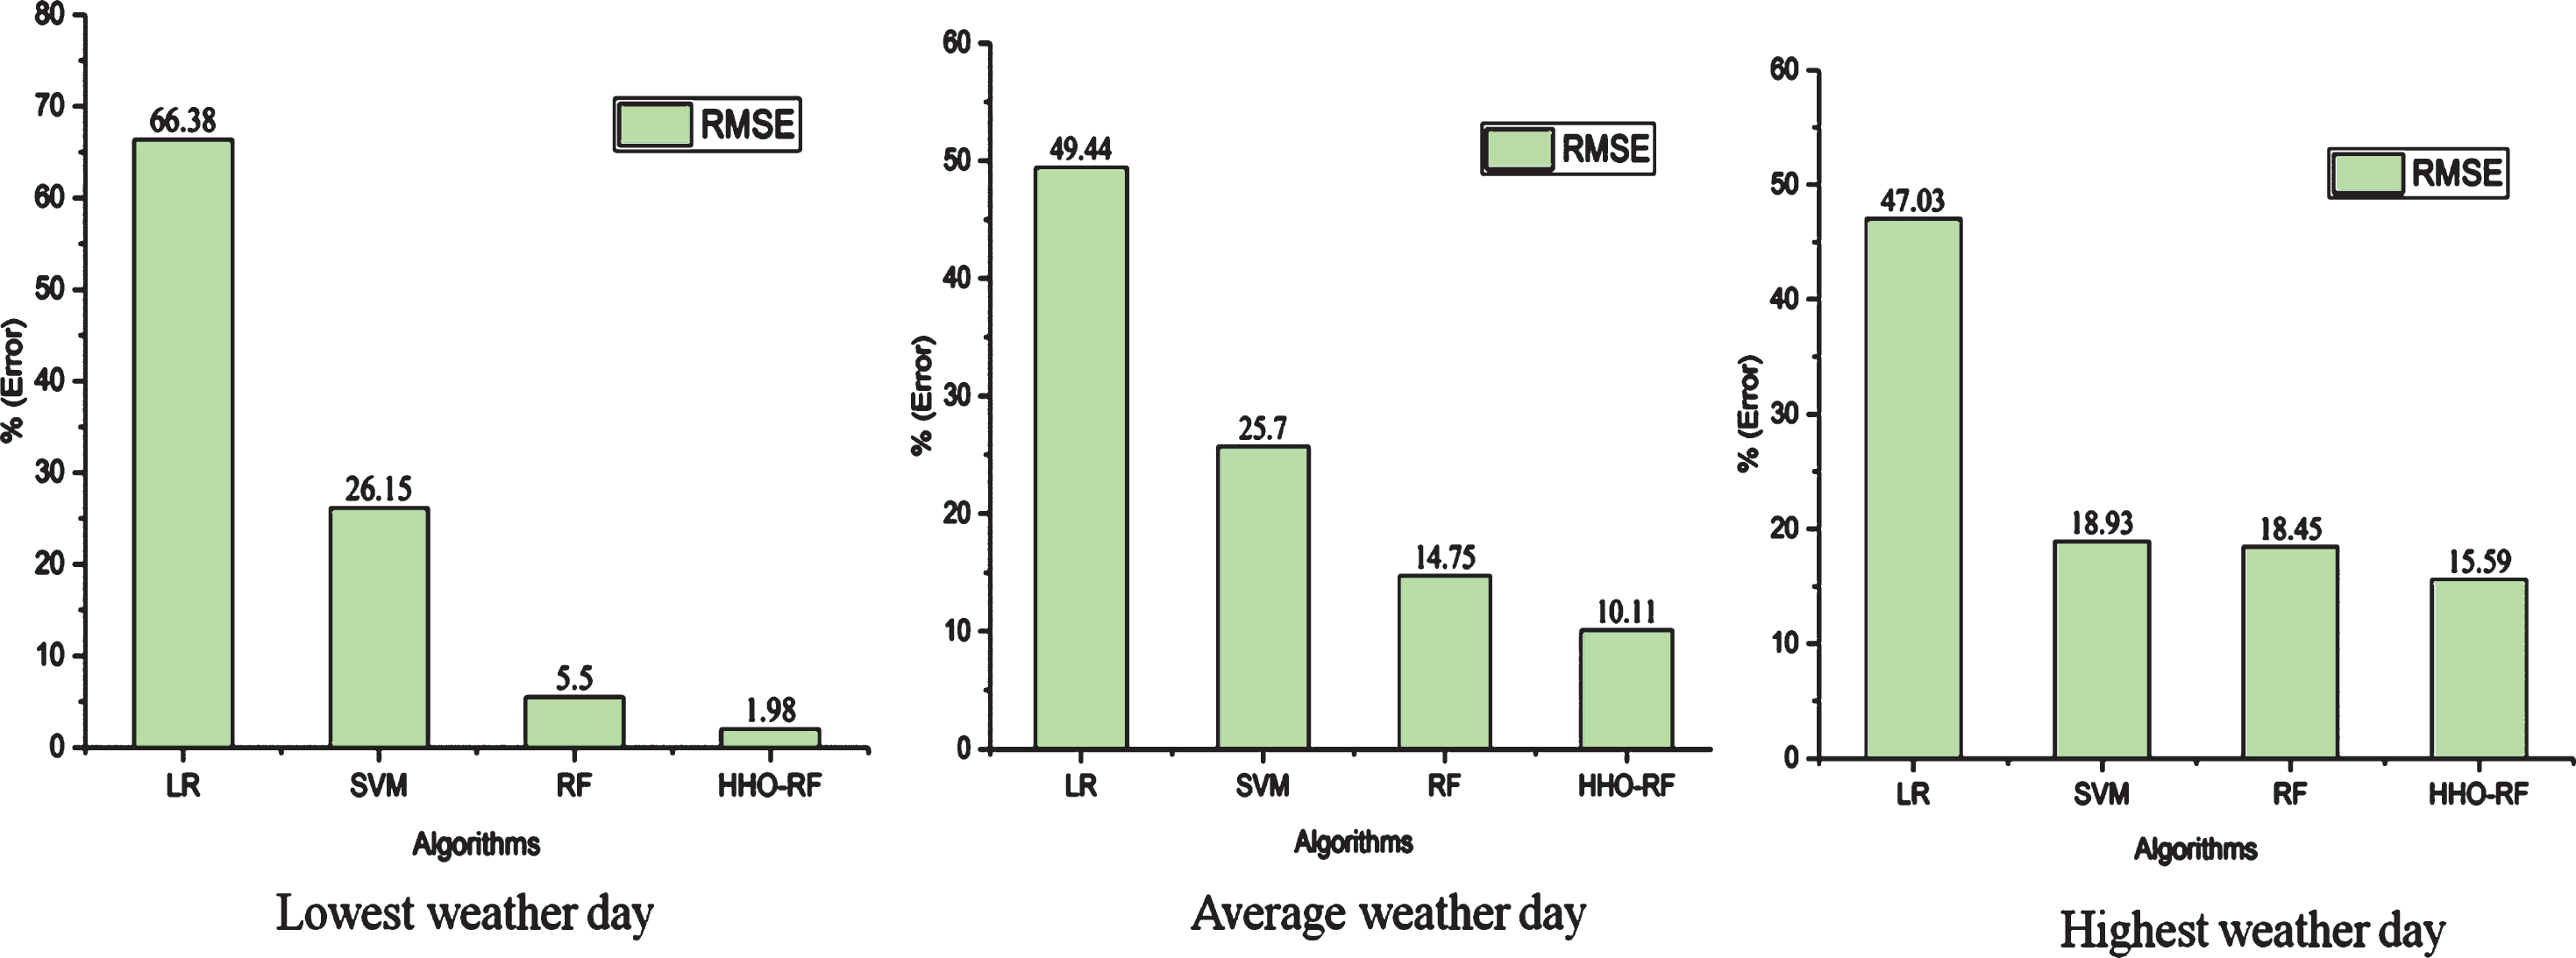
Comparison results of irradiation with different algorithms based on RMSE.
Based on the results, the comparison of observed with predicted irradiation is shown in Fig. 17. The time series irradiation data predicted by HHO-RF comes closest to the targeted observed data from these comparison curves. Figure 18 shows the scatter plots of the predicted and observed data of irradiation. It indicates the regression lines between the actual and predicted values of data. As the regression lines slope is close to 1, the intersection is close to 0 and the points are not very scattered. The proposed algorithm predictions are more in line with observed results and the residual errors compared to other methods are very small.
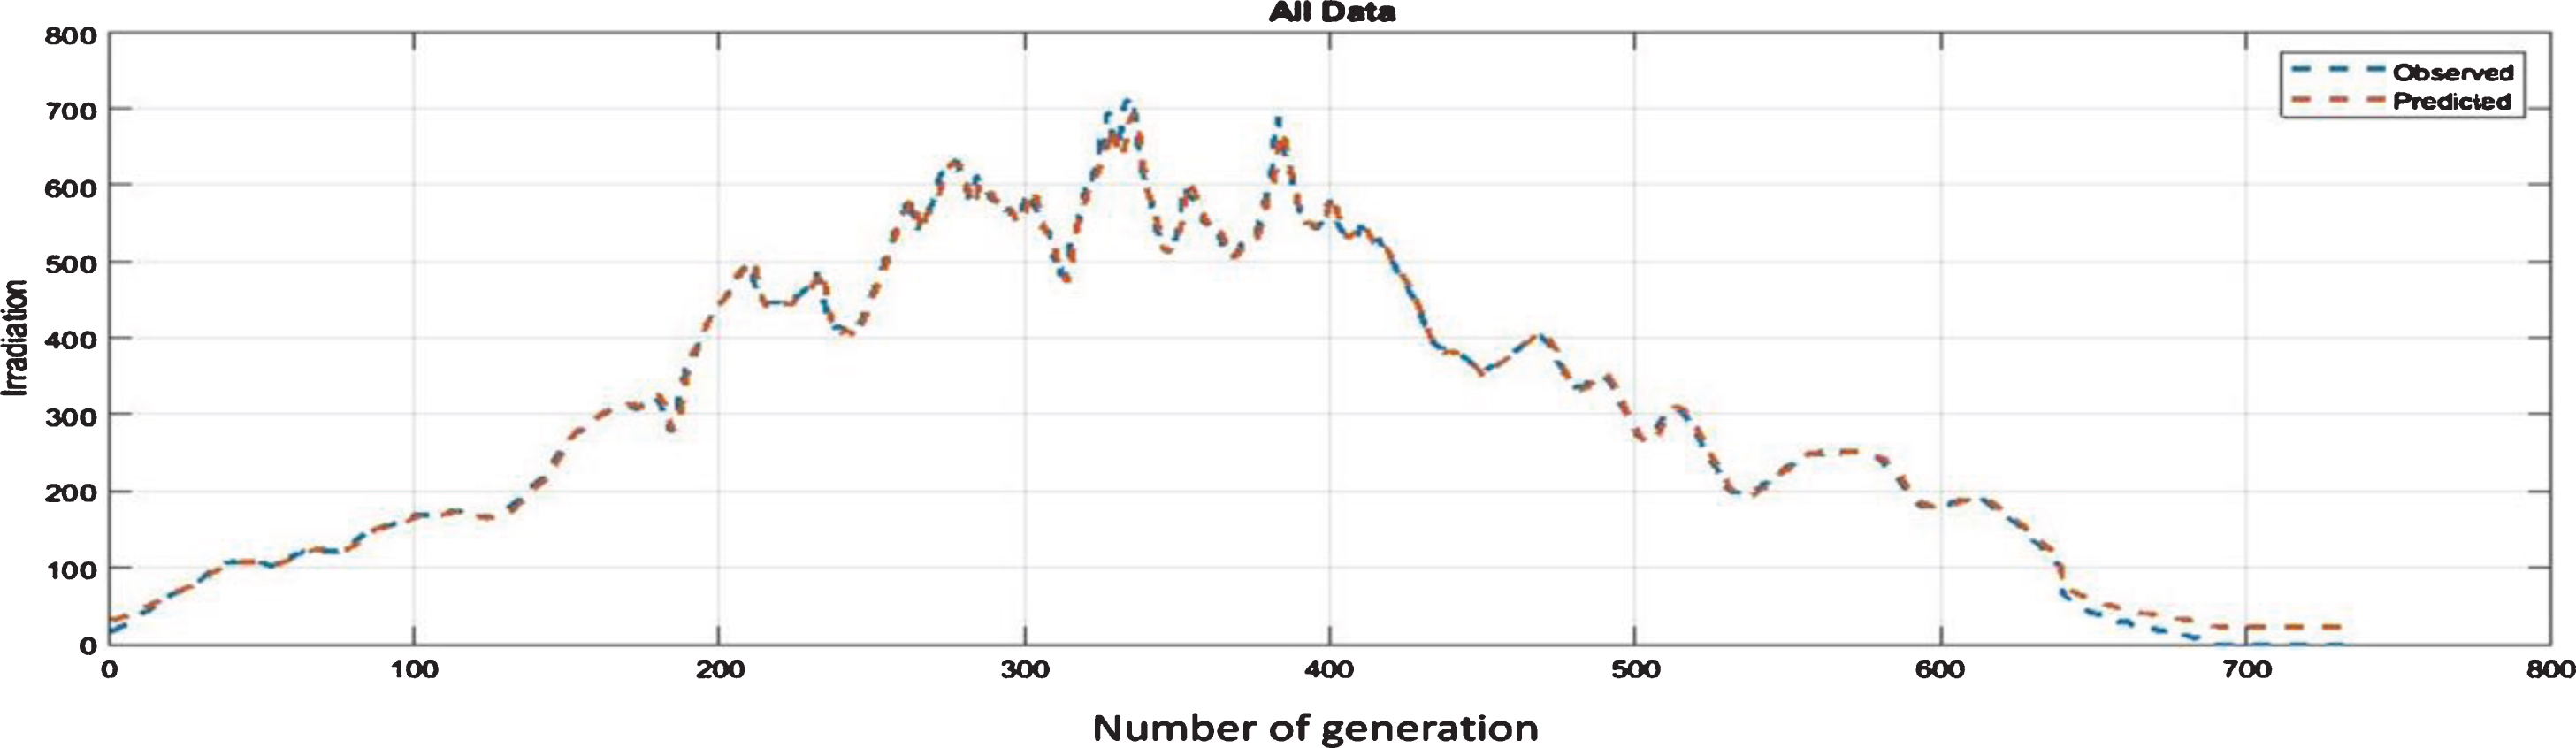
HHO-RF data prediction model of irradiation during the lowest weather day.
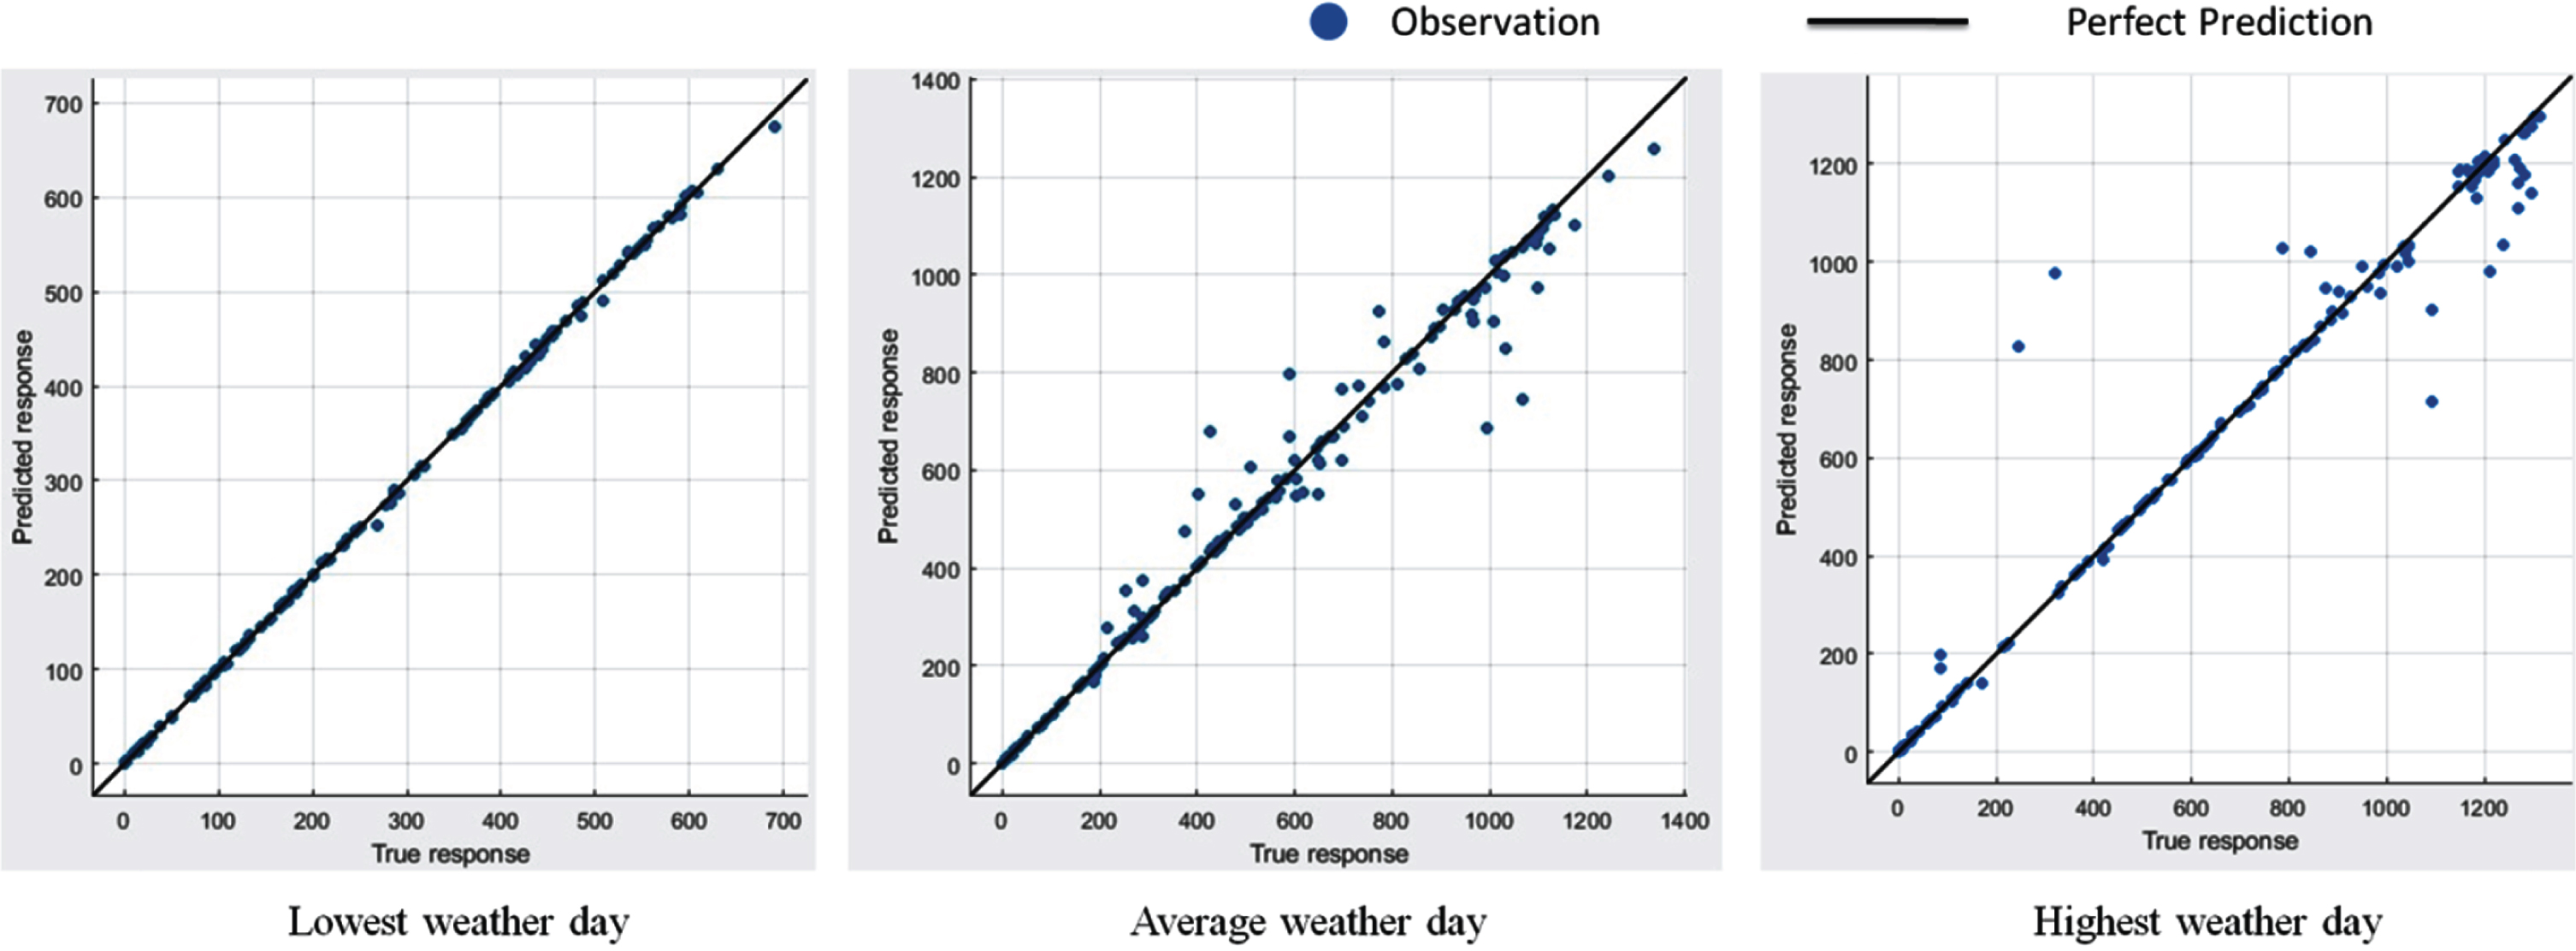
Scatter plot of the predicted versus observed data of irradiation using the HHO –RF model.
Different predictive evaluation models for Surface temperature
Table 6 shows that the proposed hybrid HHO-RF algorithm evaluated the prediction results of surface temperature. It produces the minimum error value and the highest determination coefficient compared with the other three algorithms. Four statistical error factors can be used to analyze the performance of the HHO-RF to predict the surface temperature on three different days. In the lowest weather day, the RMSE value for LR, SVM, RF and HHO-RF is equivalent to 4.3355, 1.1348, 0.23205, and 0.10398, respectively. The highest R2 value (99.91%) indicates a better correlation between observed and predicted accuracy of HHO-RF compared to existing modeling techniques. Also, the MAE for the HHO-RF (0.07068) is lower than the MAE obtained by RF (0.15401), SVM (0.88201), and linear regression (3.8273). The comparison results are illustrated in Figs. 19–21. In this work, the same experiment has been demonstrated in different weather days. The proposed hybrid HHO-RF approach has demonstrated results indicate better performance over different learning algorithms based on performance evaluation parameters. For three different days, the lowest percentage of RMSE for surface temperature was achieved by the proposed hybrid model at 1.96%, 2.12%, and 3.74% compared to other model is depicted in Fig. 21. The lowest MSE, RMSE and MAE values indicate the maximum predictability of the proposed HHO-RF over LR, SVM and RF algorithm. The HHO is to optimize the RF parameters based on the lowest value of RMSE. It improves the proposed HHO-RF prediction results, which means the low error rate and best fitting for the prediction process. So the proposed method provides the minimum RMSE and MAE values.

Performance evaluation of surface temperature data predictive model based on RMSE and MAE.
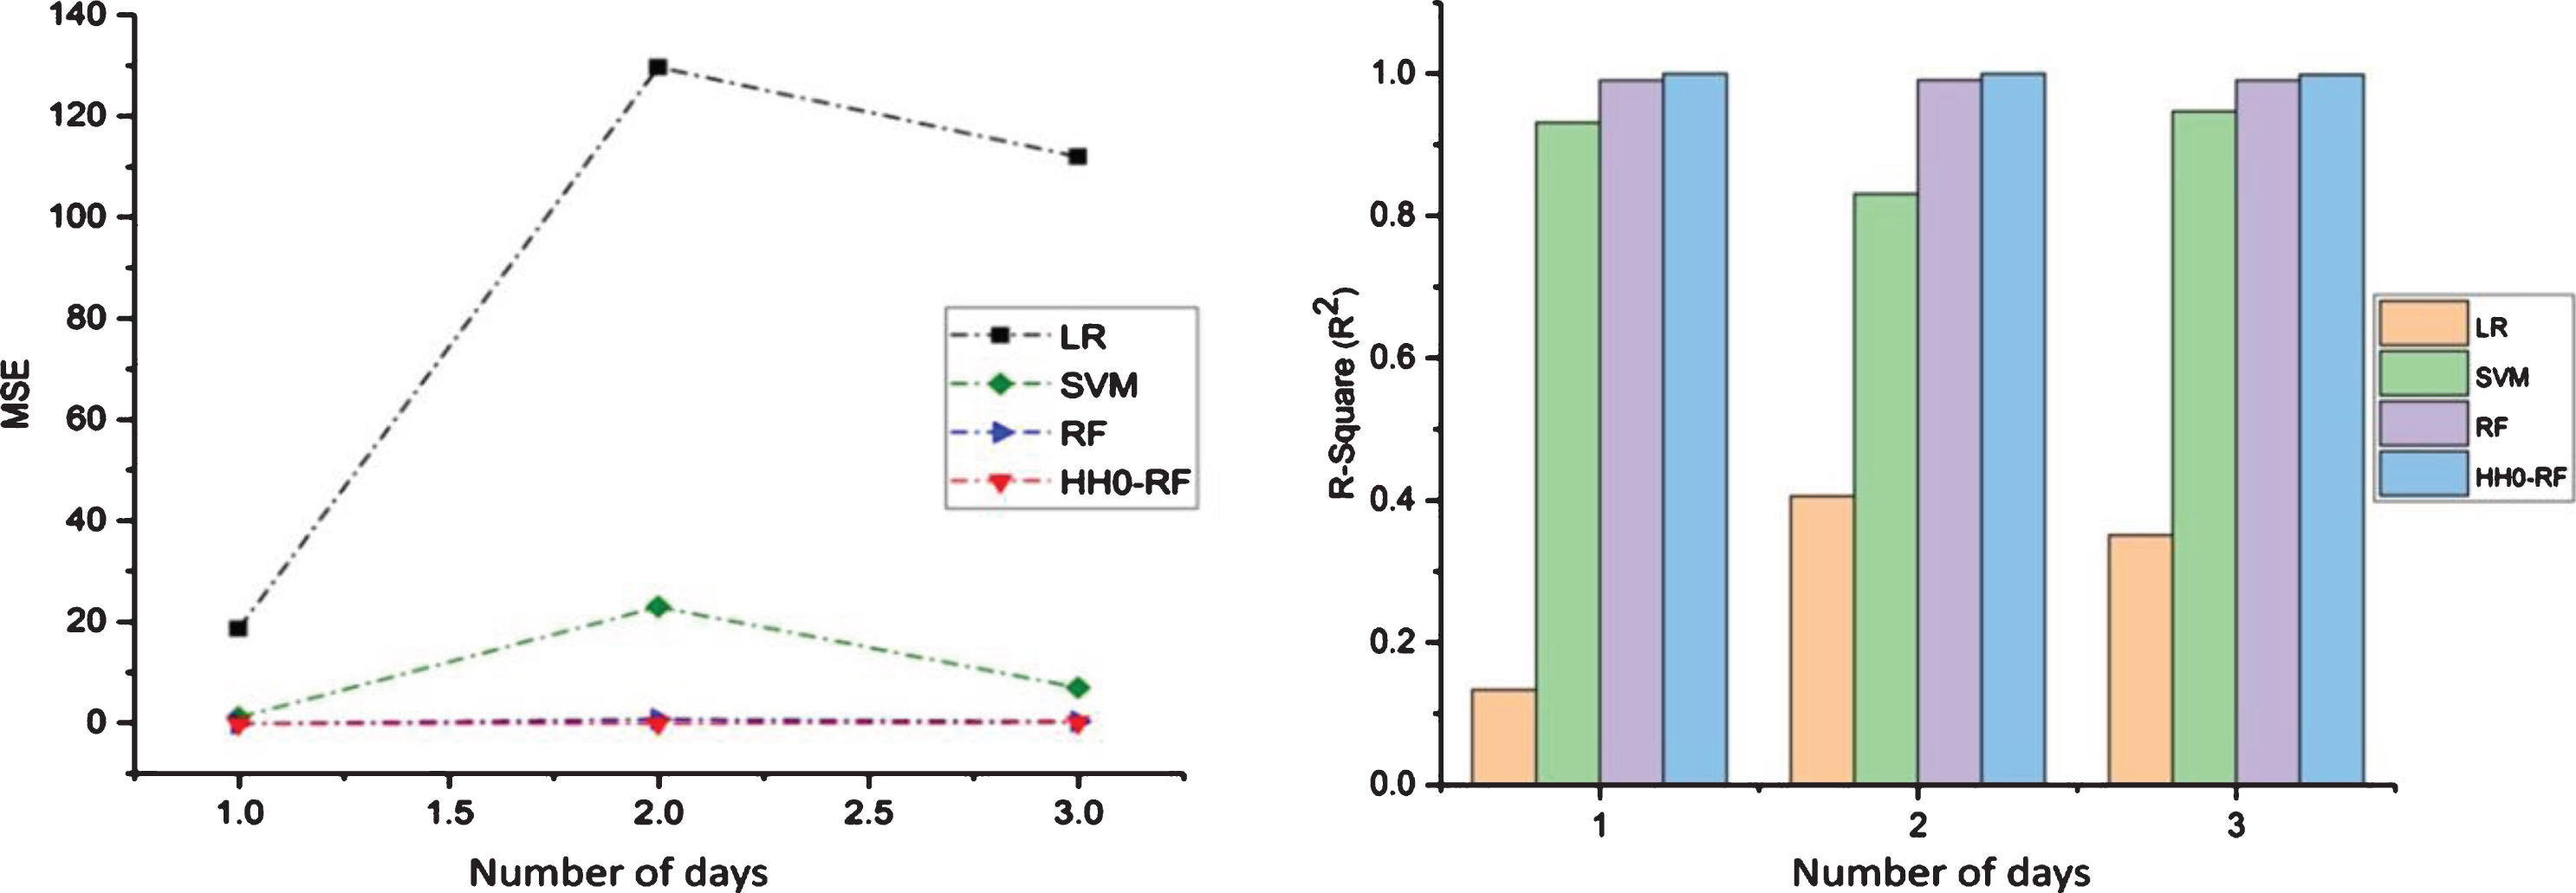
Performance evaluation of surface temperature data predictive model based on MSE and R2.
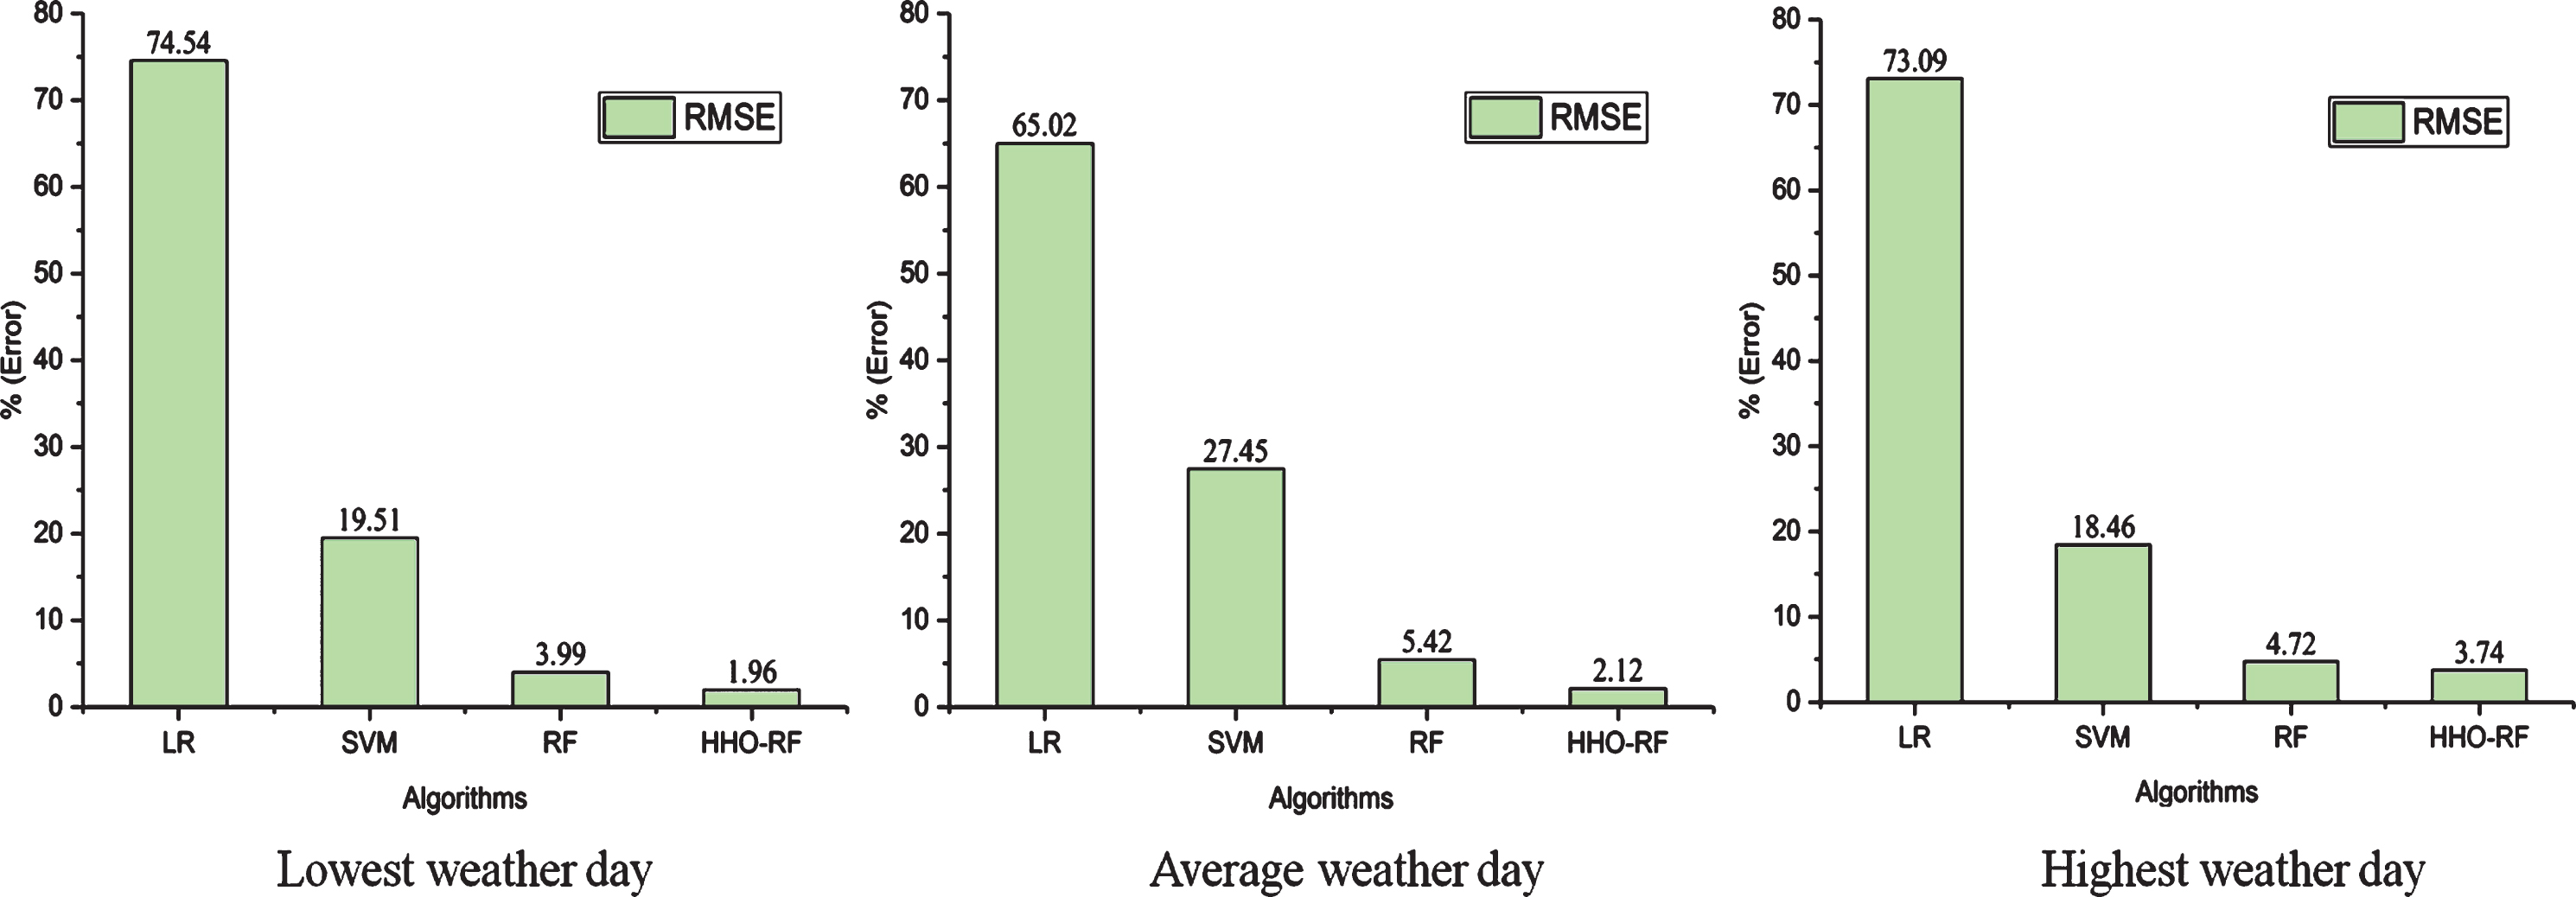
Comparison results of surface temperature with different algorithms based on RMSE.
Figure 22 displays the performance evaluation of the experimental data and predicted values of surface temperature. It indicates that predicts the accurate data and evaluates the performance metrics using the different model parameters. This experiment was demonstrated on three different days in July-2019. The proposed HHO-RF model provides minimum error value and efficient R2 Value. It provides a coefficient of determination (R2) values is nearest to 1; the proposed HHO-RF model is more efficient and successful. In this experiment, the statistical analysis of the proposed HHO-RF data prediction model is illustrated in Table 7.
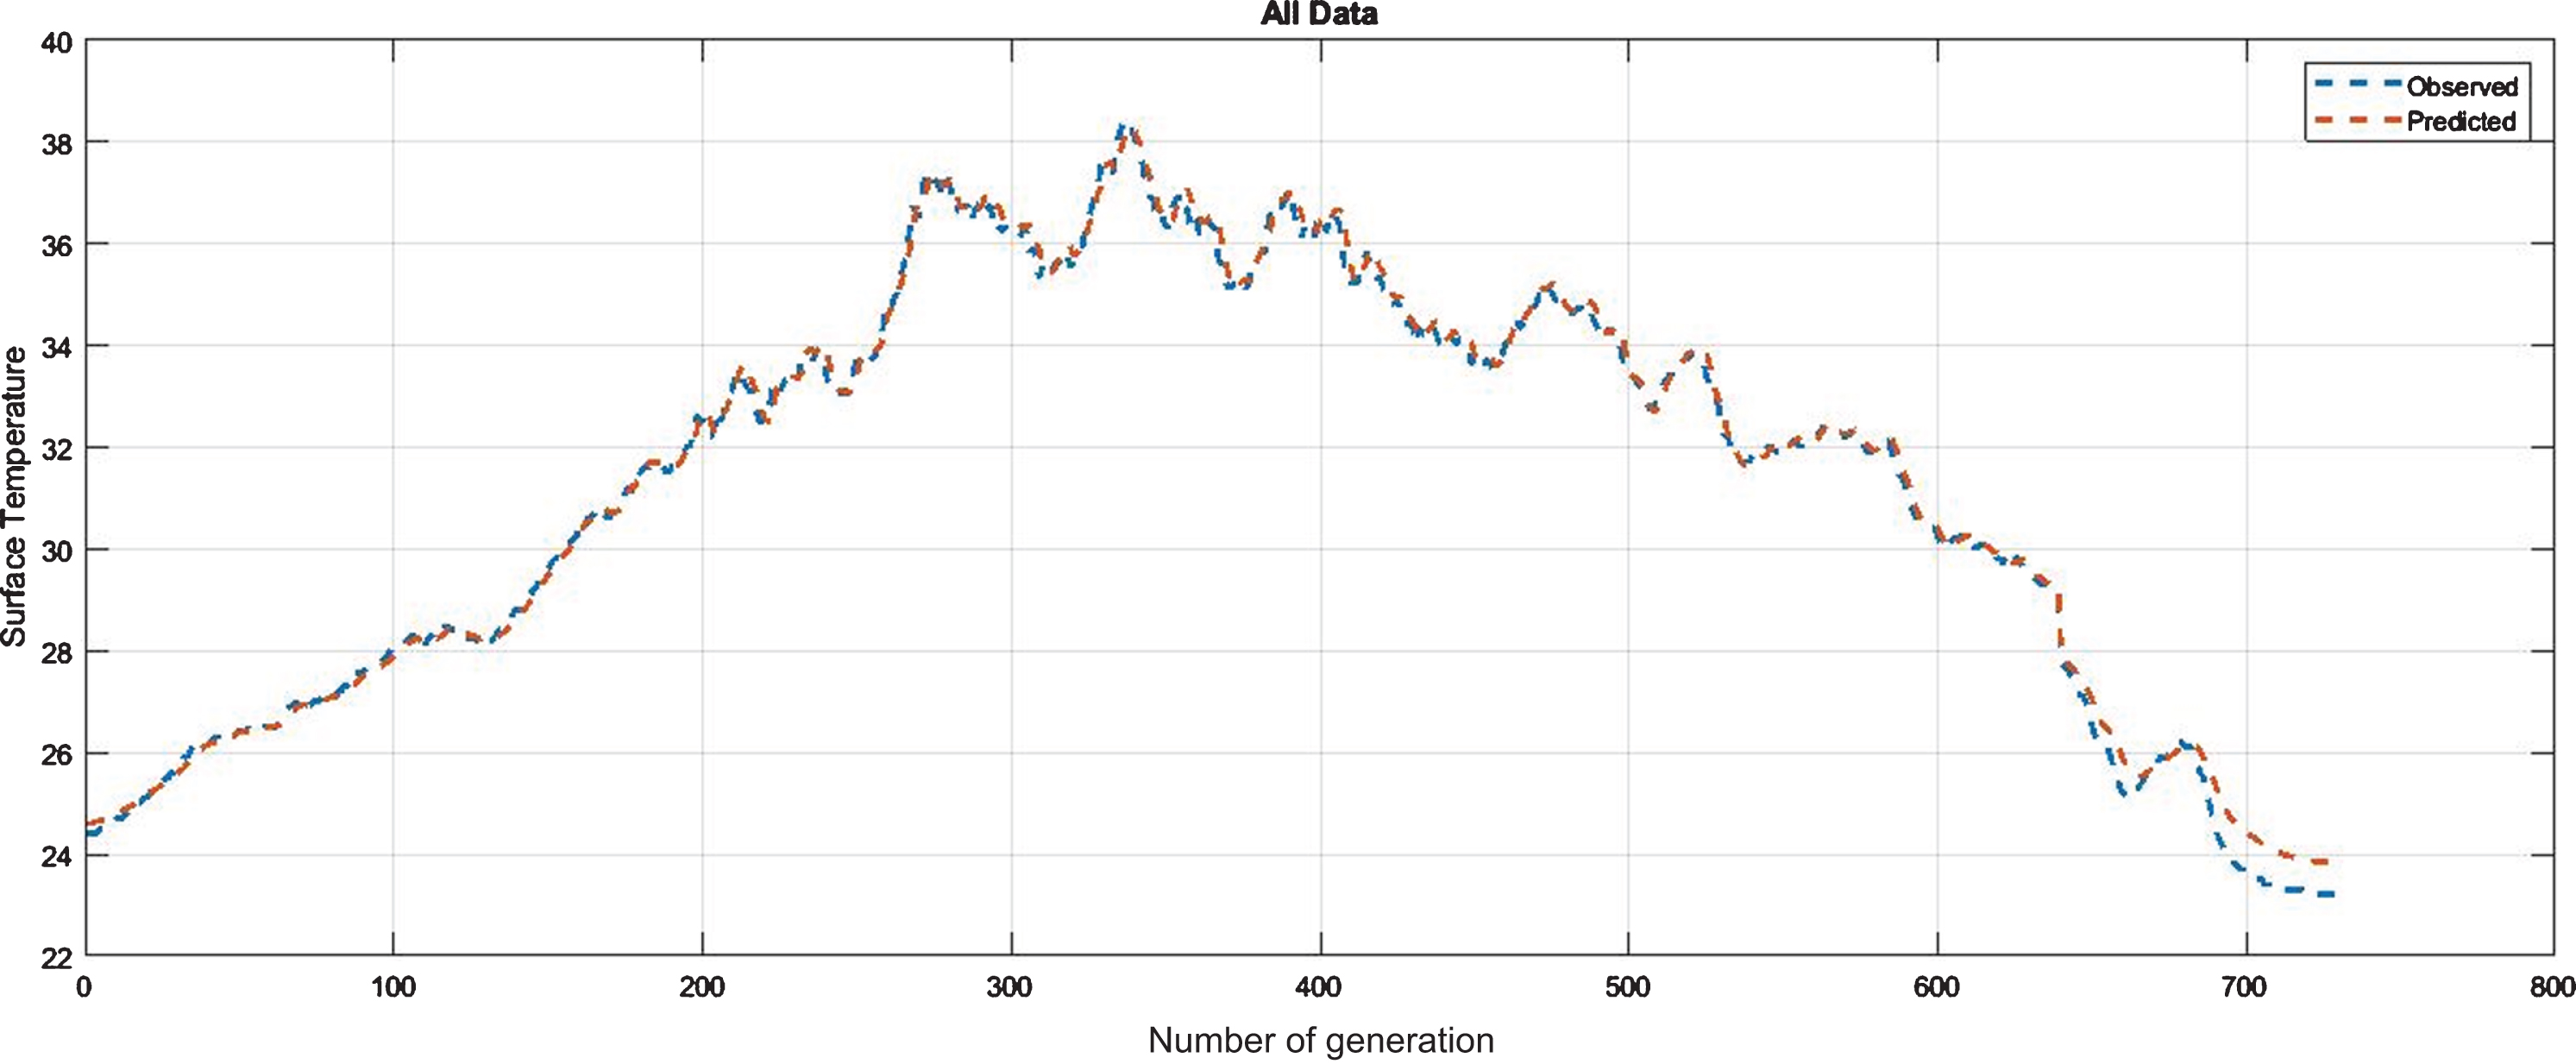
HHO-RF data prediction model of surface temperature during lowest weather day.
Statistical Analysis of the proposed HHO-RF Model
The second experiment was performed by randomly splitting the entire data set into a training dataset (85%) and a testing dataset (15%). Each parameter contains 780 samples of the dataset on July 15th was taken into account in this work. Recently, the Long Short-Term Memory method (LSTM) [8] has been used to predict solar radiation. The experiment aims to compare the accuracy of forecasting the weather data with the proposed HHO-RF with the existing LR, SVM, Random Forest and LSTM models. The LSTM network algorithm was implemented for data prediction. In the LSTM network, the hidden neurons were set to 30, and the maximum number of iteration is 500. The starting layer with a linear activation function had a neuron and the maximum epochs were set at 100. The comparison results are presented in Fig. 23 and Table 8.
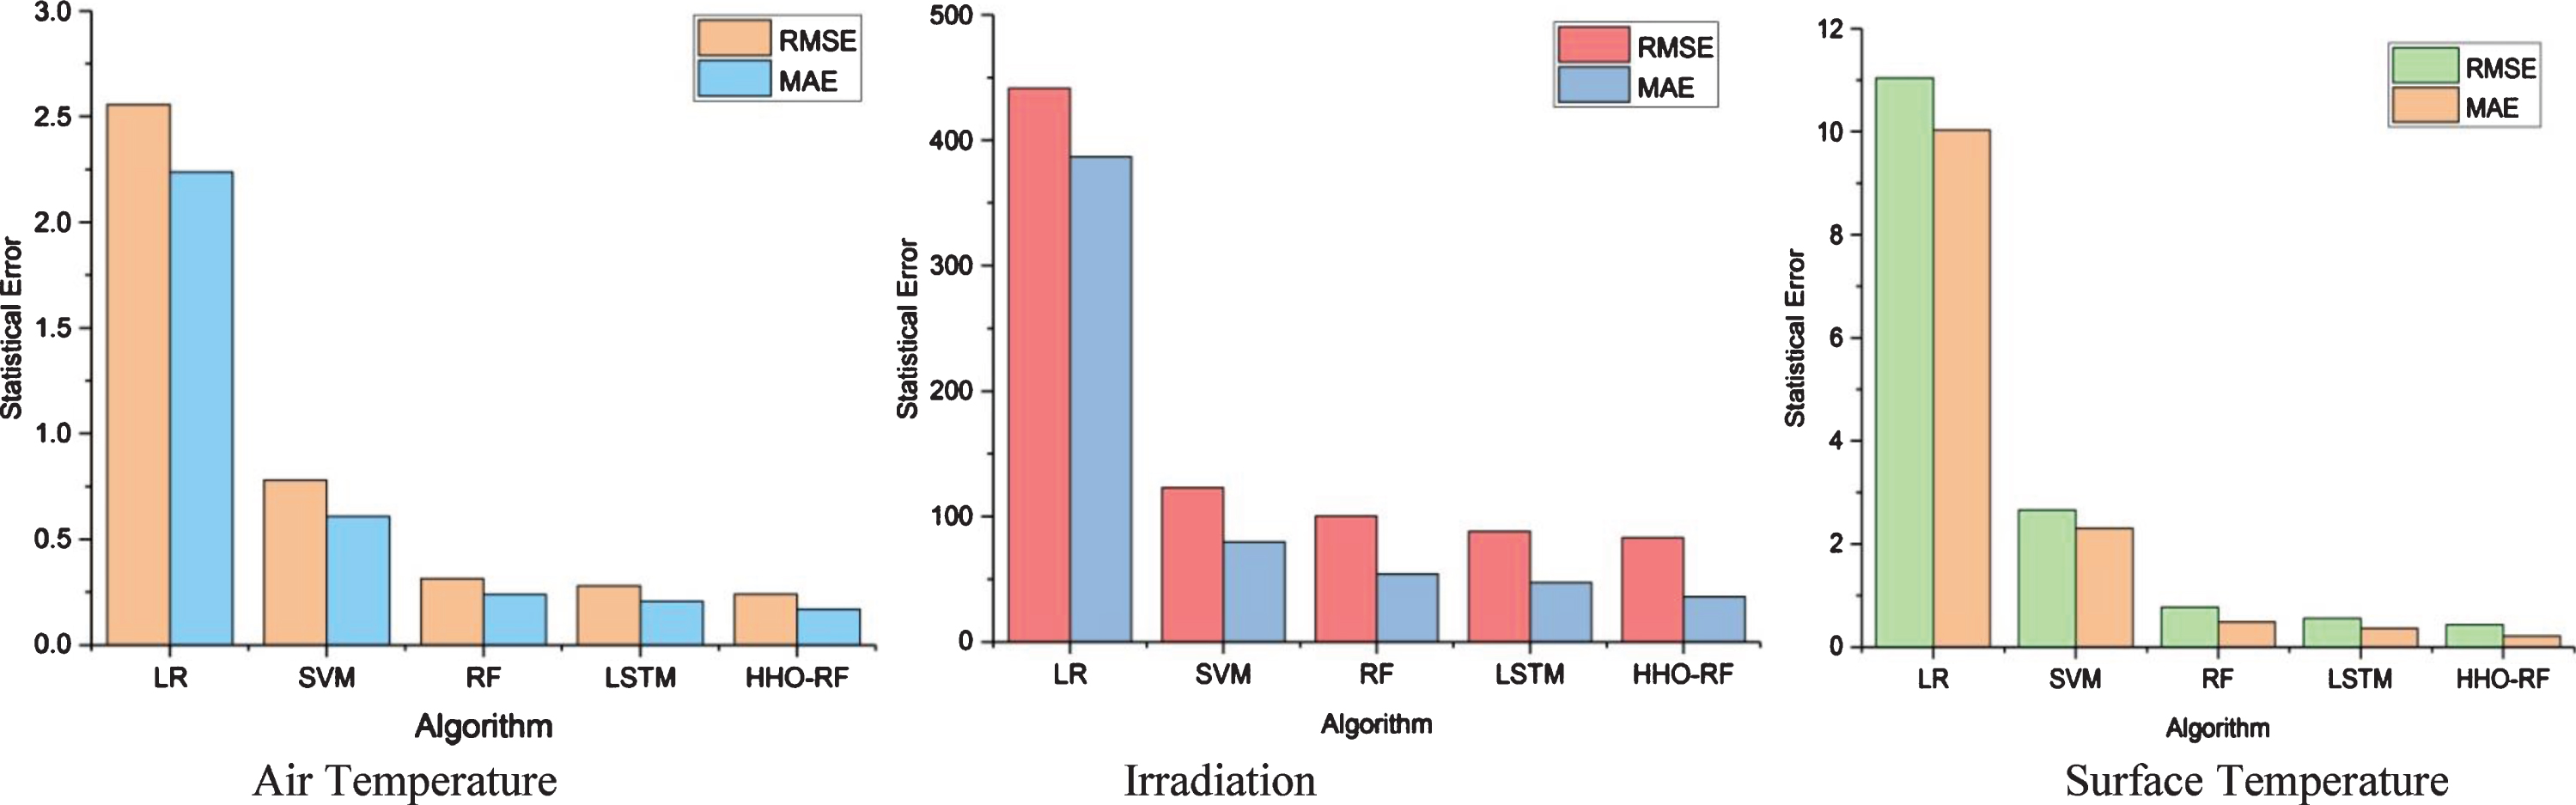
Statistical performance evaluation of the proposed model with an existing algorithm.
Performance of HHO-RF prediction model compared with existing work on July 15th
The RMSE of the predicted irradiance values using the LR, SVM, RF, LSTM, and HHO-RF model were 441.38(W/m2), 122.95(W/m2), 100.45(W/m2), 88.076(W/m2), and 83.189(W/m2), respectively. The MAE of the predicted irradiance values using the LR, SVM, RF, LSTM, and HHO-RF model were 386.71, 79.641, 54.237, 47.409, and 36.197, respectively. For air temperature, the MAE value is equal to 2.2376, 0.6081, 0.2386, 0.2067, and 0.1689 for linear regression, SVM, RF, LSTM, and HHO-RF model, respectively. Besides, the RMSE for the HHO-RF (0.2398) is smaller than the RMSE obtained by LR (2.5562), SVM (0.7806), RF (0.3141), and LSTM (0.2801), respectively. For surface temperature, the MAE value is equal to 10.028, 2.3086, 0.4881, 0.3671, and 0.2142 for linear regression, SVM, RF, LSTM, and HHO-RF model, respectively. Besides, the RMSE for the HHO-RF (0.4348) is smaller than the RMSE obtained by LR (11.041), SVM (2.6582), RF (0.7694), and LSTM (0.5537), respectively.
Figures 24–26 depicts the convergence curve of predicted versus observed data prediction model using air temperature, irradiation and surface temperature. From these comparison curves, it can be seen that time-series weather data predicted by HHO-RF comes closest to the targeted observed data. The proposed algorithm forecasts are more in line with observed data and the residual errors are minimal compared to the existing approaches. LSTM method requires many resources, needs high memory and computation time is more for the training process. The lowest value of RMSE and MAE was slightly improved over the LSTM model [8]. The statistical analysis of the HHO-RF prediction model is tabulated in Table 9. Also, the HHO-RF model is faster than RFs models in terms of computation time. The minimum computation time of HHO-RF, RF and LSTM algorithm is 5.263 s, 8.537 s and 12.0853 s. The proposed hybrid model provided the reasonable prediction accuracy of the suggested HHO-RF over existing algorithms from the state of results.

Convergence curve of the HHO-RF prediction model using Air temperature.

Convergence curve of the HHO-RF prediction model using irradiation.
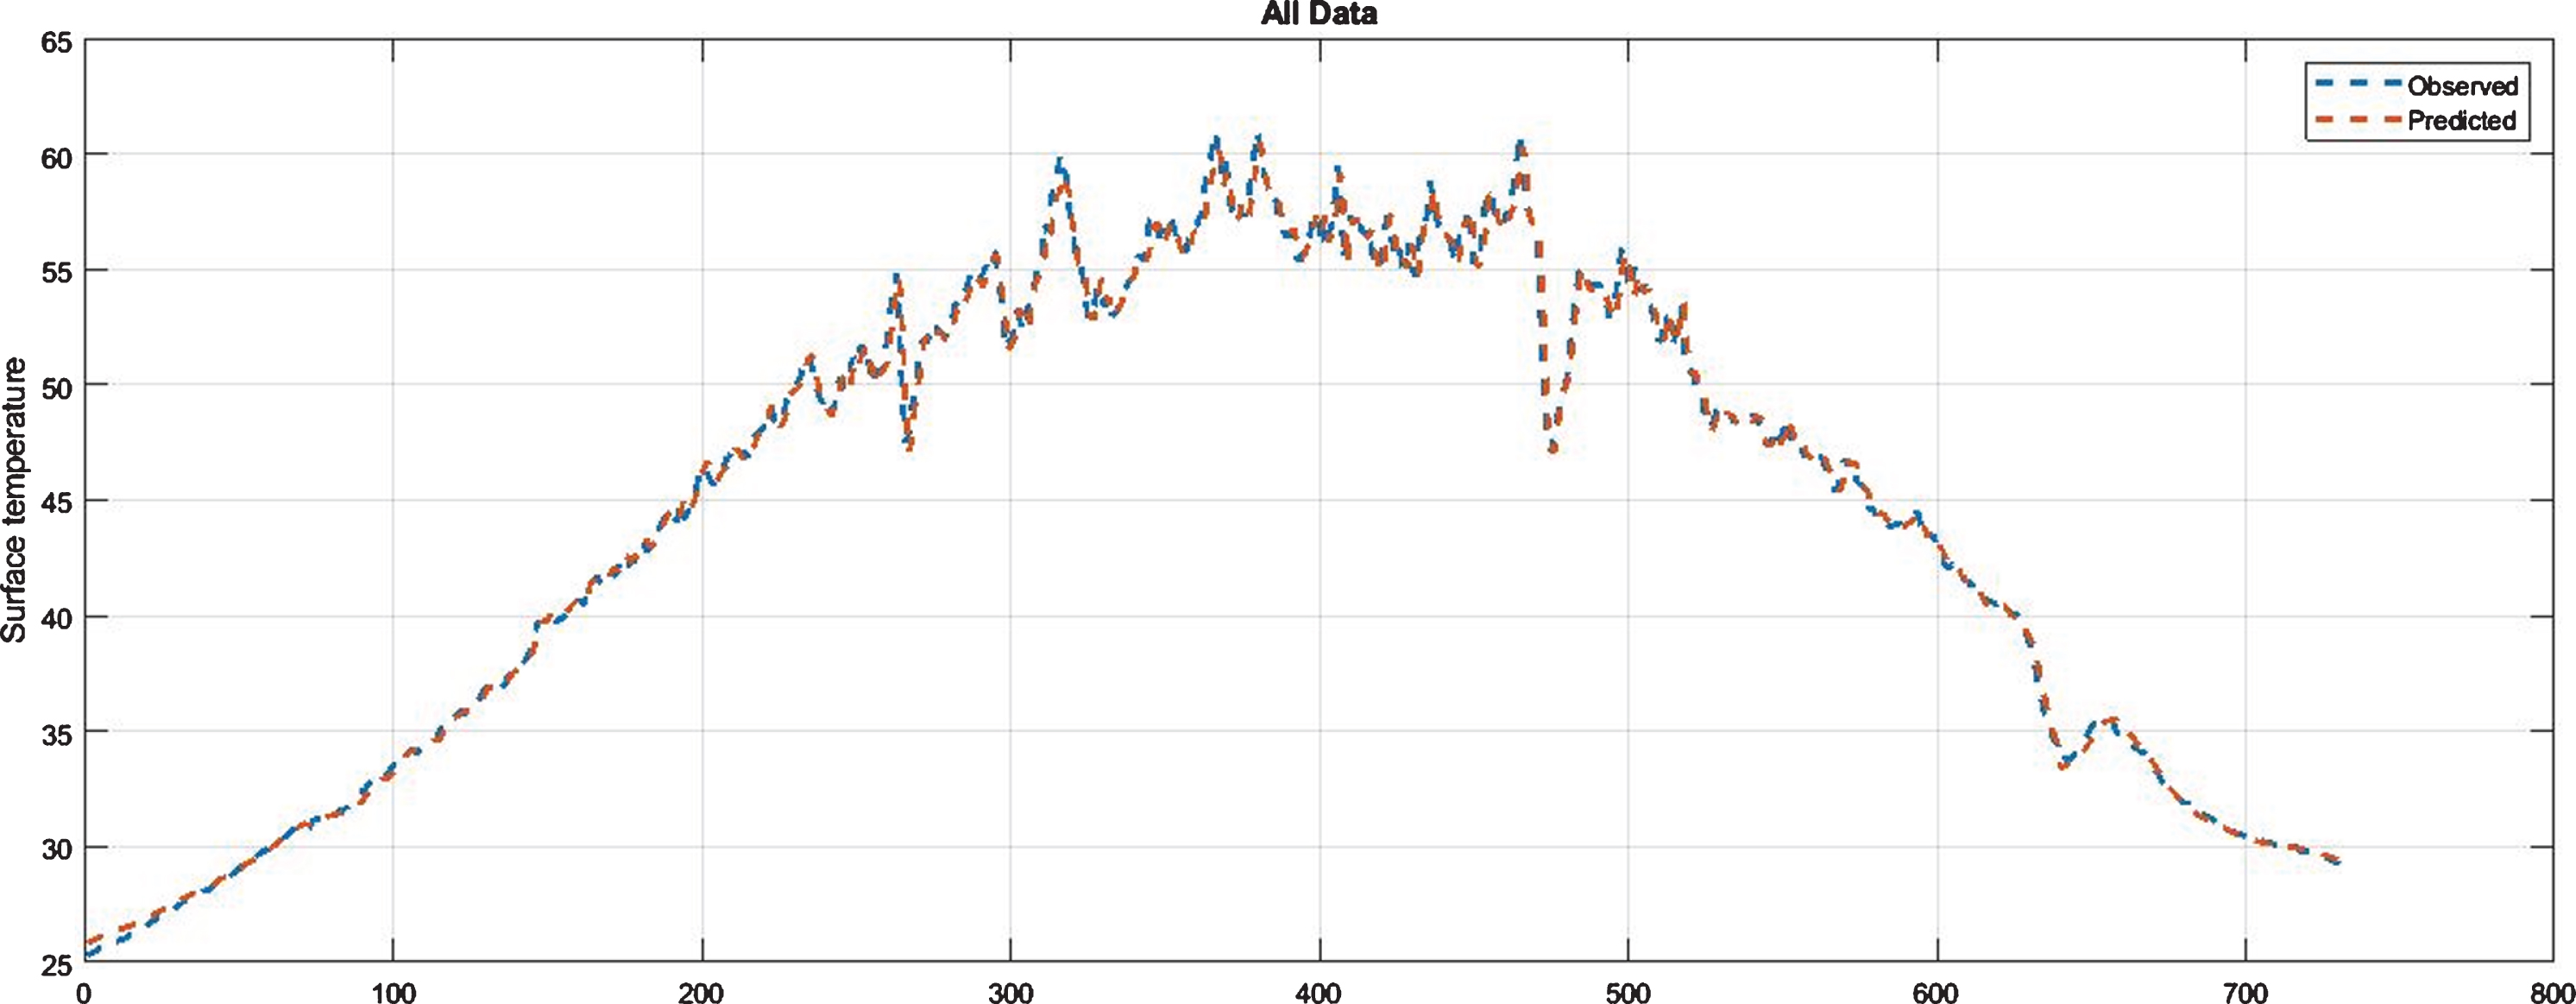
Convergence curve of the HHO-RF prediction model using surface temperature.
Statistical analysis of the proposed HHO-RF model
In this work, a novel hybrid HHO-RF approach has been proposed to predict weather data efficiently. The HHO model is to finds the optimal solution for the Random Forest model. The suggested model evaluates and analyzes the prediction accuracy of an improved RF algorithm using the Harris Hawks Optimizer. It was evaluated and compared results with three different algorithms using various evaluation factors such as MSE, MAE, R2 and RMSE. The first experimental work has been demonstrated by three different weather days, such as the lowest weather day, Average weather day, highest weather day. During the highest weather day, the HHO-RF model obtained the result that RMSE, MAE and R2 were 0.26336(6.92%), 0.17881(5.56%) and 99.89% of Air temperature, 141.7(15.59%), 32.53(5.79%) and 91.02% for Solar irradiation, 0.54068 (3.74%), 0.2553(2.08%) and 99.7% of Surface temperature, respectively.
In the second experiment, the HHO-RF algorithm has the maximum accuracy of prediction compared to the LR, SVM, RF and LSTM. For HHO-RF, the obtained MAE and RMSE were 36.197 and 83.189 for irradiation, 0.2398 and 0.1689 for air temperature, 0.4348 and 0.2142 for surface temperature, respectively. For all weather datasets, the developed HHO-RF model of RMSE and MAE is a minimum error, suitable prediction bias and high prediction accuracy compared to LR, SVM, RF, and LSTM algorithms. Therefore, it is suggested to use an HHO-RF model that has been initiated to predict accurate weather data in WSN applications. The proposed data prediction method helps to minimize network traffic and improve the network’s lifetime in wireless sensor network applications. The prediction PV plant solar irradiation is essential to reduce the energy cost and enable suitable PV plant integration in smart grid applications. The accurate prediction of PV plant weather data is beneficial to estimate the PV plant Power generation. In the future, the prediction will be further upgraded by initiating novel optimization and deep learning-based algorithm to enhance speed, accuracy and prediction ability.
Conflicts of interest
The authors declare no conflict of interest.
Footnotes
Acknowledgments
Tamil Nadu solar power plant facilitated this research work for the availability of laboratories and equipment in Karur and the Next Generation Internet of Things and Artificial Intelligence Laboratory, ACGCET, Karaikudi; the authors wish to thank the manager of the solar plant, Er. Ravi and staff members for the services provided at the solar power plant.