
Abstract
Identifying defective design elements is a prerequisite for design improvements. Previous identification methods were implemented in the context of static customer requirements (CRs). However, CRs always evolve continuously, which easily leads to a failure of existing product functions in fulfilling customer expectations; this, in turn, can lead to a decline in customer satisfaction. In this study, the phenomenon is termed as ‘function obsolescence’, and a data-driven identification approach for obsolete functions is proposed for design improvements. Firstly, product operating data are employed to construct the observing parameters of functional performance (OPs), and based on the distribution of OPs, the desired level of functional performance (DL) is defined to quantitatively characterise CRs. Secondly, the time series of DL is constructed to embody the evolution of CRs, in which a Sigmoid-like function is employed to establish a dissatisfaction function. With the time series, an obsolescence index measuring the severity of obsolescence for each function is defined to identify obsolete functions. A case study was implemented on a smart phone to identify its obsolete functions to demonstrate the effectiveness of the proposed methodology. The results show that some potentially obsolete functions can be identified by the proposed method considering the evolution of CRs.
Keywords
Nomenclature
The number of product functions The jth product function The relative importance of F
j
The function module which is the carrier to realize F
j
The observing parameter of F
j
The mean of the distribution of performance data The standard deviation of the distribution of performance data The actual level of function performance The basic expectation level of function performance The ideal expectation level of function performance The coefficient of standard deviation The number of sub-cycles The tth sub-cycles The dissatisfaction index The area of the region of the EE The area of the region of the IE The coefficient of the Sigmoid-like function The DL at C
t
The dissatisfaction index at C
t
The obsolescence index of F
j
The change rate of the dissatisfaction index for F
j
at C
t
The criticality of the dissatisfaction index for F
j
at C
t
The weight of The weight of The t-1th sub-cycles The dissatisfaction index of F
j
at C
t
The dissatisfaction index of F
j
at Ct-1 The evolvability of the CR on F
j
at C
t
The DL of F
j
at C
t
The DL of F
j
at C1 The threshold of the obsolescence index The total RAM occupation The occupied RAM of active APPs The occupied RAM of inactive APPs The required CPU score The CPU utilization The multi-core score The daily accumulative power consumption The remaining capacity of battery at 0 a.m. per day The remaining capacity of battery at 24 p.m. per day The number of times that the battery is charged per day The remaining capacity of battery at the end of the ith charge The remaining capacity of the battery at the beginning of the ith charge The accumulative storage occupation per month The occupied storage per month The released storage per month
Introduction
Modern design activities primarily concentrate on redesigning the existing products to improve product reliability and customer satisfaction. The identification of pivotal design elements is a prerequisite for design improvements. Previous studies on this subject have primarily focussed on identifying the weak links affecting the product quality or cost [1, 2], degraded product performances [3, 4], components with high failure risks [5], or important product components or features related to customer requirements (CRs) [4]. The CRs are the essential driving force for any product development. An ideal product development solution should satisfy or exceed the customer expectations and even create new CRs [6]. However, with the advances in science, technology, and economy, CRs are continuously evolving. This generally, could lead to a failure of the existing product functions in fulfilling the customer expectations and consequently, a decline in customer satisfaction. This phenomenon caused by the evolution of the CRs is termed as ‘function obsolescence’. Therefore, it is reasonable that the identification of obsolete functions for design improvements, which has been rarely focused on in the existing research, is very significant.
The analysis of customer expectations is the premise and foundation for modelling the evolution of CRs. Traditionally, customer expectations are commonly collected by questionnaires, telephone interviews, customer reviews [7, 8], market surveys, or other means of obtaining the ‘voices of customers’ [9]. The customer expectations, thus obtained, are qualitative and they only explain what performance is desired of a product; in other words, they state what performance the product should deliver [10]. The existing methods are unable to quantitatively determine the desired level of a product’s functional performance (DL). Fortunately, with the extensive application of advanced technologies, such as product embedded information devices [11, 12], smart sensors, and wireless telecommunication, it is possible to capture the product operating data remotely and continuously [2]. These captured data can objectively provide quantitative product usage profiles, from which some inspirations can be drawn to analyse the DL.
Motivated by the foregoing discussions and analysis, a data-driven approach to identify obsolete functions of products is proposed in this study. The methodology comprises the following steps: Firstly, the observing parameters of the functional performance (OPs) are constructed, based on the product operating data. After fitting and estimating the distribution of the performance data by using the maximum likelihood estimation (MLE), the DL is defined as an interval value that helps quantitatively analyse customer expectations and characterise the CRs. Secondly, the service cycle of a product is divided into several sub-cycles, and a time series of the DLs is constructed to embody the evolution of the CRs. In this process, a dissatisfaction index is proposed to measure the relationship between the performance level and customer dissatisfaction. Next, the criticality and the change rate of a dissatisfaction index, and obsolescence index of the function are defined. Based on the obsolescence index, the obsolete functions are identified. Finally, to demonstrate the effectiveness of the proposed method, a case study is conducted to identify the obsolete functions for a smartphone.
The remainder of this article is organised as follows. In Section 2, the literature related to this study is reviewed. In Section 3, the developed approach is introduced in detail. Section 4 describes the case study and illustrates the effectiveness of the proposed approach. Section 5 presents the conclusions and directions for future research.
Literature review
As this study aims to identify the obsolete functions for design improvements, the state-of-the-art for design element identification is briefly introduced in Section 2.1. Additionally, as the analysis of customer expectations is the premise and foundation for modelling the evolution of the CRs, the research on the analysis of the same is reviewed in Section 2.2. The MLE is the most common parameter estimation method, which is closely related to the analysis of customer expectations. The current application of the MLE is presented in Section 2.3.
Identification of design elements for improvement
To improve customer satisfaction, some pivotal design elements should be identified in the existing products before considering their design improvements. Yu [13] developed a negative logarithm likelihood as a health evaluation index, based on the Gaussian mixture model (GMM) to evaluate the degradation of the bearing performance. Liu et al. [14] proposed a new failure mode and effects analysis (FMEA) model for a steam valve system, based on a fuzzy-directed graph, and some corrective actions and modifications were recommended according to the ranking of the failure modes. Shin, Kiritsis, and Xirouchakis [2] proposed an identification method for high-defect design parameters that affect the product quality by using the product usage data in a closed-loop product lifecycle. Ma et al. [15] used the Kullback–Leibler divergence as a performance degradation index to identify the degraded product functions for design improvements by analysing the time-dependent product usage data, based on the GMM. Ma, Chu, and Li [16] proposed a redesign index from the perspectives of the CRs and product reliability to identify the to-be-improved components, based on a fuzzy quality function deployment (QFD) and FMEA. The identification of the aforementioned design elements, such as problematic product functions or components, can effectively help designers make decisions on improving the product reliability and quality, thereby improving the customer satisfaction as well.
Additionally, some researchers have directly identified the design elements related to CRs, the improvement of which is more likely to meet the CRs and improve customer satisfaction. For example, based on a fuzzy preference relation and the fuzzy majority, Yan and Ma [17] proposed a novel two-stage group decision-making approach that considers human subjective perception and customer heterogeneity to identify key design requirements. Smith, Smith, and Shen [18] proposed an integrated important index to identify the important components for a given redesign task, considering the CRs. Dou, Li, and Nan [19] proposed an identification method for dynamic CRs based on the benchmarking theory and optimised grey model to improve the product function. Jin, Ji, and Liu [20] prioritised the engineering characteristics (ECs) according to the customers’ online reviews, which could help designers determine the key ECs that have a significant impact on customer satisfaction. Similarly, Jia et al. [21] integrated a multi-level hierarchical structure into a QFD to quantify the degree of importance of the ECs. Zhang, Chu, and Xue [8] identified the to-be-improved product features for product optimisation based on customer feedback data obtained from online reviews. The previous research, identifying the design elements related to the CRs, made an implicit assumption that the CRs were static and thus, they did not consider the evolution of the CRs. Evolving CRs can give rise to an unacceptable deviation between the actual and desired performances of product functions. The more the actual performance deviates from the desired performance, the greater the probability that the product will not meet the CRs, consequently resulting in a sharp decline in the customer satisfaction.
Analysis of customer expectations
Customer expectations are defined as the performances desired by the customers for a product; they clearly enumerate what performance that product should deliver [22]. Presently, researchers generally agree that customer expectations are hidden in the ‘voices of customers’. The customers usually express their personal requirements or opinions on products via the Internet or communications with the designers. Therefore, some researchers have attempted to explore the customer behaviours, preferences, and habits based on questionnaires, online reviews, and market surveys; this has helped them analyse the customer expectations. Anh, Nagai, and Minh [23] presented a supportive framework for designers to extract user requirements from websites for product design. Li, Jin, and Li [24] defined a key requirement index combining the satisfactory and dissatisfactory utility values of the ECs to identify critical CRs from online reviews. Fang et al. [25] proposed a novel algorithm based on Bi-max and Rep-Bi-max to identify heterogeneous CRs from the perspective of local pattern detection. In addition, product recommendation systems are often employed to obtain the most accurate predictions of the users’ preferences [26–28]. The above researches can only analyse the functional performances or features expected by the customers, and fail to further determine the DL. However, accurately eliciting the DL plays an important guiding role in product design. Taking a smartphone as an example, designers can use data mining technology to extract customer expectations from customers’ online reviews; the customers expect that the smartphone should be equipped with a powerful storage and long battery life. However, the designers cannot specifically determine how much storage space is required to meet the usage requirements of the individual users and how much battery capacity can support their long-term work.
Applications of MLE
As an important parameter estimation method, the MLE has been widely used in medicine, mechanics, economics, and other fields in recent years. For example, Huub et al. [30] used MLE to predict the residual life expectancy of screen-detected breast cancer patients in different age groups and estimate the related probability of patients succumbing to breast cancer. Zhou and Zhao [31] used MLE to estimate the default probability under different credit-derivative prices. Zhao et al. [32] applied MLE to assess the life and reliability of electronic equipment under operating stress. Pinto, Pujol, and Jr [33] used MLE to estimate the free parameters of the Weibull and lognormal distributions, when estimating the fatigue life of mechanical components under step-stress conditions. Bo et al. [34] used MLE to estimate the position of a person, as captured by each smart camera in a multi-camera system, and thus, track multiple persons in such an environment. From the aforementioned applications in different fields, MLE is characterised by wide applicability and asymptotic normality. It is reasonable to select the MLE methodology for data processing and parameter estimation for quantitatively analysing customer expectation in this study.
In summary, the evolution of CRs was not considered in the previous identification methods for design improvements, and the analysis of customer expectations was only qualitative, thus lacking further quantitative analysis. Therefore, to compensate for the shortcomings of the previous studies, a data-driven approach to identify obsolete functions considering the evolution of CRs is proposed in this study, in which the customer expectations are appropriately quantified.
Methodology
The proposed data-driven approach, which aims to identify the obsolete functions for design improvements, comprises two phases, as shown in Fig. 1. In the first phase, the DL is determined based on the distribution of the performance data. In this phase, according to the characteristics of the functional performance, the main OPs are first constructed from the product operating data to reflect the related CRs. Then, the MLE is employed to estimate the distribution of the performance data, and the DL is defined as an interval value based on the estimated performance distribution. In the second phase, two major tasks are conducted: (i) construction of the time series of the DL and (ii) identification of the obsolete functions. Firstly, the time series of the DL is constructed to embody the evolution of the CRs. In this process, a dissatisfaction function is built to calculate the dissatisfaction index resulting from the discrepancy between the actual and desired performances. Then, the criticality and change rate of the dissatisfaction index are defined. Finally, the obsolescence index is defined to synthetically measure the severity of the obsolescence for each function, and the obsolete functions are identified according to the value of the obsolescence index.

Technology framework.
Construct the observing parameters of the functional performance
The DL is determined based on the distribution of the performance data. Thus, the premise is to construct the appropriate OPs.
Assume that there are J functions, denoted as F j (j = 1, 2, ... , J), and the relative importance of F j is denoted as ω j . Module M j is a carrier to realise F j . The main OP, that is, P j is constructed to reflect the CRs on F j . Taking a smartphone as an example, its daily accumulative power consumption is constructed as the OP to reflect the CR on the battery life. Notably, all the OPs are benefit-type parameters in this study.
Define the DL
According to the definition of the OPs, the corresponding performance data are obtained from the product operating data. The performance data may obey a normal distribution; if it does not, it can be converted into one [35, 36]. Generally, the MLE is used to estimate the parameters of the normal distribution, that is, the mean μ and standard deviation σ [37].
As shown in Fig. 2, based on the distribution of the performance data, several definitions are introduced as follows:
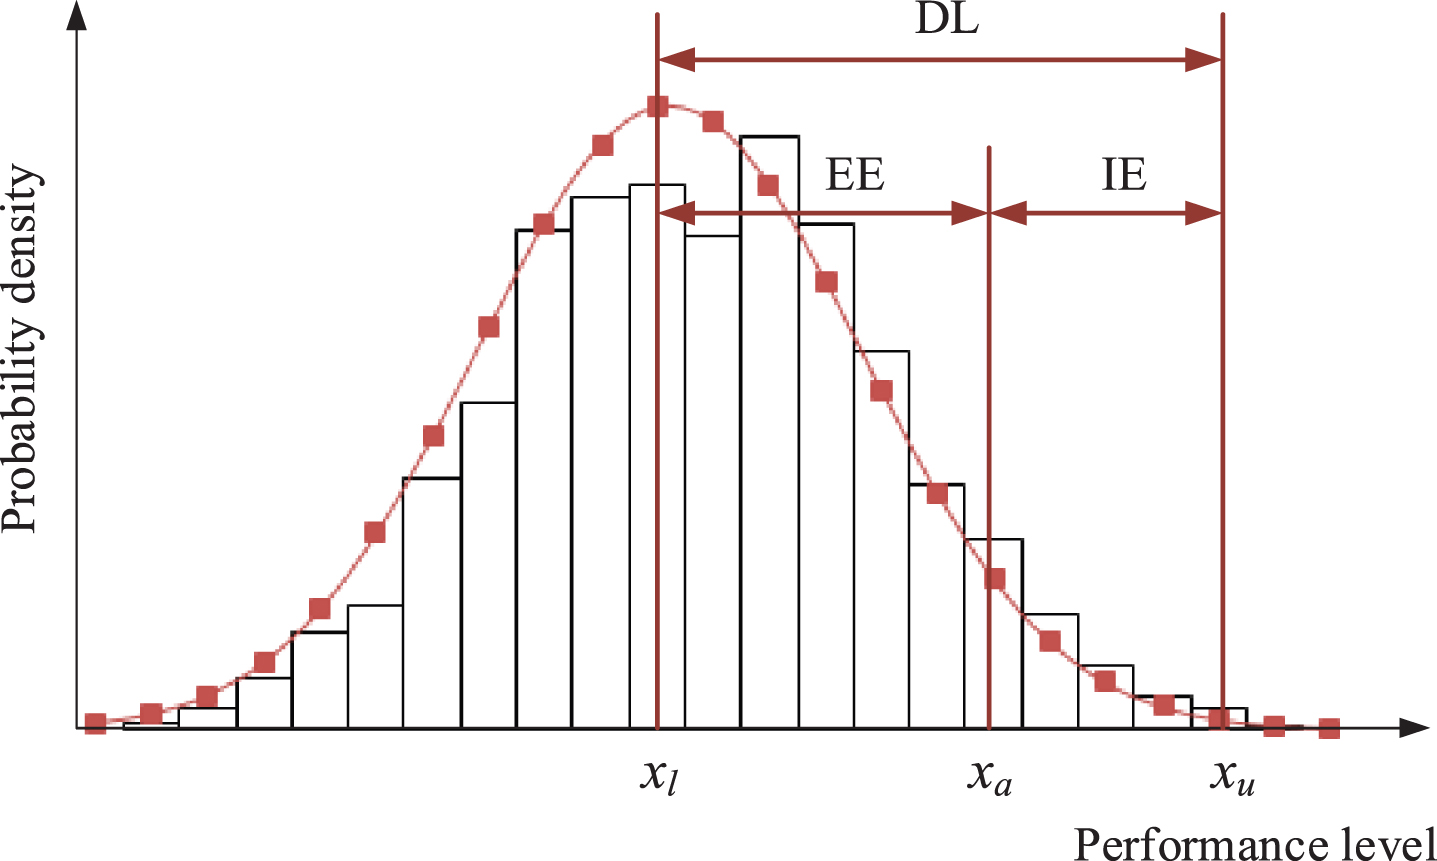
Definition of DL in the distribution of performance data.
Construct the time series of the DL
The CRs on functional performances are embodied by the DL, which will change with the evolution of the CRs. Therefore, we can construct a time series of the DL to analyse the evolution process of the CRs during the service cycle of the product. The construction of the time series of the DL is detailed as follows:
As shown in Fig. 3, although x
a
remains constant in the service cycle of a product, DL changes over time, leading to an increasing deviation between the actual and desired performances. The more the actual performance deviates from the desired performance, the greater the probability of the customers being dissatisfied [10]. To characterise this phenomenon, a non-linear function is built to describe the relationship between customer dissatisfaction and the performance level of the function. The dissatisfaction function is built as the probability that the actual performance fails to satisfy the desired performance, as shown in Fig. 4. Therefore, the dissatisfaction index is calculated as:

Evolution of a CR in the service cycle of a product.
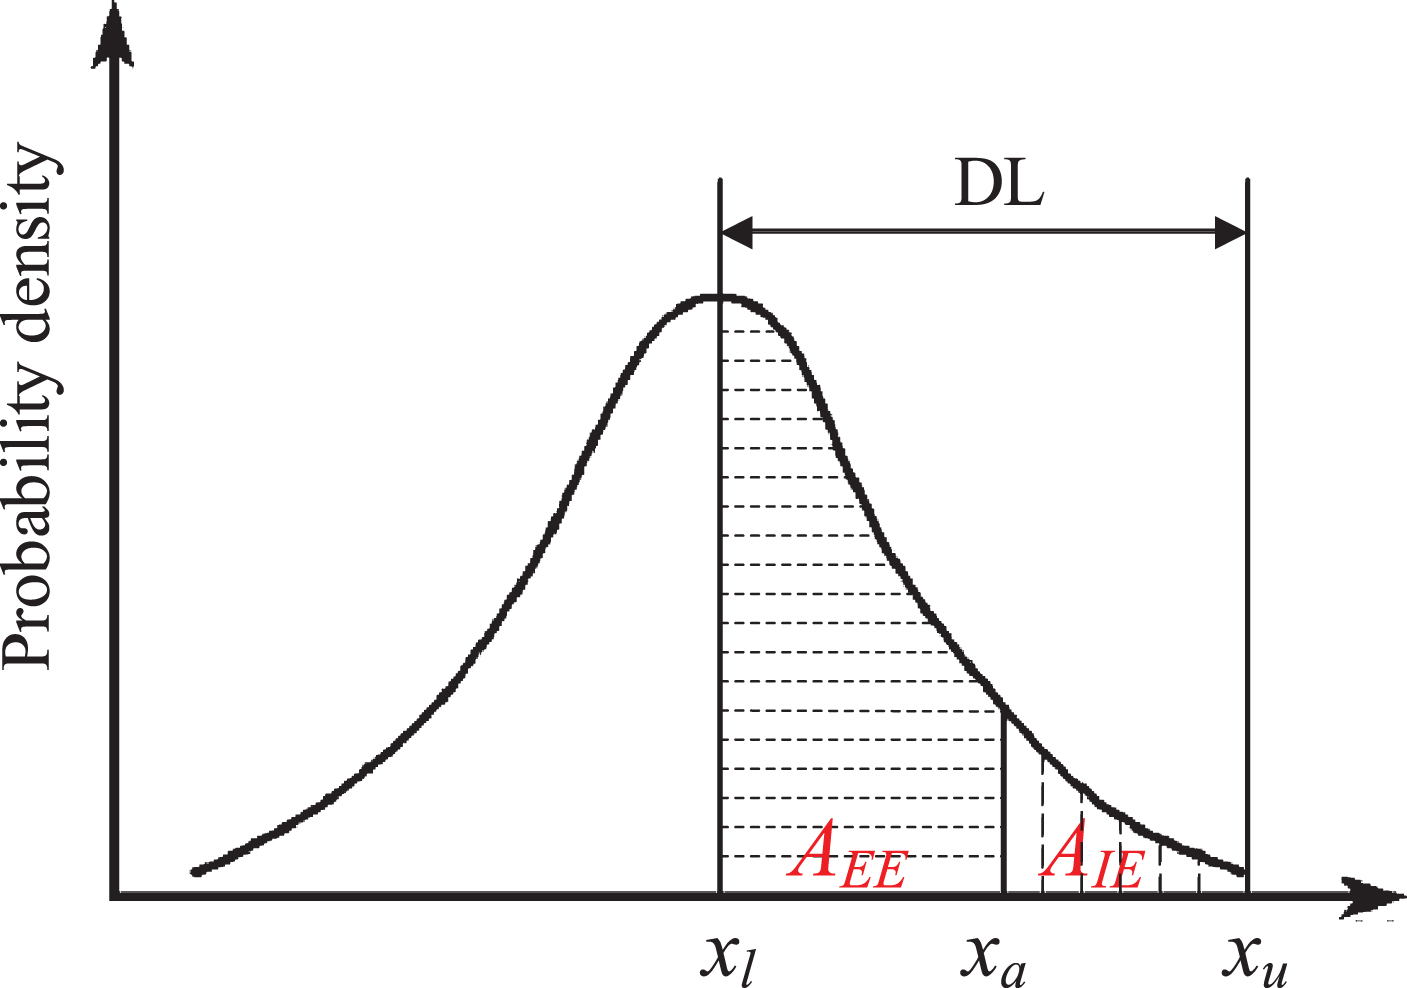
Illustration of the dissatisfaction function.
For the normal distribution, A
EE
and A
IE
are the cumulative probabilities from x
l
to x
a
, and x
a
to x
u
, respectively. Thus,
Because the cumulative distribution function of the normal distribution (Φ(x)) is not an explicit elementary function in mathematical statistics [38], it is necessary to find an appropriate explicit function to simplify the calculation of the cumulative probability. Yang et al. [38] suggested an explicit Sigmoid-like function to approximate the cumulative distribution function of the standard normal distribution. Moreover, numerical simulations have demonstrated that the approximation of the Sigmoid-like function to the cumulative distribution function of the standard normal distribution was better than the Fisher z transformation. Therefore, considering the simplicity and accuracy, the Sigmoid-like function (Sig(x)) is employed as the appropriate explicit function in this work to approximate the cumulative distribution function of the standard normal distribution:
For the general normal distribution, Sig(x) is transformed as:
Based on the above two steps, the time series of the DL is constructed as
As shown in Fig. 5,

Time series of DL.
From the time series of the DL shown in Fig. 5, the dissatisfaction index shows an increasing tendency with the fluctuation. According to this, an obsolescence index is defined to identify the obsolete functions as the comprehensive severity of the functional obsolescence in the service cycle of the product, and is calculated as
The change rate of the dissatisfaction index is strongly related to the dissatisfaction index of F
j
at C
t
and Ct-1, and it is calculated as
The criticality of the dissatisfaction index is defined as the sensitivity of the dissatisfaction index to the evolution of CRs. A high sensitivity means that customers may be more dissatisfied with the functional performance with the evolution of the CRs. Namely, the higher the sensitivity, the greater the crisis degree of the function obsolescence might be. Hence,
To identify the obsolete functions, a threshold of the obsolescence index, denoted as O*, should be pre-defined. If O j ≥O*, then F j is selected as the obsolete function. Generally, O* is determined by the decision makers in consideration of the specific features and constraints in the process of design improvement, such as the cost budget and lead time of the redesign. If the enterprise is in the context of a relatively good production and operation, that is, it can provide sufficient design resources for design improvement, a lower O* is selected to identify the obsolete functions. On the contrary, when the enterprise faces difficulty in providing sufficient design resources, a higher O* is selected to identify the obsolete functions that are relatively serious.
With advances in technology, the CRs on smartphones have changed dramatically. Being the most popular communication device, the smartphone is a perfect terminal to continuously collect the users’ real-time data from its functional modules (e.g., RAM and storage). In this case study, the multitasking function, operational function, battery life, and storage function of the smartphone were selected for obsolescence assessment to demonstrate the effectiveness of the proposed methodology.
Define the DL
Construct the OPs
Four functions were determined as the candidate targets, namely the multitasking function, operational function, battery life, and storage function, denoted as F1, F2, F3, and F4, respectively. The RAM, CPU, battery, and storage were the relative carriers to realise F1, F2, F3, and F4, respectively; these were correspondingly named as M1, M2, M3, and M4. The total RAM occupation, required CPU score, daily accumulative power consumption, and accumulative storage occupation per month were constructed from the product operating data to reflect the related CRs on F1, F2, F3, and F4, respectively; these were, in turn, denoted as P1, P2, P3, and P4. The product operating data were collected by an app called ‘Smart Monitor’, which was deployed on the smartphone equipped with an Android operation system. This app can help the designers record various pieces of product operating information. Notably, 200 users were tracked in this case study. The constructions of P1, P2, P3, and P4 are detailed as follows.
(1) P1 —Total RAM occupation
The RAM occupied by active apps on the smartphone (frontstage apps) was collected by Smart Monitor; however, these collected operating data could not accurately reflect the CRs on F1. When the RAM of the smartphone was insufficient, some original frontstage apps would be shut down by the system, or manually turned to be inactive in the background. Therefore, the total RAM occupation was constructed as the OP for F1, and
(2) P2 —Required CPU score
For F2, the CPU utilisation is often considered as a measure of the CPU performance. The CPU utilisation was collected by Smart Monitor with a value ranging from 0% to 100%. For example, when the CPU utilisation reaches 100%, the CPU performance is maximised. For smartphones equipped with different CPU modules, the maximum CPU performances are different. Therefore, the CPU utilisation could not accurately reflect the CRs on F2. To solve this problem, the required CPU score was constructed as the OP for F2, and
(3) P3 —Daily accumulative power consumption
The daily accumulative power consumption was constructed as the OP for F3 to reflect the CR, and
(4) P4 —accumulative storage occupation per month
The occupied storage was collected by Smart Monitor. However, because some files would be deleted by the users when the remaining storage of the smartphone was insufficient, the occupied storage could not accurately reflect the CR. Hence, the accumulative storage occupation per month was constructed as the OP for F4, and
Instances of constructing P1, P2, P3, and P4
The service cycle of this smartphone ranged from June 2017 to May 2019. It was divided into 24 sub-cycles, and each sub-cycle was of one-month duration. Taking the first sub-cycle as an example, after fitting and estimating the distribution of the performance data, the corresponding DLs of F1, F2, F3, and F4 were determined and listed in Table 2.
DLs of F1, F2, F3, and F4 at C1
DLs of F1, F2, F3, and F4 at C1
Taking F3 as an example, the time series of the DL was constructed, as shown in Fig. 6. From Fig. 6, the quantification of customer expectations, that is, the introduction of the DL, could make the CRs for functional performance more intuitive. Moreover, owing to the mathematical representation of the customer expectations, the CR for F3 had undergone significant changes during the service cycle. Meanwhile, the dissatisfaction index also showed an approximate exponential growth trend with the evolution of the CR for F3.

Time series of the DL for F3.

Illustration of the dissatisfaction indices of F1, F2, F3, and F4.
According to the time series of the DL for F3 and Equations (13)–(15), the evolvability of the CR, change rate, and criticality of the dissatisfaction index were calculated and listed in Table 3. For simplicity, in this case study, α j and β j (j = 1, 2, 3, and 4) were both specified as 0.5 by the designers. Then, according to Equation (12), the obsolescence index of F3, that is, O3, was calculated as 6.0634.
Calculation results of
Similarly, the dissatisfaction index and the obsolescence index of F1, F2, and F4 were calculated, shown in Fig. 7 and Table 4, respectively.
Calculation results of O1, O2, O3, and O4
To identify the obsolete functions, the threshold of the obsolescence index was selected as 3 (i.e. O*=3) by the designers. Evidently, F3 and F1 were seriously obsolete, and finally they were identified as the obsolete functions of the smartphone that needed to be improved.
From the viewpoint of engineering practices, the battery is an easy-consumable, which results that the actual performance of F3 was unable to fully meet the CRs in the early stage of the service cycle. Furthermore, with the download and running of more and more apps over time, the requirement for F3 also changed dramatically and rapidly, and the customers were continuously dissatisfied with F3. Similarly, with a gradual increase in the occupied RAM for a single app and the more common phenomenon of the simultaneous running of multiple apps, F1 also failed to meet the evolving CR, and was regarded as an obsolete function.
Two types of identification methods, namely the questionnaire survey and the data-driven method, were established for the comparison analysis to illustrate the advantages of the proposed method. The essential difference between the previous methods and the proposed method is that the latter considered the evolution of the CRs as well.
Comparison with the traditional questionnaire survey method
To validate the results of the proposed identification method, the traditional questionnaire survey method was employed to assess the customer perception of the functional performance.
One hundred smartphone users were invited to respond to the questionnaire. The results of this survey were used to assess the obsolescence of the four functions. Notably, this survey was constructed at the end of the 24th sub-cycle. The questions within the questionnaire were designed as follows:
The users could choose from five candidate answers, namely ‘strongly agree’, ‘agree’, ‘neither agree nor disagree’, ‘disagree’, and ‘strongly disagree’, which were assigned scores of 9, 7, 5, 3, and 1, respectively.
In the survey, the average of the evaluation scores for each function was defined as the corresponding obsolescence degree. A higher average score indicates higher customer dissatisfaction with the relative function. The final evaluation results are shown in Table 5. The ranking order according to the obsolescence degree was F3 > F4 > F1 > F2; furthermore, F3 was identified as obsolete function when the threshold was set to 5.
Results of the survey
Results of the survey
The results obtained by the traditional questionnaire survey method were different from those of the proposed method. In the former, F1 was not identified as an obsolete function. From the raw survey data, most customers thought that their requirements for F1 could still be met to a certain extent. However, in the proposed method, OP1, which was constructed to accurately reflect the related CR, showed that the customer expectation of F1 increased during the service cycle, which resulted in F1 gradually failing to meet the CR. Therefore, F1 could be reasonably regarded as an obsolete function in the proposed method.
Compared with the traditional questionnaire survey method, the proposed method demonstrated several advantages. Firstly, the latter could decrease the subjectivity of customer evaluations inherent in the former. Secondly, the latter could accurately analyse the customer expectations according to the constructed OPs and help identify the potentially obsolete functions. Lastly, the traditional questionnaire survey method was limited by the constraints on time and cost, and these would increase with the number of surveyed users. As of the proposed method, any increase in the time and cost of collecting the performance data caused by an increasing number of users was almost negligible.
In this subsection, the implementations of two data-driven methods were discussed for the comparison analysis. The first method is the fuzzy FMEA-based method proposed by Ma, Chu, and Li [16] for assessing the modification necessities of product functions. The second method is the online review-based method provided by Zhang, Chu, and Xue [8] for identifying the to-be-improved product features according to a redesign index. The results of the comparison analysis are summarized in Table 6.
Results of the comparison analysis
Results of the comparison analysis
As shown in Table 6, the ranking orders of the fuzzy FMEA-based method and the proposed method were significantly different. Both F3 and F1 were considered as obsolete functions in the latter, while only F1 was identified in the former. There are two reasons for these differences. Firstly, in addition to the consideration of the CRs, the failure risk and failure causality relationships between the functions were also considered in the fuzzy FMEA-based method, which gave rise to differences in the ranking orders between the two methods. Secondly, the assessment of the modification necessity in the former was significantly influenced by the subjective and imprecise judgement of the engineers, while the proposed method could provide more objective results by using the product operating data.
From a comparison between the online review-based method and the proposed method, it was observed that only F3 was identified as an obsolete function in the online review-based method, as in this method, the user attention and user orientation were calculated only according to the number of occurrences of the product feature in the customer reviews; however, the evolution of the customer sentiment for the related features was ignored. The evolution of the customer sentiment was hidden in the review data, and it could indirectly reflect the evolution of the CRs. In fact, the customer expectation of F1 increased with the updating of the apps and frequent multitasking during the service cycle. Consequently, F1 was identified as an obsolete function in the proposed method.
In this article, the evolution of the CRs was first factored into the identification of obsolete functions. The consideration of the evolution of the CRs could effectively explore the potentially obsolete functions for the designers to conduct design improvements and thus, improve customer satisfaction. The main contributions of this study are summarised as follows: The product operating data were used to construct the OPs to accurately capture the CRs for the functional performance. Based on the distribution of the OPs, the DL was defined to quantitatively characterise the CRs. The time series of the DL was proposed to embody the evolving process of the CRs. In this process, a dissatisfaction function was established based on the Sigmoid-like function to describe the relationship between customer dissatisfaction and the performance level of the functions. An obsolescence index was defined to measure the severity of obsolescence for each function. Based on the value of this index, the obsolete functions were identified for design improvement.
However, some deficiencies still exist in the proposed methodology. For example, the customer expectation was only analysed by the product operating data and the evolvability of the CRs was only measured by the difference between the DLs. Consequently, in future studies, more data sources, such as online reviews, social data, and historical product instance data shall be integrated to provide a more comprehensive analysis of the customer expectations and detailed evaluation of the evolvability of the CRs.
Footnotes
Acknowledgments
This project was supported by the National Natural Science Foundation, China (No. 51505480, 51875345), Postgraduate Research & Practice Innovation Program of Jiangsu Province (No. KYCX20_2069), and Future Outstanding Talents of China University of Mining and Technology (No. 2020WLJCRCZL006).