
Abstract
A method that combines temperature field detection, adaptive FCM (Fuzzy c-means) clustering algorithm and RBF (Radial basis function network) neural network model is proposed. This method is used to analyze the thermal error of the spindle reference point of the tauren EDM (Electro-discharge machining) machine tool. The thermal imager is used to obtain the temperature field distribution of the machine tool while the machine tool simulates actual operating conditions. Based on this, the arrangement of temperature measurement points is determined, and the temperature data of the corresponding measurement points are got by temperature sensors. In actual engineering, too many temperature measurement points can cause problems such as too high cost, too much wiring. And normal processing can be affected. In order to establish that the thermal error prediction model of the machine tool spindle reference point can meet the actual engineering needs, the adaptive FCM clustering algorithm is used to optimize the temperature measurement points. While collecting the temperatures of the optimized temperature measurement points, the displacement sensors are used to detect the thermal deformation data in X, Y, Z directions of the spindle reference position. Based on the test data, the RBF neural network thermal errors prediction model of the machine tool spindle reference point is established. Then, the test results are used to verify the accuracy of the thermal errors analysis model. The research method in this paper provides a system solution for thermal error analysis of the tauren EDM machine tool. And this builds a foundation for real-time compensation of the machine tool’s thermal errors.
Keywords
Introduction
The EDM technology is a non-contact processing method with very small macroscopic processing force. That makes it play a great role in micro processing and precision processing [1, 2]. In discharging process, the pulse voltage is applied between the electrode and the workpiece [3]. When the relative gap between the electrode and the workpiece is small enough, the medium between the two electrodes is broken down and ionized. By the action of the electric field, the electrons rush to the anode, and the positive ions rush to the cathode. This makes the spark discharge. And an instantaneous high temperature (about 10,000°C) is generated in the discharge channel. This makes the metal melt quickly and even vaporize. During the discharging process, the formation and collapse of the discharge channel will cause the melted and vaporized materials to be thrown away from the substrate. This is the erosion process of the workpiece material. After each spark discharge, a tiny pit is formed on the surface of the workpiece [4]. With the continuous feeding of the tool electrode to the workpiece, the surface material of the workpiece is continuously removed under the material erosion action of the electric discharge pulse. This is the process of the electric discharge machining. As an important branch of advanced manufacturing technology, EDM is widely used in the processing of difficult-to-machine materials, complex curved surfaces, and low-rigidity parts because of its unique processing mechanism and stable processing performance. Especially in the fields of aerospace and ultra-precision micro-manufacturing, EDM has unique technical advantages [5, 6]. For high-precision machine tools, how to reduce various errors of machine tools is always a key task in the designing [7]. Up to now, a lot of achievements have been made in the research of machine tool error compensation technology [8, 9].
But there are still many difficulties that hinder the further improvement of the machining accuracy. Among them, thermal deformation error is one of the important factors that affect the machining accuracy [10]. The research results show that the influence of various error sources on the machining accuracy of CNC machine tools is different. In general, the thermal error of CNC machine tools accounts for 25%to 33%of the total errors of CNC machine tools [11, 12]. In addition, the main errors that affect the machining accuracy of machine tools are geometric errors, force errors, and random errors. For the tauren EDM machine tool, because its various shaft systems are superimposed and there are many heat source points, the proportion of thermal error in the total error is even higher. Therefore, studying the thermal error of this type of machine tool is of great significance for improving its machining accuracy.
The processing method of EDM machine tools is different from that of general mechanical processing machine tools. It mainly uses the electric discharge between the two poles to dissolve the processed materials at a high temperature in the machining liquid, and the spindle is not affected by the cutting force. Therefore, the temperature field distribution and heat source distribution of the whole equipment have their own characteristics [13, 14]. In precision machining, the heat generated in the discharge process is small, and the heat will be quickly took off by the processing medium. At this time, the thermal error that affects the machining accuracy of the machine tool is mainly caused by the ambient temperature, the heating of the motor and the heating of the spindle movement. There are few literatures on the systematic research of thermal error of the tauren EDM machine tool. The thermal error analysis based on CAE simulation technology shows that the setting of boundary conditions is too ideal. This makes the thermal error analysis results and the actual test results differ greatly. Therefore, it is necessary to carry out the theoretical research of thermal error test data based on the actual conditions. This will provide an important theoretical support for reducing the influence of environmental thermal error in practical use of tauren EDM machine tool.
In order to know the change rule of the thermal error of the EDM machine tool, first the temperature field distribution of the whole machine is observed by a thermal imager. Then, according to the temperature field distribution, the temperature sensors are reasonably arranged on the machine tool. Based on these work, set the motion conditions of the axes (e.g. simulate the actual processing state), and accurately measure the temperatures of the key parts of the machine tool, the ambient temperatures and the thermal displacements of the spindle reference position. Finally, based on the adaptive FCM (Fuzzy c-means) clustering algorithm and the RBF (Radial basis function network) algorithm, the thermal error of the spindle reference point is modeled and analyzed.
Theoretical study on temperature measurement point selection and sensitive point screening
The layout of the measuring points of the machine tool and the acquisition plan
The arrangement of temperature measuring points is an important basic work to study the thermal deformation of machine tools [15, 16]. In this paper, the research work is based on the A2190 tauren EDM machine tool produced by Beijing Institute of Electro-Machining (as shown in Fig. 1, the main parameters are in Table 1). And the change of the position error of the electrode discharge position (hereinafter referred to as the spindle reference point) are studied when the temperature of the key components of the EDM machine tool changes. The temperature field distribution of the machine tool is complicated. In order to understand the temperature field distribution of the machine tool, first the temperature field distribution of the machine tool are obtained by a thermal imager, as shown in Fig. 2. When the temperature field is observed, in order to simulate the actual processing conditions, the machine tool executes the NC program for actual processing in a cycle without electrical discharge machining.
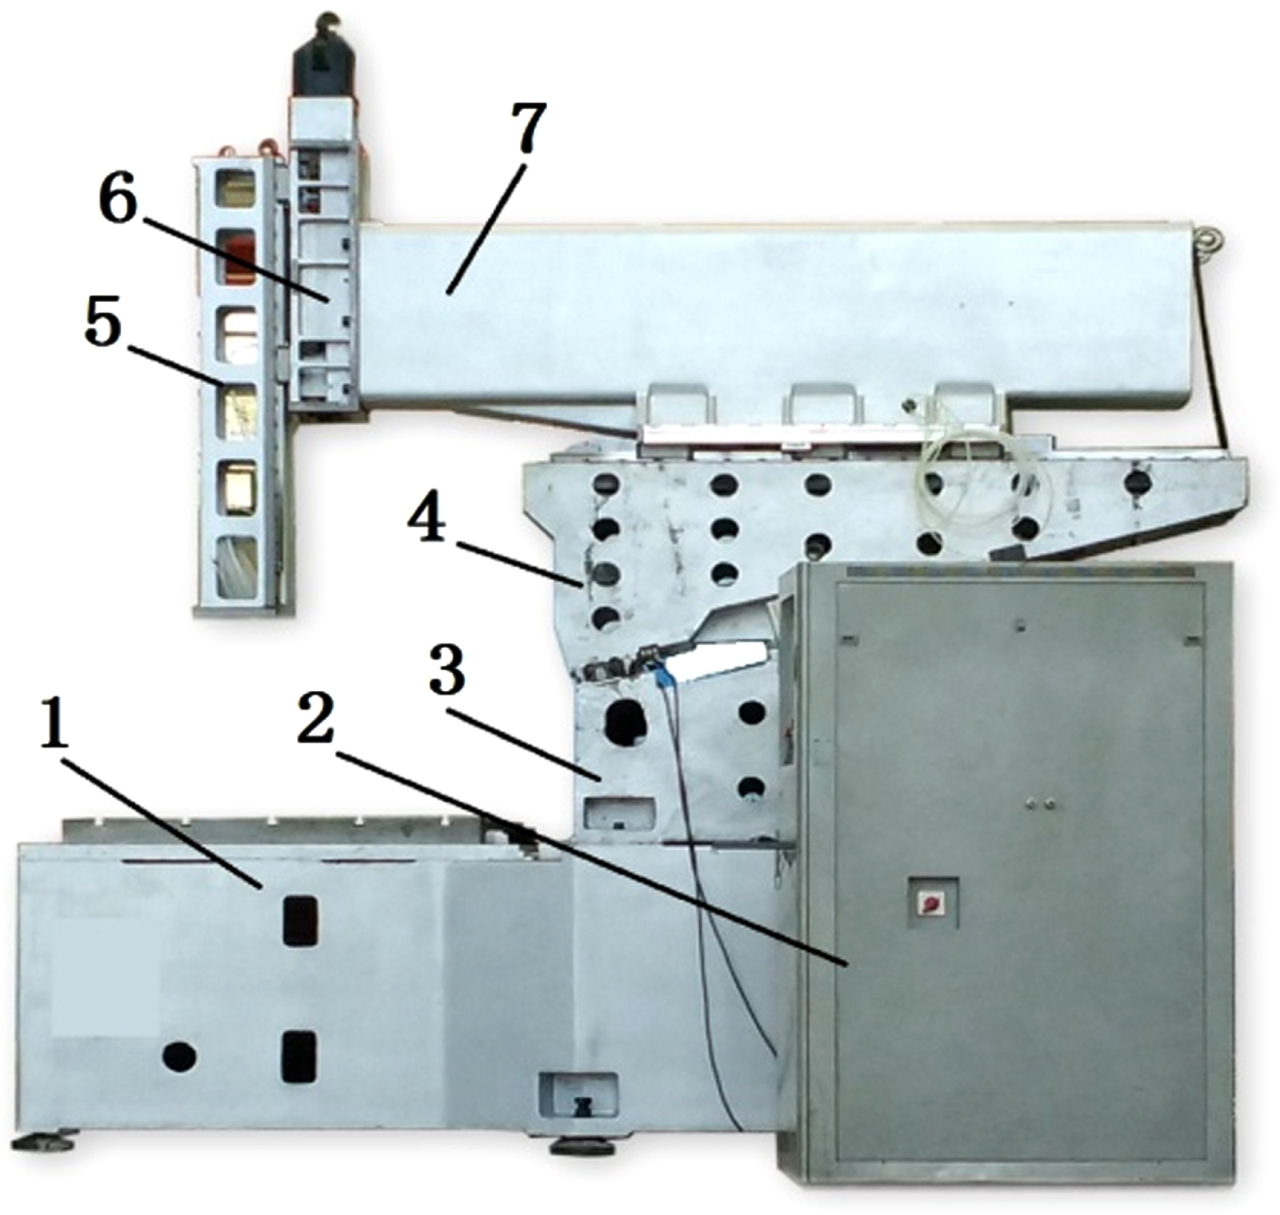
The mainbody of A2190 tauren EDM machine tool. 1-Bed, 2-Power supplier, 3-Column, 4-Saddle, 5-Z axis spindle, 6-Z axis support, 7-Ram.
Main parameters of A2190 EDM machine tool

Temperature distribution of A2190.
However, the precise temperature on the machine tool casting cannot be detected by the non-contact thermal imager. In order to get the precise temperature of the key position of the machine tool, it is necessary to check the temperature of the specific location through the contact temperature sensor. It can be seen from Fig. 2 that the Z axis is the largest heat affected zone, and the Z axis motor is a major heat source. Therefore, when arranging the temperature points, the layout of Z-axis temperature measurement points needs to be focused on.
The high-precision temperature sensors with digital signal output are used for temperature collection in this paper. The temperature data acquisition modular is DAM-PT16 acquisition card. The software system interface is shown in Fig. 3, and the specific parameters are shown in Table 2.

DAM-PT16 capture card software interface. 1-Serial port parameter setting area, 2-Data receiving area, 3-Data collected port control area, 4-Data sending area.
Main parameters of DAM-PT16 acquisition card
According to the temperature field distribution of the machine tool obtained by the thermal imager and engineering experience, 13 temperature sensors (PT100) are arranged on the A2190 machine tool, and their distribution positions are shown in Fig. 4. In the figure, 1,...,13 are the temperature sensors position. the No. 4 position is the position of the spindle reference point, which is the position of electrical discharge machining in actual machining. At the same time, a temperature measuring point 14 is arranged near the machine tool to detect changes of ambient temperature. In the test, the Z axis of the machine tool moved up and down for 160 minutes at a speed of 12 times/min. During this process, the temperature of each detection point was collected every 5 minutes, and each temperature measurement point was collected 33 times in total. The temperature data measured at each detection point are shown in Table 3. The data of the table is the number of the measured temperatures, and the unit is °C. T1,...,T14 are the temperature test points of the corresponding sensors. It can be seen from the temperature detection data that when the ambient temperature rises from 10.45 °C to 10.75 °C, the measurement point 13 has the largest temperature change, from 10.76 °C to 13.25 °C. It can be seen that when the ambient temperature changes little, the local temperature of the key parts of the machine tool will also change greatly due to the movement of the spindle.

Temperature sensors layout. 1,...,13 are the temperature sensors position.
Temperature data of the test points
To obtain a high-precision thermal error model of EDM machine tools, a large number of temperature sensors need to be arranged on the machine tool [16]. But in actual processing, too many temperature collection points can cause problems such as too many wirings and additional costs. In order to ensure the accurate analysis of thermal errors and the practical application of research results, the temperature measurement points are clustered and optimized. Based on the cluster analysis, it is possible to establish an accurate temperature error prediction model of the spindle reference position with as few temperature measurement points as possible. The reference position of the spindle here is also the position of the electrode electrical discharge machining.
Many researchers have proposed many fuzzy clustering algorithms, such as fuzzy relation method, similarity relation method, maximum support tree method based on fuzzy graph theory, dynamic programming and other methods. However, none of these methods can be applied to the situation with a large amount of data, and the practicability is poor [15]. Since the adaptive FCM clustering algorithm has the advantages of high efficiency, strong practicability, and high prediction accuracy, the temperature measurement point clustering research is carried out based on this model in this paper.
For clustering algorithms, the greater the distance between classes and the smaller the distance between individuals in the cluster is, the better the effect of cluster analysis [17, 18] is. In order to make the temperature sampling points as reasonable as possible, self-adaptive optimization of the number of sample clusters of temperature measurement points is calculated by Equation (1).
Where: c is the number of clusters, n is the number of variables in the X ={ x1, x2, . . . , x n }, x i is the data vector of the variable, v i is the prototype matrix of the jth type, x (–) is the center vector of the population sample, u ij is the membership vector of the sample.
The numerator of L(c) is the distance between classes, and the denominator is the distance between the data points in the class and the center of the class. Therefore, the larger the value of L(c) is, the more reasonable the classification is. The c corresponding to the largest L(c) value is the best value. The specific algorithm is as follows: the iteration standard is ɛ>0, clusters number c = 2, the adaptive function L(1)=0 of the cluster number 1, initial classification matrix V(0), k = 0; Use Equation (3) to calculate the fuzzy partition matrix:
If there are r, j, making Use Equation (4) to calculate the cluster center matrix V(k+1):
If the iteration termination condition ∥V(k+1) - V
k
∥ ⩽ ɛ is true, then stop iterating, otherwise, set k = k+1 and go to step (1). Calculate L(c), in the case of c > 2 and c < n, if L(c-1)> L(c-2) and L(c-1)> L(c), the clustering process ends, otherwise, set c = c+1 and go to step (1).
When using the above-mentioned adaptive FCM clustering algorithm to perform cluster analysis on the given test data, considering the effectiveness of clustering, the weighting index m is set to 2. And after iterations, and L(c) is obtained: L(2)=6.1880, L(3)=7.6066, L(4)=5.9972. Therefore, it can be seen that it is best to divide into three categories, and the clustering analysis division matrix U (Table 4) and the membership function bar charts of each category in Fig. 5 are obtained. In Fig. 5, the horizontal axis is the number of the measuring points, the vertical axis is the degree of membership, and the range is [0,1].
Division matrix U of measuring point sequence
Division matrix U of measuring point sequence
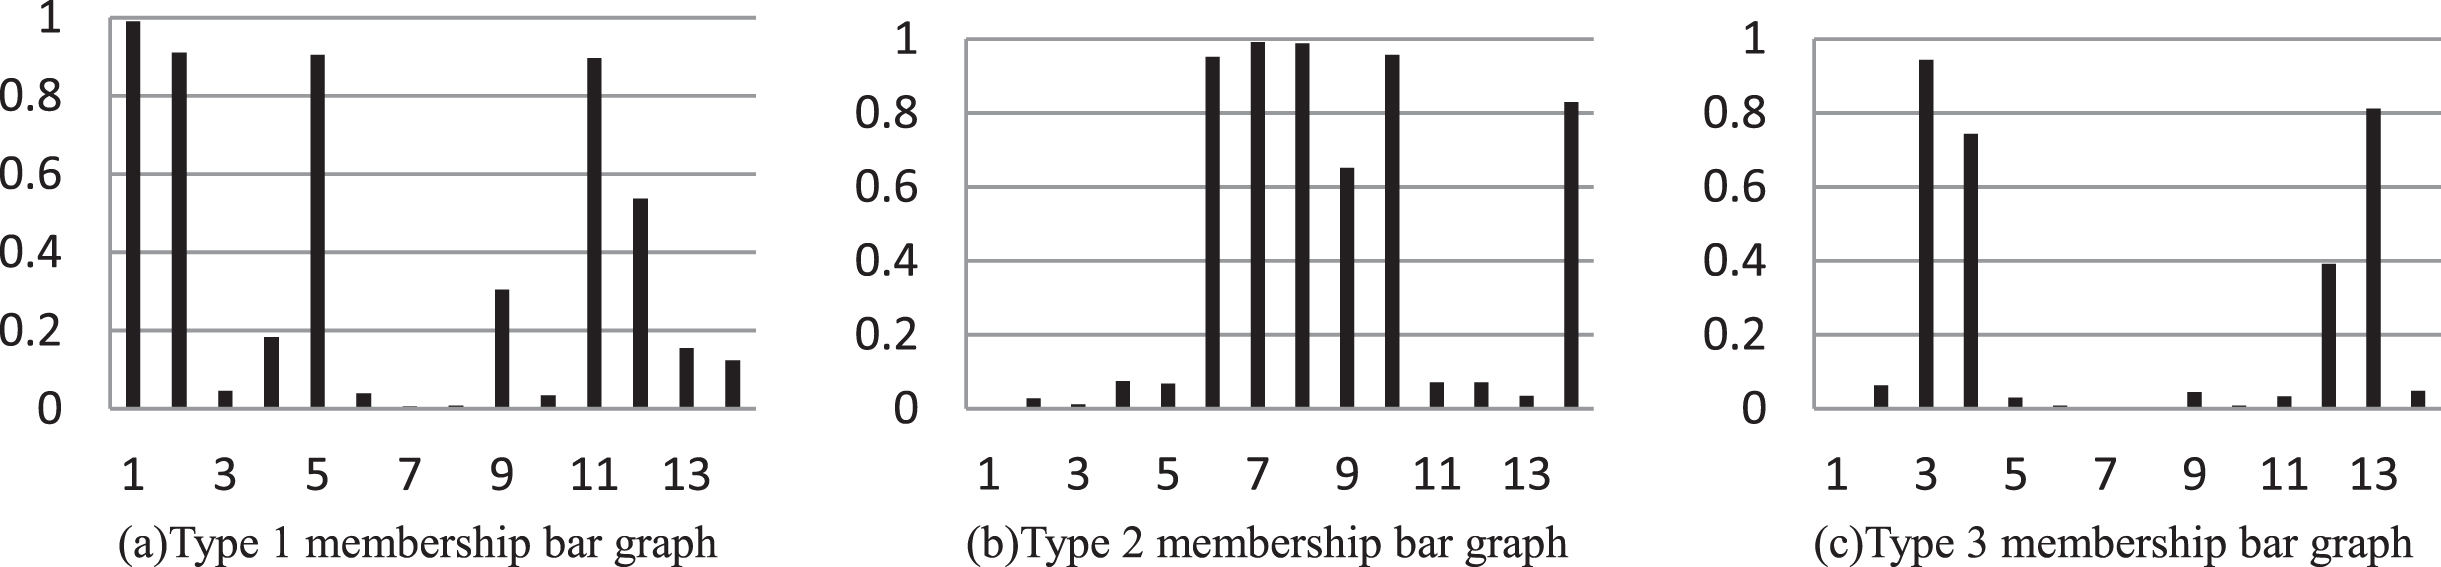
3 types of membership bar graphs.
It can be seen from Fig. 5 and the division matrix U that the adaptive FCM clustering algorithm is effective. It can not only achieve clustering grouping, but also obtain the best clustering results. The clustering grouping is shown in Table 5. T1,...T14 are the number of the measuring points. After cluster analysis, T1, T3 and T7 are finally selected for modeling compensation.
Clustering results
A SOM (Self-Organizing Maps) neural network is built as shown in Fig. 6, where the input is the temperature test data of the 14 measuring points. And a 3x1 SOM neural network is constructed. After 200 steps of iterations, the SOM clustering results are consistent with the adaptive FCM clustering results. But compared with adaptive FCM clustering analysis, the weight setting of SOM clustering is more troublesome. This proves the effectiveness of the adaptive FCM clustering method.
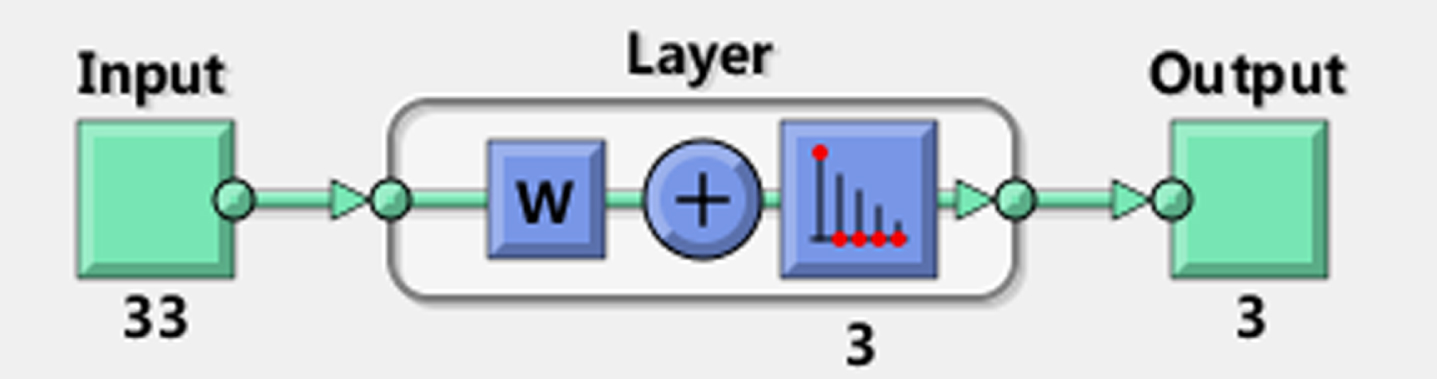
SOM neural network model.
Thermal stiffness of the machine tool
The thermal stiffness of the machine tool is used to indicate the ability of the machine tool to resist thermal deformation [19]. The greater the thermal stiffness of the machine tool is, the smaller the thermal deformation of the machine tool under the same temperature conditions is. The thermal stiffness of the machine tool is equal to the ratio of the temperature change of the machine tool to the heat change, so it can be expressed as the following equation:
Where: T1 is the initial temperature of machine tool, T2 is the machine balance temperature, δ is the thermal deformation of machine tool.
Because the eddy current displacement sensor has the advantages of non-contact measurement, good dynamic response, and good anti-interference ability, it can better meet the thermal displacement measurement of EDM machine tools under continuous moving. So, in this paper, this type sensor is used to measure the thermal displacement of the EDM machine tool spindle. And the sensor’s model is KD2306 (parameters are shown in Table 6).
Main parameters of eddy current displacement sensor KD2306
Main parameters of eddy current displacement sensor KD2306
The collected thermal displacement data are the deformation of the spindle reference point in the X, Y, and Z directions. The sensor arrangement is shown in Fig. 7. In the Fig. 7, 1 is the X-direction displacement sensor, 2 is the Y-direction displacement sensor, and 3 is the Z-direction displacement sensor. While collecting the temperature data, the displacement data in three directions are collected, namely the thermal errors in each direction. The thermal error in each direction are collected 33 times. When the temperature changes and other conditions remain unchanged, the three-direction sensors collect the thermal deformation values in the corresponding directions. The records are shown in Table 7. In Table 7, UX represents the thermal error of the spindle reference point in the X axis direction. UY represents the thermal error of the spindle reference point in the Y axis direction. UZ represents the thermal error of the spindle reference point in the Z axis direction, and the unit is μm. It can be seen from Table 7 that the maximum amount of deformation in the Z direction is 44μm. Combined with the previous temperature detection data, it is sure that the heat source of the tauren EDM machine tool is an important factor that causes its thermal error.
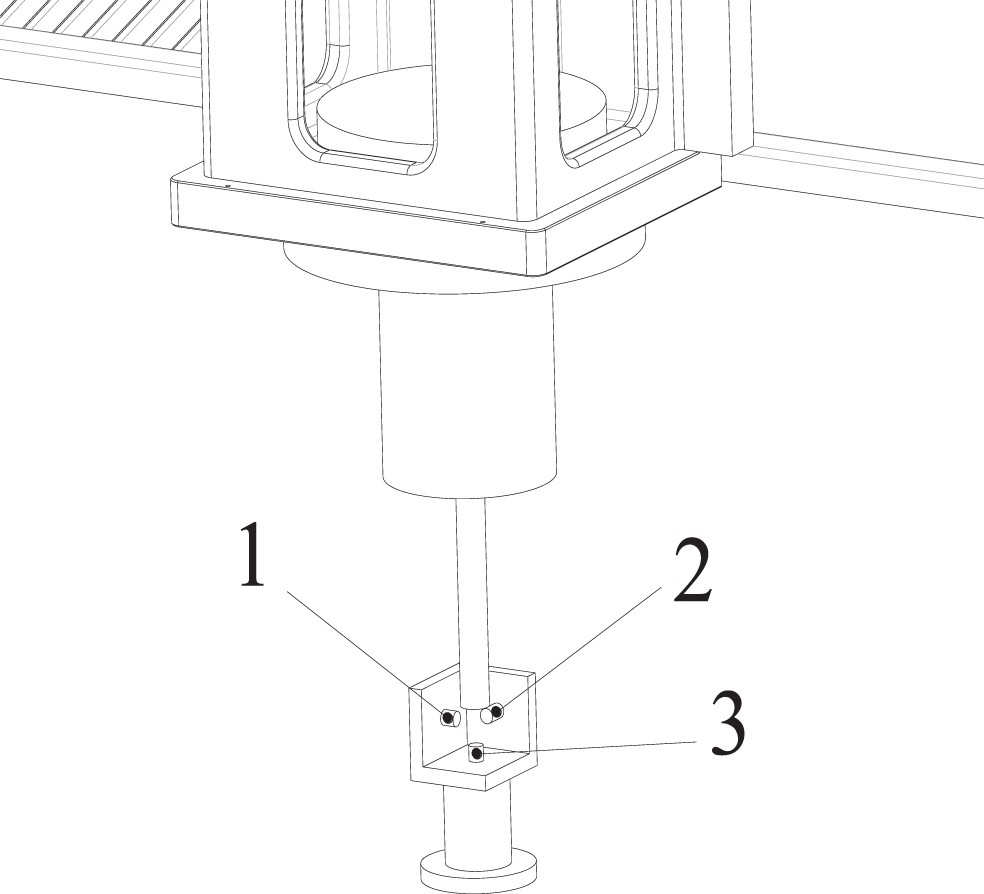
Schematic diagram of thermal displacement sensors layout. 1-X-direction displacement sensor, 2-Y-direction displacement sensor, 3-Z-direction displacement sensor.
Thermal deformation values of the test sensors
The thermal error model of the EDM Machine tool is affected by factors such as the temperature field of the machine tool, the shape of the part and the geometric accuracy. It is a complex nonlinear system, and it is very difficult to establish the model by analytical methods. The current fitting algorithms for nonlinear error prediction mainly include polynomial regression, least squares, etc. These algorithms need to fit each error separately, and the fitting accuracy is poor and the calculation is time-consuming and labor-intensive. The RBF neural network algorithm has strong nonlinear fitting ability. It can map arbitrarily complex nonlinear relationships, and the learning rules are simple. The algorithm has strong robustness, memory ability, nonlinear mapping ability and strong self-learning ability [20–23]. Based on the demand for online thermal error prediction and real-time compensation in further, the RBF neural network are used to approximate the complex nonlinear mapping relationship between the temperature data of the typical temperature collection point and the three-direction displacement change data of the spindle reference point.
The topological structure of the established thermal error neural network prediction model is shown in Fig. 8. The entire network is from left to right in order from the input layer, the hidden layer and the output layer.
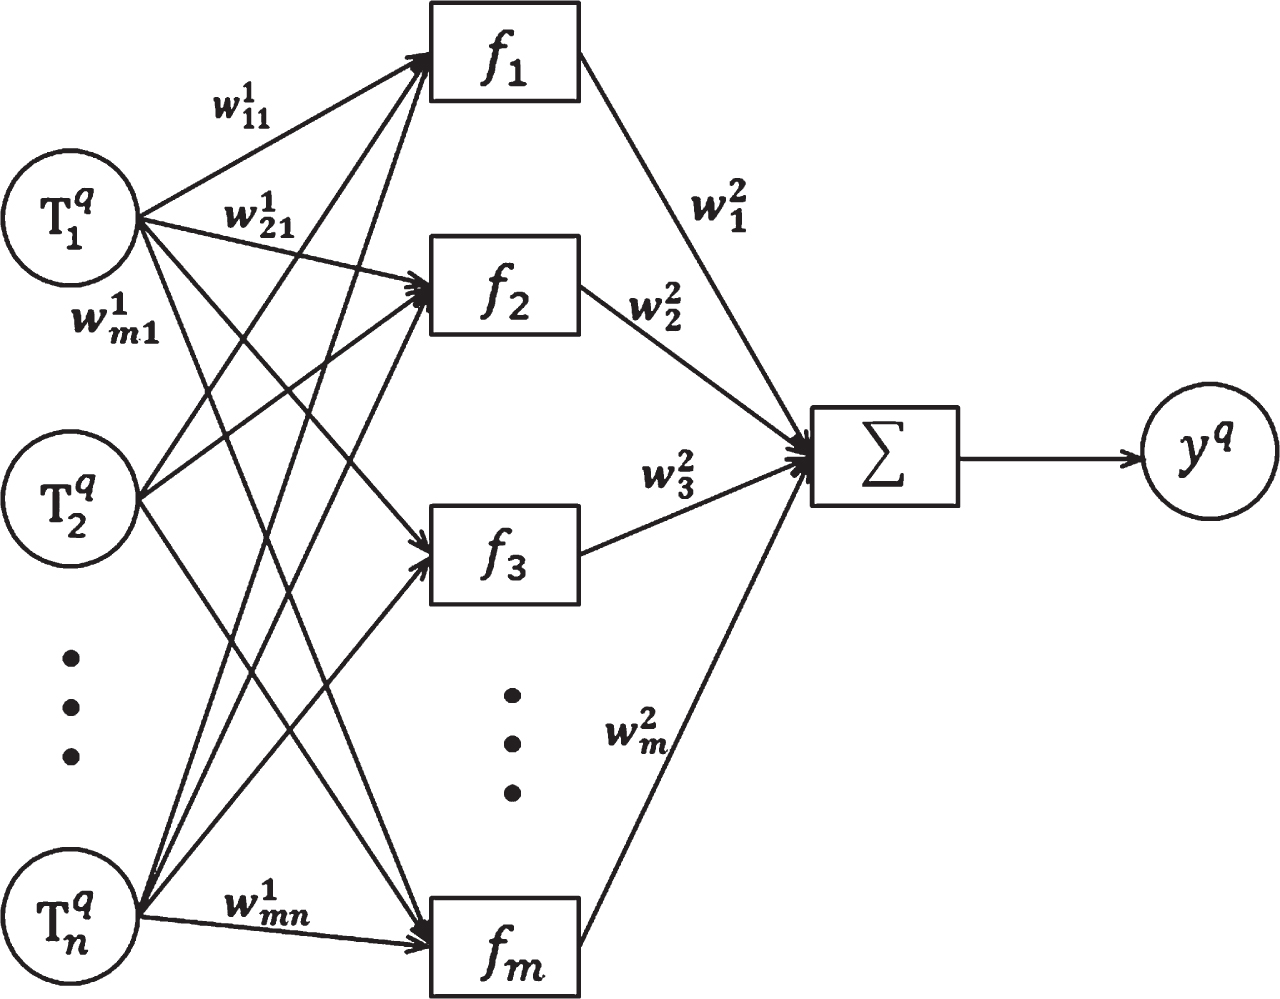
The topology of the thermal error RBF neural network prediction model.
In Fig. 8,
Specific to the research object of this paper, the input layer neuron n = 3, the input neurons are the temperature measurement data of T1, T3, T7. The output node are 3. The output are the thermal errors of the spindle reference point in the X, Y, and Z directions. The number m of neurons in the hidden layer are determined by the following formula:
Where: n is the number of input neurons, the constant a = 1∼10, and a = 5 in this article.
Normalization method: Since the temperature and thermal error test data have different dimensions, the test data needs to be normalized first. Set the temperature or thermal error time series of a certain measuring point as t = (t1, t2, . . . , t
s
), and normalize it to get the sequence
Cumulative transformation method: In order to weaken the randomness of the test data and highlight its changing trend, the first-order accumulation is carried out using Equation (7).
Accumulation transform generates sequence
The selection of test sample set and training sample set: the temperature and thermal error values after the pretreatment at the same time are combined into a set of data, called the test sample, and the total number is Q
Test sample set: In order to ensure the prediction accuracy and range of the model, m (m ⩾ Q/2 minimum integer) sets of test samples are taken at equal intervals as the neural network model test sample set
Training sample set: the network training sample set is composed of the remaining(Q-m) groups of test samples
Network target vector: Take
Where, newrbe is the calculation function of the prediction residual of the RBF neural network construction function model. Take the row vector of
Where, q = 1,2,...,m, is the serial number of the test sample.
Simulate the network and get,
Where,
Where,
Denormalize
Where,
Take the original test data sequence Eu,test = (e1u,test, e2u,test, . . . , emu,test) corresponding to
Where,
Variable S optimization: define the parameter f to represent the predictive ability of the neural network model, the calculation formula is as follows,
The selection range of S is [0, 20], and after optimization calculation, S = 1.5.
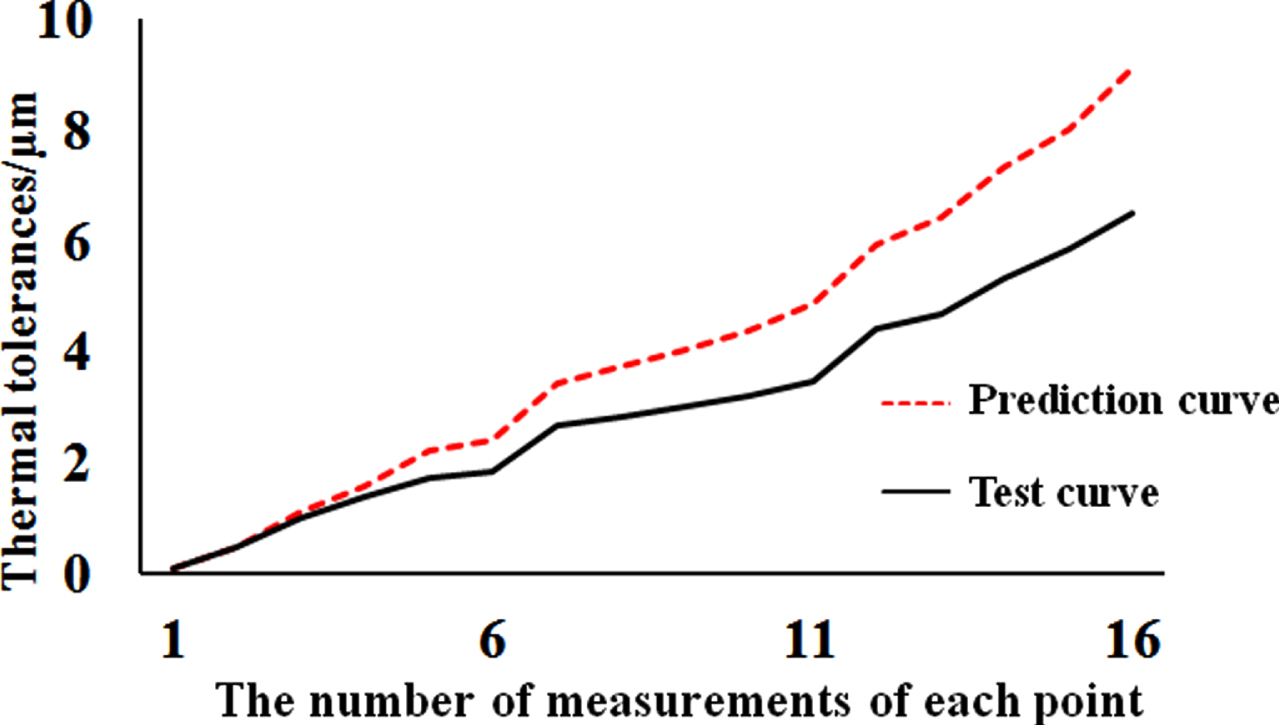
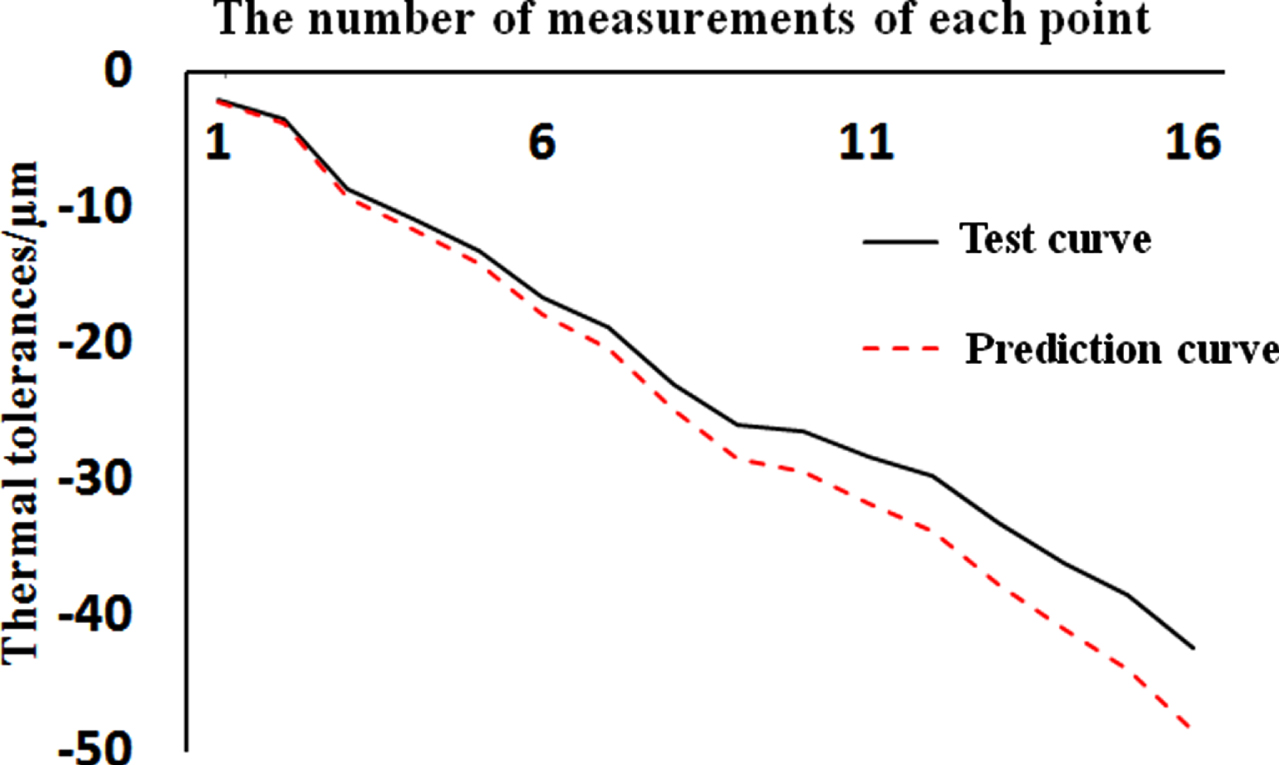
The temperature of each measuring point used for modeling after cluster analysis are extracted. And the temperature and thermal error of each measured point are combined into a set of data, which is called a test sample. After prediction by the thermal error neural network prediction model, the prediction and actual measurement comparison verification curves are obtained, as shown in Figs. 9 11. The horizontal axis of Figs. 9 11 are the number of the measuring points. The vertical axis of Fig. 9 is the thermal errors in the X direction. The vertical axis of Fig. 10 is the thermal errors in the Y direction, and the vertical axis of Fig. 11 is the thermal errors in the Z direction. The unit of these vertical axis is μm. It can be seen from Figs. 9, and 11 that the thermal error neural network prediction model can effectively predict the thermal errors of the machine tool. The maximum residual error of the thermal errors in the X direction is 2.64μm. The maximum residual error of the thermal errors in the Y direction, the value is 2.71μm. And the maximum residual error of thermal error in the Z direction is 6.1μm.
X direction thermal error model verification.

Y direction thermal error model verification.
Z direction thermal error model verification.
The thermal errors model established by the key points of temperature measurement obtained by the above method can fully guarantee the prediction accuracy of the thermal errors. And the model eliminates the temperature variable coupling phenomenon, and improves the robustness. The comparison between the test data and the prediction results of the thermal errors prediction model also verifies the the application feasibility of adaptive FCM clustering.
According to the test data, it is known that the heat source of the tauren EDM machine tool is an important factor that causes its thermal error. For the first time, the main thermal deformation influence area that affects the heat source of the tauren EDM machine tool is clearly given. And the influence of the heat source is quantitatively analyzed. Compared with other clustering methods, the adaptive FCM clustering algorithm used in this article has the advantage of high efficiency, strong practicability, and high prediction accuracy. It provides a solution for the problem of that too many temperature measuring points have an adverse effect on the operation of the machine tool. Based on the collected measurement point data and thermal deformation data, the RBF neural network is used to approximate the complex nonlinear mapping relationship between the machine tool thermal errors and the collected temperature. The RBF neural network algorithm has strong nonlinear fitting ability. It can map arbitrarily complex nonlinear relationships. And the learning rules are simple, which is convenient for computer implementation. This algorithm makes the online real-time prediction of thermal errors of this type of machine tool possible. It lays the theoretical foundation for the adaptive compensation of thermal errors of the tauren EDM machine tool. In this paper, a combination of thermal imager temperature field distribution test, adaptive fuzzy clustering algorithm and RBF neural network algorithm are used to solve the problem of thermal error prediction of the spindle reference point of the tauren EDM machine tool. The specific technical flow is shown in Fig. 12. The thermal error modeling method based on adaptive FCM clustering analysis and RBF neural network can be easily integrated into the machine tool and its software system. It will be an important technical guarantee for high precision machining of the tauren EDM machine tool.

Research technology flow chart.
Conflict of interests
The authors declare that they have no known competing financial interests or personal relationships that could have appeared to influence the work reported in this paper.
Footnotes
Acknowledgments
This research was supported by 2018 Nova Program (Z181100006218078).