
Abstract
Evaluating the capability of smart information service and exploring the smart information service elements in scenic areas can accelerate the smart tourism industry progress to a highly effective administrative and high quality of smart tourism service. This study aims to exploring the connections of a variety of smart information service elements in scenic areas, analyzing and evaluating the capability of smart information service, mapping a positive resolution to improve the capability of information service in scenic spots. Based on a synthetic method that combining Structural Equation Modeling (SEM) and Analytic Network Process (ANP), explicitly using the SEM to extracting the key factors and mapping each factors’ co-relations, and in further step, using the ANP to carry a fuzzy evaluation of weighing the information service capability and each element in the case of Jiangxi Province in China, the result shows that the method of “SEM-ANP” is better fit than single ”SEM” or ”ANP”, the evaluating system for smart information service in scenic areas is significantly innovative and scientific to supply effective suggestions for policy makers.
Introduction
Cloud computing, big data have attracted extensive attention due to their huge potentials to generate values. With rapid development and application of new technologies, they have become the global hot issues. Internet and smart phones are transforming the tourism industry into a smart information processing system that assisting tourists to arrange touring plans and enhance travelling experience. It has become a leading direction of current tourism industry and the new concept of “smart tourism” has emerged popularly around the world. As for the tourism management, service and marketing, Internet also presents a touch of “intelligence” in this new era. In this way, the development path of smart information service in scenic touring areas is going to be comprehensively upgraded.
There is no doubt that the emergence and development of “smart tourism” is driven by the development of information industry. With the coming of 5 G ecological system, the transformation and upgrading of smart information services have become an irreversible trend. As an increasing coverage of smart information, information resources have become the core competing area, and it exists a consensus that strengthening the information service at scenic areas is significant to promote tourism. On one hand, it promotes the information accesses to higher efficiency of their travelling experience; on the other hand, it helps tourist to obtain real-time travelling information and provides high-quality of personalized customized services to tourists. Therefore, providing high quality of smart information service is key to producing high evaluation of touring experience. This trend is also consistent with the theory of “tourist gaze” and conforms to the logic of developing tourism. Which means to “smart tourism” is bound to become the mainstream. We need to explore the path of building high quality of information service in smart scenic areas, because it has become an important issue in the research of tourism industry in the new era.
Construction high quality of information service in smart scenic area is not a fixed set of designing path, how to define and upgrade the smart information service in smart scenic areas needs to re-evaluating and propose a new method to explore the sustainable law of building smart information service. In this paper, a new “SEM-ANP” evaluation mode is proposed. This mode can accurately grasp the characteristics, elements and paths of information service construction at smart scenic areas. On this basis, combining the sample of scenic areas in Jiangxi Province, the “SEM-ANP” synthetic evaluation mode is conducted and an empirical study related to the mode is carried out in this paper.
Scholars generally believe that, “smart tourism” can be traced back to the development of information technology (IT). As information technology changes, the mode of tourism industry also has been transformed [36]. Thus, the form of “smart plus tourism” has been popularized [22]. Therefore, focusing on the digital information service platforms becomes a hot topic. Specifically, the studies can be classified into 3 aspects, the 1st part focus on platform construction of the smart information tourism, such as data mining in smart tourism [30], block chain [43], artificial intelligence and digital communication technology [33], discover the inner mechanism of upgrading smart digital service structure [8] and map the relations between tourists’ demand and information resources supply [35]. These studies reveals that the IT resources in helpful to build smart ecological tourism system [2, 9], satisfy the tourist’s information demand through the upgradation on digital smart platform.
The 2nd part focus on vacation destinations in the smart tourism system, such as describe the features of smart touring cities [49],smart transportation [34], smart touring city image perceived by the tourist [23, 51], smart touring local’s experience [19, 45], smart information release [38, 42], sustainable development of smart touring destination [5, 50], and the administration of smart touring destination [16, 32]. This kind of hot topic in recent years mainly start from the multi-subjective perspective of constructing the smart tourism city [26], and the policy supportive and institutions setting [1], especially explore the building structure of smart tourism industry and its relevant administrative problems and risk [53]. The 3rd part focus on the interactions of each inner elements, such as in the ripe ecological tourism system, the visitors are the center of every link of the smart touring connections [4, 47]. This kind of study insist that the smart tourism mediate the visitors and destinations through the smart information platform [11, 21], drives the smart touring ecological system running on the sustainable developing track [29].
According to literature review, smart scenic areas are one part of the “smart tourism” destinations. Feature element analysis and path design of information service construction in such areas should be based on features found by “smart tourism” researches. Four aspects need to be comprehensively built and they are 1) terminals, 2) policy and infrastructure, 3) transportation, and 4) supervision and database. Evaluation and analysis should combine tourist characteristics and the “gaze of scenic area managers”. Therefore, in this paper, “SEM-ANP” evaluation mode is used to assess the information service in the smart scenic area. The basic idea is as follows: first, the SEM method and ANP method are taken to build the decision-making factors and weights of the subjective and objective indexes, respectively; secondly, the two are organically combined based on the principle of minimal dispersion of the subjective and objective evaluation index system; finally, the strategy of information service development in the smart scenic area is determined. In this way, a more scientific and complete path for future development of information service in smart scenic area is found and the evaluation of development level becomes more scientific and reasonable.
Proposal and empirical analysis of “SEM-ANP” combined model structure
Objective evaluation based on structural equation modeling (SEM)
Mathematical structure of structural equation modeling
Widely used in economics, psychology and other social sciences, structural equation modeling (SEM) is a form of causal modeling proposed in 1970 s by Karlg Joreskog, a Swedish statistician [19]. During its practical use, SEM often appears as a system built upon a linear equation, which is derived from the causal relation between observable variables. The equation system can be divided into two parts: 1) measurement model and 2) structural model.
where, formula 1 and 2 are the measurement model equation; and formula 3 is the structural model equation. Definitions of variables are as follows:
Y = Exogenous observation variable, X = Endogenous observation variable;
η= Exogenous latent variable, ξ= Endogenous latent variable;
Λy= Relationship between exogenous observation variables and exogenous latent variables;
Λx= Relationship between endogenous observation variables and endogenous latent variables;
B = Path coefficient between endogenous latent variables;
Γ= Path coefficient between exogenous latent variables and endogenous latent variables;
ɛ= Measurement error of Y, δ= Measurement error of X, ζ= Residual term of the structural equation.
With exploratory factor analysis on the questionnaire, it is concluded that four internal and external latent variables can affect respondents’ evaluation of “smart tourism” in the region. They are 1) policy implementation and infrastructure, 2) intelligent transportation, 3) enterprise and terminal, and 4) supervision and database. Thus, a structural equation is established for the evaluation index system. It has combined 28 observation variables, including network coverage and laws and regulations. The path coefficient among latent variables is also calculated.
Empirical analysis of structural equation model
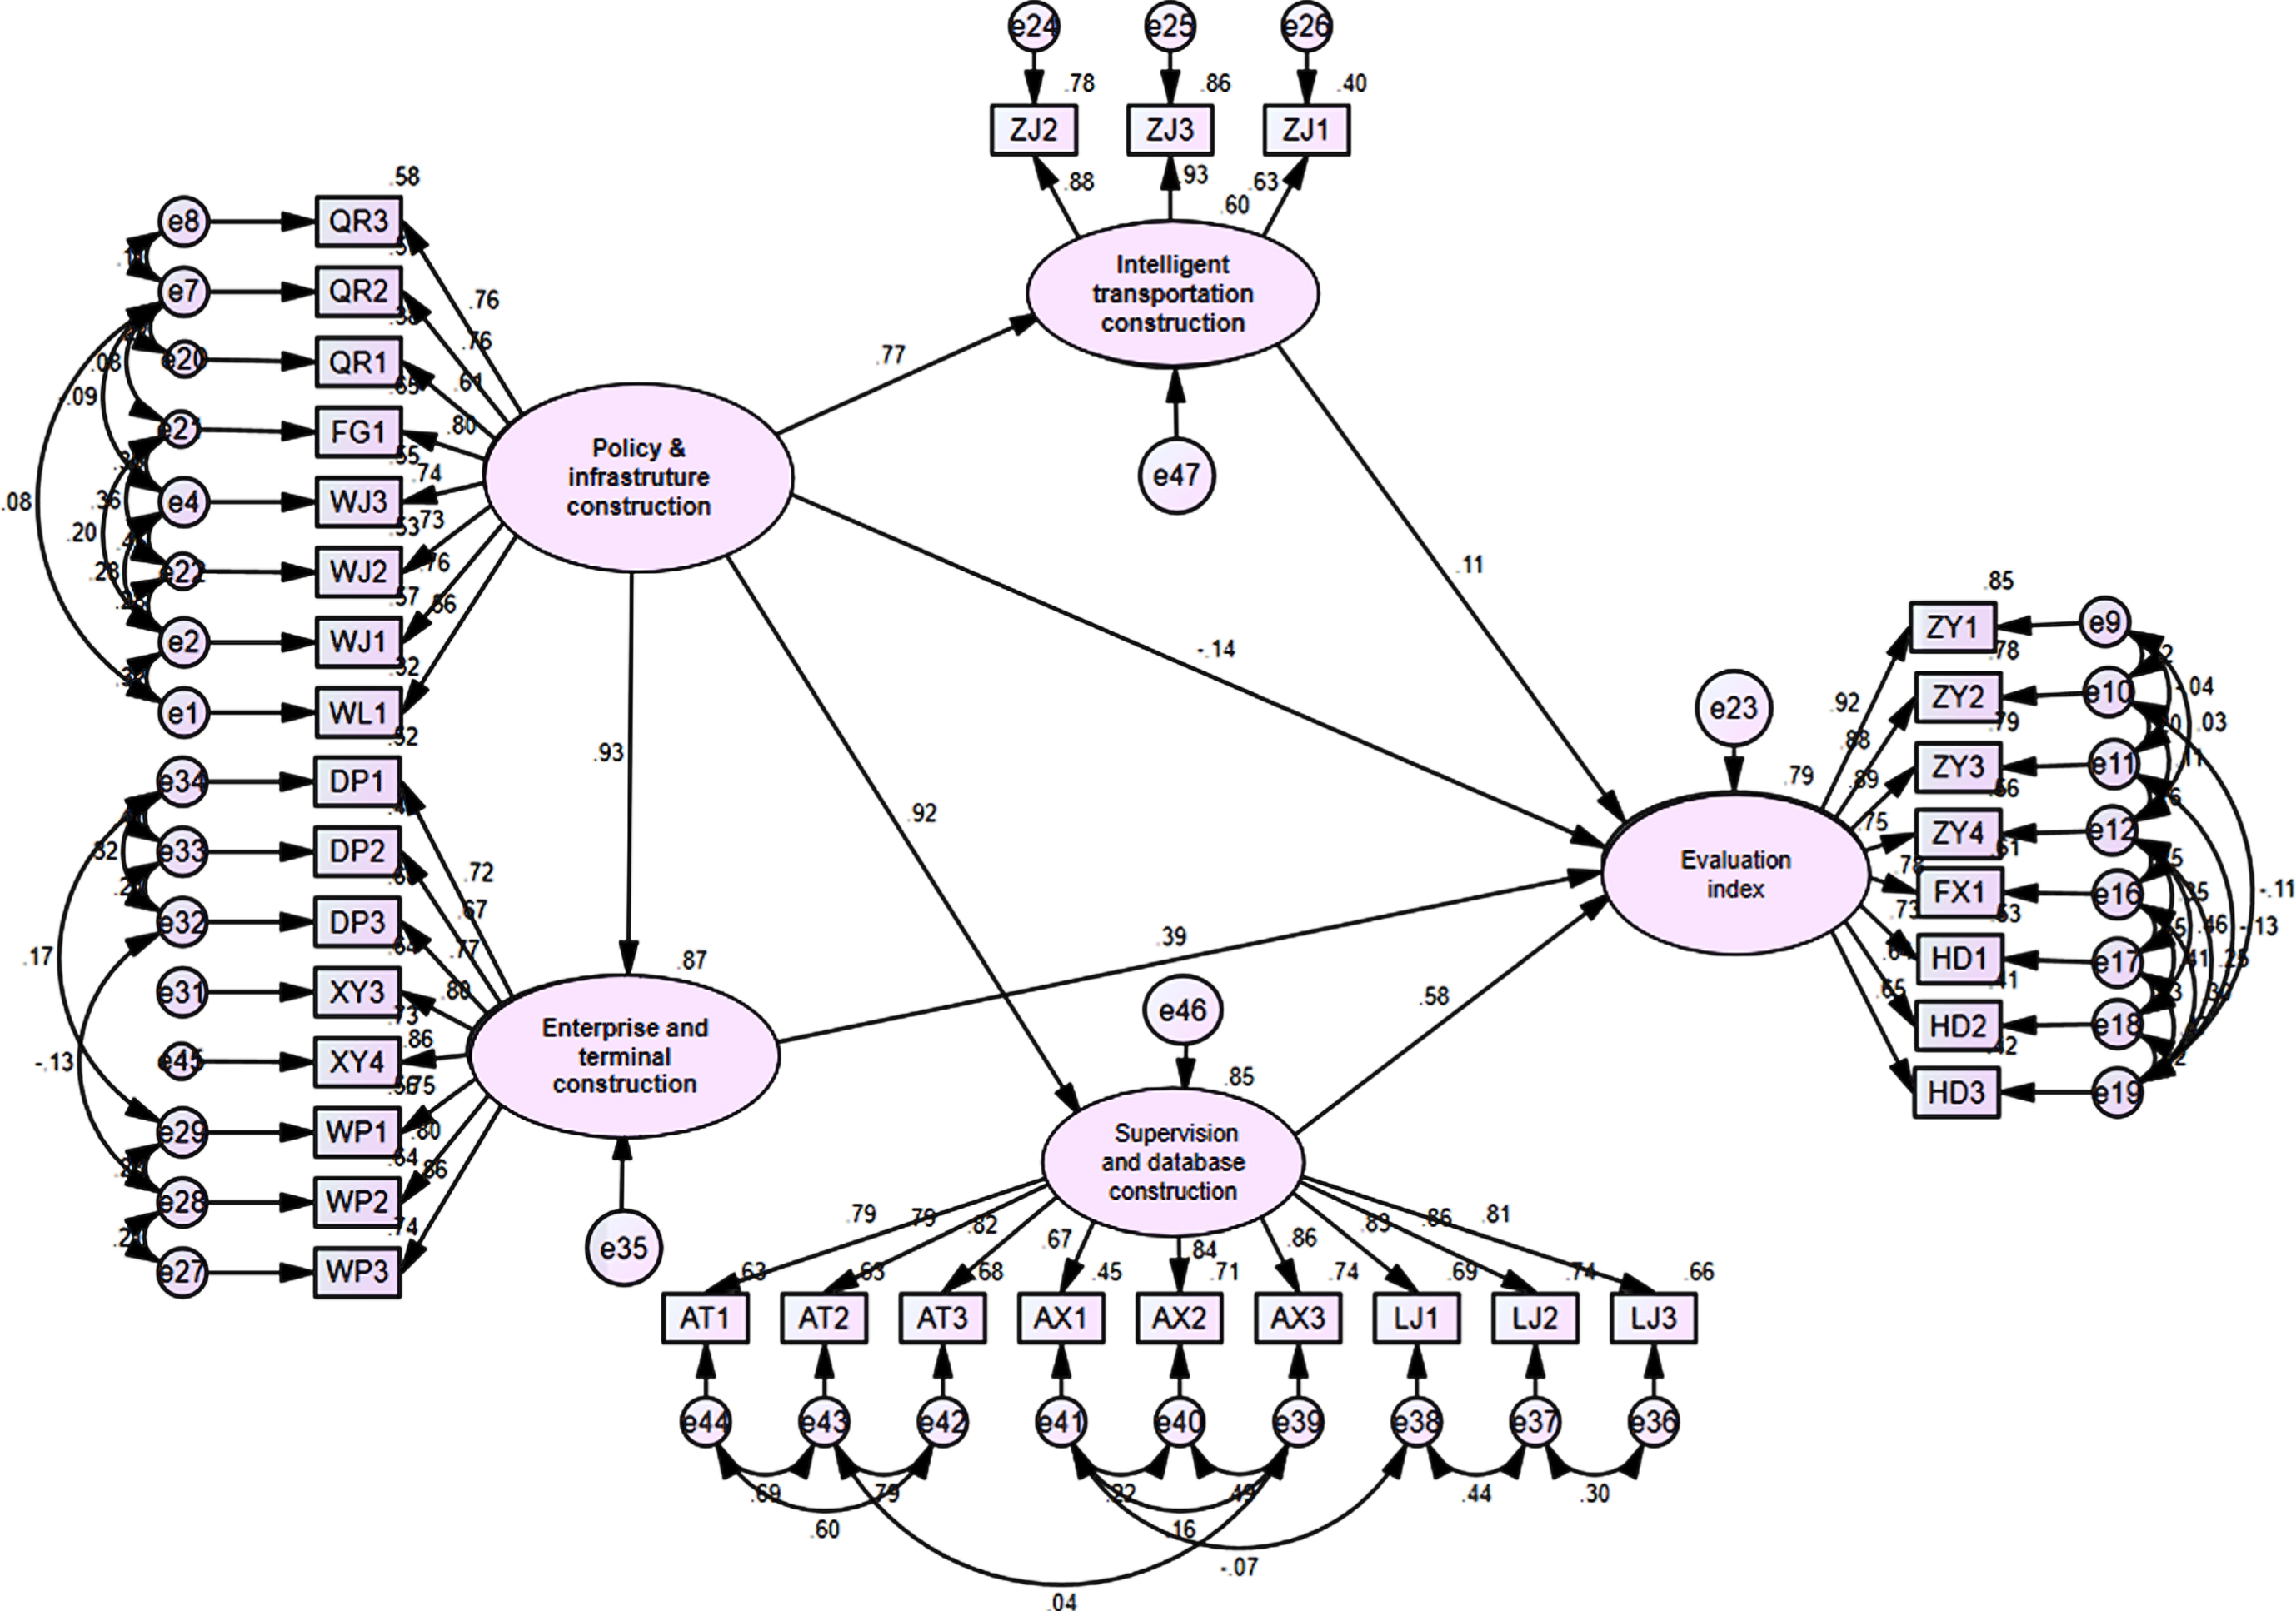
This journal takes Jiangxi Province, China, as the case study that evaluating the capability of constructing smart tourism system and exploring the evaluation index system for Jiangxi smart touring system. In the questionnaire survey, it takes the practitioners of scenic spots in Jiangxi as the target survey object, received 529 valid questionnaires. Then through SPSS-Amos software, it successfully draws the structural equation model of Jiangxi smart tourism construction capability (Fig. 1), model goodness of fit table (Table 1) and related path coefficient tables (Table 2) were obtained respectively.
Structural equation model of objective index system for evaluating the development level of Jiangxi “smart tourism”.
Goodness-of-fit table of structural equation model of objective evaluation index system of Jiangxi “smart tourism” construction level
Path coefficients of structural equation model of objective evaluation index system of Jiangxi “smart tourism” construction level
The exploratory factor analysis is used to preprocess the questionnaire data. Four secondary indicators are selected: 1) level of policy implementation and infrastructure, intelligent transportation, scenic area and terminal condition, and supervision database. They serve as latent variables for the evaluation system by the investigated groups, which measure the main influencing factors of information service at Jiangxi scenic areas. Next, 28 third-level indexes such as WL1, WJ1, etc. are derived as obvious variables (observed variables) of the four latent variables to jointly build a structural equation model. In this way, investigated groups’ evaluation model for information service of Jiangxi scenic areas has been established.
Table 1 shows that the chi-square freedom ratio (CMIN / DF), RMR, IFI, PGFI, PNFI and CFI of this structural equation model of objective evaluation index system satisfy ideal standards. It indicates that the hypothesis has a good overall fitting effect on the model of factors affecting consumers’ purchase intention. Values of each goodness-of-fit index meet the requirements. The structural equation has a good fitting effect on the data.
According to the table, policy implementation and infrastructure are latent variable that indirectly affect the evaluation index. Their influence is exerted through affecting three latent variables of the evaluation index, including 1) intelligent transportation (with relevant path coefficient of 0.77), 2) enterprise terminal (with relevant path coefficient of 0.93), and 3) supervision and data base (with relevant path coefficient of 0.92). Moreover, policy implementation and infrastructure has the biggest influence, which is as high as 0.8545, on the evaluation index. Latent variables rank after it include supervision and database construction (with correlation path coefficient of 0.53), enterprise terminal construction level (with correlation path coefficient of 0.32) and intelligent transportation construction level (c with correlation path coefficient of 0.09). The order of these latent variables are based on their influence on the evaluation index.
ANP is an adaptation of non-independent hierarchy of decision-making method presented by the American management scientist Saaty in the 1990 s. In the control hierarchy of the evaluation index construction system of “smart tourism” construction, four dimensions exist. They are policy implementation and infrastructure construction, intelligent transportation construction, enterprise and terminal construction, and supervision and database construction. There are also element groups WL1, WJ1, ... ... , LJ3 in the network hierarchy under the control hierarchy. The name of each element corresponds to each index of the secondary indicators in Table 1. Weight algorithm steps of ANP system are as follows:
Mathematical structure of analysis network process
In the way of meeting discussion and experts filling in forms, the problems to be decided are systematically analyzed, control levels are established, decision objectives are defined, and relative objective weights of each criterion are obtained based on ANP method.
1. Constructing judgment matrix
Let the element aij in the judgment matrix A = (aij)m*n represent the ratio of relative importance degree of element i to element j. The numbers 1–9 and their reciprocals are used as weight scale, among which 1-3-5-7-9 (odd numbers) successively represent the equally important –slightly important –relatively important –very important –extremely important, and 2-4-6-8 (even numbers) represent the intermediate state of the relative position. Elements of control hierarchy Us (S = 1) to 4are taken as the criteria, and elements in Usj(j = 1,2,3,4, ... ... ,n) are sub-criteria, thus the judgment matrix is obtained through direct comparison and indirect comparison.
2. Consistency test of judgment matrix
Calculate M and normalize the result:
Calculate λmax and the internal consistency index CI:
Let the maximum eigenvalue of judgment matrix A = (aij)m*n beλmax and n be the order of matrix, and we get:
Calculate random consistency ratio CR:
Let RI be random consistency index, then random consistency ratio CR is:
If CR value is less than 0.1, the judgment matrix A = (aij)m*n meets the consistency requirements. Only by meeting the consistency requirements can the following steps be carried out. Otherwise, the adjustment test shall repeat, until CR value is less than 0.1.
3. Establishment of super matrix and weights of each element group
According to the judgment matrix, the ranking vector can be calculated by the eigenvalue method.
Wij is denoted as:
4. Calculation of weighted super matrix
Based on Wij, every column of the unweighted super matrix is normalized and further weighted into a weighted super matrix. After that, all the normalized eigenvectors are combined to obtain the weighted super matrix W, with the column sum of 1.
W is denoted as:
5. Calculation of limit super matrix
The direct relationship between elements i and j is reflected by the weighted super matrix Wij, and its complicated indirect relationship is reflected by the iteration of super matrix. Elements’ weight is established by constructing the limit super matrix among elements. Each element’s weight index vector depends on the column vector of the limit super matrix.
Empirical analysis of analysis network process
Based on the demand of objective evaluating the capability of constructing smart information tourism system, considering the current situations of Chinese smart tourism construction, this study invites 9 veteran practitioners to carry out in-depth interviews.
Before the ANP analysis, this study firstly adopts Kappa coefficient to verify the consistency of different interviewees evaluating the capability of constructing the smart tourism in the 4 dimensions of ANP. Generally speaking, when the Kappa coefficient between the various dimensions involved in the analysis is 0.4–0.6, it indicates that the consistency between the dimensions is general; when the Kappa coefficient is 0.6–0.8, it indicates that there is a high consistency between the dimensions; the Kappa coefficient is greater than 0.8, it indicates that the consistency between the dimensions is very good. In addition, the dimensions participating in the Kappa symmetry measurement should also pass the progressive significance test.
In this study, the 9 groups of evaluation data after Kappa symmetrical measurement, the Kappa value is 0.612, and the progressive significance is.000. The 9 invited staff who are deeply involved in this field have good evaluation consistency and passed statistics, the following research and analysis can be carried out.
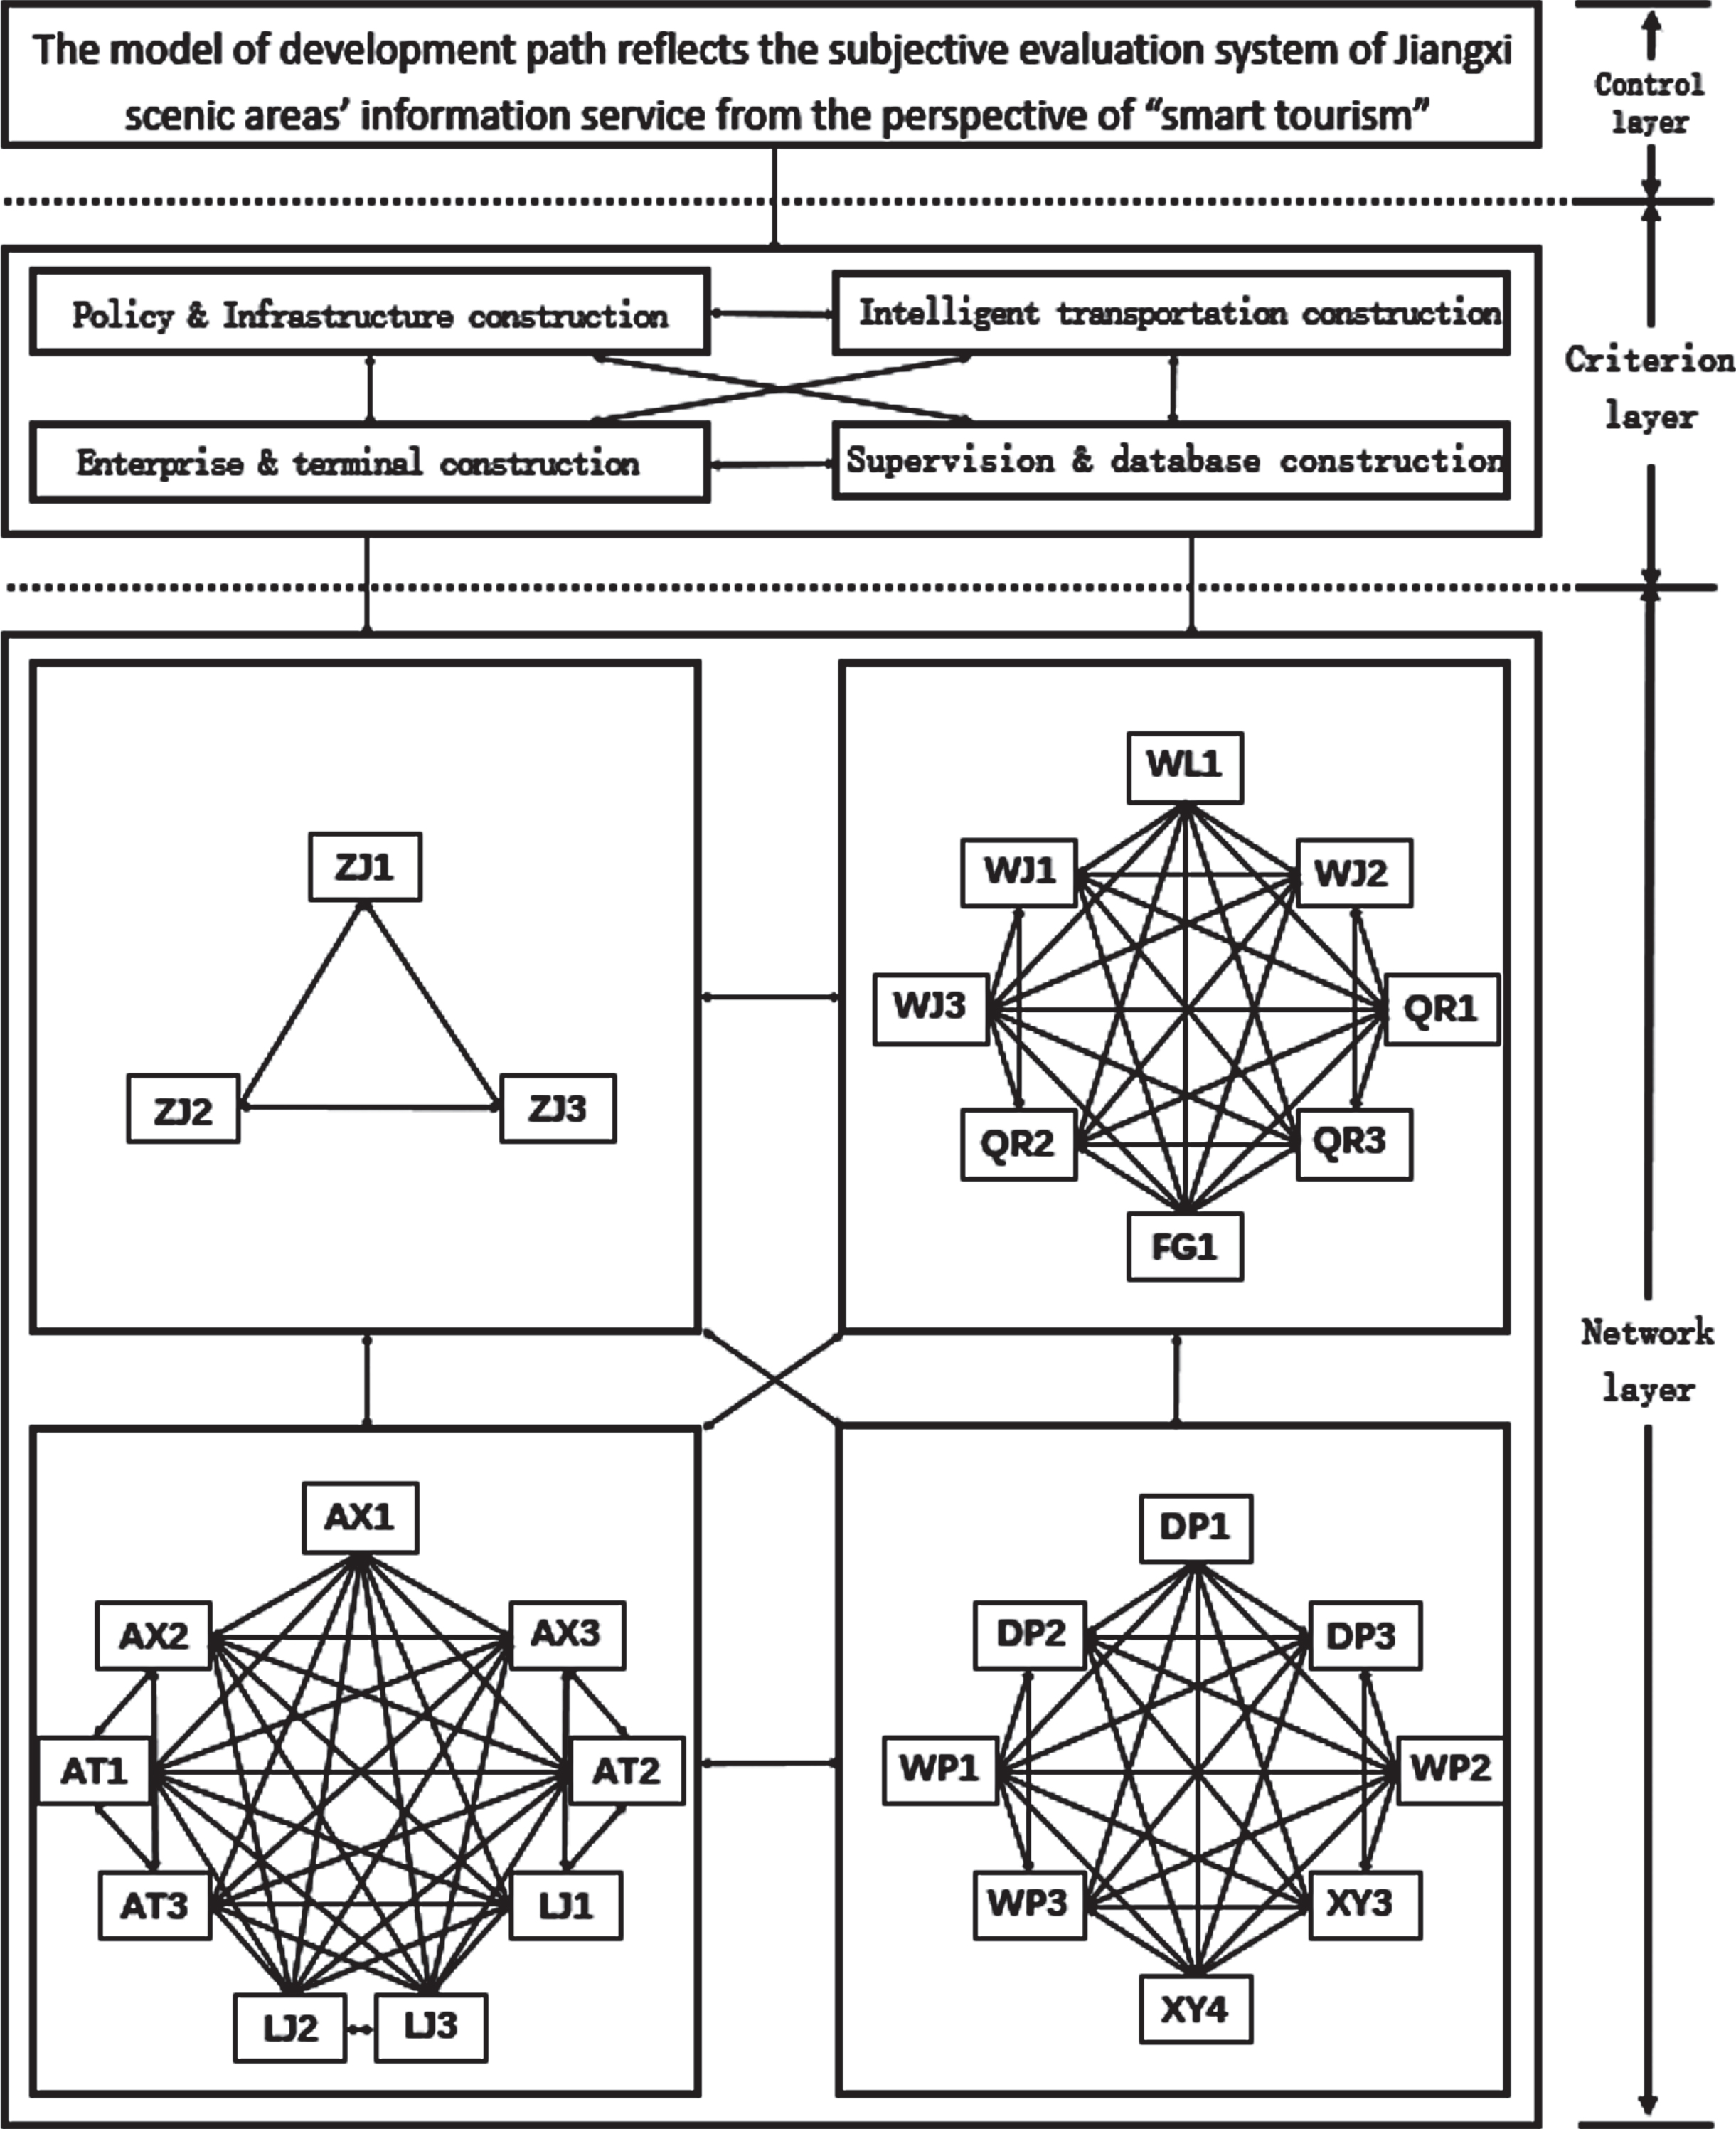
Through the software of Super decision, it draw out a subjective evaluation index system of Jiangxi smart tourism construction capability based on ANP. Figure 2 is the development path model of the subjective evaluation system of Jiangxi scenic spots information service construction under the smart tourism vision.
According to Fig. 2, from the perspective of “smart tourism”, the development path of Jiangxi scenic area information service follows a four-dimensional structure: There are four dimensions of criteria layers: 1) Policy & infrastructure construction, 2) Intelligent transportation construction, 3) Enterprise and terminal construction, and 4) Supervision and database construction. In the network layer that corresponds to criteria layer: Policy & infrastructure construction implementation includes eight elements: WL1, WJ1, WJ2, WJ3, QR1, QR2, QR3 and FG1; Intelligent transportation construction includes three elements: ZJ1, ZJ2 and ZJ3; Enterprise and terminal construction includes eight elements: DP1, DP2, DP3, WP1, WP2, WP3, XY3 and XY4;Supervision and database construction include nine elements: AX1, AX2, AX3, AT1, AT2, AT3, LJ1, LJ2 and LJ3.
Development path model of subjective evaluation index system of Jiangxi “smart tourism” construction level.
Development path model of information service at Jiangxi scenic areas are studied by software calculation and information summary. A relevant weighted super matrix is established. This is to obtain the judgment matrix of each influential dimension and weight table of dimension elements from the perspective of “smart tourism”, as shown in Tables 3 and 4. Through the observation on the inconsistency values of each element set, the CR of all dimensions and dimension elements in each variable set are all less than 0.1, and the judgment matrix and dimension element weight table pass the consistency test.
Judgment matrix of each influence dimension of the development path model of subjective evaluation index system of Jiangxi intelligent tourism construction level
The weight of each factor in the development path model of the subjective evaluation index system of Jiangxi “smart tourism” construction level
By looking into the element weight table of the development path model of information service construction of Jiangxi scenic areas under the vision of smart tourism, it can be seen that weight of element FG1 (construction level of relevant laws and regulations) is 0.2557, which is significantly higher than that of other elements. At the same time, weight of other elements generally varies between 0.05–0.15, which is close to each other. This result also coincides with the previous conclusion that the observers were easily affected by many factors when appraising the information service construction level of Jiangxi scenic areas under the vision of smart tourism.
Mathematical structure of “SEM-ANP”
Combining the objective evaluation (SEM) of smart tourism evaluation indicators obtained in section 2.1 above and the subjective evaluation (ANP) in section 2.2 above, in order to minimize the errors of each evaluation system. the next step that it combining the above 2 evaluation systems by constructing an objective function that minimizes the dispersion.
Through the interviewing data and literatures analysis, the latent variables of the smart tourism construction are the following 4 types, these are policy implementation and infrastructure construction, smart transportation, digital platform construction and database administration and its construction. The structural equation model of the evaluation index system of tourism construction level is obtained, and the Γ and B values of each latent variable to the evaluation index system are obtained. Combined with the Amos model, the final path coefficient of each latent variable to the evaluation index system is further obtained, assuming that each path coefficient is A. Through normalization, a normalized SEM objective evaluation index system is finally obtained.
Denoted as Bi, specifically as:
On this basis, suppose that there are a total of n evaluation indicators in the comprehensive evaluation problem of the evaluation index system, one evaluation methods is an objective evaluation method based on the SEM structural equation model; the other evaluation method is a subjective evaluation method based on the network analytic hierarchy process. Suppose the weight variables of the various evaluation index systems of these two methods are W1 and W2, then W1 = Bi; W2 = Wij (the ANP weighted super matrix calculated above), and also suppose the combined evaluation between SEM and ANP method, the vector is W0 = (w10, w20, . . . , wn0)
T
, among this, and the optimization model of the combined evaluation index system based on the SEM-ANP method to minimize the dispersion is:
Empirical analysis of “SEM-ANP”
Based on the mathematical logic of the SEM-ANP combined evaluation method proposed in 3.5 above, ignoring the influence of residuals, the path coefficients of the structural equation model of the objective evaluation index system of the Jiangxi smart tourism construction capability in Table 2 are normalized, and the path coefficient table is shown in Table 5.
Normalized path coefficients of the structural equation model of the objective evaluation index system
Normalized path coefficients of the structural equation model of the objective evaluation index system
According to Table 6, the normalization effects of the latent variables of the Jiangxi smart tourism construction level on the evaluation indicators are: policy implementation and infrastructure construction level (0.476), smart transportation construction level (0.050), enterprise and terminal platform construction level (0.178), information supervision and database construction (0.296).
The weight of each factor in the development path model of the subjective evaluation index system of Jiangxi “smart tourism” construction level
Based on the optimization model of the combined evaluation index system with the minimization of dispersion constructed in section 2.3.1 above, the normalized path coefficients of the objective evaluation index system and the weight coefficients of the development path model of the subjective evaluation index system are sequentially imported.
After calculation, the weight table of the combined evaluation index system of Jiangxi smart tourism construction level is shown in Table 6.
Through the analyzing the weights of the combined evaluation index system, it shows that compared with the subjective evaluation index system obtained by the ANP analysis method, the weights of the various dimensions of the combined evaluation system have been modified to a large extent, which in turn affects the set of elements contained in it. The weight to the overall. Among the secondary indicators, the weights of policy implementation and smart information infrastructure construction levels have dropped significantly, the weights of the other two secondary indicators, which are the level of enterprise and information terminal construction, and the other level of supervision and database construction have been effectively strengthened. Compared with the traditional subjective evaluation standard, it effectively corrects the systematic errors, which caused by the expert’s external environmental influence or internal subjective influence.
Based on the above research, it founds that the application of combined methods is typically innovative and advanced, in particularly compared with separate SEM or ANP method (Table 7).
Comparison between the analysis methods of “SEM-ANP”, “SEM” and “ANP”
Comparison between the analysis methods of “SEM-ANP”, “SEM” and “ANP”
SEM was originally proposed by Swedish statistician Karl G. Joreskog, which is collectively called Covariance Structural Modeling and it functioning for Casual Modeling [37]. Throughout the long history of SEM application, it has gained much attention and application in different disciplines, especially in field of management research, SEM method mostly was used for analyzing and sorting out the causal relationship of various latent variables, such as analyzing the direct influencing mechanism in the internalized process of “A⟶B” [7, 17]. Specifically, the advantages of SEM method can be summarized in 5 aspects. The 1st is that the combined effects of a large numbers of dependent variables can be analyzed at the same time. The 2nd is that the SEM allows a certain extent of errors in the measurement of independent variables and dependent variables. The 3rd is that the SEM analysis can start from the perspective of latent variables, and simultaneously estimate the internal reliability and validity of many indicators. The 4th is that the SEM is more flexible than other qualitative or quantitative methods, which can break the single one-to-one relationship between latent variables and analyze multiple factors under one indicator. The 5th is that SEM can directly explores the degree of agreement between the data and the model, and indicate whether the data is scientific and effective. All in all, scholars have reached a consensus that SEM is an extension to the general linear model (GLM), and it includes the path analysis, factor analysis, discriminant analysis, multiple analysis of variance, and multiple regression analysis. Therefore, SEM can be used for analyzing the logics between different factors and judge its prerequisite and usefulness.
As a traditional quantitative analysis method of variance calculation, SEM aims to explore the optimal linear path between the independent variables and dependent variables [44]. Contradicts the basic characteristics of the complex and nonlinear relationship between variables in social sciences [48]. Such problems are usually solved via qualitative theory, complexity theory and configuration theory. Furthermore, SEM also has the problem that asymmetry between cause and effect, which refers to the conditions that explanation of the existing results may be different from those without results. This may produce a risk of over relying on the data and fall into statics trap. Therefore, this study aims to find a better solution, avoid the disadvantages of SEM, extend its advantages, optimize the application of SEM method.
Advantages and disadvantages of ANP method
The ANP method is an iterative update of the AHP method, which can break the direct exploration of the tree structure analysis, and help to recognize the internal self-dependence and the relative importance between the element sets. ANP can realize the comparison of “A and B” and reduce the arbitrary judgments and conclusions, which produced in the evaluation of research decision makers and experts [52]. ANP is the calculation of element weights based on the differences in the structural characteristics of origin, transition, and receptivity [40]. When constructing a self-dependent matrix through a weight vector method of pairwise comparison, ANP can fully apply the thinking of experts or stakeholders, adopt an efficient and representative approach that providing a path for law exploration to convert judgments and metrics into probabilistic priority selection, so that the calculated solution can achieve the optimal choice [3].
However, the circumvention of evaluation arbitrariness is only reflected and compared with AHP, ANP still cannot completely get rid of the defects of subjective judgement, and cannot get rid of the underrepresentation problem caused by small sample data source [27]. But as the common consensus of differentiated thoughts and opinions, ANP is bound to be needed certainly help to change this kind of phenomenon. The combined analysis method proposed in this research has changed the current dilemma to a certain extent.
The Role and innovation of “SEM-ANP” combined method
As shown in the previous research, the proposal of the combined model of “SEM-ANP” structure is a new idea of showing a new method of management decision, evaluating in a multiple, systematic, and comprehensive perspective. According to the empirical analysis, the “SEM-ANP” combined method can provide beneficial support for construction engineering practice.
Specifically, the innovation of combined “SEM-ANP” has the following two points: Firstly, the “SEM-ANP” combined model is based on combined discriminant analysis that minimizes the mean deviation, avoiding the “statistical trap” of the original quantitative research, and repairing the qualitative research with less sample data. Secondly, the “SEM-ANP” combined analysis continues the advantages of SEM’s causal path process analysis, extends ANP’s superior ability of establishing factor weights, which forms a logical linkage of problematic exploration.
Conclusions and suggestions
Aiming at revealing the shortcomings of the current evaluation system for the level of digital smart tourism in scenic spots, this study analyzes the blindness and non-systematic problems of the two-single method of “SEM” and “ANP” evaluation index systems, innovatively proposed the “SEM-ANP” combined analysis method, which it is better fit for the evaluation model. On one hand, compared to the original “SEM” objective evaluation method based on the questionnaire data, the “SEM-ANP” combined analysis method is more effective to avoid the possibility of missing values, extreme values, which comes from the process of filing in the original data, and keep off the phenomenon of “statistical trap”. On the other hand, compared with the original subjective evaluation method of ANP or AHP, grayscale evaluation based on expert’s interviewing scoring data, the “SEM-ANP” combined analysis method has greatly reduced the blindness and the inconsistent scoring result data, which due to the different fields of the invited experts.
In general, the “SEM-ANP” combined analysis method is significantly better than the original “SEM” and “ANP” method. It is more innovative and scientific for the information service level of smart scenic spots. Therefore, it helps decision makers adopts to a more scientific suggestions and strategies, which is the main contribution of this study.
Theoretical analysis and empirical research both prove that the “SEM-ANP” evaluation method can accurately evaluate “smart tourism” in a certain region. Industrial operators and local government staff can carry out analysis with the method, in order to solve related problems based on the evaluation results of various elements and strengthen each link at the industrial chain. In this paper, the “SEM-ANP” combination evaluation index system is proposed to evaluate the “smart tourism” and information service of scenic areas. Such evaluation index system shows the advantage of ANP, which considers the personal subjectivity of decision makers. Meanwhile, it also takes the merit of SEM, which reduces the randomness of selection based on subjective experience. This is done by establishing the path of each latent variable. Therefore, this method effectively makes up for the shortcomings of traditional SEM model and ANP theory, and can be widely used in economics, psychology and other social sciences.
The study extracts the “smart tourism” indexes for evaluating the informatization construction at scenic sites. As for the weight analysis, however, the nature and number of experts who would make the sample evaluating matrixes needs to be more scientifically and reasonably improved, while the limited data sample is another factor that hinders the construction of evaluation index system. All the above-mentioned problems will be solved or mitigated in future studies.