
Abstract
Topic models are widely used in building clusters of documents for more than a decade, yet problems occurring in choosing the optimal number of topics. The main problem is the lack of a stable metric of the quality of topics obtained during the construction of topic models. The authors analyzed from previous works, most of the models used in determining the number of topics are non-parametric and the quality of topics determined by using perplexity and coherence measures and concluded that they are not applicable in solving this problem. In this paper, we used the parametric method, which is an extension of the traditional topic model with visual access tendency for visualization of the number of topics (clusters) to complement clustering and to choose the optimal number of topics based on results of cluster validity indices. Developed hybrid topic models are demonstrated with different Twitter datasets on various topics in obtaining the optimal number of topics and in measuring the quality of clusters. The experimental results showed that the Visual Non-negative Matrix Factorization (VNMF) topic model performs well in determining the optimal number of topics with interactive visualization and in performance measure of the quality of clusters with validity indices.
Keywords
Introduction
Topic models are used for finding patterns of words in a document collection using statistics and machine learning techniques. Especially in the big data era, topic models are effective means in text mining and knowledge discovery. Topic modeling [23] is an effective means of data mining in machine learning to build models from unstructured textual data, where samples as treated as documents. Huge collection of documents organized by topic modeling or by clustering. In topic modeling, the topic is defined by a cluster of words with the probability of occurrence of each word, and different topics have their respective cluster of words with corresponding probability. In clustering, the basic idea is to group documents into different groups based on some suitability measures. To perform grouping, each document is represented by a vector representing the weight assigned by tf-idf to words in documents. Topic modeling can project documents into a topic space which facilitates effective document clustering. Clustering helps us to identify the latent groups in a document collection and subsequently we can identify local and global topics. Researchers have applied topic models to cluster documents. Latent Dirichlet Allocation (LDA) [2] most widely used method in topic modeling for text mining that is based on an unsupervised statistical topic model where topics are fixed for the whole corpus and the number of topics is assumed to be known. As an unsupervised statistical model, LDA discovers underlying topics in unlabeled data. To find the optimal number of topics k, the LDA model applied for different values of k and pick the one which gives the highest coherence value. Topic coherence [19] is a relative measure to find the number of topics produced by a particular topic model. Usually, the perplexity measure used, which is an intrinsic evaluation metric [28] and [7] measured as the normalized log-like hood. Recent studies showed that perplexity is not correlated, sometimes anti-correlated, and cannot compare uni-gram and n-gram models, so topic coherence is used to find the optimal number of topics. Hierarchical Dirichlet Process (HDP) [27] is an extension of LDA, which is a Bayesian non-parametric model used to solve in finding the number of topics for the whole collection but not for a specific document, in which the number of topics need not be specified in advance and determined by collection during posterior inference. If the corpus is large, then take a uniform sample and run HDP-LDA. The hLDA model [3], and [4] regardless of data consider the number of topics as a hyperparameter. Detection of the number of topics is complemented with interactive visualization. In previous works, t-SNE [16], is a variation of SNE that is easier and to optimize and visual representation and produces significantly better visualizations by reducing the tendency to crowd points, iVis Clustering method [13] provide a two-dimensional plot that visualizes cluster similarities and graph-based representation relationship among data items so that user can interact with them. The UTOPIAN method [15] and [13], enables users to interact with the topic modeling method and steer the result in a user-driven manner, LDAVis [6] model is a web-based interactive visualization of topics estimated using LDA, which allows users to explore the topic-term relationship. SenLDA [12] is an extension of LDA to overcome the limitation in the generative and inference processes in finding the number of topics. In pyLDA [25] which combines python library for creation and visualization of the topic model to focus on the analysis of modeling results and in word cloud [26], and [24] used to visualize topics and to evaluate the quality of derived documents. In this big data era, the amount of online document data is growing with high velocity due to the widespread and availability of social media for sharing views and discussions of users, the large corpus is dealt in topic modeling in which finding number of topics and measuring their performance are having limitations of the proposed methods. The study of stable metrics for measuring the quality of topics and the use of cluster analysis tools for analysis and in finding the optimal number of topics continues. This motivated us to develop the hybrid topic models in which the optimal number of topics will be visually represented in word cloud form of different keywords used in the dataset and to represent the optimal number of topics in the form of Visual Assessment Tendency images and used validity indices instead of perplexity or coherence as performance measures in assessing the optimal number of topics. The rest of the paper is organized as follows: Section 2 presents the methodology, section 3 deals with experimental evaluation and discussion, and section 4 presents the conclusion and future enhancement of the work.
Methodology
Datasets description
For the experiment, the datasets collected from Twitter on 20 topics of health-related documents, TREC2014, TREC2015 Keyword Phrases Tweets collected from Twitter as described in [21] and Tweets extracted from Twitter related to 25 keyword phrases of TREC2018 [10] as described in Table 1 and 24KeywordPhrases of Measures to decrease COVID-19 Spread Dataset as in Table 2 are used. Experiments are implemented with Intel core i7 processor@3.4 GHz, 8MB cache, 16GB RAM, 1TB HDD, Python IDLE 3.9 with 64bit, NLP for text preprocessing, sklearn, Numpy, Pandas, and cvindex packages used. In Table 1, Tweets collected from Twitter on Measures to decrease COVID-19 spread dataset covers five themes i.e. decreasing the spread of COVID-19 theme with six keyword phrases, the second theme covers with next five keyword phrases, the third theme covers availability of pharmaceutical interventions with next five keyword phrases, fourth theme prevention, and control measures in schools with four keyword phrases and the fifth theme covers training measures to reduce community spread with rest of four keyword phrases.
Dataset keyword phrases description and size
Dataset keyword phrases description and size
Confusion Matrices of TREC2018 Twenty Keyword Phrases for k = 20
In [8] and [11] instability of topics for the order of process, the document was discovered and presented in the paper. To eliminate the order of dependence of documents in a corpus, to find the optimal number of topics, and to measure the quality of metrics the following procedure is adopted and explained in the following process diagram. Extracted Tweets documents from Twitter based on topics mentioned above are preprocessed with the NLP tool. Derived topic-document matrix and number of topics are treated as input to partition matrix. Under Euclidean distance, hybrid topic models [22] are applied for word cloud visualization and visual access tendency images in determining the optimal number of topics. The confusion matrix for this specified number of topics is displayed. Based on the values in the confusion matrix validity of the optimal number of topics is performed with validity indices and results are stored in the database. The process is repeated for the same value of k and treating k = 2 to k = 25, and the process is repeated for all datasets of 20 topics of health-related topics and 25 topics of TREC2018 keyword phrases. Results are stored in a database and graphs are generated for five validity indices and the optimal number of topics are selected based on cluster validity indices results.
Extract tweets from Twitter based on keyword phrases or topics on different datasets. Preprocess extracted tweets using the NLP tool. Assign k value for a particular dataset Apply hybrid topics models for clustering by using the Euclidean distance metric. Confusion Matrix developed for different hybrid topic models under distance metric. VAT images represented for different topics of a specific dataset. Find an optimal number of clusters using validity indices on a specific dataset. Repeat step 3 to step 7 for other specified datasets
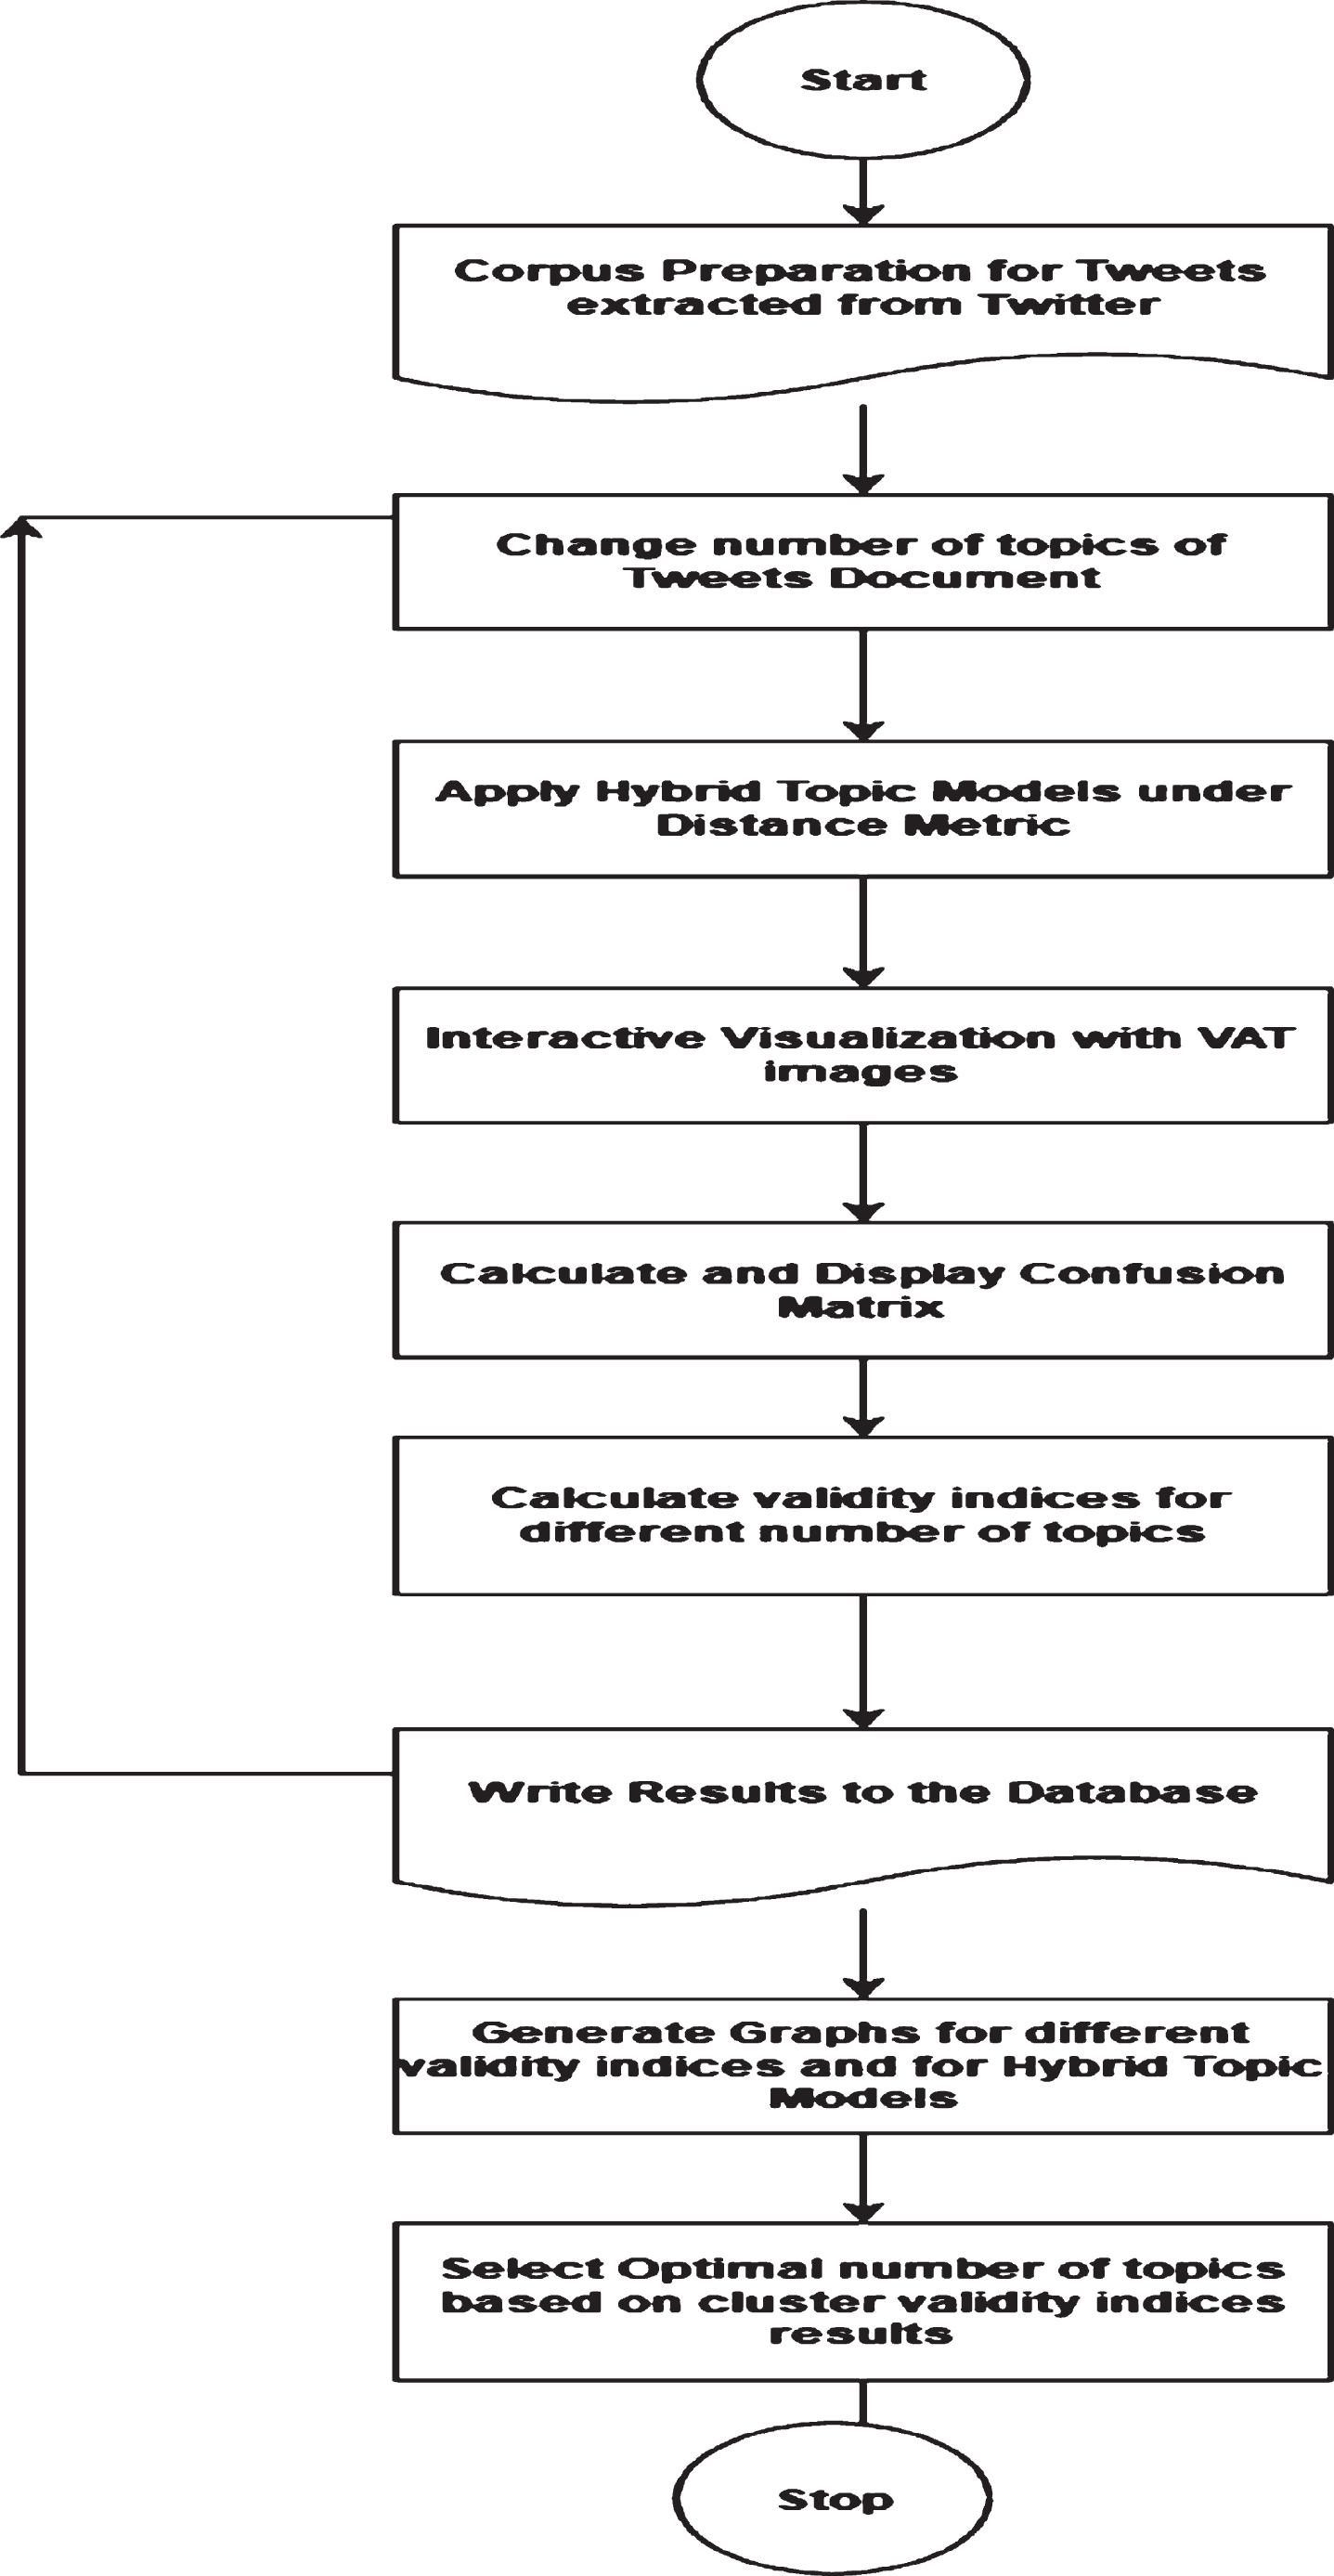
Process diagram to find the optimal number of topics.
Formation of word clouds for different topics
Document topic modeling is used to generate topics and word clouds from a large collection of textual information. In [14] MALLET topic modeling tool is used to generate topics and to give a list of topics in percentage. In this paper word clouds, the tool is used to describe results and trending keywords with the visual representation of word contents commonly used in the topic cluster with each word’s frequency correlated with font size. Word clouds are generated for all datasets as described above. Few samples are shown in Fig. 2 in which four keyword phrases of TREC2014 and TREC2015 and two keyword phrases of TREC2014 and TREC2015 with word intensity are displayed, which helps users to quickly evaluate the number of keywords used.
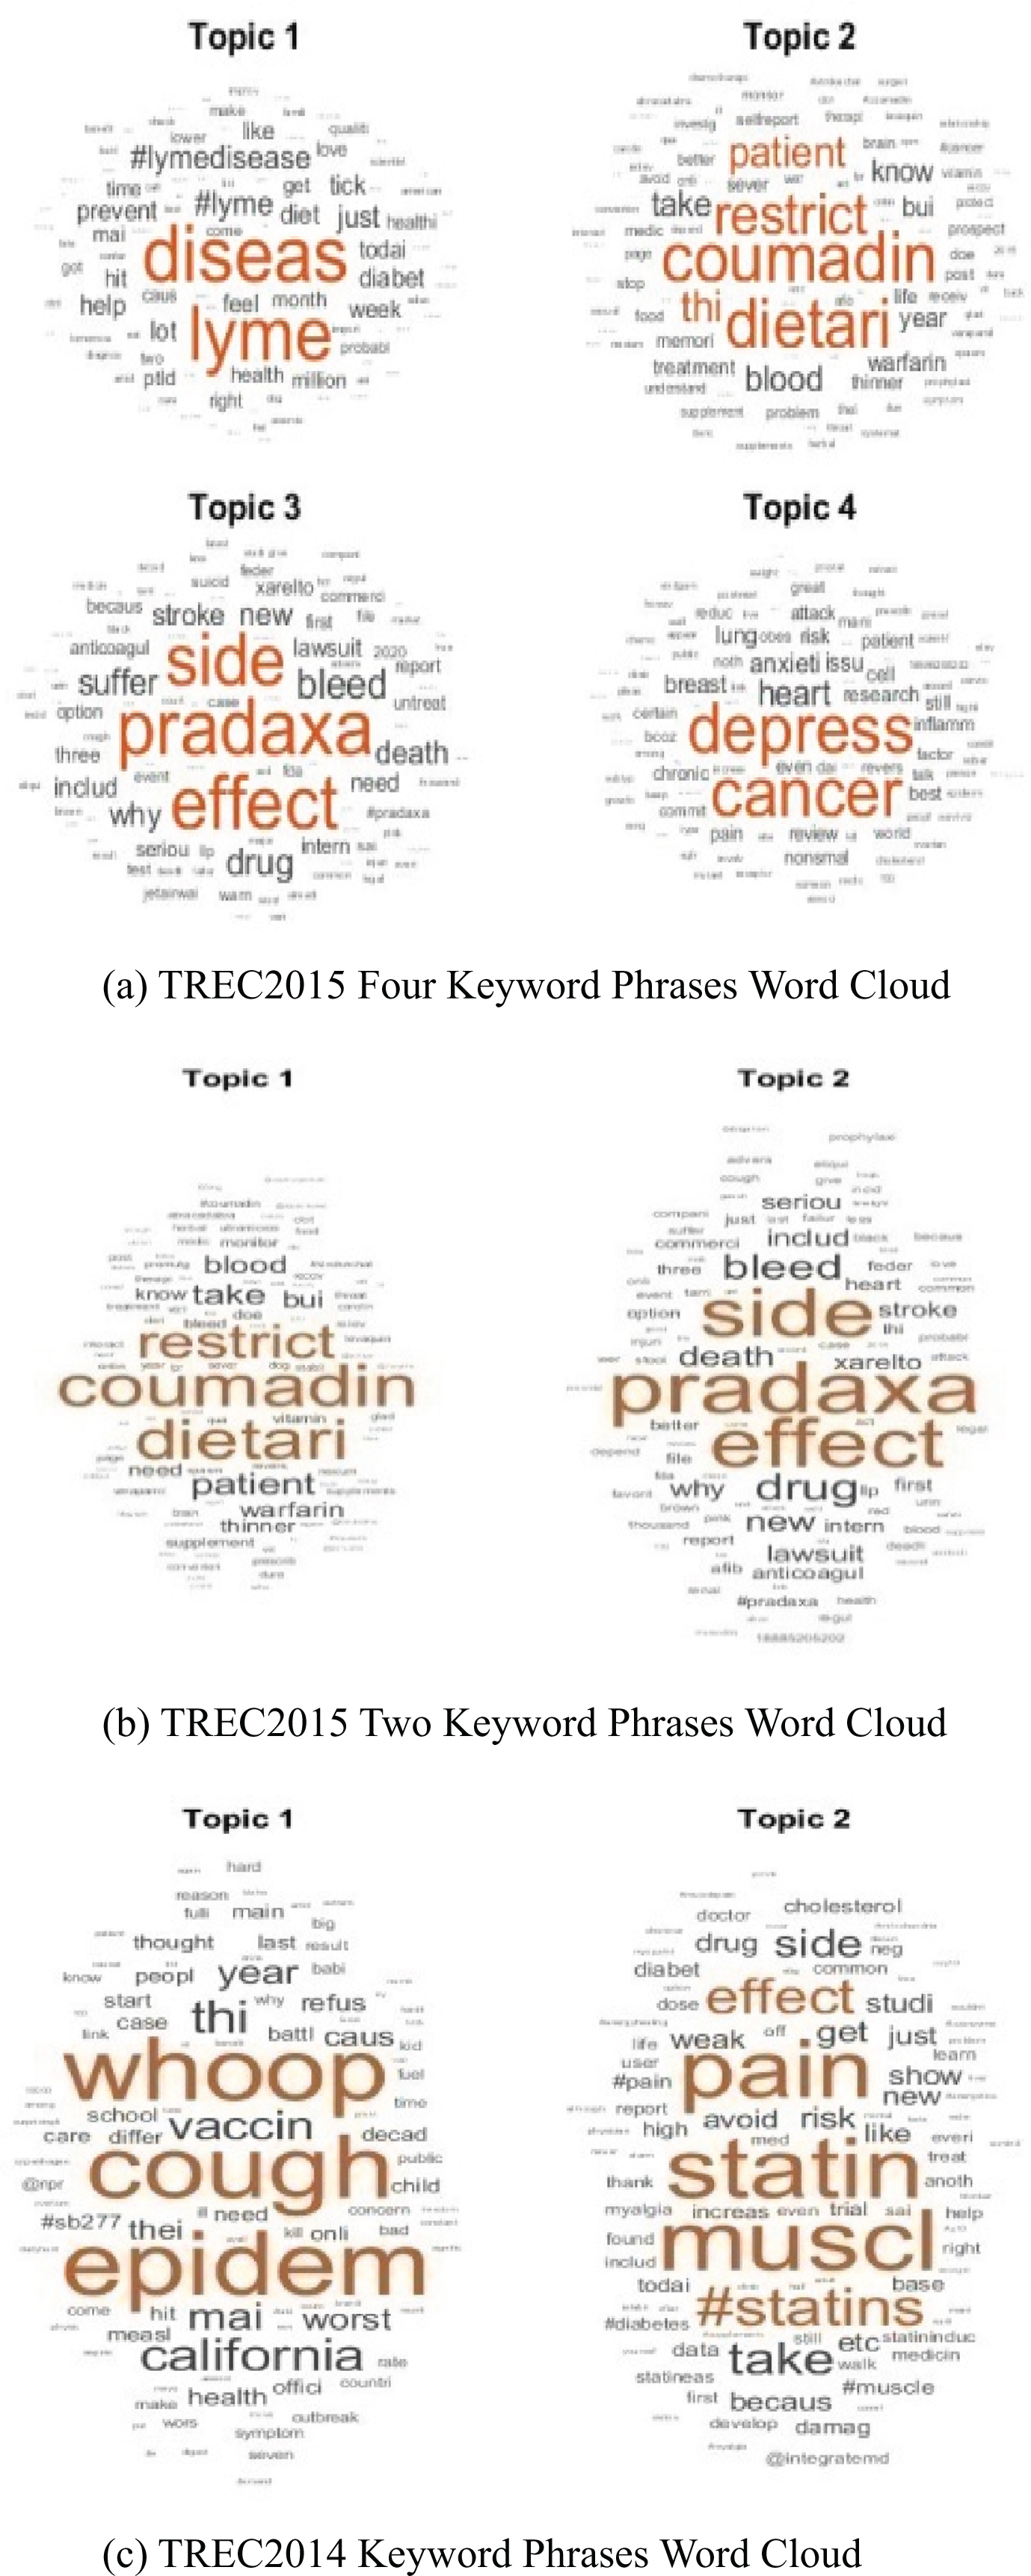
Word clouds of twitter datasets.
Steps for Tweets Document Clustering: Preprocess the extracted tweet documents of different datasets to remove punctuations and special symbols, remove short words, tokenization, and stemming. Determine the feature extraction of tweet documents using four traditional topic models NMF, LDA, LSI, and PLSI. Features of tweet documents are labeled as D1, D2 . . . Dn for the total n documents in each dataset. Compute the distance using Euclidean and update values of D1, D2 . . . Dn .
Dissimilarity matrix of tweet documents is computed. Apply visual method-VAT on dissimilarity matrix and results are stored in reordered dissimilarity matrix. Cluster assessment represented with VAT image by finding the heat map of reordered dissimilarity matrix. Clustering results k of cluster labeled tweet documents is determined.
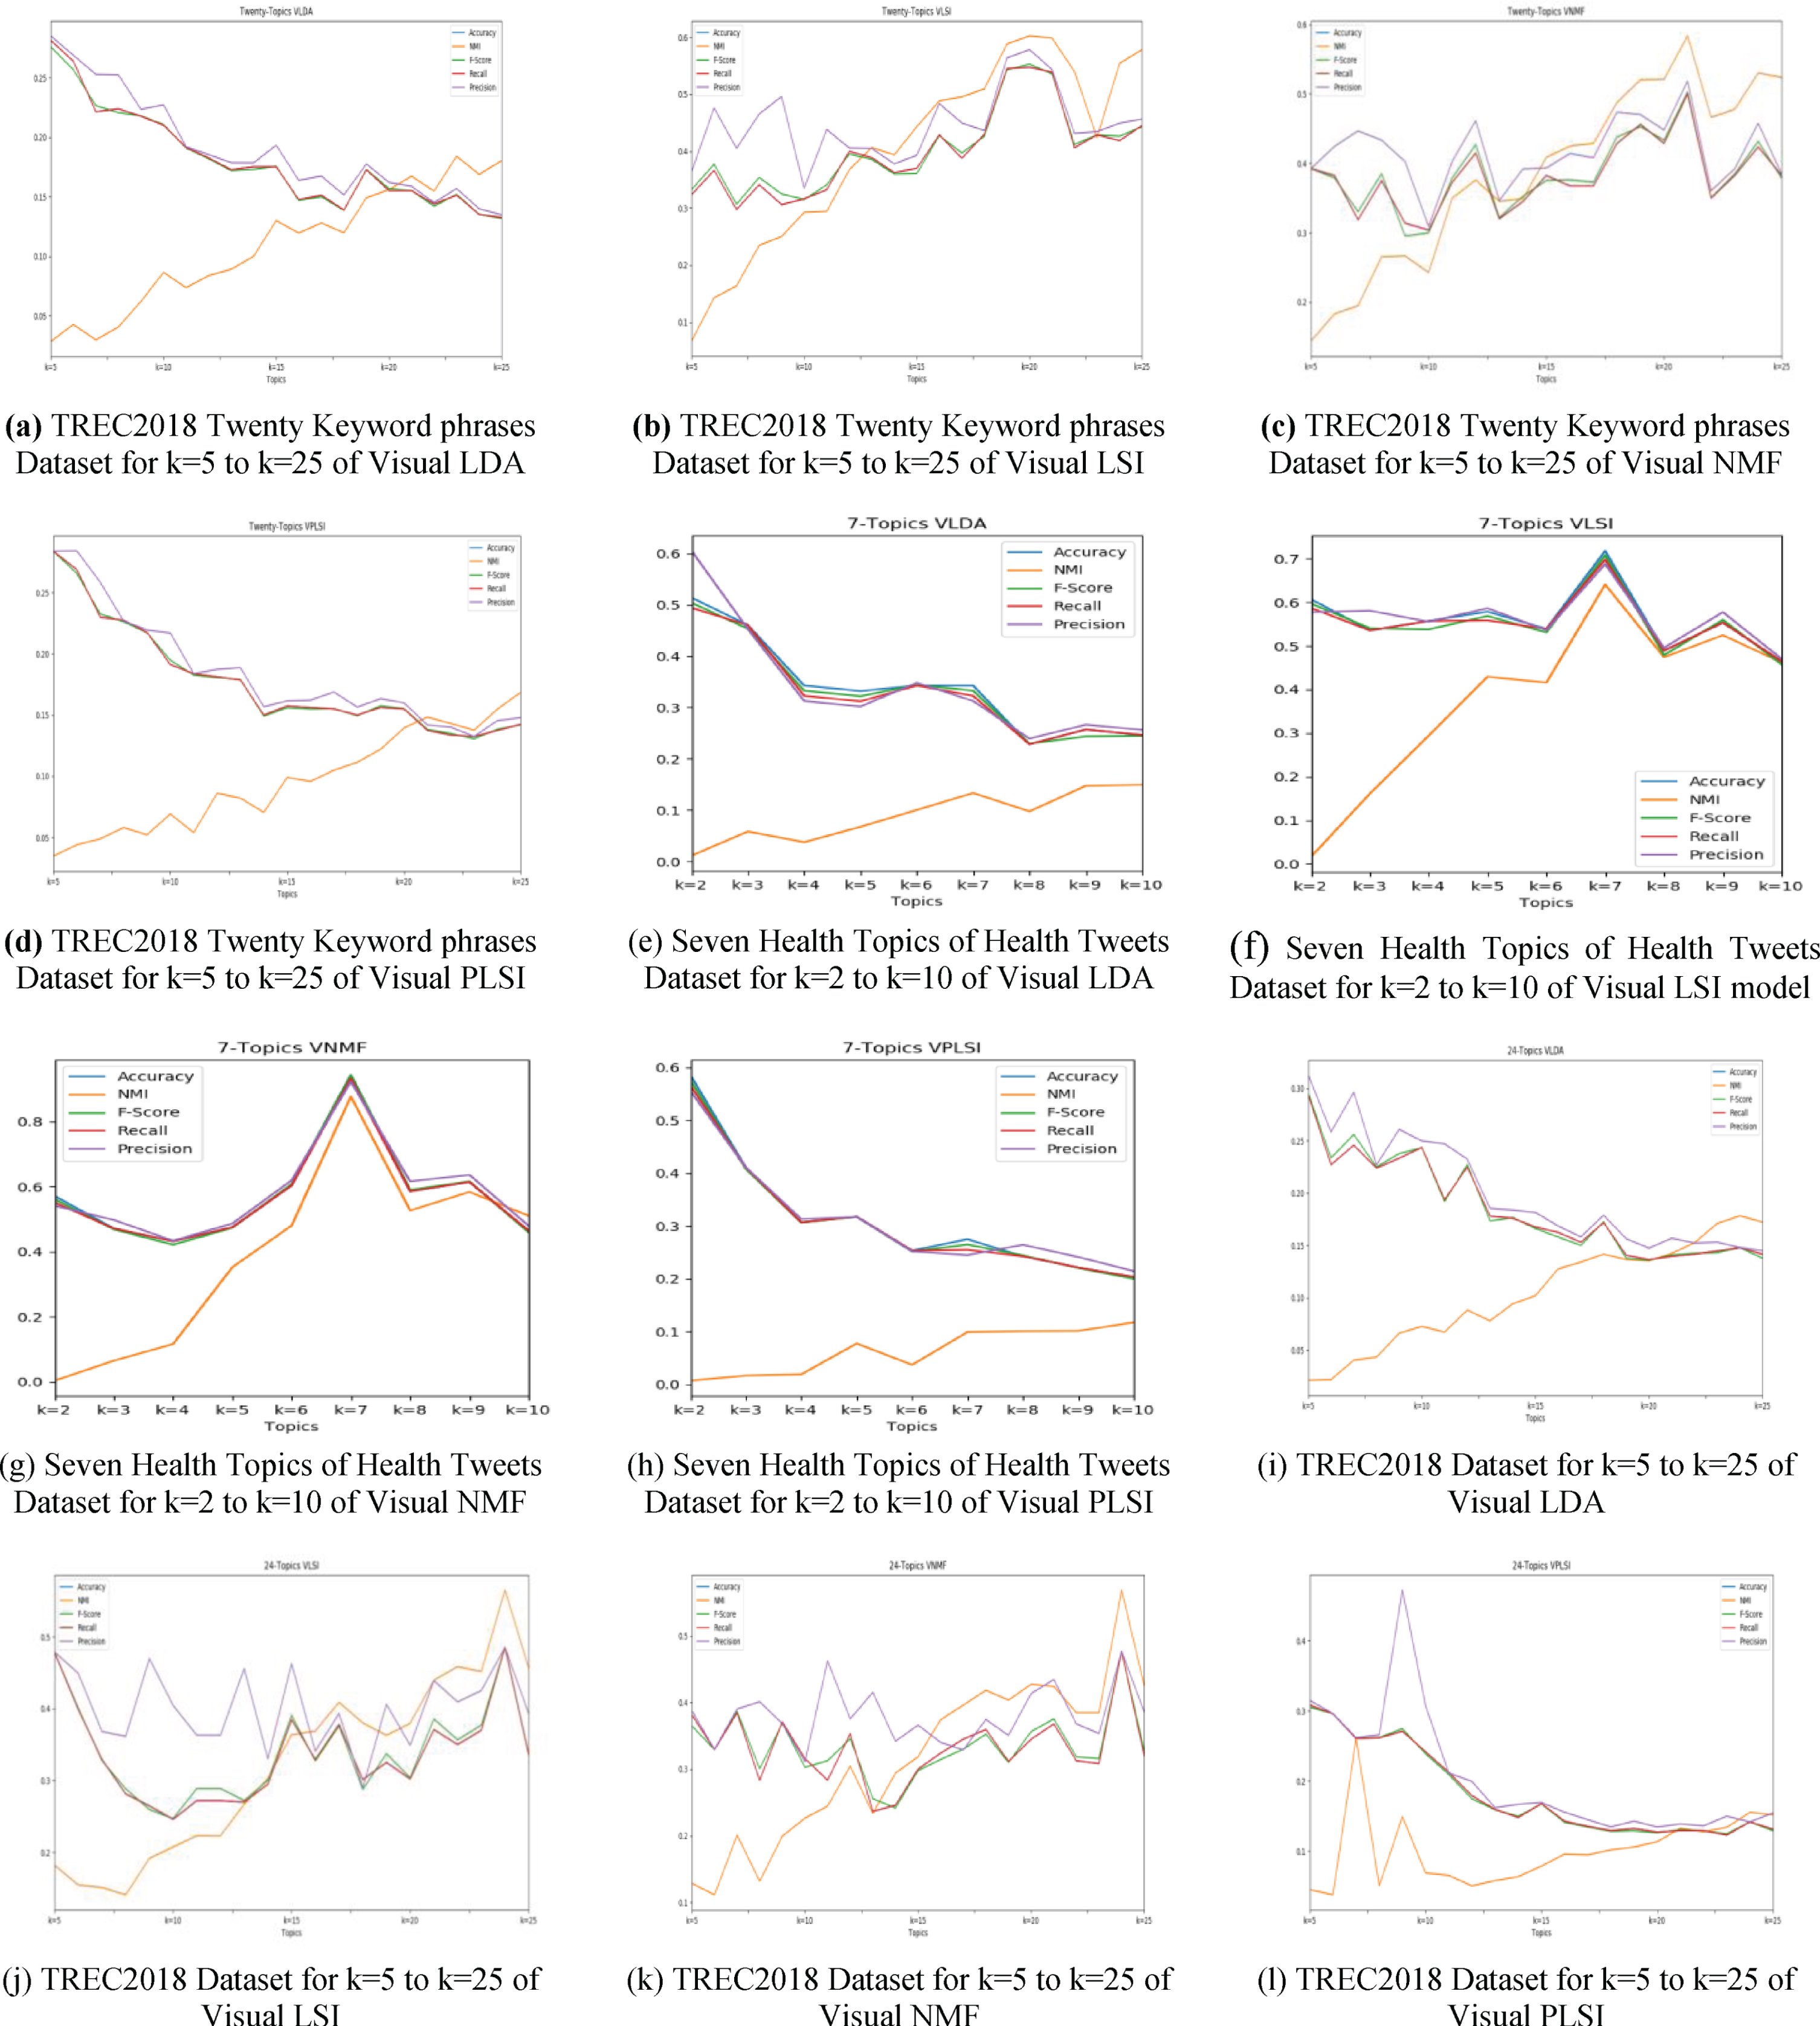
Visual assessment of the optimal number of topics is shown in Fig. 3 for TREC2018 twenty keyword phrases for proposed hybrid topic models viz., Visual LDA (VLDA), Visual LSI (VLSI), Visual NMF (VNMF), and Visual PLSI (VPLSI) models under Euclidean distance metric as a sample. We have generated VAT images for all datasets of various topics used in Twitter Health Topics datasets, TREC2014, TREC2015, TREC2018, and Measures to decrease COVID-19 spread keyword phrases datasets of tweets collected from Twitter. From the above VAT images, every individual topic is represented as dark square-shaped blocks along diagonal. The quality and number are recognized with more quality of shape in the VAT image. We experimented by taking a sample total number of tweets based on the number of topics and repeated by changing values of k from 2 to 25 and all generated images for all four hybrid topic models are stored. In the above figure, a sample of TREC2018 for 20 keyword phrases dataset is considered and VAT images are presented for four models by varying k values from 2 to 25. From the visual evidence of Fig. 3, it is observed as k values vary overlapping of tweets occurring which is visual evidence by enhancing VAT images. Among these models, Visual LSI and Visual NMF are generating good results in identifying the optimal number of topics when compared to Visual LDA and Visual PLSI models. Visual NMF best performed in finding the optimal number of topics not only in Visual representation and also in measuring quality by using cluster validity indices, which is shown in the ensuing section.
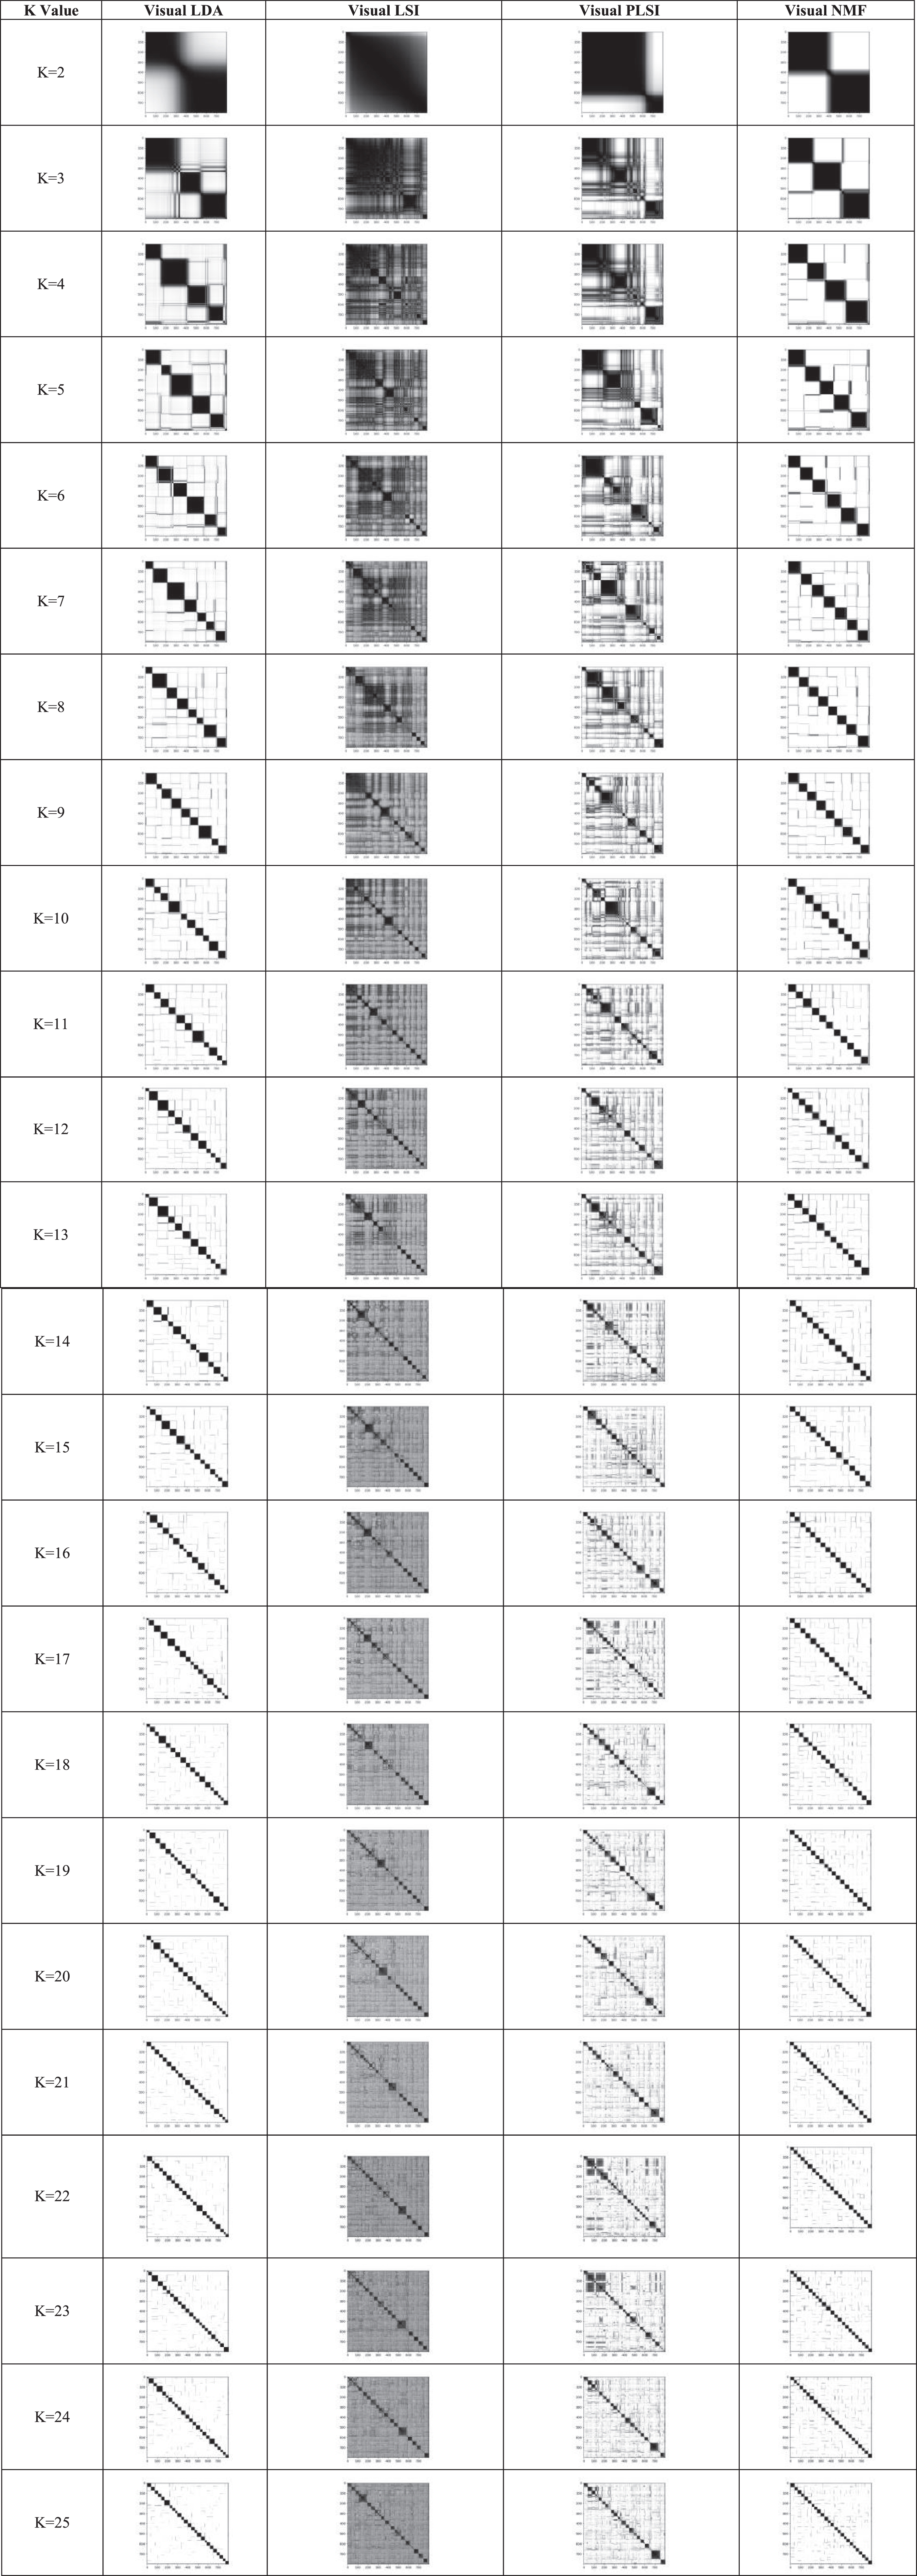
Assessment of the number of topics with VAT images using hybrid topic modeling techniques.
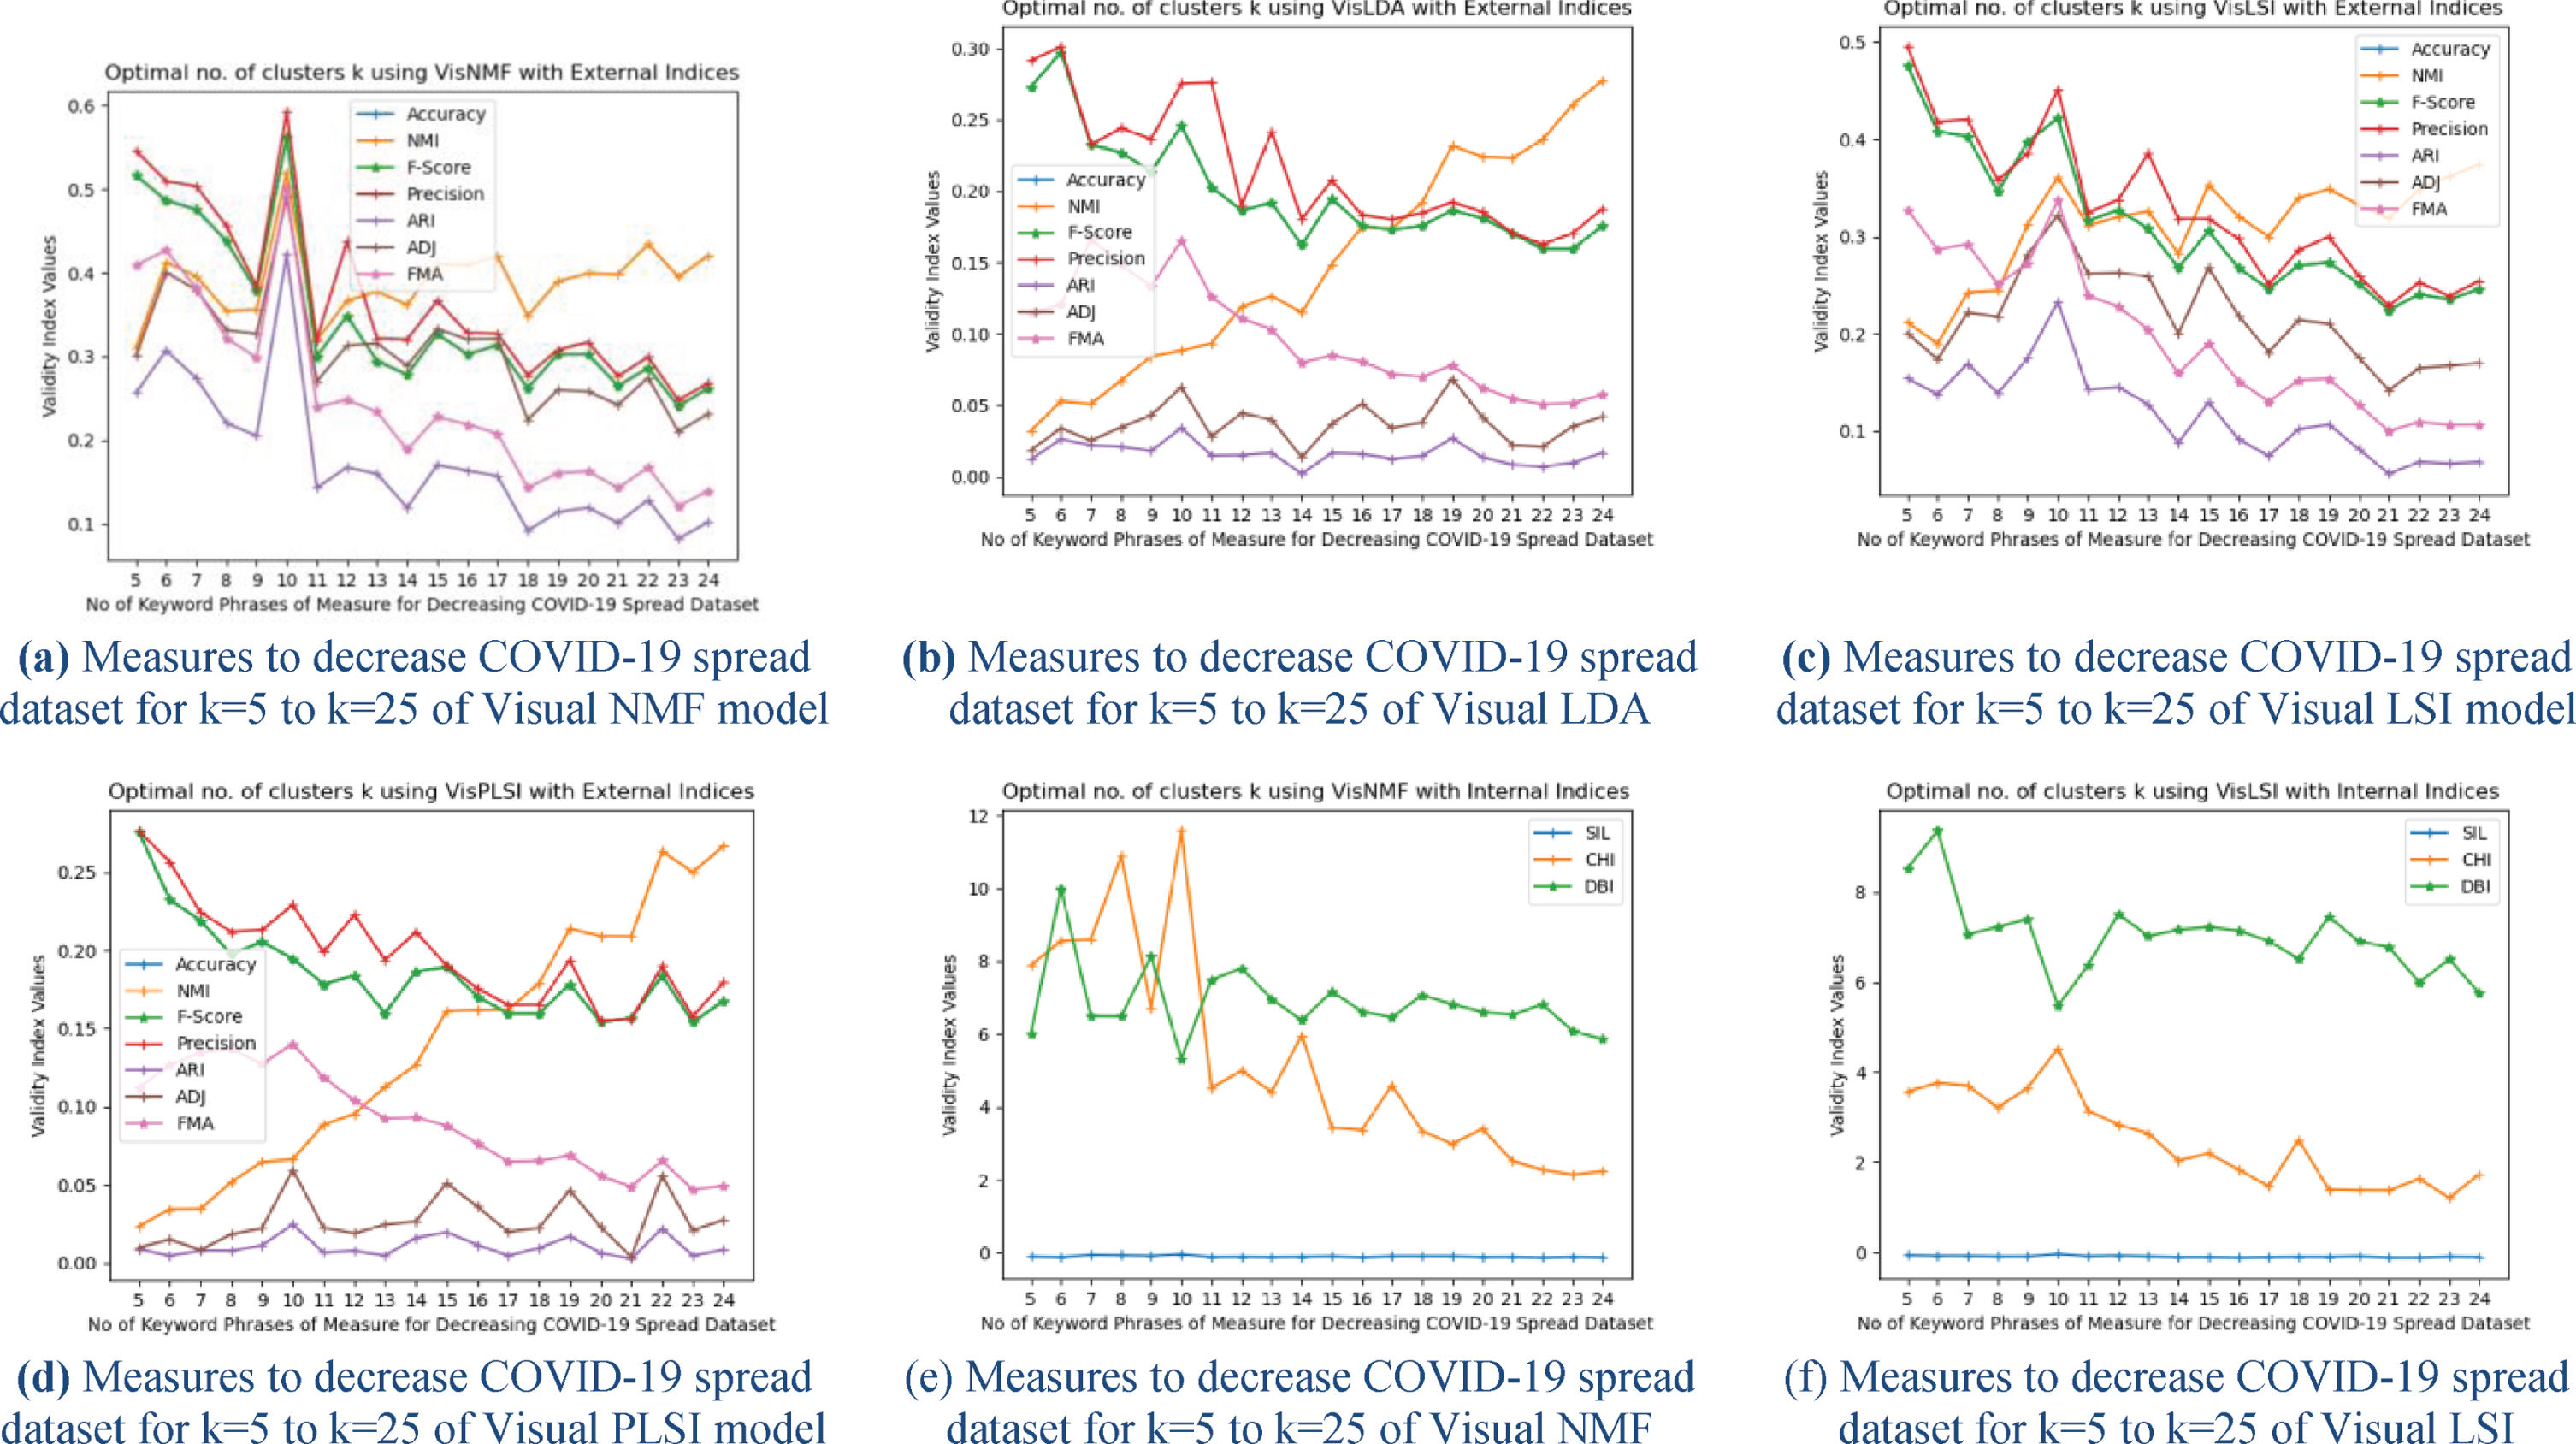
In [18] and [5] qualitative evaluation of topic –author and topic-word are evaluated in terms of perplexity, although it may generate meaningful results in some cases, it is not stable and results vary with selected seeds for the same dataset. Recent studies showed that perplexity is not correlated and sometimes anti-correlated. Topic coherence [9] is a relative measure to find the number of topics produced by a particular topic model and to measure the quality of the topic. It measures by considering the semantic similarity of topics. It is not suitable to measure semantically unrelated topic words. The use of cluster analysis is one of the tools for analyzing the stability of topics and in finding the optimal number of topics. For cluster validity, external and internal validity indices are widely applied to a large set of document clustering. Recent advances in biotechnology have generated a massive amount of biological and medical data for disease diagnosis, pathogen identification, identification of patterns and structures among a large set of samples, and pulseNet merged by the Center for Disease Control (CDC). Here we used document-based validity indices to measure quality and to find the number of topics viz. accuracy [20], normalized mutual information [1], F-score, recall, precision [17, 30], Adjusted Rand Index (ARI), Adjusted Mutual information (ADJ), Fowlkes-Mallows Index (FMI), Silhouette Coefficient Index (SIL), Calinski-Harabasz Index (CHI), and Davis-Bouldin Index (DBI). A sample confusion matrix [29] generated for TREC2018 twenty keyword phrases datasets collected as described in Table 1, when k = 20 for four models generated results are shown in Table 2, from these true positive (TP), true negative (TN) and false-negative (FN) values are calculated, and with these values, accuracy, NMI, F-Score, recall and precision values for each topic varying values from k = 2 to k = 25 are calculated and tabulated. Results are represented in the form of a sample table and sample line graphs from which the optimal number of topics is estimated based on these values of indices. In Table 3 and Table 4 performance measure values of accuracy, normalized mutual information, F-Score, recall, and precision values of TREC2018 seventeen keyword phrases same dataset for different values of k ranging from k = 5 to k = 20 are tabulated as a sample. On observation of these values, it is found that at k = 17 all validity indices values are higher for each of these five validity indices which are highlighted by bolded, and among these four hybrid topic models, Visual NMF and Visual LSI performed well. Visual NMF is probabilistic, whereas Visual LSI is not a probabilistic topic model. Similarly, all values for all topics for different values of k are tabulated. On overall observations, the Visual NMF topic model performs well in visual representation and in finding the optimal number of topics based on values of validity indices measures. In Fig. 4(a) to Fig. 4(e), a performance measure of TREC2018 fifteen keyword phrases tweets datasets collected from Twitter on four different topics models Visual NMF (VNMF), Visual LDA (VLDA), Visual LSI (VLSI), and Visual PLSI (VPLSI) of accuracy, normalized mutual information, F-Score, precision, and recall are represented as bar graphs for the same dataset for different values of k = 5 to k = 20. On observation of these experimental results of all validity indices Visual NMF (VNMF) values are high at k = 15, in the case of Visual LSI values are high in between k = 15 to k = 18. The rest of the two models’ results are not at a considerable level. From these results, the optimal number of topics determined is Fifteen, which also proved from the visual representation of VAT images. In Fig. 4(f) the cluster quality of Measures to decrease COVID-19 spread dataset ensured with purity metric calculated using TP, TN, FP, and FN values.
Performance measures of TREC2018 seventeen keyword phrases dataset for values of k = 5 to k = 20
Performance measures of TREC2018 seventeen keyword phrases dataset for values of k = 5 to k = 20
Performance measures of TREC2018 seventeen keyword phrases dataset for values of k = 5 to k = 20
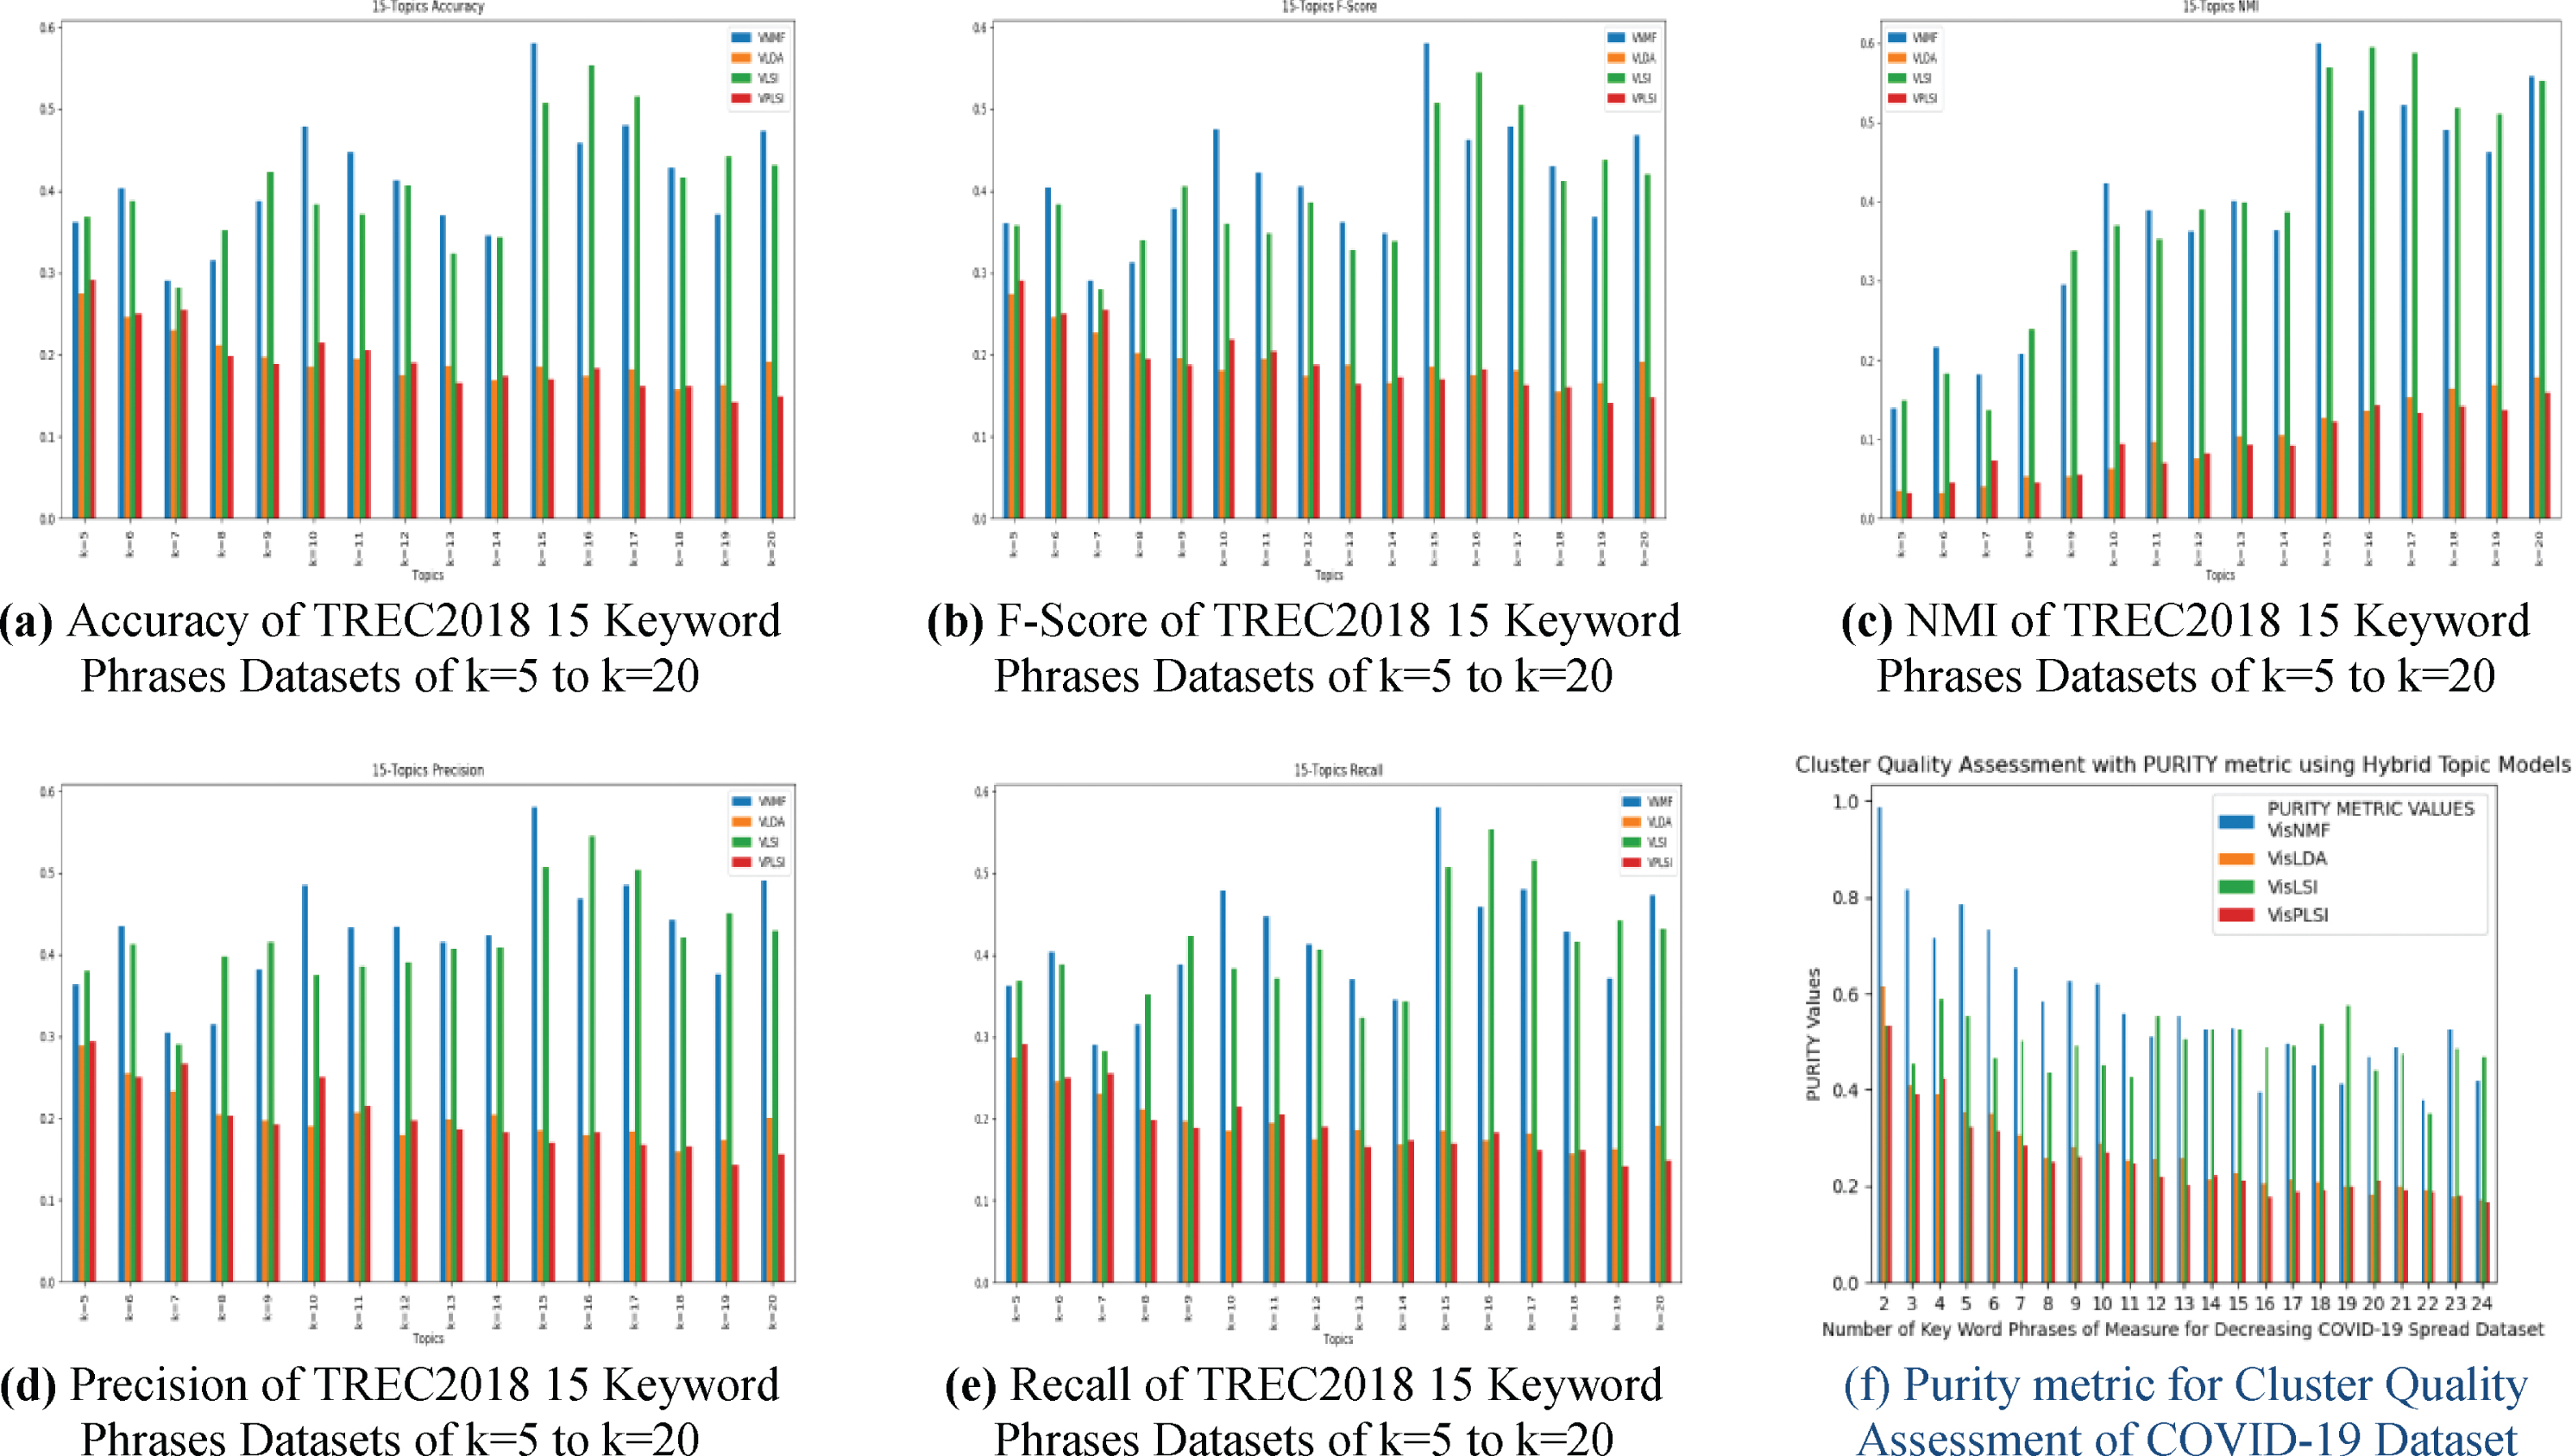
Performance measure of TREC2018 fifteen keyword phrases datasets and purity metric of COVID-19 dataset.
On observation of the comparative bar graph, we can infer that purity of the cluster decreases as the number of keywords increases, but consistency is maintained with all four hybrid topic models. Among these four models, VisNMF model values are higher and maintain a good quality of cluster than other models.
In Fig. 5(a) to Fig. 5(f), a performance measure of Measures to decrease COVID-19 spread tweets dataset collected from Twitter on four different topics models Visual NMF (VNMF), Visual LDA (VLDA), Visual LSI (VLSI) and Visual PLSI (VPLSI) of ADJ, ARI, FMI, HI, CHI, and DBI metrics are represented as bar graphs for the same dataset on different values of k = 5 to k = 24. On observation of these experimental results of all validity indices Visual NMF (VNMF) values are high at k = 10, and low for the DBI validity index. From these results, the optimal number of topics determined is ten, which also proved from the visual representation of VAT images. In Fig. 6(a) to Fig. 6(d), performance measures results of accuracy, NMI, F-Score, Recall and Precision of TREC2018 Twenty keyword phrases tweets datasets collected from Twitter and processed on four different topics model Visual NMF (VNMF), Visual LDA (VLDA), Visual LSI (VLSI) and Visual PLSI (VPLSI) are represented as line graphs for the same dataset for different values of k = 5 to k = 20. On observation of these experimental results of all validity indices Visual NMF (VNMF) values are high at k = 20, in the case of Visual LSI values are higher in between k = 18 to k = 20. The line graph of Visual NMF (VNMF) at k = 20 is steep and well defined, whereas in the case of Visual LSI (VLSI) line is blunt and lies between 18 and 22. The rest of the two models’ results are not at a considerable level. From these results the optimal number of topics determined as k = 20, which also proved from the visual representation of VAT images. Similarly, the optimal number of topics is determined and results are recorded for all datasets used in our experiments. In Fig. 6(e) to Fig. 6(h), performance measures results of accuracy, NMI, F-Score, Recall and Precision of 7 Topics of health tweets datasets collected from Twitter and processed on four different topics model Visual NMF (VNMF), Visual LDA (VLDA), Visual LSI (VLSI) and Visual PLSI (VPLSI) are represented as line graphs for the same dataset for different values of k = 2 to k = 10. On observation of these experimental results of all validity indices, Visual NMF (VNMF) values are high at k = 7 than other models. The line graph of Visual NMF (VNMF) at k = 7 is steep and well defined, whereas in the case of Visual LSI (VLSI) line graph is steep but values are less than VNMF results. From these results the optimal number of topics determined as k = 7, which also proved from the visual representation of VAT images. Similarly, the optimal number of topics is determined and results are recorded for all health-related datasets used in our experiments. In Fig. 6(i) to Fig. 6(l), performance measures results of accuracy, NMI, F-Score, Recall and Precision of TREC2018 Twenty Four keyword phrases tweets datasets collected from Twitter and processed on four different topics models Visual NMF (VNMF), Visual LDA (VLDA), Visual LSI (VLSI) and Visual PLSI (VPLSI) are represented as line graphs for the same dataset for different values of k = 5 to k = 20. On observation of these experimental results of all validity indices Visual NMF (VNMF) values are high at k = 24, in the case of Visual LSI values are higher at k = 24 but lesser than Visual NMF (VNMF) values. The line graph of Visual NMF (VNMF) and Visual LSI (VLSI) at k = 24 is steep and well defined, but values vary. From these results the optimal number of topics determined as k = 24, which also proved from the visual representation of VAT images. Similarly, the optimal number of topics is determined and results are recorded for all datasets used in our experiments.
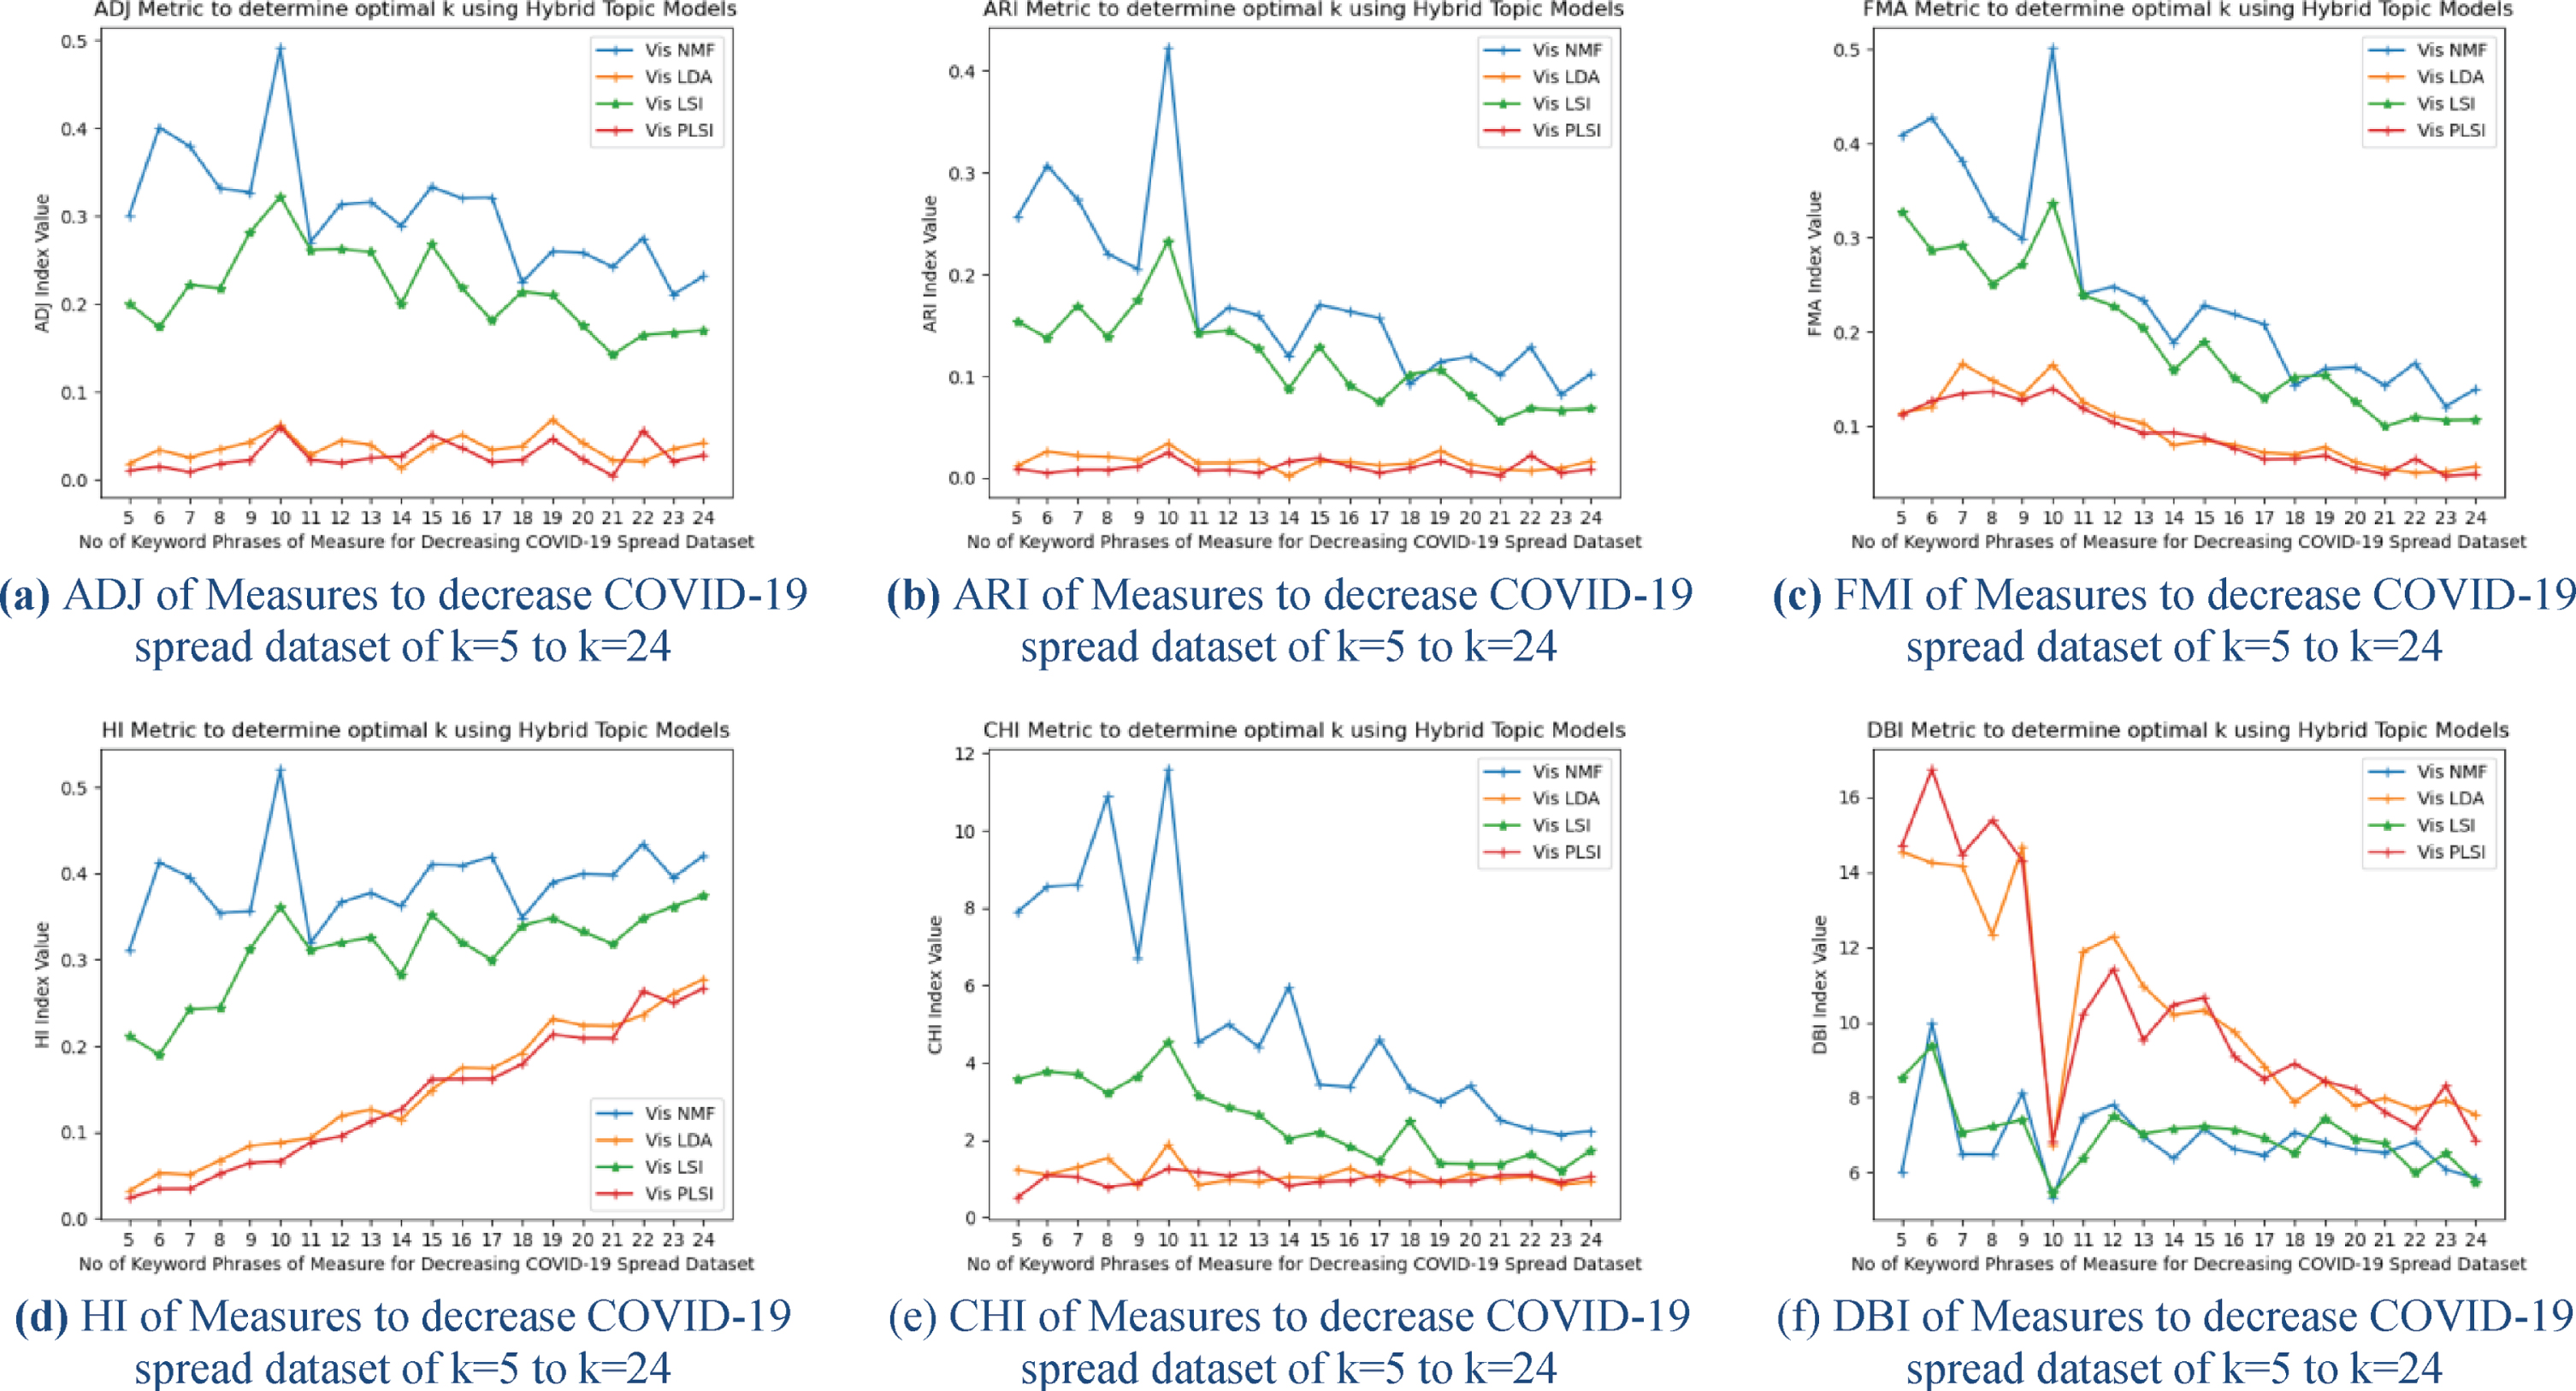
Performance measure of measures to decrease COVID-19 spread dataset with ten keyword phrases.
Performance comparison of TREC2018 and health topics datasets with four hybrid topic models.
In Fig. 7(a) to Fig. 7(d), performance measures results of accuracy, NMI, F-Score, Recall, Precision, ARI, ADJ, FMI of Measures to decrease COVID-19 spread tweets datasets collected from Twitter and processed on four different topics model Visual NMF (VNMF), Visual LDA (VLDA), Visual LSI (VLSI) and Visual PLSI (VPLSI) are represented as line graphs for the same dataset for different values of k = 5 to k = 24. On observation of these experimental results of all validity indices, Visual NMF (VNMF) values are high at k = 10 than other models. The line graph of Visual NMF (VNMF) at k = 10 is steep and well defined, whereas in the case of Visual LSI (VLSI) line graph is steep but values are less than VNMF results. From these results the optimal number of topics determined as k = 10, which also proved from the visual representation of VAT images. In Fig. 7(e) and Fig. 7(f), performance measures results of SIL, CHI, and DBI internal indices of Measures to decrease COVID-19 spread tweets datasets collected from Twitter and processed on four different topics model Visual NMF (VNMF), Visual LDA (VLDA), Visual LSI (VLSI) and Visual PLSI (VPLSI) are represented as line graphs for the same dataset for different values of k = 5 to k = 24. On observation of these experimental results of validity indices SIL, and CHI values of Visual NMF (VNMF) values are high and DBI values are low at k = 10 than other models. The line graph of Visual NMF (VNMF) at k = 10 is steep and well defined, whereas in the case of Visual LSI (VLSI) line graph is steep but values are less than VNMF results. From these results the optimal number of topics determined as k = 10, which also proved from the visual representation of VAT images.
Performance comparison of measures to decrease COVID-19 spread dataset with four hybrid topic models.
Topic modeling is an effective means of data mining and cluster analysis in machine learning to build models from unstructured textual data, where samples as treated as documents. While applying topic modeling key challenge is the selection of the appropriate number of topics and choosing a quality metric in performance measurement. Most of the previous works in the determination of the number of topics are non-parametric and the quality of topics determined by using perplexity and coherence measures, to overcome limitations we proposed the parametric method, which is an extension of the traditional topic model with visual access tendency for visualization of the number of topics (clusters) to complement clustering and to choose the optimal number of topics based on results of cluster validity indices. To summarize, we have proposed a new measure for identifying the right number of topics in a given corpus by considering distributions generated from topic-word and document-topic matrix outputs of hybrid topic models, visual representation of the number of topics with VAT images, and performance measure with validity indices. Experimental evaluations on different datasets of health-related tweets, TREC2014, TREC2015, TREC2018, and Measures to decrease COVID-19 spread keyword phrases based datasets with four proposed visual topic models proved that they are useful in interactive visualization of the optimal number of topics and for selecting the number of topics. Each of the proposed hybrid topic models’ highest probable topic assignment, feature selection, feature extraction, visual representation, yielded the best clustering results of different types of datasets experimented and also in finding the different number of clusters among datasets. We examine the usefulness and stability of models with alternative models and applied cluster validity indices accuracy, NMI, F-Score, recall, precision, ARI, ADJ, FMI, HI, SIL, CHI, and DBI to measure quality and in the determination of the optimal number of topics by running the same datasets with different values of k and choose the optimal number of topics. This application of hybrid topic models approach to cluster analysis of large Twitter-based datasets and validity indices in finding an optimal number of clusters can greatly improve the accuracy and efficiency of subgroup identification and proposed hybrid models and techniques in tweets document clustering and optimal number identification provide a new approach for data mining of twitter-based datasets in biological and medical research. The results confirm that the Visual NMF (VNMF) model is stable, accurate, and effective for all numerical experiments presented and for various datasets used in visual representation and in determining the optimal number of topics. The future work is to extend hybrid topic models as scalable approaches for reducing the computational cost and space complexity values.
Funding
This research did not receive any specific grant from funding agencies in the public, commercial, or not-for-profit sectors.
Conflicts of interest
The authors declare no conflict of interest.