
Abstract
Capital enrichment (CE) results from capital flows, which reflect the capital distribution among different regions and industries. This paper constructs the evaluation model of resource allocation efficiency from the perspective of capital and innovation resources. It expounds on CE’s theoretical mechanism by using the panel data from 2011 to 2018 for system GMM estimation. It finds that the manufacturing capital allocation efficiency (CAE) and innovation resource allocation efficiency (IRAE) show a volatile development trend. Both static and dynamic panel models show that there is a significant U-shaped curvilinear relationship between CE and CAE, CE and IRAE. CE’s inhibitory effect on CAE and IRAE decreases with the improvement of CE until it exceeds the critical value of 8.27 and 8.93. After that, its impact on CAE and IRAE changes from negative to positive.
Keywords
Introduction
With the continuous change of market demand structure and resource endowment, the traditional benefits of China’s manufacturing industry have continued to weaken. Some manufacturing industries with low-profit margins are transferred to the service sector. Driven by the national policy orientation and the profit-driven nature of capital, a large amount of capital is gradually concentrated in industries with strong innovation or profitability. CE is a scarce production factor for the innovative development of manufacturing. In addition to increasing the total capital, it also causes the redistribution of creative resources such as information, knowledge, and talent among different industries or enterprises. Some scholars have analyzed the effect of CE, but the perspective mainly focuses on the spatial spillover effect of capital on economic development [1–4] labor productivity [5, 6], and total factor productivity [7–9]. It ignores the CAE and IRAE brought by capital enrichment or capital accumulation, which is a crucial factor affecting economic growth and industrial development [10].
CE is the result of capital flows of economic activities among various industries or sectors, which will inevitably cause changes in CAE. Due to institutional and policy reasons, capital in the capital market has not been effectively allocated. Capital misallocation or distortion is common. Studies by Wurgler [11] and Hsieh and Klenow [12] find that the CAE in China is still at a low level, and there are apparent regional and industry heterogeneity [13, 14]. However, research on CAE mainly focuses on financial development [15, 16], interest rate liberalization [17, 18], and country’s opening degree [19, 20]. It is rarely involved in the impact of the informal system represented by capital on its allocation efficiency. Allen et al. [21] verified its effect on social capital, but it is regional study, lacking the necessary theoretical support and internal logic analysis.
Given the profit-driven nature of capital, it flows spontaneously to industries with a higher return on investment (ROI) [11], resulting in capital space reallocation. This further drives the concentration of talents, funds, information, and other innovation resources to high-tech manufacturing industries with higher capital allocation efficiency. Investment in innovation resources increases. However, compared with other leading manufacturing countries, the quality of innovation output and technological progress of China’s manufacturing is still relatively low. The dependence of core technologies on foreign countries is severe, showing a prominent phenomenon of the “Solo Paradox” The impact of CE on innovation resource allocation efficiency needs to be further explored.
In summary, the existing literature on CE and its effects is mainly based on social CE and its economic impact. Theoretical models and systematic studies on CAE and IRAE are far less, and the nonlinear effects of CE on resource allocation efficiency are ignored. The following questions need to be solved. As the national economy’s pillar industry, are manufacturing capital and innovation resources allocated effectively? What are the dynamic trends in the CAE and IRAE? What is the impact of CE on CAE and IRAE?
All the above questions are worthy of attention. Therefore, this paper studies the relationship between CE, CAE, and IRAE based on the panel data of 28 sub-sectors of China’s manufacturing industry. To clarify the resource allocation effects of CE, it analyzes their internal action path, which provides theoretical and data support for the manufacturing industry’s innovative development.
The marginal contribution of this paper lies in:
First, the new research perspective. This paper reveals the dynamic changing trends of CAE and IRAE from the perspective of CE. It provides a complete logical framework and empirical evidence.
Second, the improvement of research methods. The dynamic and static panel models are used to investigate the curvilinear relationship between CE, CAE and IRAE. It alleviates the endogenous problems caused by internal causality.
This paper provides a new perspective for the research of manufacturing capital enrichment and brings ideas for the high-quality development and transformation of China’s economy.
Theoretical analysis and hypothesis
CE increases the total amount of capital and causes the redistribution of information, knowledge, talents, and other innovation resources among different industries or enterprises. This section focuses on the theoretical elaboration of the relationship between CE and CAR, CE and IRAE.
Literature review
With the increasing demand for innovation and the continuous improvement of labor costs in the manufacturing industry, more and more enterprises have changed from cost-driven and market-driven to innovation-driven development. The technological changes caused by this are mainly materialized in new capital, forming the continuous accumulation of capital proposed by Blackburn and Cipriani [22]. Given the profit-seeking nature of capital and its imbalance in spatial development, industries or regions with lower capital costs are more likely to obtain capital supply [14], which provides a channel for CE.
As a vital evaluation index to measure efficiency, CAE reflects the deviation between the current and the optimal capital allocation [23]. According to the neoclassical theory, resources can be effectively allocated only when the factor price is equal to the marginal production efficiency. However, due to unique institutional experience in China, the government departments play an essential role in the resource allocation of the capital market [24]. Policies, especially those aimed at promoting the innovation development of high-end manufacturing industries, can be seen as positive signals that generate information waterfall effect [25, 26], which accelerates the flow of a large amount of capital or innovation resources to specific industries. The policy-oriented CAE or IRAE may be distorted [13, 28], which is more serious in China [12]. Therefore, how to improve the resource allocation efficiency under the premise of a constant total amount of social resources has become a practical problem that needs to be solved urgently [29, 30]. It also means to promote the efficient flow of capital and innovation resources among different industries or enterprises.
The measurement methods of resource allocation efficiency can be roughly divided into the growth index method [31], parametric frontier production function method [32], and input-output method [33]. Some scholars also use the investment response coefficient method [11], investment efficiency method [23, 34], and product production method [35] to make empirical analysis, which provides theoretical support for this study. As for the factors influencing the resource allocation efficiency, including relative market prices of factors [27], government intervention [13, 36], credit market [9], and financial friction [37, 38]. It can be found that the exciting research mainly focuses on the analysis of resource distortion, causes, and influencing factors at the national or regional level. The conclusions are mainly linear correction, ignoring the differences in resource allocation efficiency under different CE levels. There are few studies on resource allocation efficiency based on CE’s perspective, especially in the manufacturing industry. Whether capital or innovation resources have been effectively allocated is an issue worthy of in-depth discussion. This is an important criterion for judging the manufacturing industry’s capital effectiveness. It reflects the quality and efficiency of the capital market to a certain extent. Additionally, whether there is a curvilinear relationship between CE and resource allocation efficiency needs to be further investigated, which provides a unique opportunity to study the theoretical analysis and empirical test on the impact of CE on CAE and IRAE.
Capital enrichment and capital allocation efficiency
The key influencing factor of CAE is market friction. In addition to taxes and transaction costs, the most critical factors are information asymmetry and principal-agent [39, 40]. Because capital allocation has certain costs, corporate investment relies more on internally generated cash flow and shows a higher investment-cash flow sensitivity [41]. The reduction of information asymmetry can alleviate the financing cost of enterprises, which is beneficial for them to obtain capital and invest in projects to increase firm value [42]. Some scholars state that resource allocation is susceptible to multiple government targets, which play a role through natural resources, human capital and financial capital [43, 44].
According to the existing research, this paper believes that CE in China’s manufacturing industry can affect CAE through the following aspects. First, capital always flows to industries with higher ROI. CE is beneficial to the industry’s investors to ease the financing constraints, which brings more money effect. It absorbs more high-quality investors into the industry to improve the capital market’s liquidity and capital allocation efficiency [12, 45]. Second, CE is the result of capital flows, and it plays an essential role in guiding capital investment and investment volume, discovering market information, and promoting the transfer of economic resources among industries [39]. It improves the information transmission of China’s manufacturing industry and reduces the market participants’ transaction costs due to moral hazards and adverse selection. Manufacturing CE improves transaction efficiency and ultimately reflects CAE. Third, China’s market mechanism is still imperfect, and the level of CAE is easily affected by government policies.
From economics, the capital flow reflects the cooperation tendency among transaction subjects, including integrity level, ethics, cooperation norms and team spirit. A higher CE level reflects the trend of capital flows to higher-return industries and reflects the regional or industry cooperation tendency to a certain extent, which alleviates the principal-agent problems. The long and high-yield investment projects promote information sharing between manufacturing companies and investors, reducing agency costs, creating a better investor protection environment and decreasing the financing costs [46]. This plays a vital role in improving corporate investment efficiency to achieve excess earnings [47, 48]. Therefore, enterprises will invest capital in high-quality investment projects. As can be seen from the above discussion, it can be found that CE can affect CAE both directly and indirectly by alleviating information asymmetry and principal-agent. The depiction of the chain of the impact of the study’s aspects is shown in Fig. 1.

The chain of the impact of the factors considered in the study.
Due to undeveloped China’s capital market, the leading investment structure is dominated by legal persons or individual investors, whose investment behavior pursues the maximum economic benefits [49], resulting in a low degree of integration among various investment entities. It is manifested as the “Separate Institutions Phenomenon”. When CE is at a low level, the investment entities pursue short-term economic benefits based on the speculative motive, which has a negative impact on CAE. China’s market mechanism is still imperfect, and capital allocation is susceptible to multiple government targets [28]. Government intervention restricts the competition and liquidity of manufacturing products and factor markets, making it difficult for capital to enter industries or enterprises based on factual market information and price signals. Capital flows for political purposes may cause resource mismatches or distortions, such as flowing to sub-sectors or enterprises with poor economic benefits or low marginal output. It’s harmful to the improvement of resource allocation efficiency.
Given the profit-seeking nature of capital and the imperfect capital market environment, industries with higher CE levels include higher profit margins, knowledge or technology-intensive industries, and those with national policy support, the resources or state monopoly industries may have distorted capital allocation. However, innovation output can release information about industry development. When CE reaches a certain threshold, it will change the capital flows to improve the overall manufacturing CAE because of its profit-driven nature. For industries with lower ROI, it will reduce capital inflows timely and increase for those with higher ones [11, 50]. It means that with a higher CE level, it will be more effective in identifying investment opportunities. Industries with strong innovation capacities can constantly attract high-quality capital to accumulation due to their high-profit margins. Then they invest more capital in technological innovation or research and development projects to bring higher value appreciation and improve CAE. Based on the above discussion, this paper proposes the following research hypothesis:
The allocation of innovation resources is the process of selecting, arranging, and allocating innovation resources among various industries, regions, and enterprises to achieve the best efficiency [51, 52]. The scarcity and uneven distribution of innovation resources aggravate its competition and liquidity among different subjects, making it possible for optimal innovation resource allocation. This paper argues that IRAE of the manufacturing industry is the effective allocation of limited innovation resources during a certain period and space, which maximum satisfies various industries resource requirements. It further reflects primary innovation output, i.e., the patents, revenue from primary operations, sales revenue of new products.
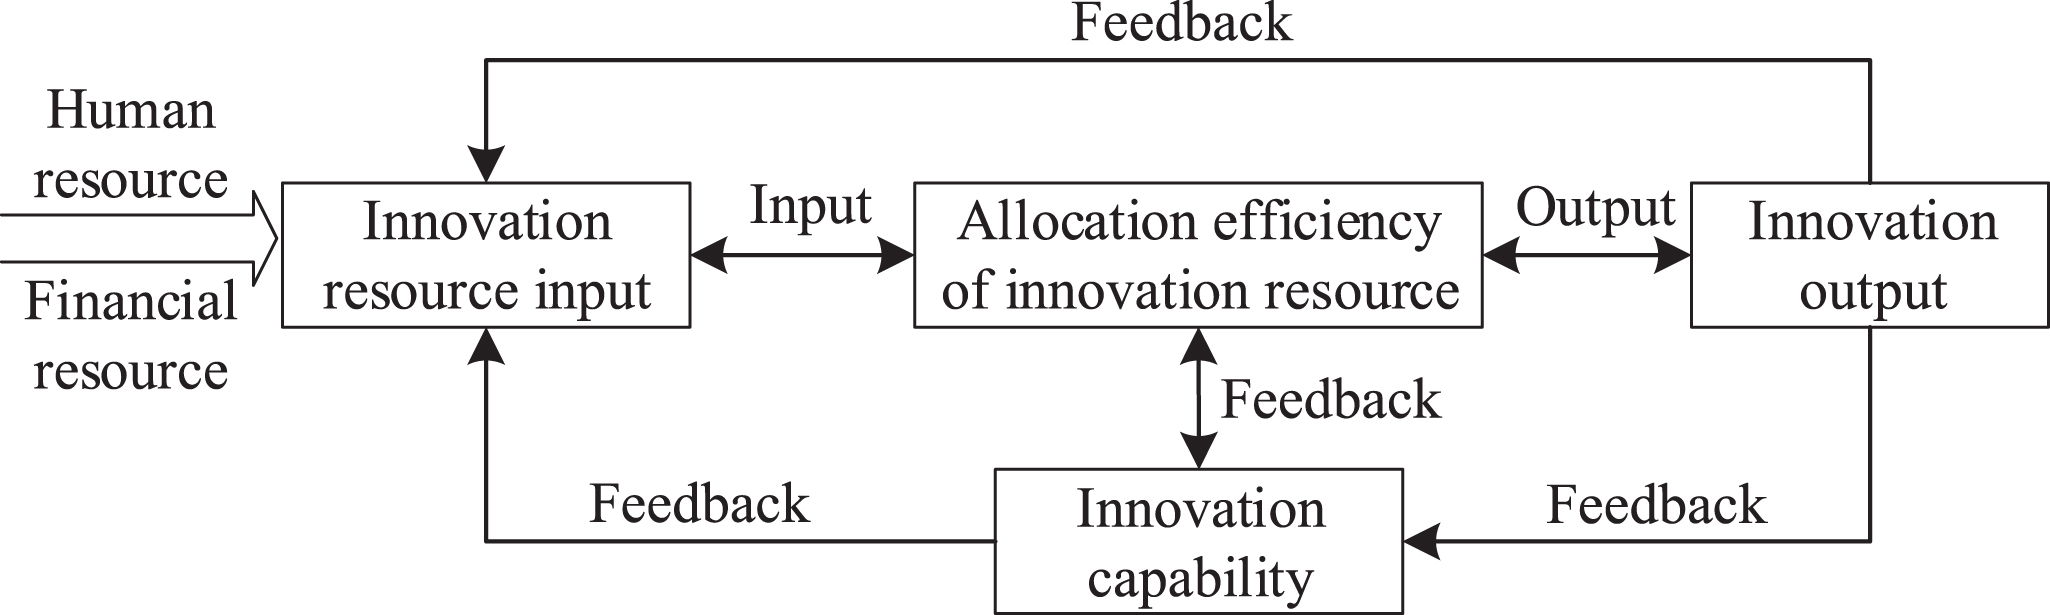
System model of IRAE in the manufacturing industry.
Meanwhile, the innovation output also forms innovation resource input, which is beneficial for manufacturing enterprises to carry out sustainable innovation resource allocation activities. IRAE reflects the innovation ability to some extent, which further adjusts the innovation resource input through the results feedback of innovation. It, in turn, affects IRAE. Referring to the current research on innovation theory and innovation system theory by scholars including Brown and Svenson [53], Schumpeter et al. [54], and Andersson and Karlsson [55], this paper proposes the following system model of IRAE in the manufacturing industry, as shown in Fig. 2.
CE provides a funding foundation for manufacturing innovation activities, which accelerates the flow and concentration of capital, personnel, information, technology, and other factors. When CE is at a low level, the supply of innovation resources in the manufacturing industry is insufficient, making it difficult to support the smooth implementation of innovative activities. It weakens the innovation motivation and ability of the industry. Some enterprises tend to give up long-term innovation investing projects and switch to other short-term profit projects, resulting in a low IRAE level. In this stage, restricted by CE, it has an inhibiting effect on IRAE.
From the above Fig. 2, it can be found that the innovation output has feedback effects on IRAE to a certain extent. With the increase of CE level, the benefits of earlier innovation resource consumption gradually appear when it reaches a certain threshold. The investment entities can adjust the innovation resources investment based on the innovation output results, redistributing them to industries or sectors with ROI to make the maximum utility of the innovation resources. Capital is the main constraint that affects the efficiency of manufacturing innovation resource allocation. The intensity of CE reflects the capital activity of the manufacturing industry. The higher level of CE, the more influential the capital function that identifying the investment opportunities. It helps to enhance the initiative of manufacturing innovation and promotes IRAE. Based on the above discussion, this paper proposes the following research hypothesis.
This section sequentially describes the sample, data, variable definitions, and model construction, which lays the foundation of empirical analysis.
Sample and data
Consistent with the 2012 industry classification standard of the China Securities Regulatory Commission (CSRC), this paper divides the manufacturing industry into 31 segments.
To ensure the consistency of the statistical caliber, the automobile manufacturing industry, and the railways, shipbuilding, aerospace, and other transportation equipment manufacturing industries are unified into the transportation equipment manufacturing industry. The rubber products industry and the plastic products industry are unified into the rubber and plastic products industry. Waste resource comprehensive utilization industry, metal products, and machinery and equipment repair industry are eliminated. Finally, 28 manufacturing industry segments are included (names and their codes are shown in Table 1).
Manufacturing industry segments and their codes
Manufacturing industry segments and their codes
The sample interval selected in this paper is 2011–2018. The missing values are calculated (included) by linear interpolation, which is a method of determining the value of an unknown quantity between two known quantities by using a straight line. Since there are only a few missing data in this paper, the widely used linear interpolation over a narrower interval has acceptable Type-I errors [56], it will not affect the accuracy of the results [24]. The method selected in this paper has a theoretical basis and practical reference. All data are from the National Bureau of Statistics, the China Statistical Yearbook, the China Science and Technology Statistical Yearbook, and the China Industrial Economic Statistical Yearbook. To eliminate the interference of outliers on empirical research results, all data is winsorized at the 1% level by referring to Dmitri and Sudipta [56] and Birru [57].
Capital enrichment
This paper defines the directional flow of capital to a certain industry or field as capital accumulation. When capital accumulation in an industry exceeds certain limits, it forms CE. CE is the result of capital flows, reflecting the capital distribution among different regions and industries. The most intuitive manifestation of CE is the increase in the total capital amount. Based on various sources of capital (state capital, collective capital, corporate capital, individuals, Hong Kong, Macao, and Taiwan capital and foreign capital), this paper defines the above total capital as the CE level. In recent years, the distribution of CE in 28 manufacturing sectors is shown in Fig. 3.
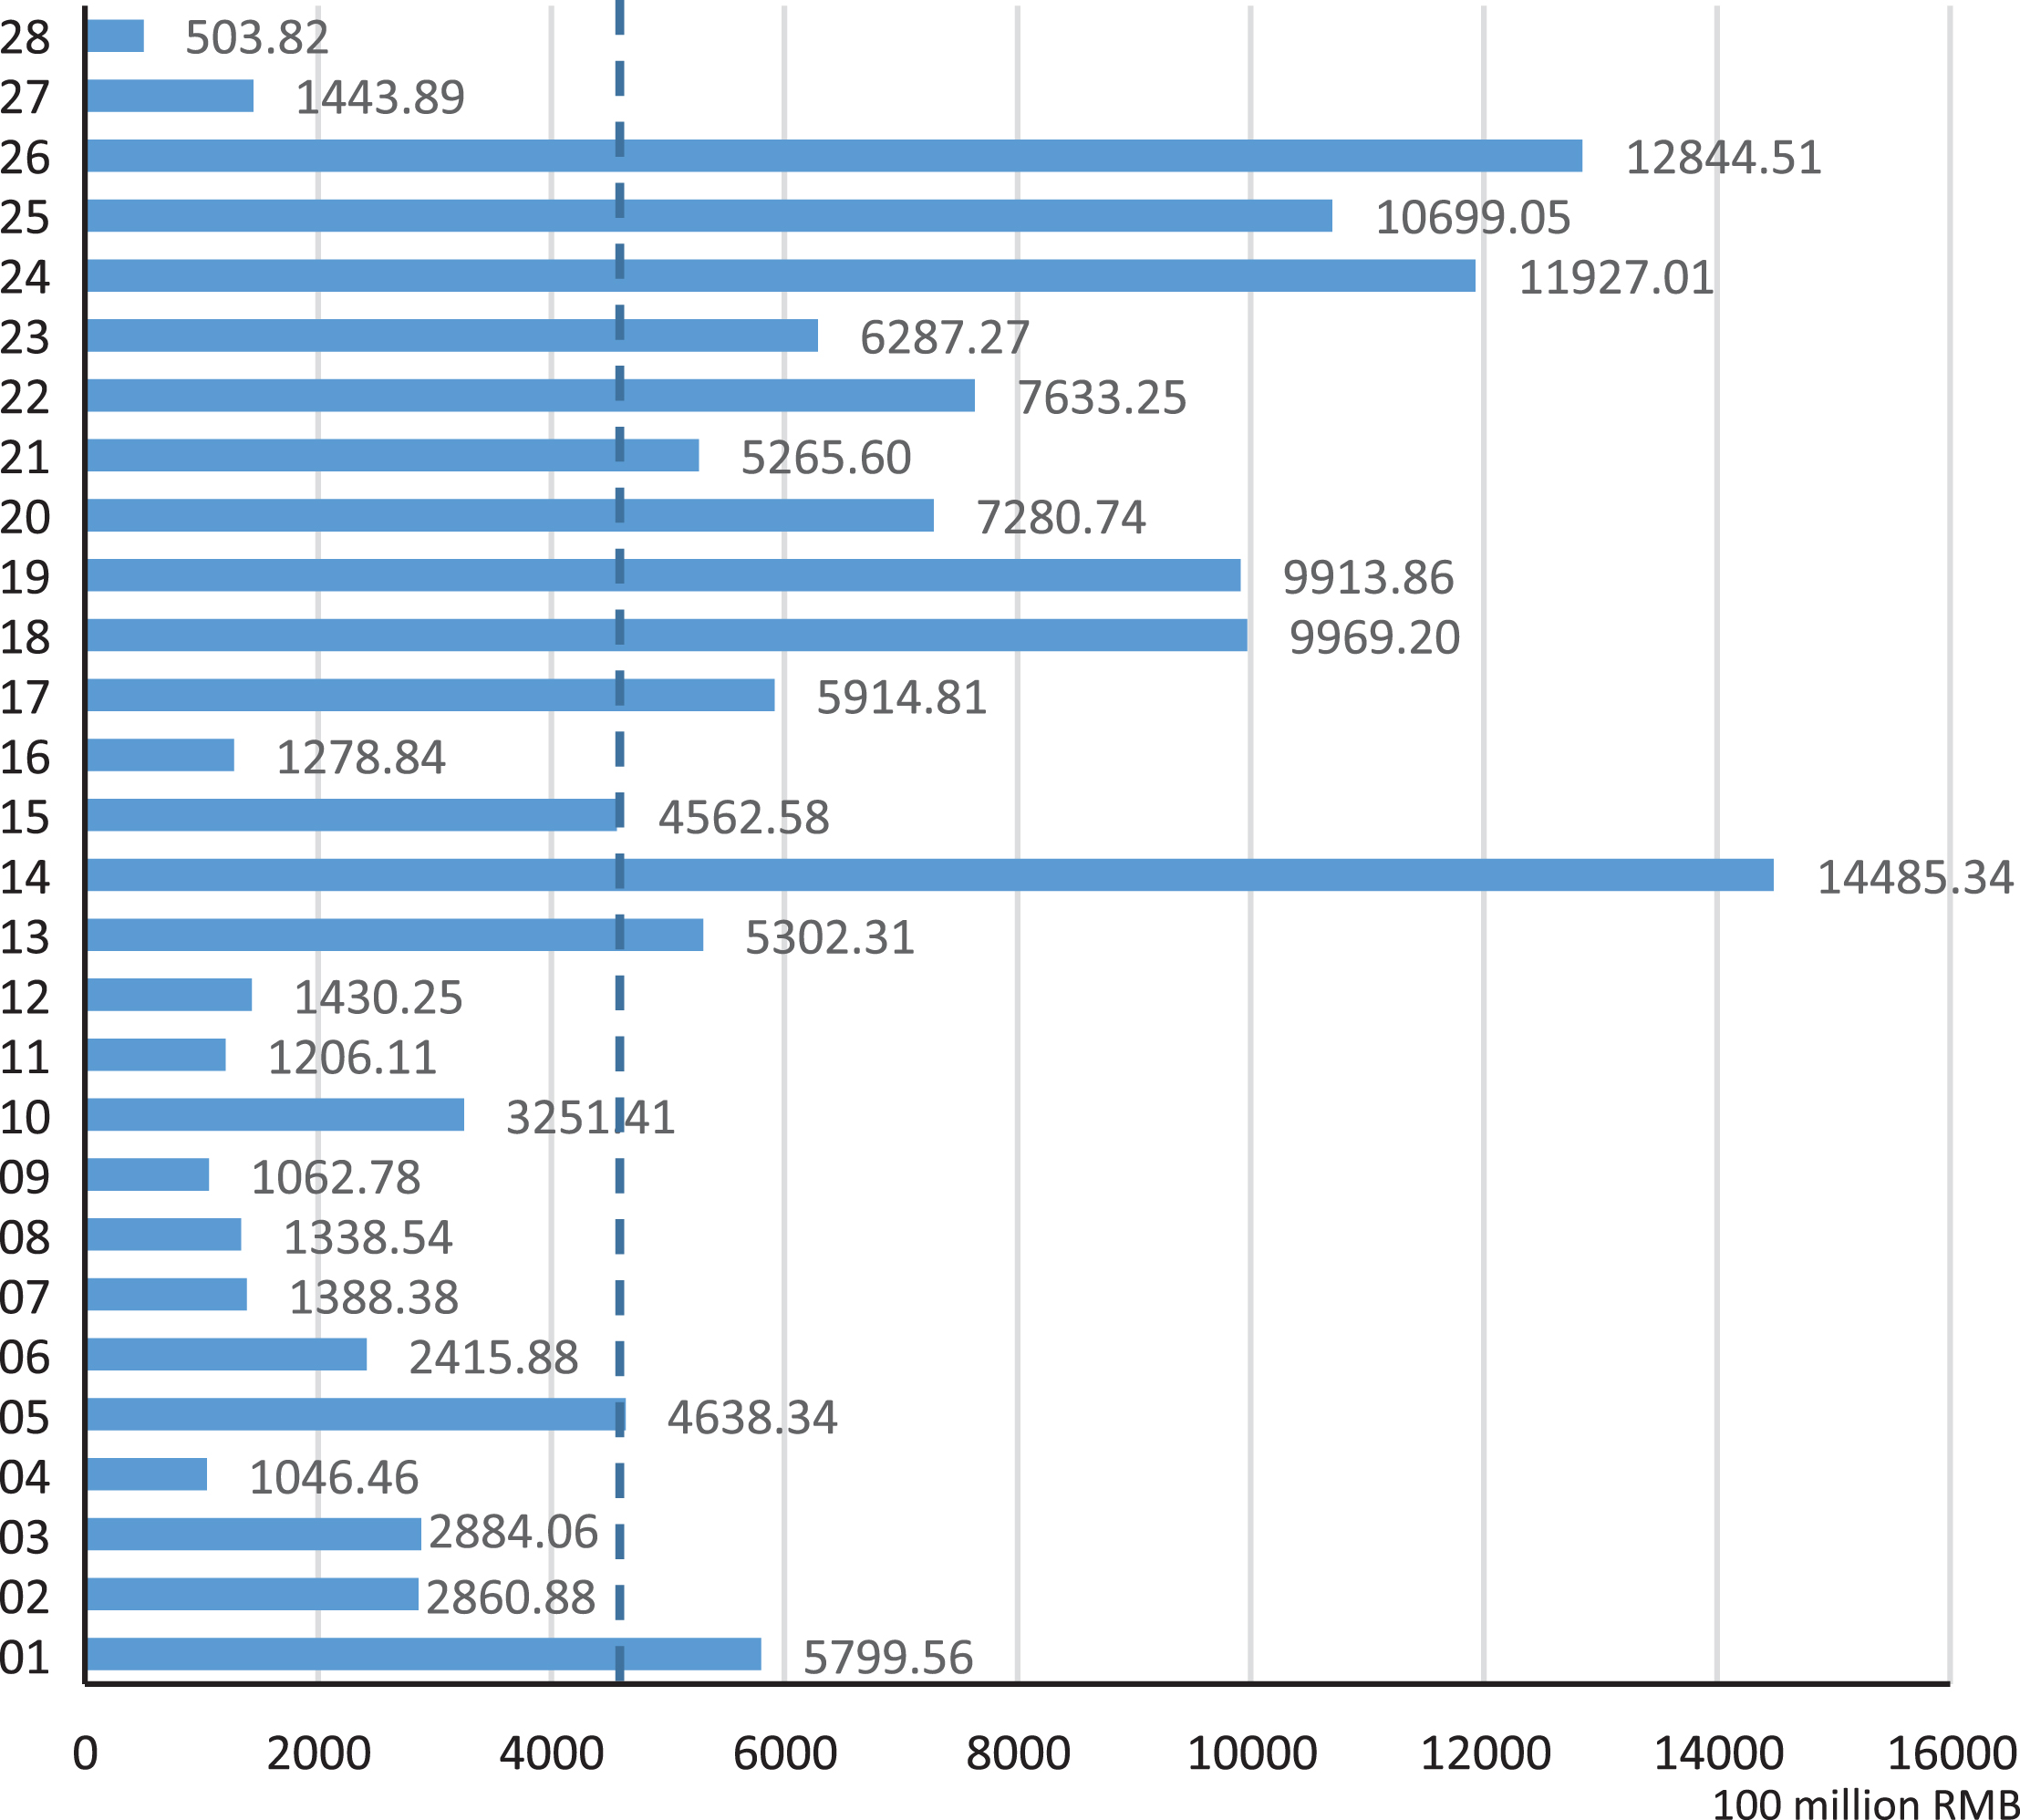
Average value of CE in 28 manufacturing industries from 2011 to 2018. Note: The dashed line indicates the median of CE, which is RMB 460.05 billion.
From the above figure, it can be found that the following industries exist obvious phenomena of CE with the capital amount over the dashed line, i.e., the chemical raw materials and products manufacturing industry (Code 14), the Communication equipment, computer, and other electronic equipment manufacturing (Code 26), the Transportation equipment manufacturing (Code 24), the Electrical machinery and equipment manufacturing industry (Code 25), the Non-metallic mineral products industry (Code 18), and the Ferrous metal smelting and rolling processing industry (Code 19). CE of Code 14 reaches RMB 1448.53 billion, and CE of Code 26 and Code 24 are RMB 1284.45 and 1192.70 billion, respectively. That’s far more than the median of the whole manufacturing industry, i.e., RMB 460.05 billion. However, CE in the Tobacco industry (Code 04) and the Furniture manufacturing industry (Code 09) are at low levels, with the amount of RMB 104.65 billion and RMB 106.28 billion, respectively. CE in the Handcrafts and other manufacturing industries (Code 28) is the lowest, RMB 50.38 billion. It shows that the manufacturing industry’s capital flow is unbalanced, which makes it possible for some sectors to achieve high CE levels.
Scholars generally use the classical model of CAE proposed by Jeffrey Wurgler (2000). He states that CAE’s improvement is increasing capital investment in high-return industries and reducing in low-return ones, which reflects the effectiveness of capital allocation. This paper adopts the Wurgler model to measure CAE of the manufacturing industry, as shown below.
Where I represents the original value of fixed assets in the manufacturing industry, V is the total industrial output; i is the 28 manufacturing industry segments, t is the year. The coefficient η is CAE of the manufacturing industry, which is used to measure capital’s sensitivity to profitability. The greater η is, the higher CAE is. The η0 indicates that there is no additional investment in industries with higher profitability, so CAE is at a low level. On the contrary, it means a high level of CAE.
Given the data availability, this paper selects the growth rate of original fixed assets, and the growth rate of industrial sales output is substituted into the above model to measure CAE of the manufacturing industry.
This paper argues that IRAE reflects the input-output efficiency of manufacturing innovation resources and adopts the DEA method for calculation. It has the following advantages.
First, there is no need to set the production function structure of input and output in advance. The weights of each indicator are objectively formed by the model based on the data, which can avoid subjective factors and reduce measurement errors. Second, it allows the existence of inefficient behaviors, which can evaluate similar decision-making unit’s relative effectiveness with multiple inputs and multiple outputs. Third, it can be further decomposed into pure technical efficiency and scale efficiency. Based on this, the following basic model is set.
Where s+, s- are the slack variables of input and output respectively and θ are the pure technical efficiency. By removing the model’s constraints, that is, the CCR model with the constant return to scale. The comprehensive financing efficiency TEj0 of the j0 industry can be obtained, and its scale efficiency SEj0 can be measured TEj0/PTEj0. If θ = 1, s+ = 0, and s- = 0, the DEAj0 is effective. If θ = 1, s+0 or s- 0, the DEAj0 weak effective. If θ < 1, DEAj0 is invalid.
To further evaluate the effectiveness of innovation resource allocation of 28 manufacturing segments, this paper adopts the engineering fuzzy set theory to evaluate IRAE objectively. First, the comment set is marked as V, including effective, weakly effective, general, and ineffective. Assuming that the evaluation object set is Y ={ Y1, Y2, . . . Y
m
} and the evaluation target set is Z ={ Z1, Z2, . . . Z
q
}. The index set U ={ U1, U2, . . . U
n
} composed of all evaluation indexes is divided into n subsets. It satisfies the following formula (3).
Suppose that there are n evaluation indexes in the i subset U
i
, Y
j
the vector can represent the attribute values of n evaluation indexes with X
j
(i), as shown in formula (4).
Therefore, the attribute value of the evaluation indexes of m evaluation objects and the membership matrix transformed according to the quantified index membership function can be expressed by the following matrix.
Where r
kj
(i) is the membership degree of the k index of ith evaluation target, R
j
(i) is the single object evaluation Y
j
corresponding to the nth index. It satisfies
Suppose that the weight coefficient set of n evaluation indexes of U
i
is A. A (i) = (a1 (i) , a2 (i) , . . . , a
n
(i)), and
Where b j (i) is the result of the fuzzy comprehensive evaluation Y j .
The above calculation uses the generalized fuzzy operator, which is the generalization of the fuzzy matrix’s compound operation. Taking B i as the rating matrix row of a higher level, the subset’s weight coefficient where the target is located can be calculated. Then the higher-level fuzzy comprehensive evaluation set can be obtained in the same way. The comprehensive evaluation result set B = A * R = (b1, b2, . . . , b m ) can be obtained.
Most of the existing research on the resource allocation effect is the static framework, ignoring CE and resource allocation’s dynamic relationship. To further explore CE’s dynamic effects on CAE and IRAE, this paper introduces the lagging term of the dependent variable and the square term of the independent variable to construct the following dynamic panel model.
Model (7) and model (8) are used to test the relationship between CE and CAE, CE and IRAE, respectively. What needs to be noted is that ηi,t-s and ξi,t-s are used to analyze the impact of the resource allocation efficiency in the previous period on the current period. Where η is CAE, ξ is IRAE, Capitali,t is CE, Controlsi,t are control variables, i is the 28 manufacturing segments, t is the year, s is the number of lagging periods, and ɛ is the random interference term. If β20 and β30 (γ20 and γ30), it means that there is an inverted U-shaped curvilinear relationship between CE and CAE (or IRAE). If β20 and β30 (γ20 and γ30), it means that there is a U-shaped curvilinear relationship between CE and CAE (or IRAE).
Additionally, to analyze the possible heterogeneity among manufacturing segments in the same period, this paper also selects the static panel model for comparison.
Compared with the previous models, it can be found that the lagging term of the dependent variable is not included in Model (9) and Model (10). The impact of the resource allocation efficiency in the previous period on the current period is not considered here. The other variable definitions are the same as before.
As the resource allocation efficiency depends not only on the behavior of manufacturing enterprises or segments, also influenced by the market conditions. Based on the existing study [41, 58–62], and considering the data availability, this paper finally selects the size of manufacturing enterprise (Size), industry concentration (Central), industry openness (Open), industry profit margin (Profit), industrial output value per capita (Value) as the control variables affecting CAE. It selects the size of manufacturing enterprise (Size), industry concentration (Central), industry openness (Open), innovation capacity (Innov), and the number of scientific research institutions (Number) as control variables affecting IRAE.
This section first analyzes the dynamic changes of CAE and IRAE, and then uses the dynamic and static panel data models to test CE’s effect on CAE and IRAE. To ensure the robustness of the results, the robustness tests are finally carried out.
Dynamic changes
Dynamic change of CAE
To reduce the impact of data skew on empirical results, this paper adds 1 to the original data before logarithmic processing. It uses the least-square method to perform regression to obtain the annual CAE of China’s manufacturing industry. The results are shown in Table 2.
CAE of China’s manufacturing industry from 2011 to 2018
CAE of China’s manufacturing industry from 2011 to 2018
The table shows that the t value of CAE in 2012 and 2017 is less than the critical value, and the regression coefficient is not significant. However, the t value of CAE in other years is significant at the 5% or 1% level. In the sample period, CAE reaches a maximum value of 0.749 in 2015 and a minimum value of 0.163 in 2017, reflecting the evolution pattern of manufacturing CAE. It has a trend of rising first and then decreasing, showing an extensive fluctuation range. The reasons are as follows.
First, China’s current marketization degree is not high, so manufacturing capital flows are more sensitive to national macroeconomic policies, economic situations, and fiscal policy orientation. In different years and manufacturing segments, there are large differences in economic development, monetary policy, the degree of financial market development, etc., resulting in sharp changes in manufacturing capital allocation efficiency.
Second, China’s capital allocation is dominated by the government, affected by changes in government behavior, rather than changes in relative market prices, which restricts the effectiveness of manufacturing capital allocation functions. Capital has the law of diminishing marginal utility. When manufacturing CE reaches a certain level, with the improving CE, CAE will decrease. It becomes a challenge to maximize the role of capital.
Third, considering social benefits, under the guidance of national or government policies, more capital flows to state-owned enterprises with low return on capital, resulting in the ownership preference of capital. In the long run, CAE will decline.
Additionally, the mean value of manufacturing CAE from 2011 to 2018 is 0.406, which is much lower than the average of 0.723 of 65 countries estimated by Wurgler. It indicates that CAE of China’s manufacturing industry is still low and China’s rapid economic growth is not based on high industry CAE, but an investment-oriented extensive economic development model.
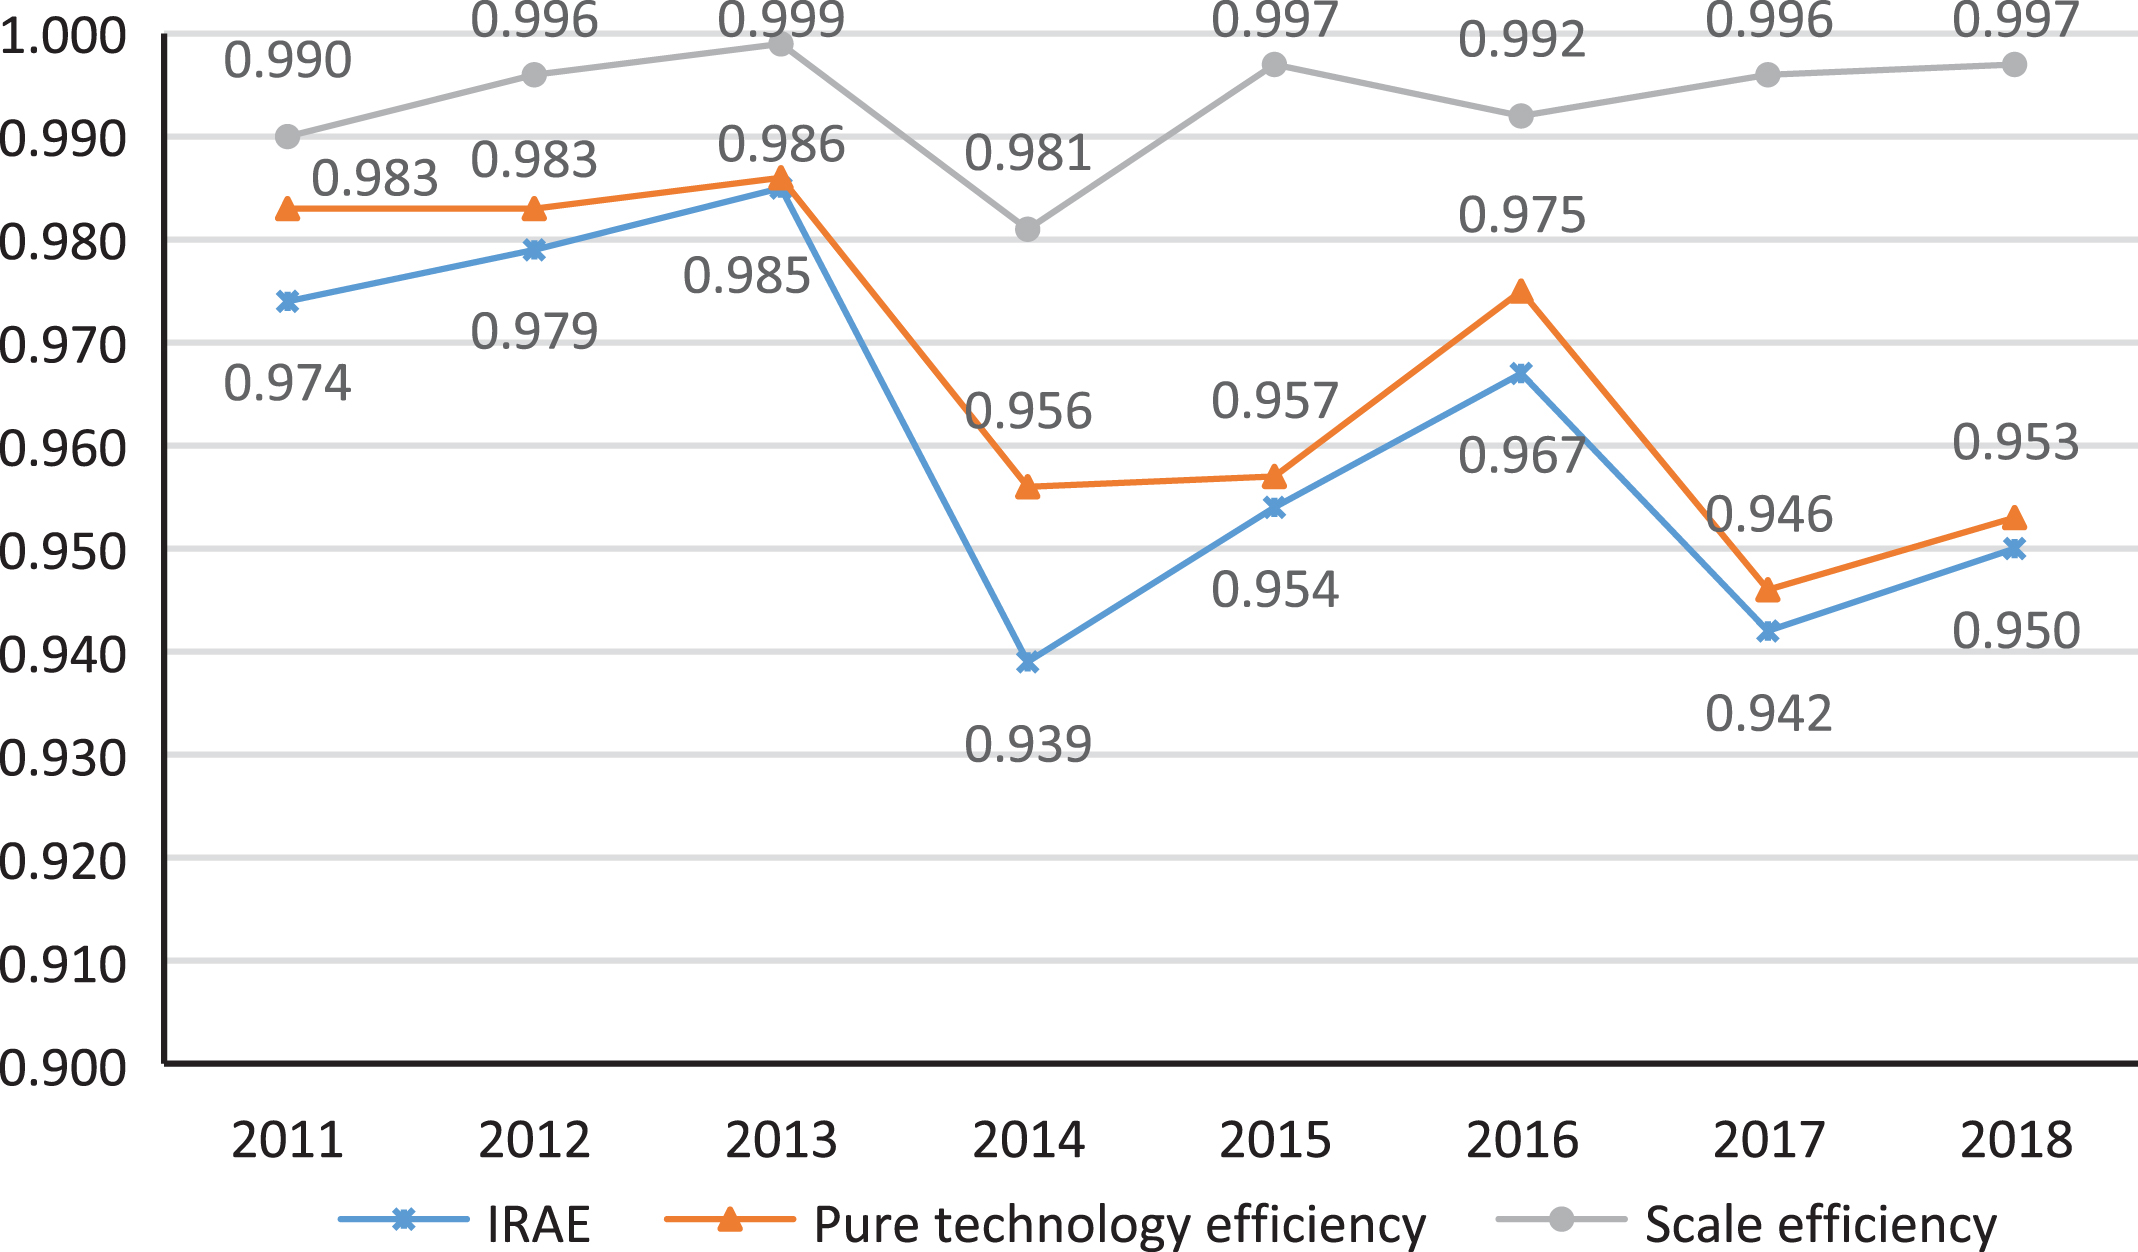
IRAE of manufacturing industry from 2011 to 2018.
Adapted from Connie [63], this paper calculates IRAE with “innovation resource input” and “innovation output” by combining with characteristics of the manufacturing industry, influencing factors of innovation capability, and the management process of innovation. The innovation resource input includes human and material resource inputs, and the innovation output includes patent and non-patent output, as shown in Table 3.
Evaluation index system for IRAE
Evaluation index system for IRAE
The DEA2.1 software is used to measure IRAE of the manufacturing industry from 2011 to 2018, and the pure technical efficiency and scale efficiency are also obtained. The results are shown in Fig. 4.
As shown from the table, IRAE of the manufacturing industry decreases from 0.974 in 2011 to 0.950 in 2018. It has a downward trend in the sample range and shows an evident trend of fluctuating development. Further analysis finds that IRAE has the same change trend with pure technical efficiency, both of which reach the highest value in 2013 and the lowest in 2014. It means that pure technical efficiency has a more significant influence on IRAE, in line with the new economic growth theory. While the change in the scale efficiency relatively small. Additionally, according to the engineering fuzzy set theory, the membership interval of IRAE is weakly efficient, which indicates that the allocation of manufacturing innovation resources needs to be further optimized.
This paper adopts the dynamic panel model to analyze CE’s effect on resource allocation of China’s manufacturing industry. Although this model can alleviate the deviation of missing variables to estimation results to a certain extent, it may cause the endogenous problem because of the introduction of lagged explained variables. Therefore, this paper adopts the instrumental variable GMM method to alleviate the endogenous problem. Capitali,t-1 is the endogenous explanatory variable and Controls is the exogenous explanatory variable. Referring to the practice of Wintoki et al. [64], the explanatory variable should be lagged by two periods to meet the exogenous requirements of instrumental variables.
Compared with system GMM, the differential GMM may have weak instrumental variables and other issues, which affect the validity of empirical results. The system GMM method is used for estimation, and the Sargan test method is adopted to test the validity of instrumental variables. According to the research of Wintoki et al. [64], Arellano and Bover [65], and Blundell and Bond [66], the moment condition used in the system GMM method is tenable on the premise that there is no second-order or higher-order serial correlation in the residual term of the difference equation. It is necessary to carry out AR (1) and AR (2) tests on the data. If the p-value of the corresponding statistic is greater than 0.05, the null hypothesis is significantly accepted at 5%.
Additionally, considering that the dependent variables CAE and IRAE are observed indirectly, which are measured by the least-square method and DEA method, respectively. It may cause deviation in the results. The 2SLS model, the Tobit model, and the basic regression model OLS are selected to estimate the static panel models.
Empirical analysis of CE and CAE
The GMM regression results of CE and CAE of the manufacturing industry are shown in Model (1) in Table 4. The regression results of the static panel models are shown in Table 4 from Model (2) to Model (4) to facilitate comparative analysis.
Regression results CE and CAE of manufacturing industry
Regression results CE and CAE of manufacturing industry
Note: Robust standard errors in parentheses; *p < 0.1, **p < 0.05, ***p < 0.01. AR(1) and AR(2) are used to verify the first-order second-order sequence correlations in GMM estimation, and the data in the table report the p-value of the statistics. The null hypothesis is that there is no serial correlation of the disturbance term or the serial correlation coefficient is 0. Sargan is a test of over identifying restrictions, and the p-value is reported. Hansen Test represents the over-tested P values.
According to Model (1), AR(1) is significant at 5%, indicating that the data has first-order serial correlation, which must be tested for second-order serial correlation. The result shows that AR (2) is –0.76, which is not significant. The p-value of the statistic is greater than 0.05. There is no second-order serial correlation, and the null hypothesis that there is no serial correlation in the model error term cannot be rejected. Therefore, the system GMM model constructed in this paper is reasonable, overcoming the endogenous problem of explanatory variables. The p-value of the Sargan statistic is 0.486, which accepts the null hypothesis that the instrumental variables are valid, indicating that the instrumental variables selected in this paper are accurate. The coefficients of the one-period and two-period lagged CAE are 0.643 and 0.238, respectively, which are significant at 1% and 5%. It indicates that CAE in the previous two periods has a substantial effect on CAE of the current period. Its lagged effect is verified. The impact of the lagged CAE on current CE and CAE should be considered in the model. The coefficients of CE and its square are –2.118 and 0.128, respectively. Both of them are significant at 1%, indicating a U-shaped curvilinear relationship between CE and CAE in the manufacturing industry.
The low level of CE has a significant negative effect on CAE, and the reasons are as follows. The manufacturing industry faces strong financing constraints because of the limited CE in the early stage, so most enterprises tend to avoid risk and lack investment motivation and ability. This resulted in the inability of capital to flow efficiently among various manufacturing industry sectors. As capital is an essential carrier for manufacturing production differentiation and binding other factors to high ROI sectors, the low level of CE has a negative effect on CAE. With the increase of CE until it reaches a certain threshold, it can effectively alleviate the financing constraints of the manufacturing industry, leading to higher investment motivation. This accelerates capital flow between different enterprises or sectors and information transmission in this industry.
Given the liquidity and profit-driven nature of capital, it pursues profit maximization a adjusts capital investment decisions, adjusts capital investment decisions, and flows spontaneously according to capital return. For industries with higher profitability, capital owners will increase investment, while those with weaker profitability will decrease. This process avoids the problem of time delay and waste caused by capital market fluctuations in product allocation, which positively affects CAE. Therefore, CAE of the manufacturing industry decreases with the increase of CE, and then increases, supporting H1. Compared with manufacturing industries with medium CE levels, the industries with low and high CE levels have higher CAE. The curvilinear relationship diagram is shown in Figure 5.
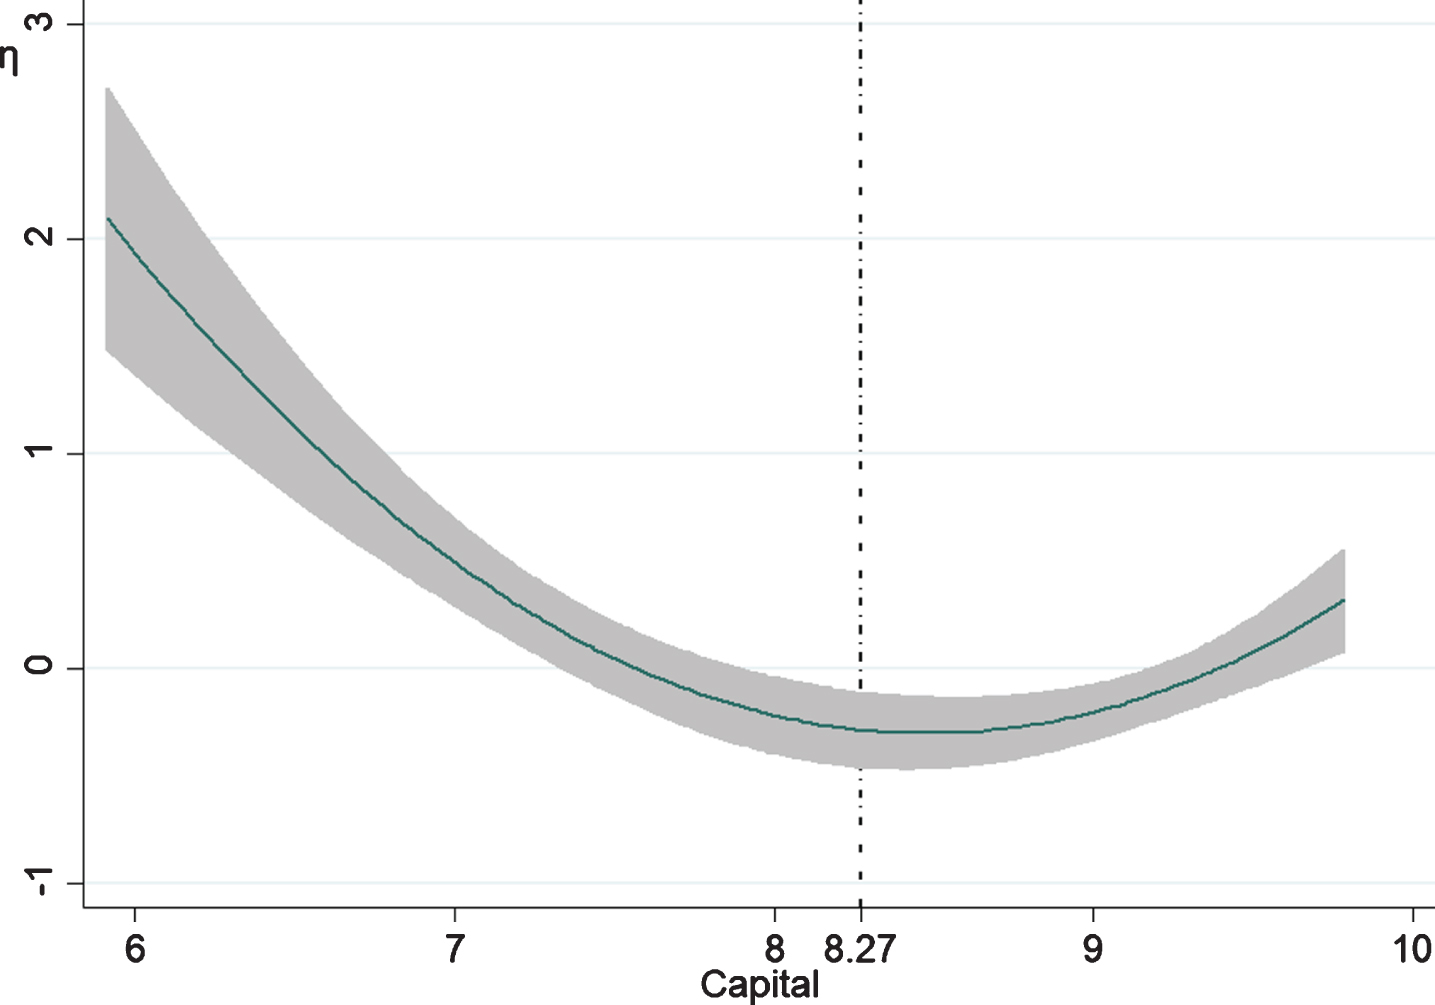
U-shaped curvilinear diagram between CE and CAE.
According to the coefficient s of the first and square terms of CE, the corresponding CE level to the lowest point of the U-shaped curvilinear relationship diagram of CE and CAE is 8.27. As all the original data is logarithmic, the actual value of CE is RMB 390.50 billion. That means that in the first stage, when CE is at a low level (CE≤8.27), it has a significant negative impact on CAE. In the second stage, when CE is more than 8.27 (CE > 8.27), it has a significant positive effect on CAE.
Additionally, the regression results of the 2SLS model considering endogenous problems show that the coefficients of CE and its square term are –30.014 and 1.817, respectively, significant at 10%. The Tobit model without considering endogenous issues shows a U-shaped curvilinear relationship between CE and CAE, which is significant at 1%. The OLS model shows that these two variables have a U-shaped curvilinear relationship at the significance level of 1%. However, the regression coefficients and coincidences have changed significantly, indicating that the model has endogenous problems. Under the dynamic effects of CAE, the 2SLS model and available OLS model results may be biased estimates. The systematic GMM method should be used to test the dynamic effect of CE on CAE. There is a U-shaped curvilinear relationship between them.
The GMM regression results of CE and IRAE of the manufacturing industry are shown in Model (1) in Table 5. To facilitate comparative analysis, the regression results of the static panel models are shown in Table5 from Model (2) to Model (4).
Regression results CE and IRAE of manufacturing industry
Regression results CE and IRAE of manufacturing industry
Note: Robust standard errors in parentheses; *p < 0.1, **p < 0.05, ***p < 0.01. AR(1) and AR(2) are used to verify the existence of first-order and second-order sequence correlations in GMM estimation; Hansen Test represents over-tested P values.
According to Model (1), the Sargan statistic p-value of CE and IRAE is 0.486, which accepts the null hypothesis that the instrumental variables are valid, indicating that the instrumental variables selected in this paper are accurate. The coefficients of the one-period and two-period lagged IRAE are 0.512 and 0.037, respectively. The former is significant at 1%, while the latter fails the significance level test. It means the previous IRAE has a positive effect on the current IRAE, i.e., one-period lagged effect. In the regression model of CE and IRAE, the impact of the lagged term IRAE should be considered. The coefficients of CE and its square are –0.268 and 0.015, respectively. Both of them are significant at 5%, indicating a U-shaped curvilinear relationship between CE and IRAE in the manufacturing industry.
The low level of CE has a significant negative effect on IRAE, but this effect continues to weaken as CE increases. When CE reaches a certain threshold, its impact on IRAE will gradually turn into a positive effect, indicating that the flow and effective allocation of manufacturing innovation resources among various industries and enterprises can be promoted when CE exceeds a certain level. The reason may be that capital is not directly used for innovation activities after enrichment, but is used as the strategic resource based on the strategic development or survival goals of the manufacturing industry, such as mergers and acquisitions, restructuring, and scale expansion. At this stage, the input of innovation resources is insufficient, and the allocation of innovation resources is inefficient. When the company is stable and has core products or market foundation, it will gradually increase the scale of innovation investment and focus on product R&D or innovation to achieve sustainable development. But the innovation output and its transformation always require a long time. The consumption of innovation resources is high, but the output is insufficient.
With the continuous increase of CE in the manufacturing industry, the marketization and commodification of manufacturing innovation achievements are further accelerated, and the production efficiency is greatly improved. The benefits of the consumption of innovation resources in the early stage gradually emerge, bringing a positive impact on IRAE. The curvilinear relationship between manufacturing CE and IRAE is not a simple linear correlation but decreases first and then increases with CE improvement. The results support H2, that is, compared with manufacturing industries with moderate levels of CE, industries with low and high levels of CE have more efficient innovation resources allocation. The curvilinear relationship diagram is shown in Fig. 6.

U-shaped curvilinear diagram between CE and IRAE.
According to the coefficients of CE and its square term, the corresponding CE level to the lowest point of the U-shaped curvilinear relationship diagram between CE and IRAE is 8.93. CE’s actual value is RMB 755.53 billion. That means that in the first stage, when CE is at a low level (CE≤8.93), it has a significant negative impact on IRAE. When CE is higher than 8.93 (CE > 8.93), its impact on IRAE is positive in the second stage.
Additionally, the 2SLS model and the Tobit model’s regression results show that the coefficients of CE and its square term are –1.926 and 0.115, –2.801 and 0.157, respectively. The former model is significant at 5%, and the latter is significant at 1%. Both of them prove the U-shaped curvilinear relationship between CE and IRAE. However, The OLS model shows that the CE coefficient is –0.197, and its square term is 0.009, both of which are not significant. The reason may be that when IRAE is in a specific value interval [0,1], the OLS results are biased, and the endogenous problems caused by unobservable heterogeneity affect the significance between CE and IRAE. Therefore, the results of the systematic GMM model should be used for analysis. That is, the U-shaped curvilinear relationship is significant at 10%.
Shifting mean values
This paper adopts the system GMM method to conduct the empirical analysis of CE, CAE and IRAE of China’s manufacturing industry. Both the 2SLS model considering the endogenous problem and the Tobit model without considering the endogenous problem support the above conclusions. However, given that the data fluctuates greatly every year, the moving-average processing method is used to re-estimate the dynamic panel models. The results are shown in Table 6.
Robustness test results of CE, CAE, and IRAE
Robustness test results of CE, CAE, and IRAE
Note: Robust standard errors in parentheses; *p < 0.1, **p < 0.05, ***p < 0.01. AR(1) and AR(2) are used to verify the existence of first-order and second-order sequence correlations in GMM estimation; Hansen Test represents over-tested P values.
According to Model (1), the one-period and two-period lagged CAE significantly impact the current period CAE at the 1% level. The coefficients of CE and its square term are –0.702 and 0.043, respectively, significant at 1%. It means there is a U-shaped curvilinear relationship between CE and CAE. It can be seen from Model (2) that IRAE of the first two periods affects the current IRAE, which is significant at 1% and 10%, respectively. The coefficient of CE is –0.078, significant at 5%, and the coefficient of its square term is 0.004, significant at 10%. It also shows a U-shaped curvilinear relationship between CE and IRAE. The symbols of other control variables are the same as the above.
According to the above study, CE’s corresponding levels to the lowest points of the U-shaped curvilinear graphs of CAE and IRE are 8.27 and 8.93, respectively. The slope on the left side of this point is negative, and the effects of CE on CAE and IRAE should be negative. The slope on the right side is positive, and the effects should be positive. Based on the critical point of CE, this paper further makes the grouped-data regression test. The results are shown in Table 7.
Grouped regression estimation results
Grouped regression estimation results
Note: Robust standard errors in parentheses; *p < 0.1, **p < 0.05, ***p < 0.01.
As shown from Model (1) and Model (2), when CE≤8.27, its impact on CAE is negative, significant at 1%. When CE > 8.27, its impact on CAE is significantly positive. Model (3) and model (4) show that when CE≤8.93, its effect on IRAE is negative, significant at 1%. When CE > 8.93, its impact on IRAE is positive, but not significant. The reason may be that there are too few samples with CE greater than 8.93, and the slope on the right side of the U-shaped diagram is slight. Therefore, the changing trend is relatively stable, leading to the regression coefficient is not significant. Meanwhile, the symbol is consistent with expectations. The conclusions obtained in this paper are basically robust.
This section summarizes the main research conclusions and describes the future research prospects.
Conclusions
This paper adopts the least-square method and the DEA method to measure the CAE and IRAE of the manufacturing industry. It studies the resource allocation effects of manufacturing capital enrichment and constructs the static and dynamic panel models for empirical analysis. The results are as follows.
First, the capital and innovation resources of the manufacturing industry are not allocated effectively. In general, China’s economic development still belongs to the investment-driven extensive model.
Second, it can be found that both CAE and IRAE show a volatile development trend of first increased and then decreased during the sample period. Meanwhile, IRAE has the same change trend with pure technical efficiency.
Third, both static and dynamic panel models show a U-shaped curvilinear relationship between CE and CAE, CE and IRAE of China’s manufacturing industry. When CE is at a low level, its effect on CAE and IRAE is negative. With the increase of CE, this effect gradually weakened until it exceeded the critical value.
This research on the resource allocation effect of the manufacturing industry provides a new perspective for the theory of innovation capability and capital accumulation. It explores the inflection point of improving CAE and IRAE, which provides a scientific basis and theoretical guidance for improving capital utility. Although capital is the financial basis for innovation activities, the higher CE level does not mean better allocation efficiency. Both the actual situation of enterprises and the effect of resource allocation need to be considered. On the one hand, government departments should gradually shift from the role of participants and benefit-sharers of resource allocation to guides, supervisors and service providers. The investment direction of capital and innovation resources can be determined according to the national strategic planning. Then resources can be allocated to the essential fields of social and economic development. On the other hand, the market-oriented resource allocation mode should be actively explored to adjust the traditional extensive development model driven by investment. In this way, the manufacturing industry, especially the high-tech manufacturing industry with strong innovation ability, can break through the bottleneck of technology, and further improve capital and innovation resources’ utilization efficiency.
Future research
First, given the data availability, data on CE of the manufacturing industry in 2019 and 2020 are missing, resulting in a relatively short sample period for the empirical research. We will update the data and re-conduct regression analysis in future studies.
Second, CE is the result of capital flow to a specific direction or field in the capital market. The effect of CE on resource allocation efficiency may be affected by the external macro factors, which are ignored in this paper. In future research, we will focus on discussing this issue to improve the conclusions’ accuracy and reliability.
Finally, this paper does not fully consider the heterogeneity characteristics of 28 manufacturing segments, which needs to be further explored in detail. In the future, the effect of CE on CAE and IRAE will be tested by grouped-data regression to provide more comprehensive and detailed research conclusions.