
Abstract
Infrared (IR) images can distinguish targets from their backgrounds based on difference in thermal radiation, whereas visible images can provide texture details with high spatial resolution. The fusion of the IR and visible images has many advantages and can be applied to applications such as target detection and recognition. This paper proposes a two-layer generative adversarial network (GAN) to fuse these two types of images. In the first layer, the network generate fused images using two GANs: one uses the IR image as input and the visible image as ground truth, and the other with the visible as input and the IR as ground truth. In the second layer, the network transfer one of the two fused images generated in the first layer as input and the other as ground truth to GAN to generate the final fused image. We adopt TNO and INO data sets to verify our method, and by comparing with eight objective evaluation parameters obtained by other ten methods. It is demonstrated that our method is able to achieve better performance than state-of-arts on preserving both texture details and thermal information.
Introduction
The fusion of IR and visible images is to integrate the inherent properties of both images and merge their vital information to produce a fused image. As shown in Fig. 1 (a) (b), visible images have the characteristics of high resolution, and rich texture information, while IR images that are captured by IR sensors are normally of high contrast and less affected by weather [1]. The fusion of advantages of both IR and visible images has made success on target detection in military and civilian applications [2, 3]. In the past decades, based on the fusion strategies and theories [4], many researchers have proposed many fusion algorithms, traditional methods, like those [5, 6] based on multi-scale transform, sparse representation [7, 8], neural network [9, 10], subspace [11, 12], and saliency-based methods [13, 14], hybrid models [15, 16], and others [17, 18]. While it is not difficulty to establish the pixels’ correlations between the source images and fused images, but the imageing principles are different so there are no correlations between pixels.
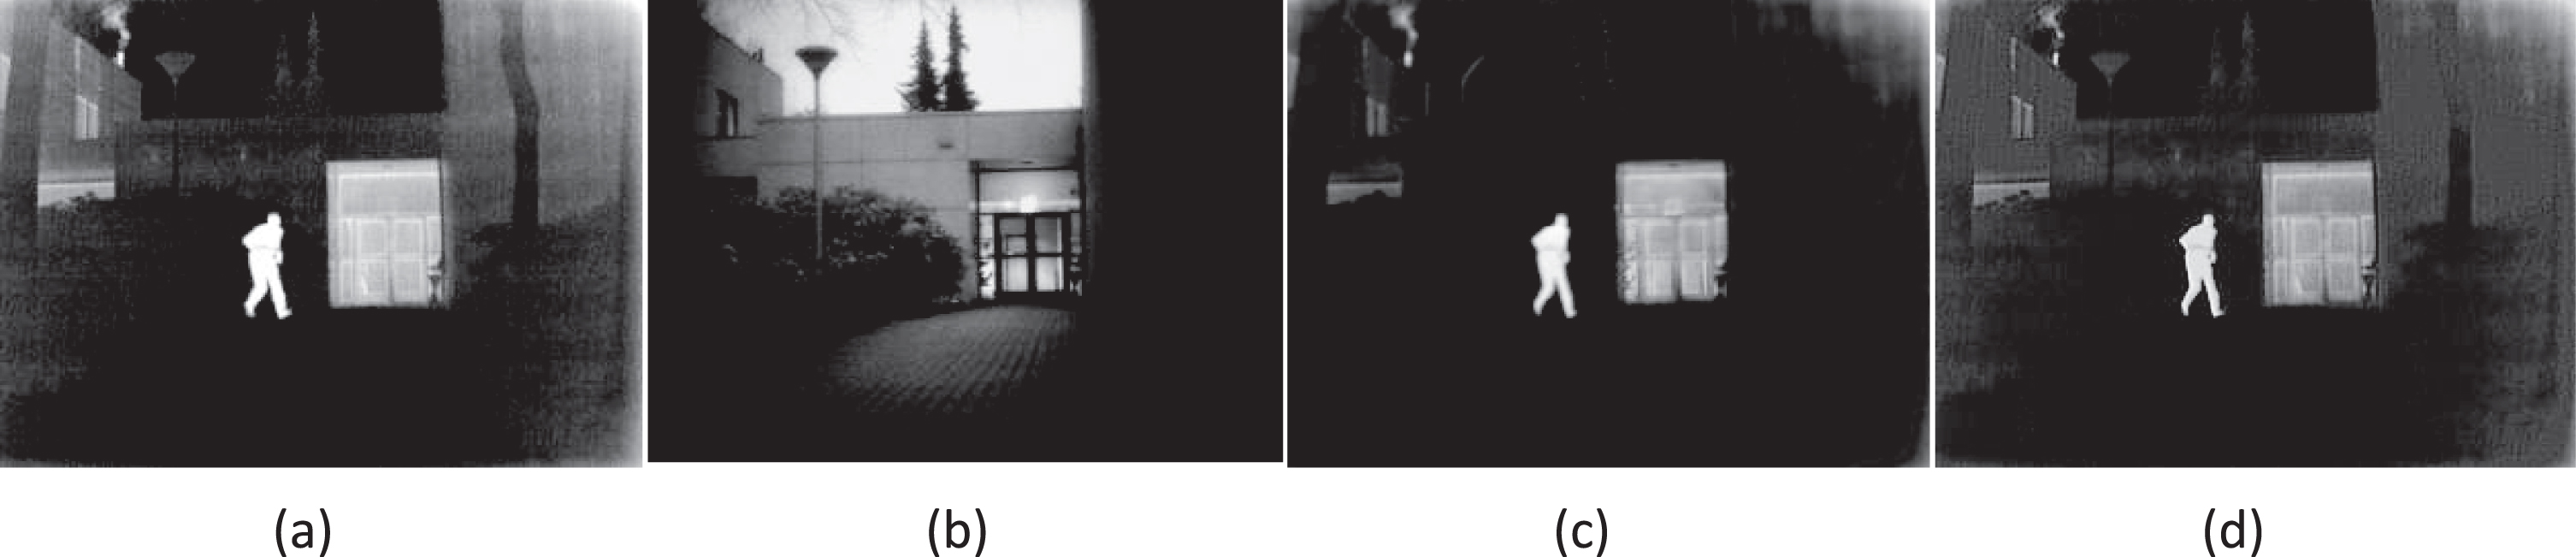
(a) IR image; (b) Visible image; (c) Fused image by ‘FusionGAN’; (d) Fused image by our method, showing clear texture of the trees and the building.
In recent years, research on deep learning (DL) has become more and more extensive, especially in image processing. DL-based image fusion methods can extract deep features automatically, making the whole fusion process easier. Liu et al. [19, 20] proposed the methods to use connected convolutional networks (CNN) to fuse IR and visible image. The methods have gained a good result, but they are difficult to control the process of generating images, and some information had lost in the process. In recent years, some researches proposed other DL algorithms for IR and visible images [21, 22] fusion. They proposed densely CNN and CSR-based framework for image fusion, respectively. Other researchers also proposed DL-based methods for image fusion [23–26]. However, DL-based methods are not end-to-end models, and they need to be trained on datasets with images in advance. No matter whether the network weights are generated by training or provided by mature feature extraction models, other transforms or operations are still needed to accomplish the final fusion process [27, 28]. To address this issue, Ma et al. [29] presented a novel IR and visible image fusion algorithm, ‘FusionGAN’, based on GAN. It imitates an adversarial game, between retaining the information of IR image and the information of visible image [29]. The network model of ‘FusionGAN’ is effective and relatively simple, and also can advance the fusion performance through optimizing the net structure or loss functions. Since the method of ‘FusionGAN’ has no ground truth to determine whether the generated data is true or false, the model takes the visible image as the ground truth, which leads to the fused image has more texture details and less thermal radiation information.
Unlike ‘FusionGAN’, in this paper we propose a two-layer GAN network for the target. In the first layer, we feed IR image and visible image to generators (G) to generate fused images respectively, and use the other image as ground truth. Then in the second layer we feed one of the two images generated by the first layer to G to generate fused image, and feed the other fused image to discriminator (D) as the ground truth image. The entire structure of the network is illustrated in Fig. 2.
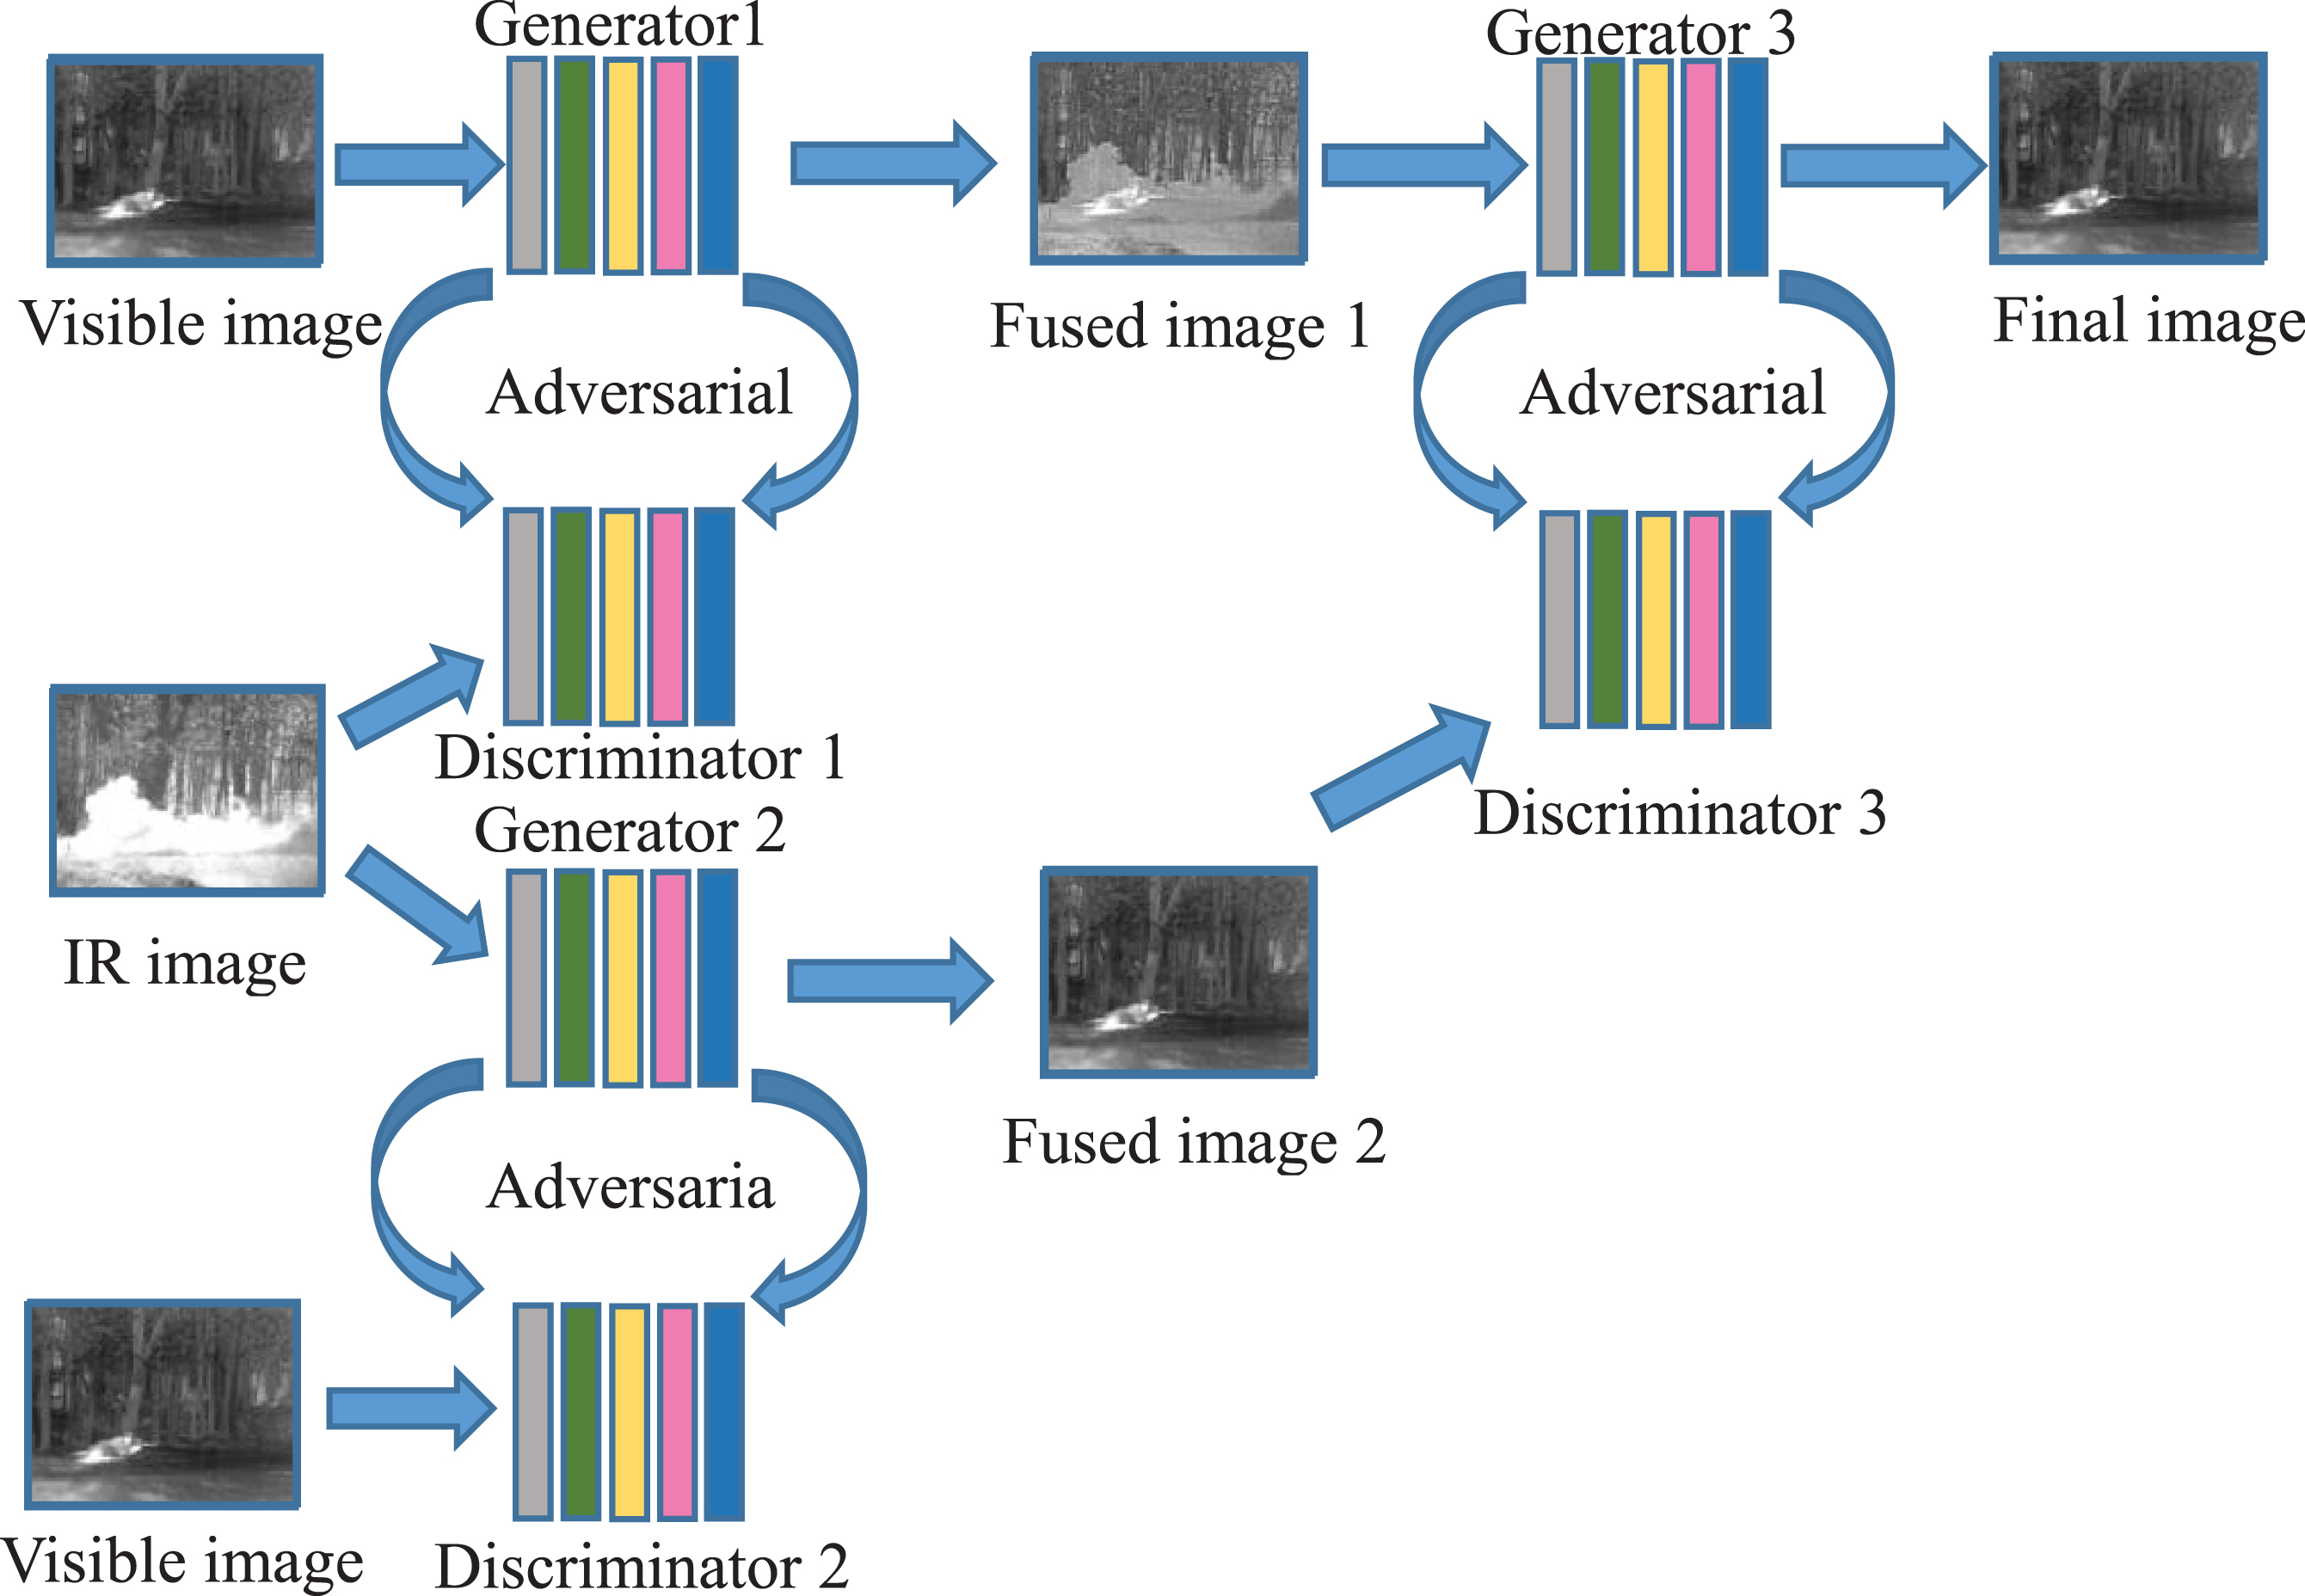
Framework of the two-layer GAN.
Our experiments have demonstrated that our proposed method is able to produce fused images with improved performance against the state-of-arts by preserving both the texture details from visible image and thermal radiation information from IR image. Figure 1 shows a preview of the fusion samples of ‘FusionGAN’ and our method.
The main contributions of this paper include the following three parts. First, we proposed a two-layer GAN, and designed the loss functions of G and D. Second, our model is an end-to-end model, which can automatically generate fused images without human participation. Third, we conducted experiments on the public data sets of IR and visible, and compared them qualitatively and quantitatively with the most advanced methods. The results of our proposed model show that the hidden target is clearly visible and the detailed texture information is rich.
Among the remaining sections of this paper, Section 2 reviews traditional and DL-based fusion methods. Section 3 presents the proposed approach, including the network structure, loss function and training flow of our model. Section 4 gives our experimental results, including qualitative illustration and quantitative analysis and comparison to the state-of-arts. Section 5 we conclude the paper and propose future work.
In this section, first we review the conventional and DL-based methods for IR and visible image fusion, and then introduce the network structure and characteristics of GAN.
Conventional methods
The conventional methods mainly include the multi-scale decomposition (MSD)-based methods [30, 31], sparse representation (SR)-based methods [32, 33], neural network-based methods [34, 35], and hybrid models-based methods [15, 36]. MSD-based methods decompose the source images into components of different scales, and each component represents sub-images of different scales. Then, the methods fuse the sub-images at different scales according to some rules and at last using inverse multi-scale transforms to gain the final result. SR-based methods aim to build an over-complete dictionary from a large number of high-quality natural images. And then, the method can use the dictionary to represent the source images. Most neural network based methods mainly adopt pulse-coupled neural network (PCNN) or its variants. PCNN-based methods make full use of its own biological characteristics to extract local details and obtain better final image when considering the gradient and phase information in advance.
There are many mixed model-based methods take the advantages of the above methods and try to avoid their respective disadvantages such as blurring boundaries and missing details. The hybrid MSD method [37], the hybrid MSD and SR method [38], the hybrid multi-wavelet and PCNN method [39], and the hybrid MSD neural network and SR method [40] have great contributions to the research. Zhao et al [30] proposed used multi-wavelet decomposed the image and used pulse number reconstructed the fused image which can effectively improve the entropy, standard deviation, and quality measure. Ying [40] proposed a method decomposed the image by shift-invariant dual-tree complex shearlet, and then used SR rule fused the image which exceled in both objective evaluation criteria and visual quality.
Deep learning method
In recent years, CNN have achieved great success in many computer vision applications. Prabhakar et al. [41] proposed a DL method for fusing static multi-exposure images. This method opens a novel way for information fusion by CNN. For IR and image fusion, Liu et al. [42] proposed a Siamese convolutional network to get the weight graph and used the image pyramid to solve the multi-scale problem. In addition, another fusion approach, “DenseFuse”, was proposed by Li et al. [43], using dense blocks to store more information from the middle layers. Obviously, DL-based methods have made a breakthrough in IR and visible image fusion. However, the approaches using CNN must meet a critical precondition that is: the ground truth should be available in advance. On this premise, the CNN techniques for IR and visible image fusion construct a deep model to determine the fused degree of every patch in the source images, and then calculate a weight map for generating the final image [42]. Li et al. [39] introduced Dense Net into the CNN for making full use of each convolution layer and achieved good results. However, the aspects like network architecture can still be further improved. Recently, Ma et al. [29] innovatively proposed a method with GAN, and formulated the fusion as an adversarial game between keep the thermal radiation information and texture detail information. Instead of pre-training, the method used IR and visible image patches to train the network.
Generative adversarial networks
The method of GAN [44] is based on minimax game and provides a simple and effective method for estimating target distribution and generating new samples. As illustrated in Fig. 3, GAN includes two adversarial components: G model and D model. G can generate a data distribution according to input noise (Pz) and D can estimate whether the generated sample is real sample data or not.
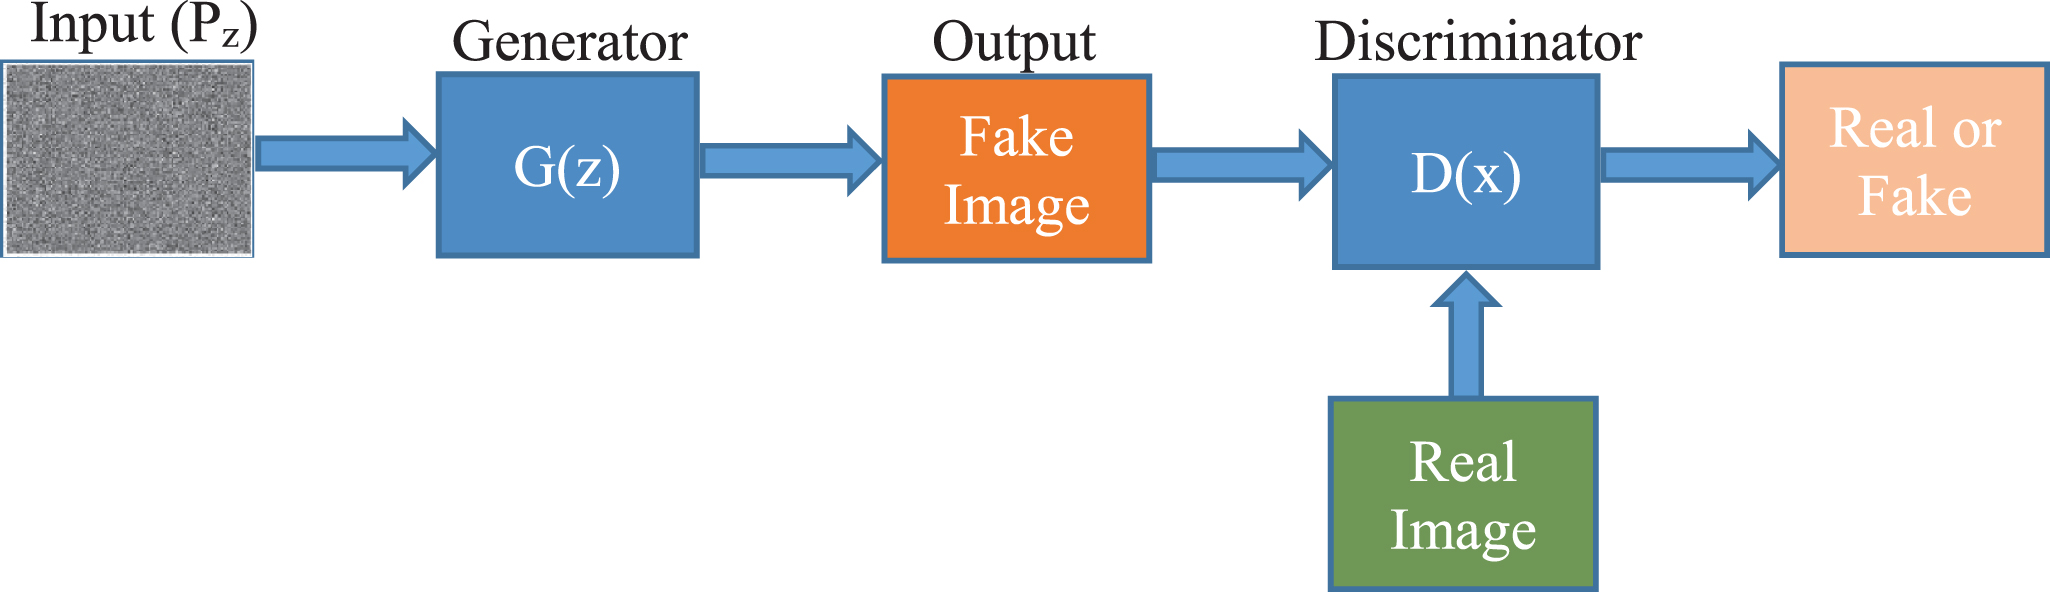
The schematic diagram of the GAN.
The advantages and disadvantages of each type methods are listed in Table 1. Compared to the traditional fusion method and DL-based method, GAN has many advantages such as no need to use Markov chain or expand approximate reasoning network for training and sample generation [44]. In this paper we take these advantages propose a two-layer GAN network for fusing IR and visible images.
Comparison of advantages and disadvantages of each method
A very difficult premise in this task is that there is no ground truth, so ‘FusionGAN’ selects visible image as the ground truth, which leads to lose many features of IR image in the fusion image during the adversarial process. In order to overcome the above problems, we propose a two-layer GAN method. In the first layer of the network, we feed IR image and visible image to G to generate fused images respectively, and use the other image as ground truth. Then in the second layer we feed one of the two images generated by the first layer to G to generate fused image, and feed the other to D as the ground truth. The structure of the two-layer GAN is illustrated in Fig. 2. It’s worth mentioning that, during the experiment, we have also changed the input of G in the second layer, i.e. taking the second fusion result of the first layer as the input of G, and then take the first fusion result as the ground truth. The final fusion results were quite similar, thanks to the symmetric features of the proposed structure.
The structure of G
Our model has three Gs that have the same structure as shown in Fig. 4.
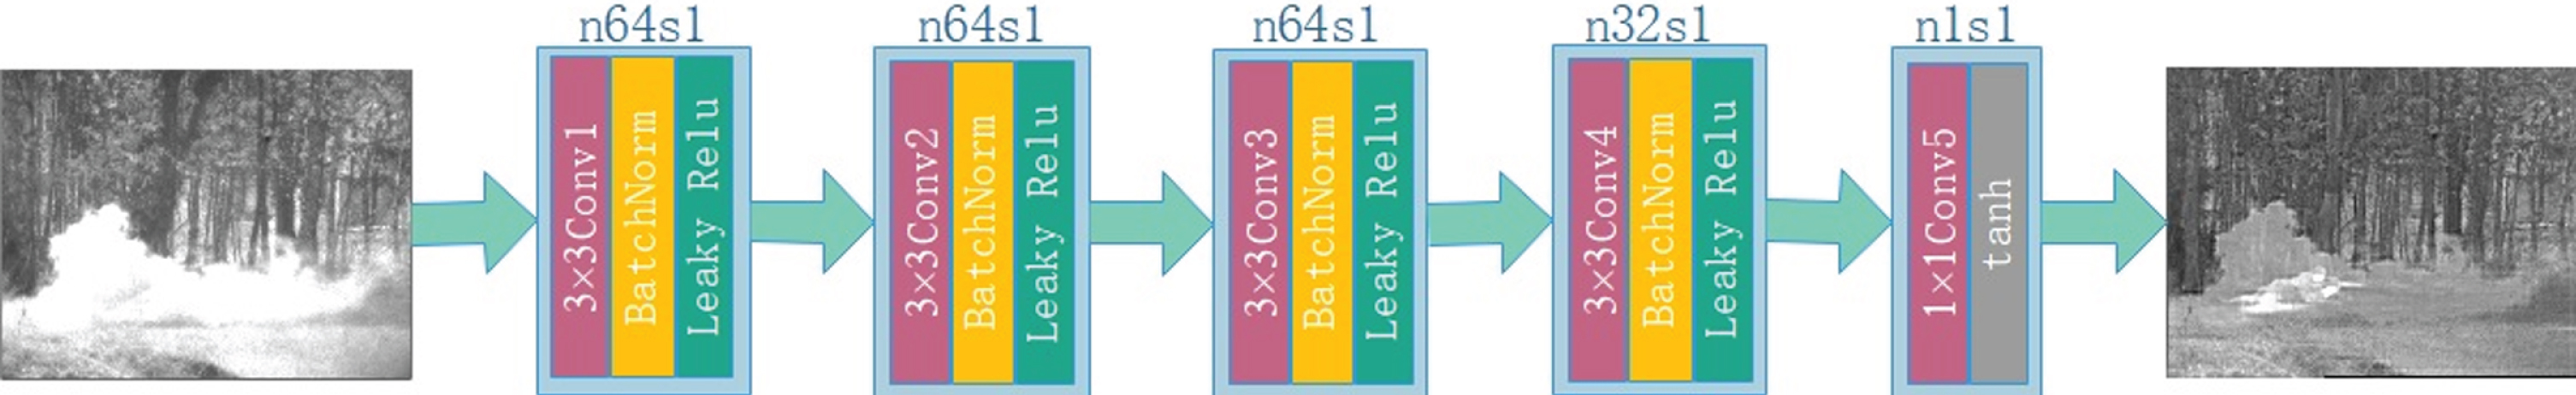
The network of the generator.
G is a simple five-layer CNN with 3×3 filters in the first four layers, and 1×1 filter in the last layer. The stride in each layer is set to 1, and there is no padding operation in convolution. In order to keep the details of the source image, only is the convolutional layer is introduced instead of downward sampling, which also keeps the input and output images the same size [45]. In addition, to avoid the problem of vanishing gradient, we follow the rules of deep convolutional GAN [46] for batch normalization and activation function. To overcome the sensitivity to data initialization, we used batch normalization in the first four layers that can make our model more stable and also help the gradients to back propagate to every layer effectively. For the activation function, we use leaky ReLU activation function in the first four layers, and the tanh activation function in the last layer.
Our model has three Ds of the same structure but different input images and ground truths, as illustrated in Fig. 2. The D’s structure is shown below in Fig. 5.
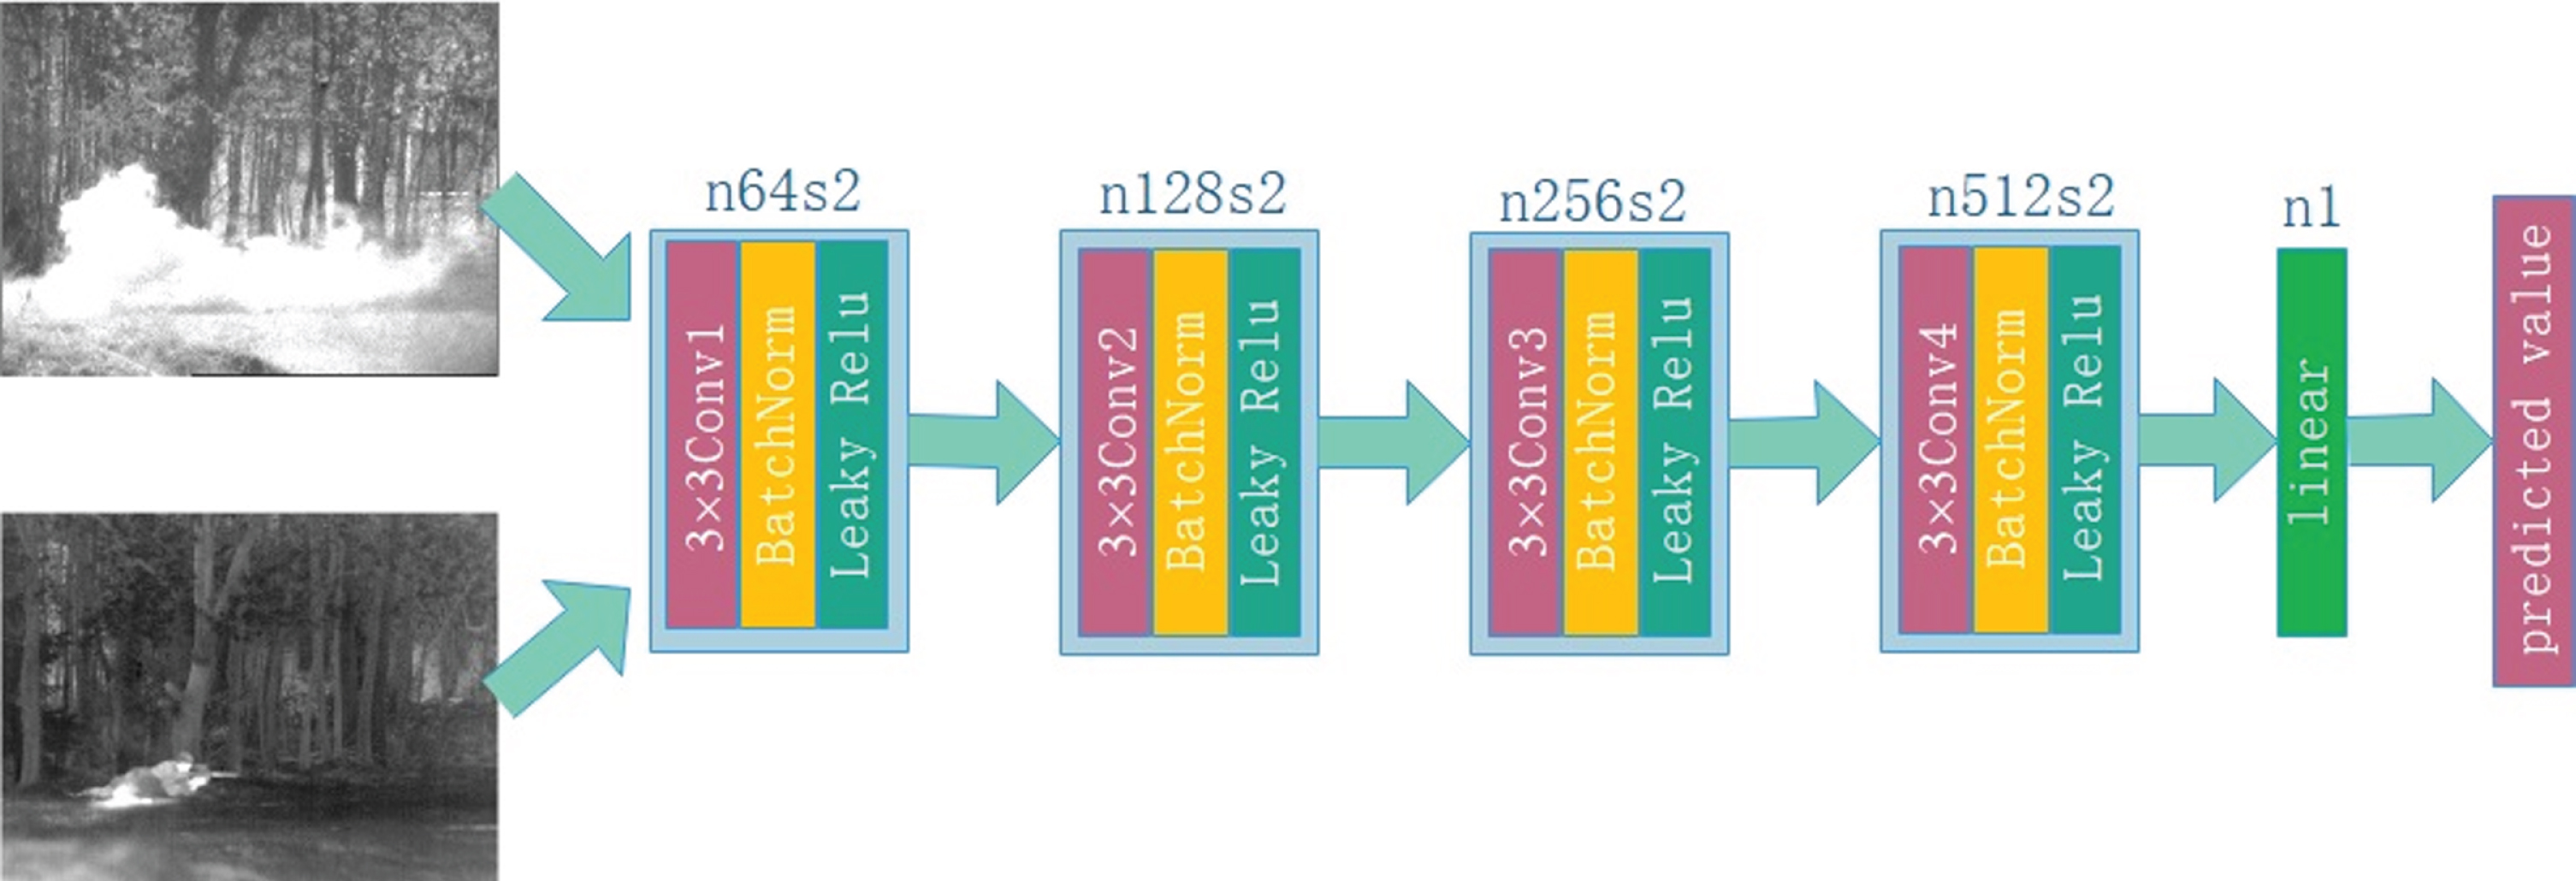
The network structure of the discriminator.
D is a simple five-layer CNN, with 3×3 filters in the first four layers, and the stride set as 2 without padding. This is different from a generator network, for the discriminator is a classifier, which first extracts feature map from the input image and then classifies it. Therefore, it works in the same way as the pooling layer, setting the stride as 2. In order not to introduce noise into our model, we do not pad the input image. From the layer 1 to layer 4, we used the batch normalization layer. In addition, we used the Leaky ReLU activation function for the first four layers. The last layer is a linear layer for classification.
The core of GAN is the adversarial loss, we can use it to establish the adversarial relationship between G and D. Below we introduce the adversarial loss of our model in detail.
Since the network has three Gs and three Ds, we introduce their loss functions, respectively. Motivated by ‘FusionGAN’ [29], we split the functions into two components: the adversarial loss and content loss for the G, and the positive loss and negative loss for the D.
a) The first generator
The input of first G is IR image, and output is the fused image I
IRV
. The loss function of the first G consists of two terms:
Where N represents the number of fused images and D (I IRV ) denotes the discriminative results which reflecting the distinguish degree of the fused images from the visible images. ℓ1 is the initial weight value that discriminator believe in fake data which generate from generator, which in our method is set as 0.8.
The second term
Where S represents the area of the input images, || · || F stands for the matrix Frobenius norm, and λ is the weight which we set as 2 in our method.
b) The second generator
The input of second G is the visible image, and G generate image I
VIR
. Similar to the first G, the loss function of the second G consists of two terms:
Where I V represents the visible image and the explanation of these three formulas is the same as above for the first G. ∇ means the gradient operator.
c) The third generator
The input of third G is the fused image I
IRV
which generated from the first G. And it generate the final image I
ff
. The loss function of the third G consists of two terms:
The explanation of these three formulas is the same as above. ζ is a positive parameter which control the balance of the two terms, which in our method is set as 100. The larger this number, keep the more information of the second fused image.
The loss function of D contains two terms: the deviation degree of the ground truth image from the expectation and the deviation degree of fused image from the expectation. The three D have same loss function which consists of two terms
Where I
gt
represents the ground truth and I
f
represents the fusion image. And α and β represent the parameters of the image I
f
, and the image I
gt
respectively. We set the parameter α as 0.8, since we regard the ground truth as the real image thus making it close to 1. On the contrary, we set the parameter β as 0.2, since we regard fused image as the fake image thus making it close to 0. This setting is to balance the loss function. We want the D can distinguish the fake data from the ground truth so through optimizing D to minimize D (I
f
). The smaller
In our experiments, we selected 41 pairs of IR and visible images from the TNO database [47] which includes intensified visual, near-IR, and long-wave IR or thermal, night time imagery of different military relevant scenarios. All images have already been pre-aligned. These image pairs mostly have evident pixel intensity in IR images and abundant details in visible images. We divided 41 pairs of images into two parts: 31 pairs for training and 10 pairs for testing. Since 31 pairs of images are not enough to train a good model, we crop each image by setting the stride to 12, and each patch is of the same size 128×128. As a result, we combined 35,283 pairs of images together as the training data set.
Details of training
During the training, we set iteration number k as 10, step number as 2, and cropped the training images into 128×128 batches without overlapping. If the iteration is not over we fed the image batches to G, which then generates fused image batches, otherwise the whole training is over. Then we fed IR batches and fused image batches to D, which output the loss of G and the loss of D . At the end of iteration, G generates the fused image. Now that we’ve trained one image patch, we should to train all the image patches. Figure 6 shows the GAN’s training process.
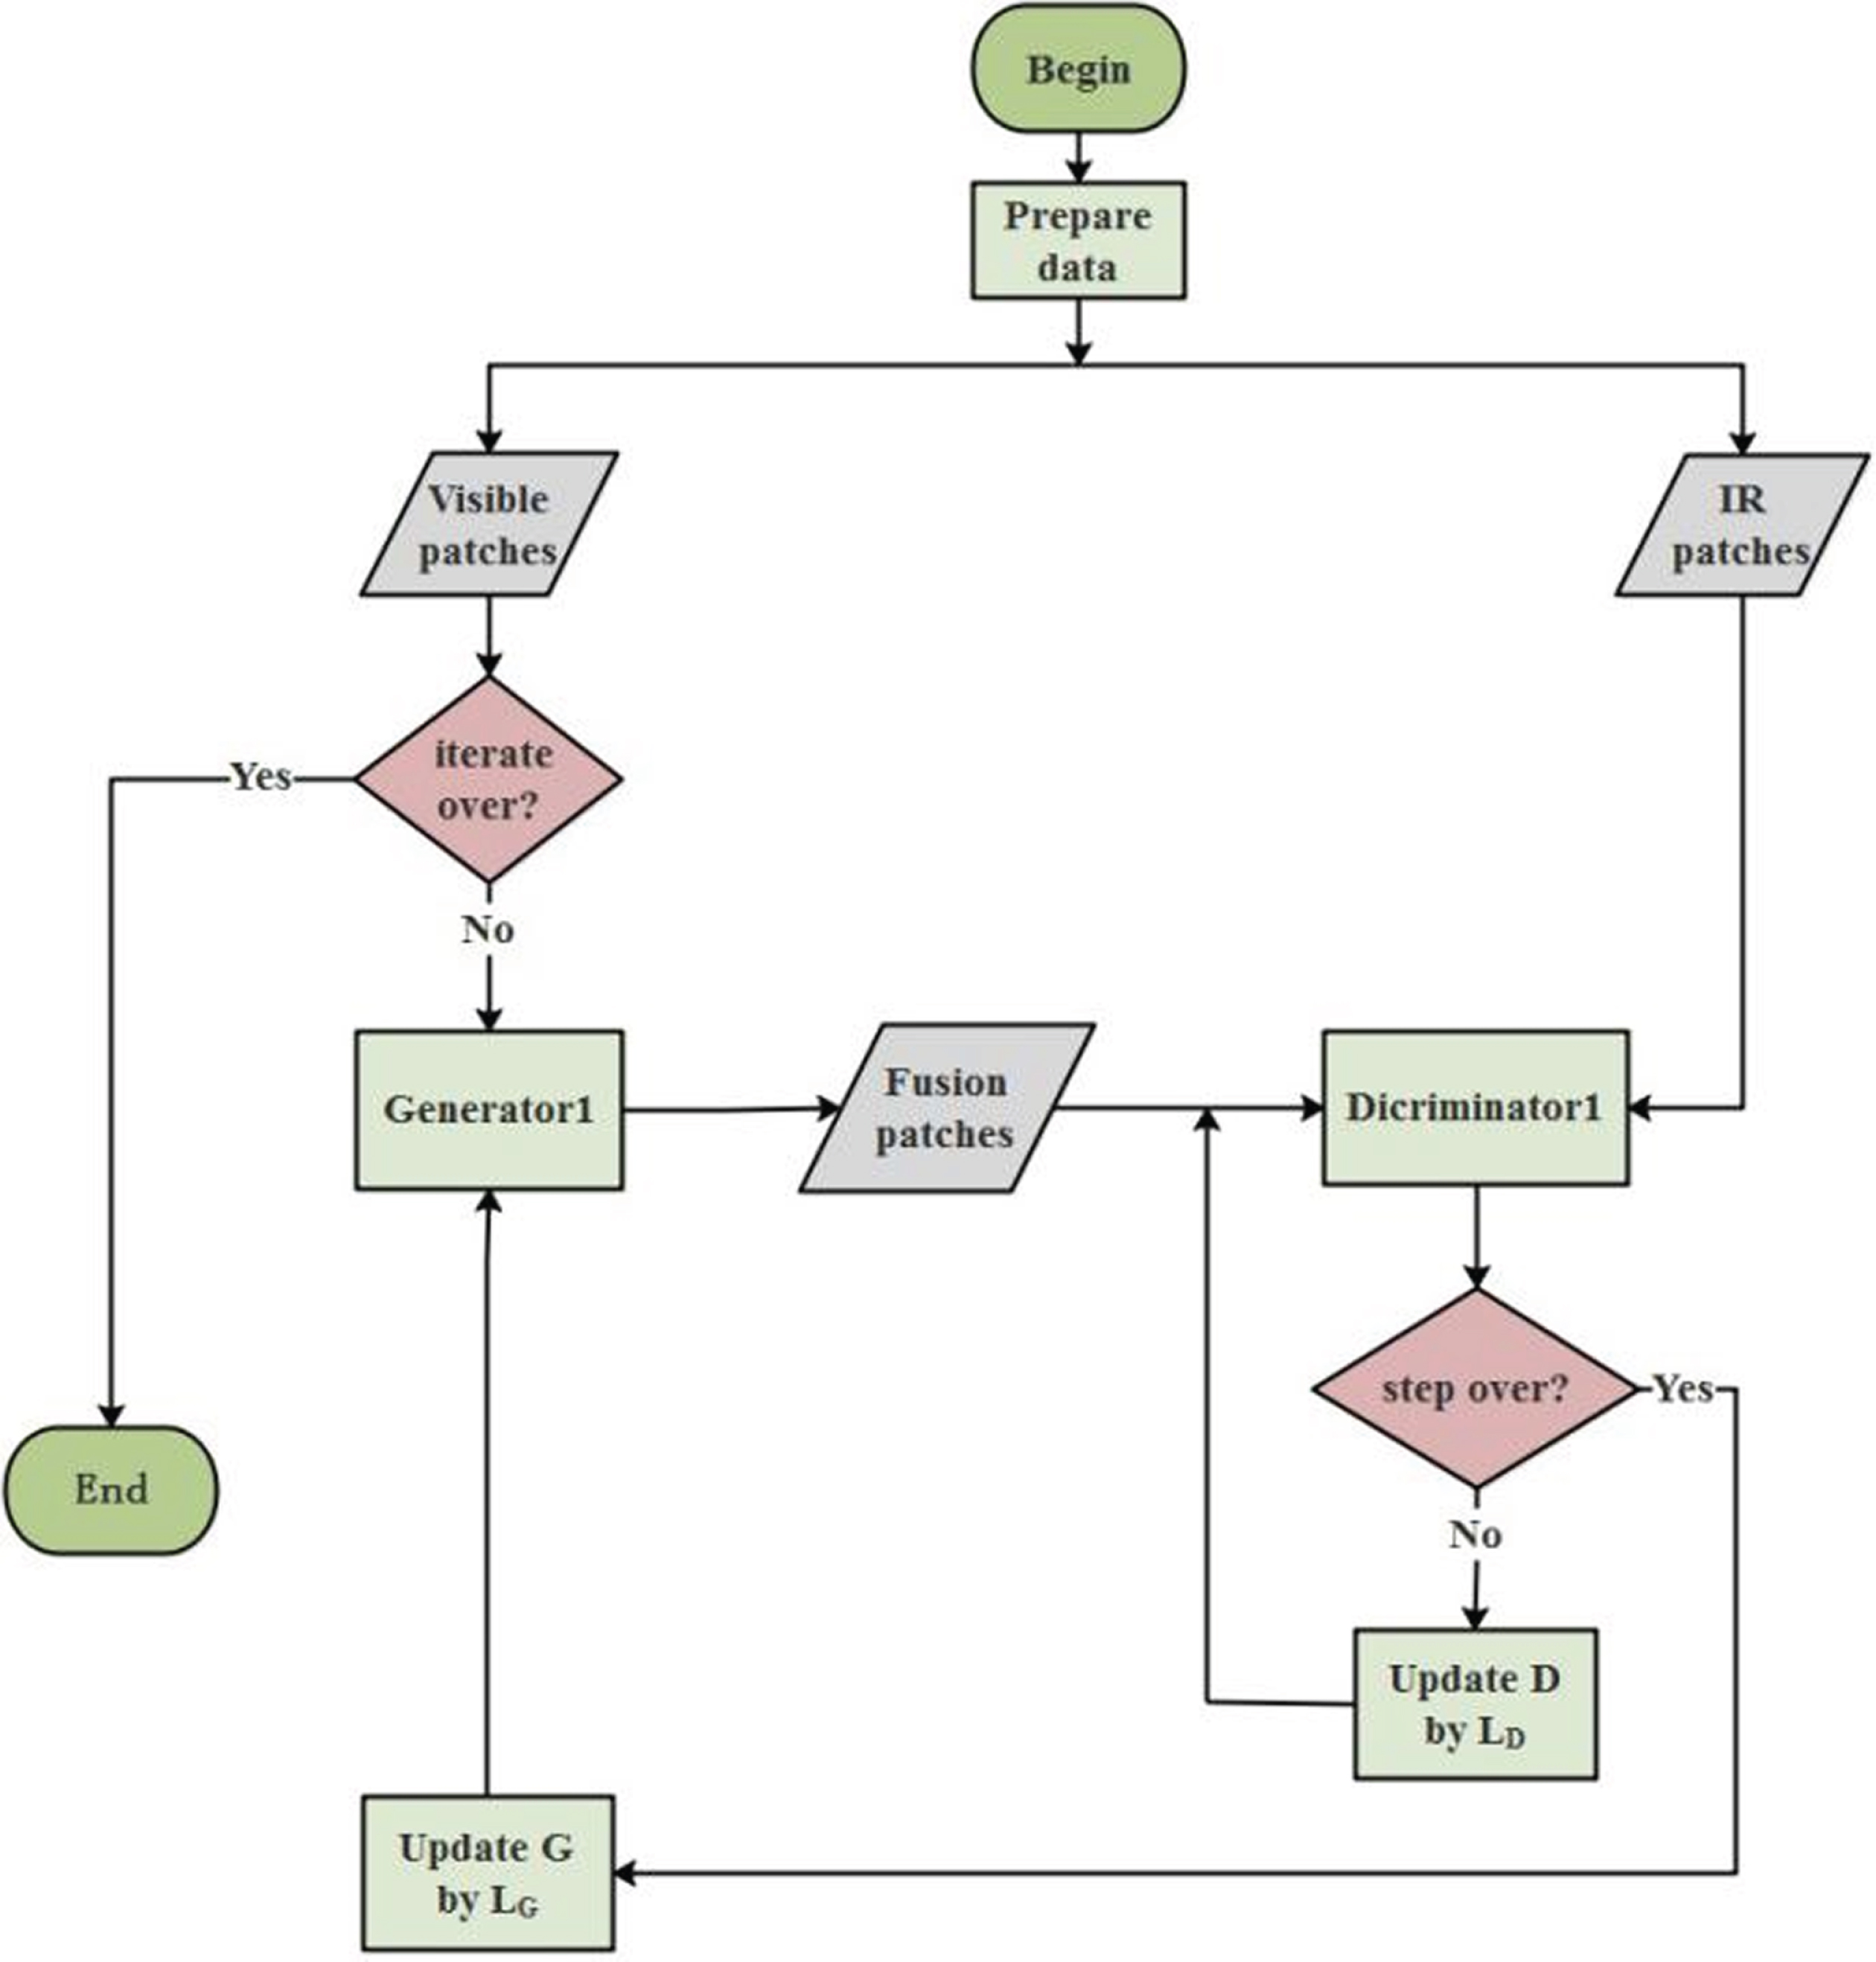
Training process of GAN.
In the training process, we will train three pairs of G and D. The first pair takes visible images as input and IR images as ground truth. Through the training, the network with the first pair can generate fused image that contains more thermal radiation information. The second pair takes IR images as input and visible images as ground truth. After training, it can generate fused image that contains more texture details. The third pair takes the images that are generated by first network as input and the images that generates by second network as ground truth for training. During the process we use the method as that in [48] to optimize the discriminator. After these trainings, the final fused images will then retain salient details from both IR and visible images.
The fusion task is difficult to objective evaluate for there is no standard ground truth. As a result, researchers take a reasonable way to apply several fusion metrics to make an overall evaluation [49]. In this paper, we used eight objective metrics to access the results. The metric entropy (EN) denotes the amount of information in the final result. Mutual information (MI) evaluates the the mutual information of result. Structural similarity (SSIM) accesses the average of structural similarity between the input images and final image. Spatial frequency (SF) [50] accesses the spatial frequency of the result. Standard deviation (SD) [51] accesses the contrast of the result which influences the visual attention. The sum of the correlation of differences (SCD) [52] is an independent index for judging the amount of information transmitted from source images to the fused image. The feature mutual information (FMI) [53] measures the mutual information between image features. QABF [54] is a local measure used to estimate the degree of retention of significant information in fused images. For all eight metrics, the larger value means the better result.
Subjective evaluation
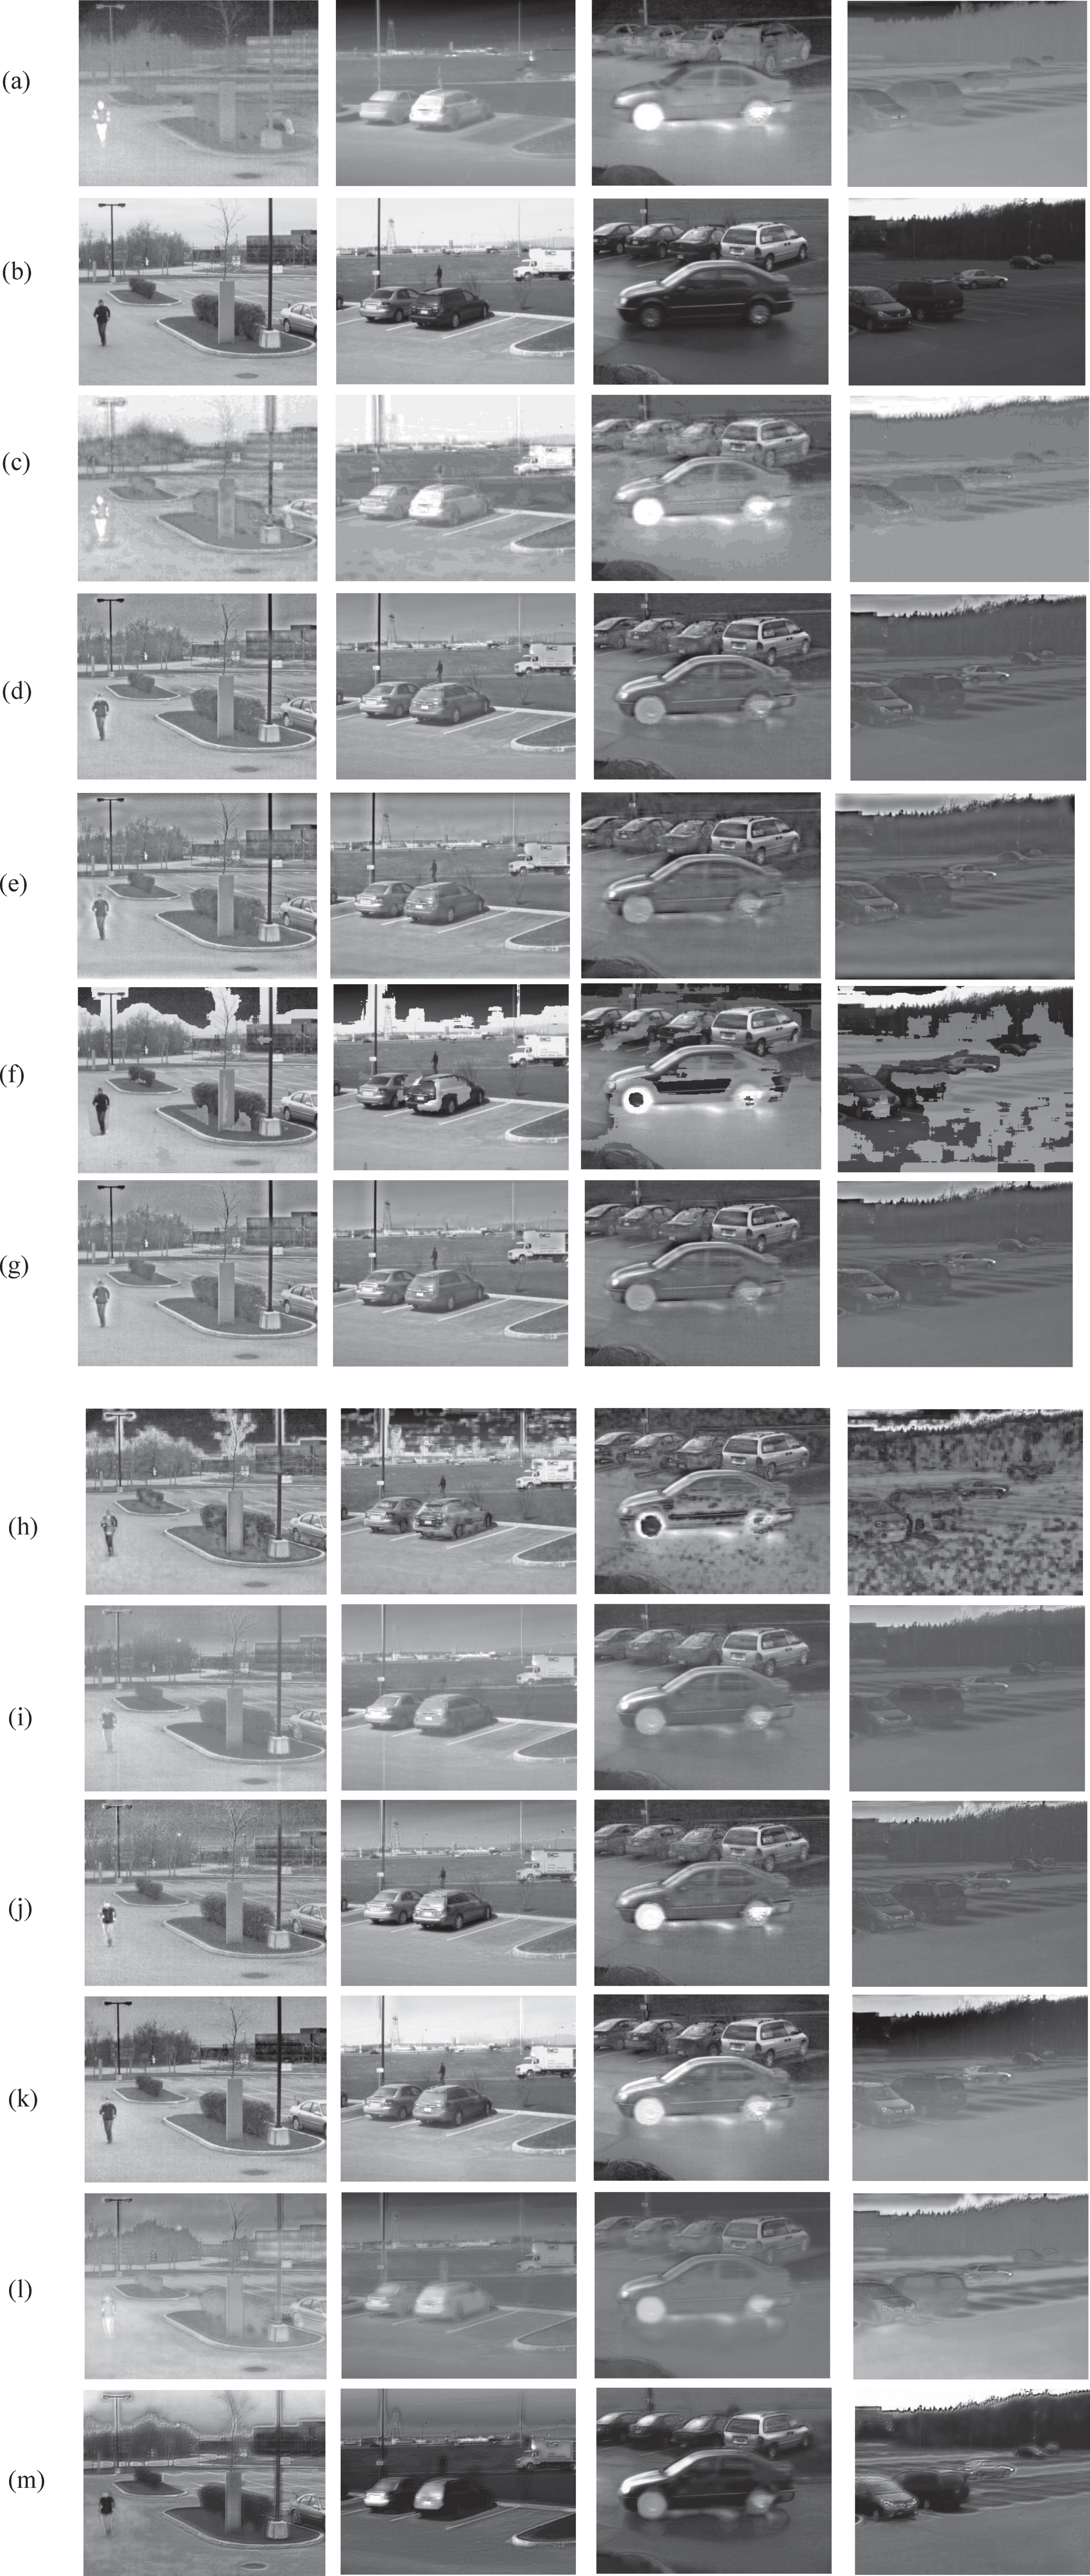
To elaborate and compare the effects clearly, we obtained the fusion results by eight different methods of ten pairs as show in Figs. 7 and 8.
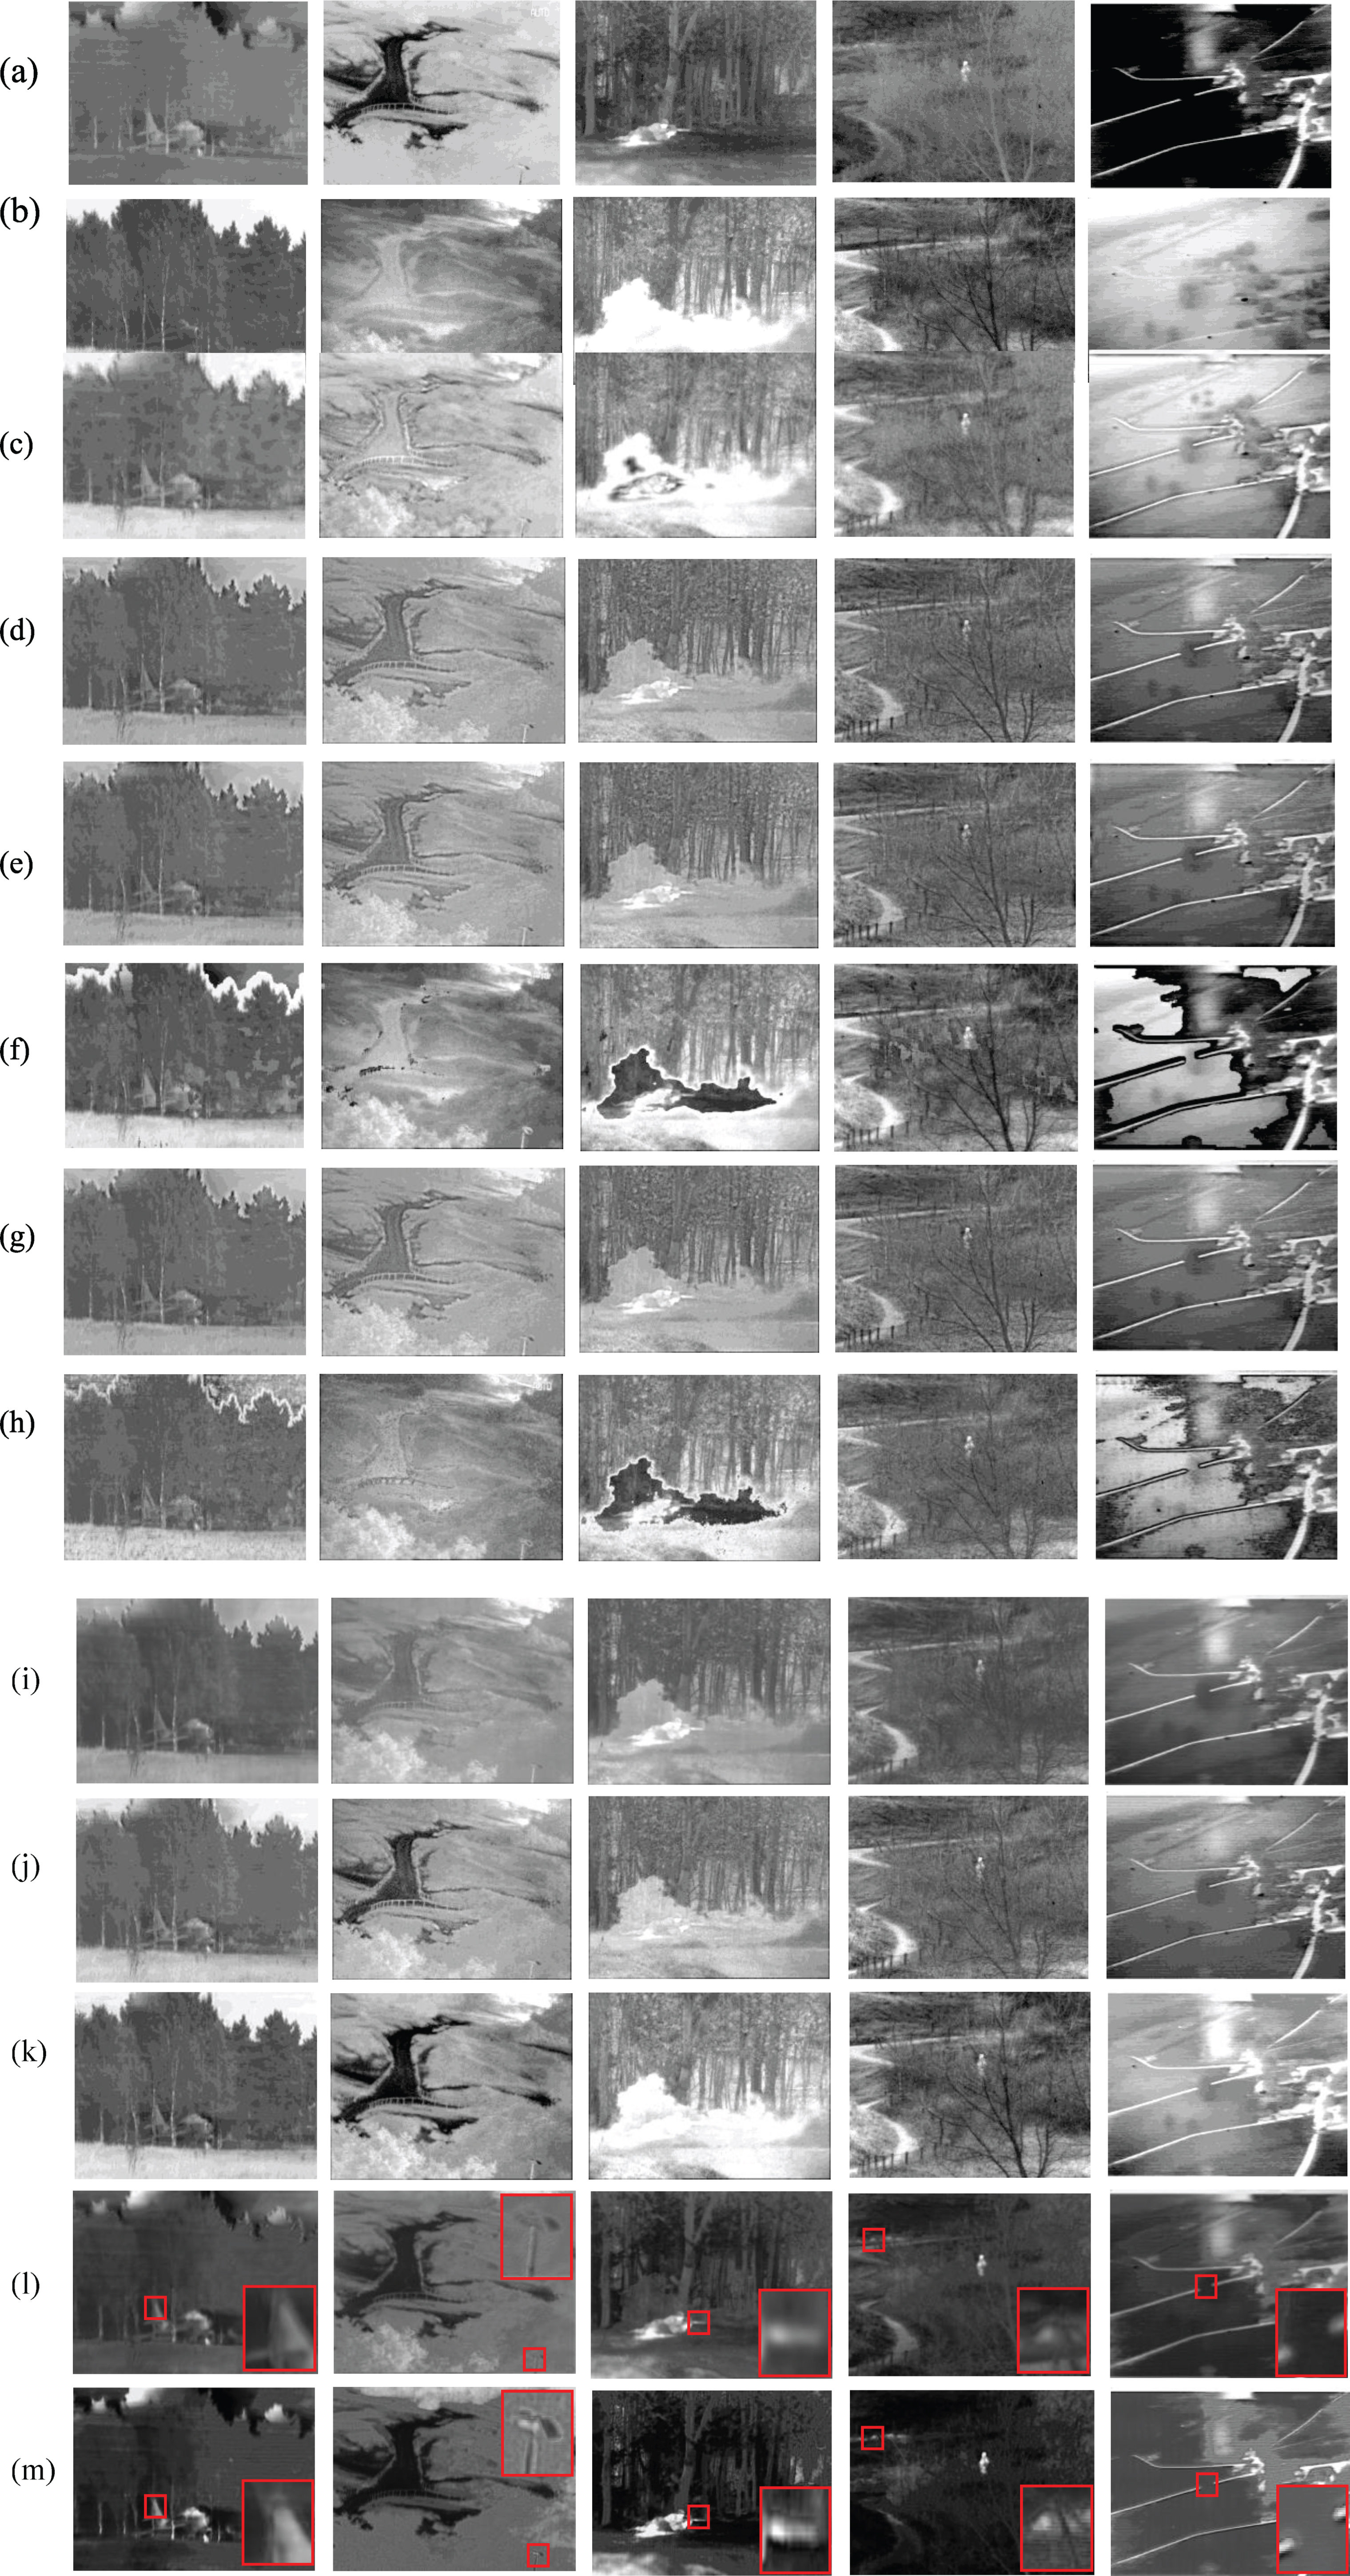
The results for the first 5 groups. (a) IR image, (b) VIS Image, (c) NSST-PAPCNN, (d) NSCT, (e) CVT, (f) CSR, (g) DTCWT, (h) CBF, (i) LATLRR, (j) WLS, (k) CNN, (l) FGAN, (m) OURS. In order to compare clearly, we choose a red small region in each image, and then enlarge it.
The results for the last 5 groups. (a) IR image, (b) VIS Image, (c) NSST-PAPCNN, (d) NSCT, (e) CVT, (f) CSR, (g) DTCWT, (h) CBF, (i) LATLRR, (j) WLS, (k) CNN, (l) FGAN, (m) OURS. In order to compare clearly, we choose a red small region in each image, and then enlarge it.
The comparing methods in our experiment include NSST-PAPCNN [55], nonsubsampled contou- rlet transform (NSCT) [56], curvelet transform(CVT) [57], convolutional sparse representation (CSR) [58], dual-tree complex wavelet transform (DTCWT) [59], cross bilateral filter(CBF) [60], Latent Low-Rank Representation(LATLRR) [61], weighted least squa- re(WLS) [62], CNN-based fusion [63], and GAN based method (‘FusionGAN’) [29]. We gained the results from the codes of the authors.
The first two rows in Figs. 7 and 8 are IR images and visible images, and the last row is the final results of our method. Overall, the results show that all the methods can fuse the visible image and IR image well to some extent. However, through the results we can see that, comparing to other methods, ‘FusionGAN’ and ours make the target area (such as buildings, people and cars) more prominent in the fused images, which is conducive to automatic target detection and localization. This could be attributed to the fact that ‘FusionGAN’ and ours are able to retain more IR information, while other comparing methods focus more on exploiting the texture details in the visible images.
From comparing our method and the method of ‘FusionGAN’, we can see that our final images contain slightly more plentiful details, and they are better suitable to visual perception, as shown in the red boxes in Figs. 7 and 8. For example, the solider in the third column of Fig. 7 is presented more clearly by ours than that by ‘FusionGAN’. In the second column of Fig. 8, the hand of the umbrella bearer is fused more appropriately and more clearly by ours than ‘FusionGAN’. And in the third column of Fig. 8, the corner of the roof highlighted in the box fused by ‘FusionGAN’ is fuzzy, while our result is sharper. This demonstrates our method’s excellent performance in terms of simultaneously retaining IR image information and visible image details information.
To quantitative compare, we evaluated all methods through the above-mentioned eight metrics. We plotted the results show as Fig. 9, and listed the average of ten fused results for eight metrics in Table 2.
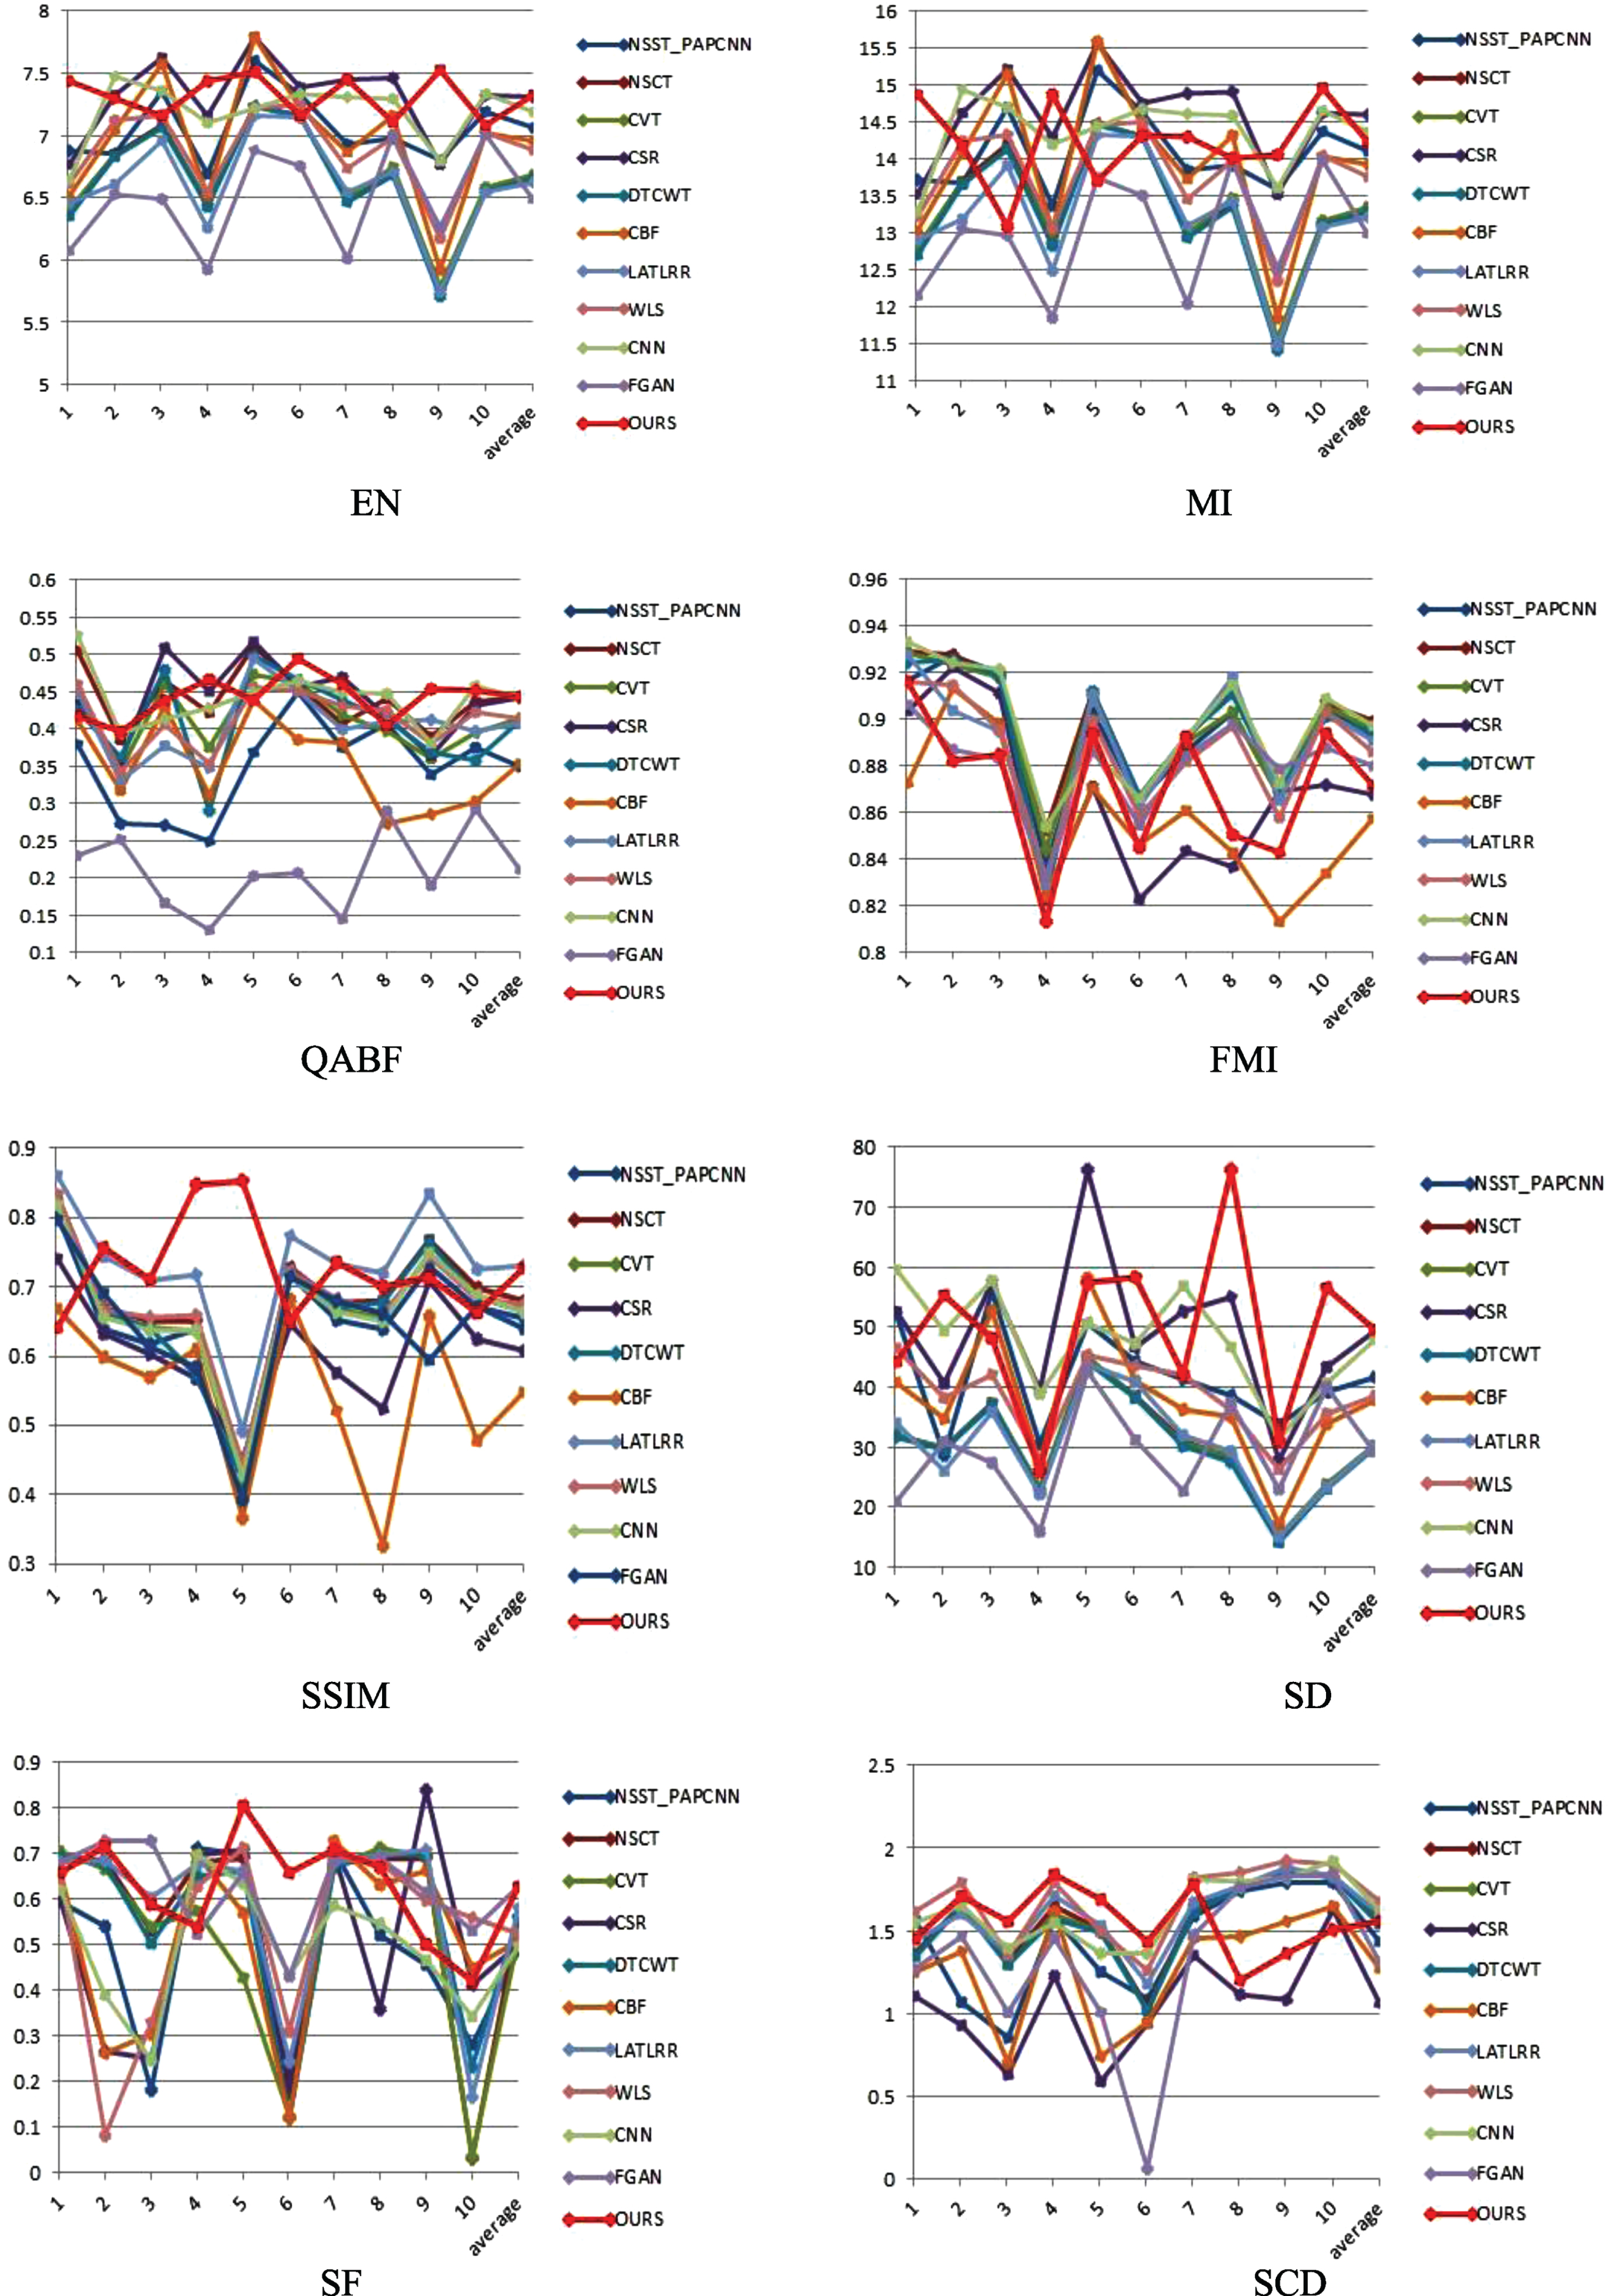
Quantitative values of eight metrics for TNO data set.
The average values of ten fused images form TNO for the eight metrics
In Table 2, the best values for each metric are presented in bold face. They show that our method achieves the best performance in EN, QABF, SD, and SF. For other metrics, the performance of our method is not far from the best. High EN and SD values indicate that our fused images have higher contrast and more abundant information, while high QABF means our fused image is superior in conspicuousness. Also, a high SF indicates that our method can generate the images contain more texture details. However, our method has slightly lower SCD, which will be our future work to optimize the network structure and loss function further.
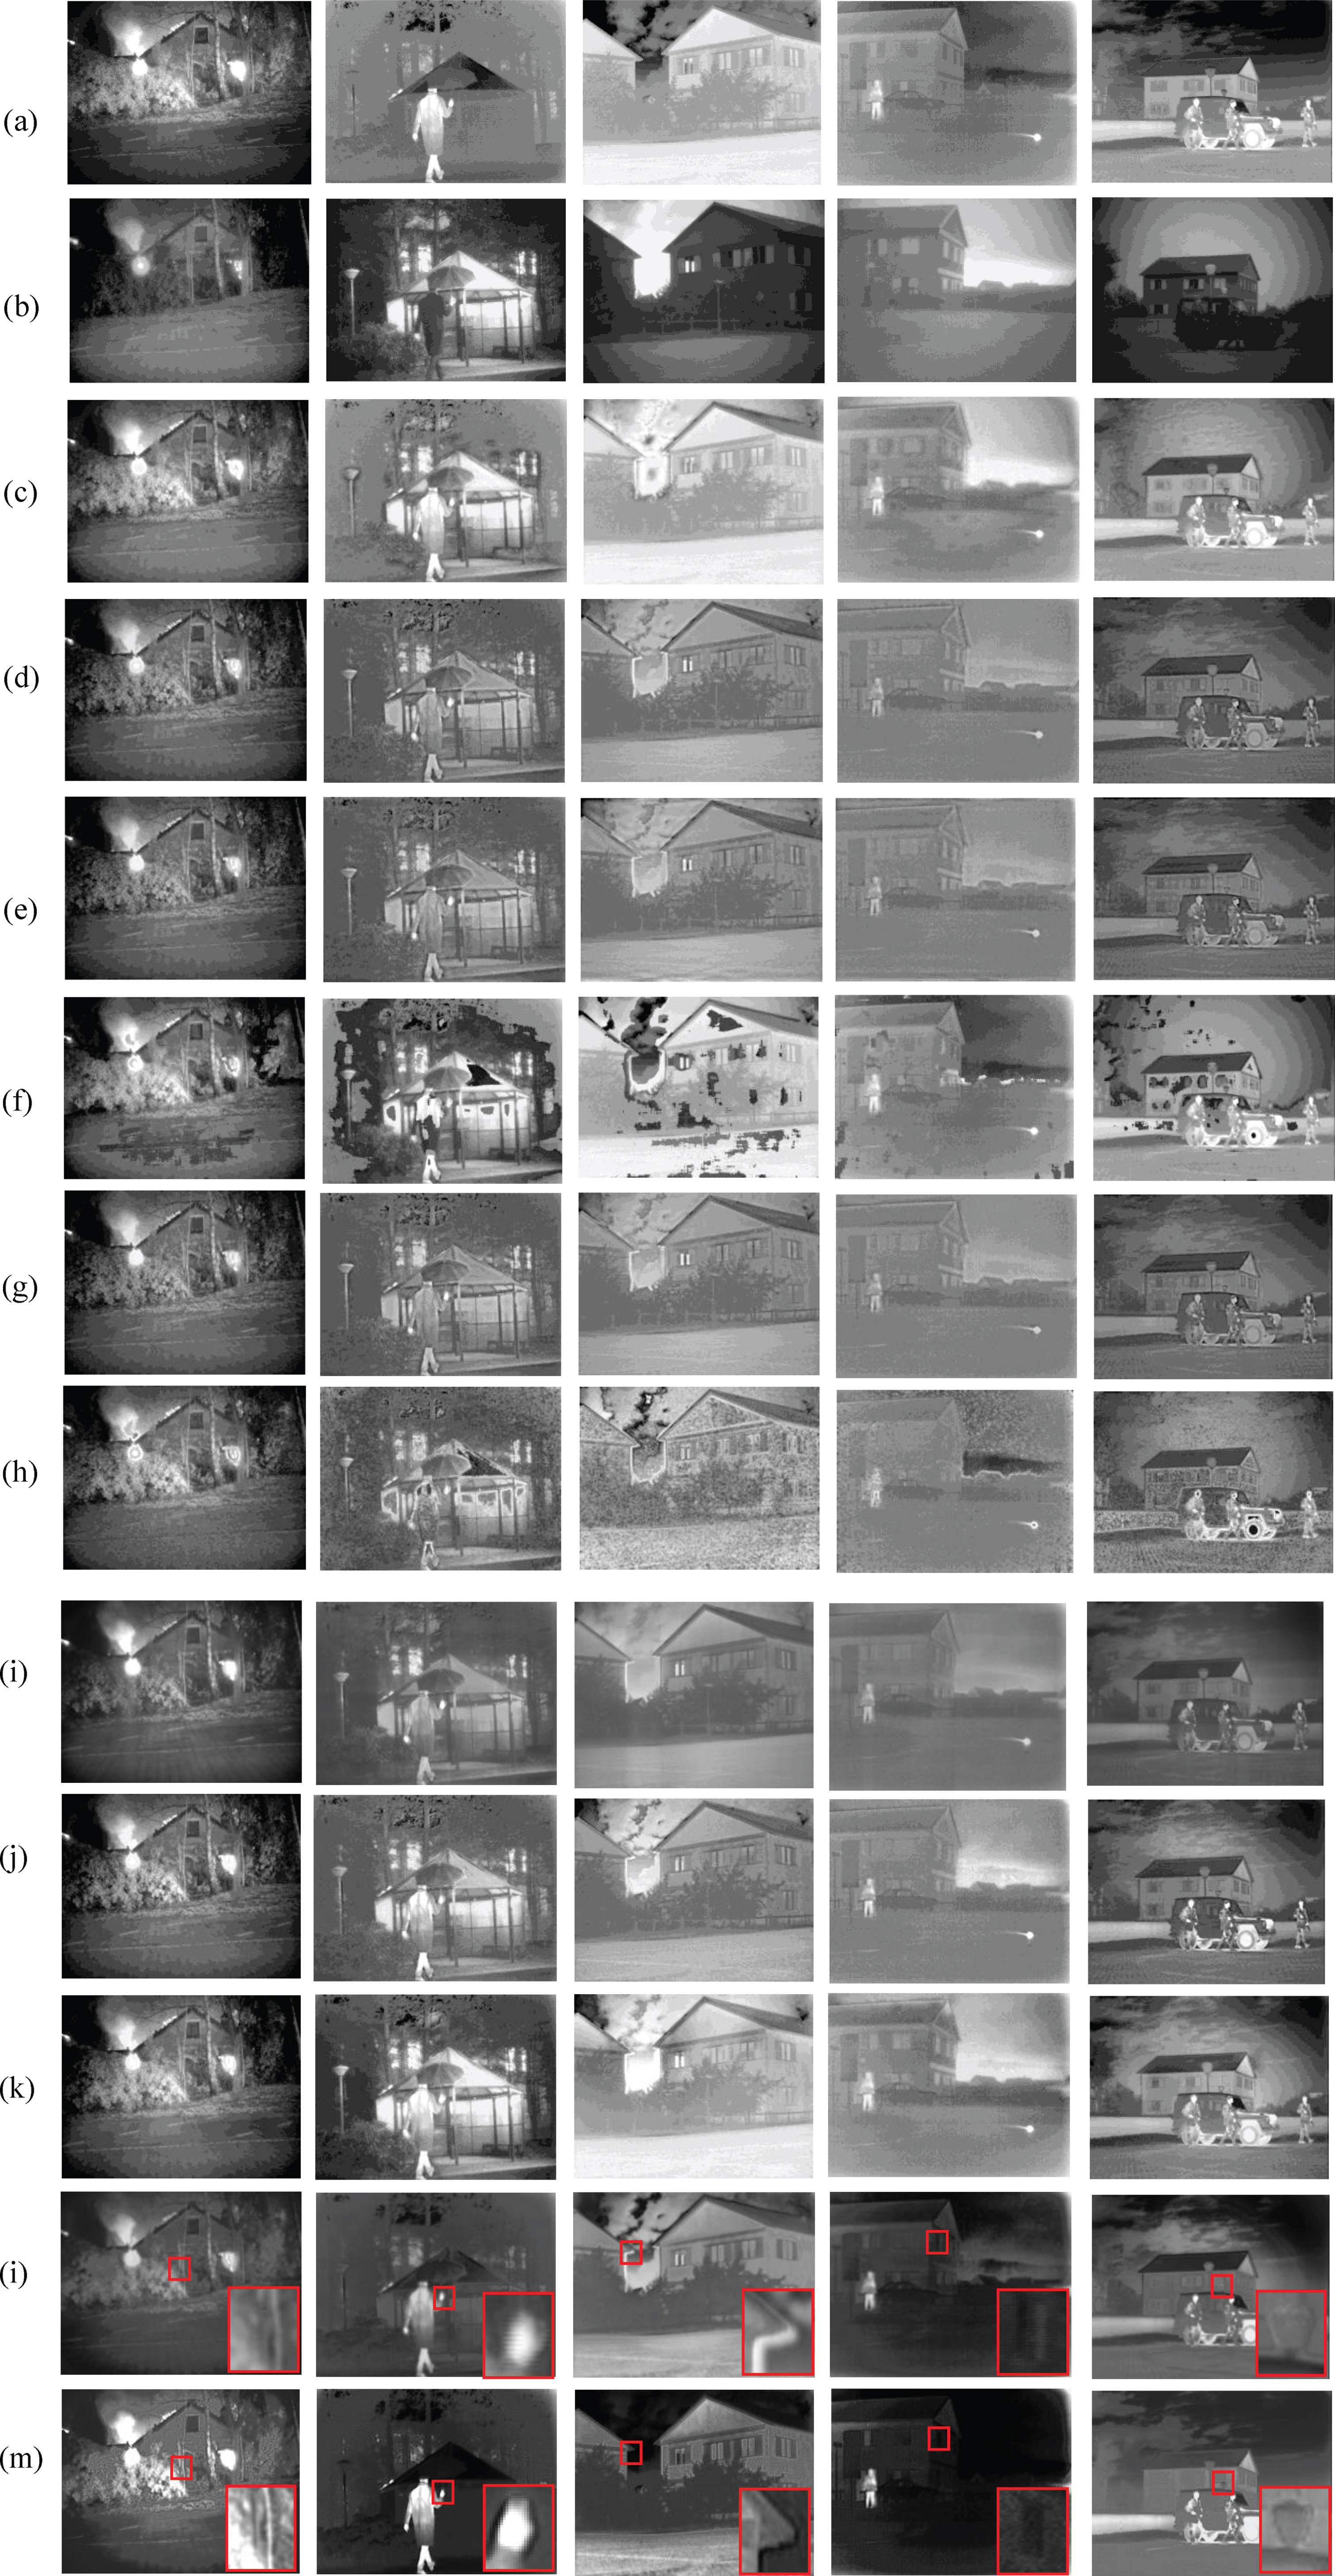
In order to further verify our algorithm, we tested our method and other ten comparison methods on INO database, and selected ten pairs of visible and IR images from each of the four videos for qualitative and quantitative comparison. Fig. 10 shows the fusion results of the four selected videos, and listed the average of ten fused results for eight metrics in Table 3.
INO fusion results. (a) IR image, (b) VIS Image, (c) NSST-PAPCNN, (d) NSCT, (e) CVT, (f) CSR, (g) DTCWT, (h) CBF, (i) LATLRR, (j) WLS, (k) CNN, (l) FGAN, (m) OURS.
The average values of 4 fused images form INO for the 8 metrics
As the result, you can see that the other ten methods all retain texture information well but lack thermal radiation information. Only our method can preserve the distribution of thermal radiation in IR images, such as the pixel intensity of human body areas, car tires and trees. Table 3 shows the quantitative comparison results of the eight indicators, among which our method still has the best EN, SSIM, QABF, SD, and SF, and the average value of these evaluation indicators is the largest among the ten comparison methods. This also demonstrates the robustness of our method. In addition, we also provide the elapsed time comparison of the different fusion methods in Table 4, CNN, ‘FusionGAN’ and Our method are pre-trained models that run on the GPU while all the other methods are performed on CPU. Each value denotes the mean of run times of a certain method on a dataset and our method can achieve comparable efficiency with the other ten methods.
Run time comparison of ten methods on the datasets from the TNO and the INO database. (unit: second)
Inspired by ‘FusionGAN’, we propose a two-layer GAN for IR and visible images fusion. The proposed method has excellent performance in terms of simultaneously retaining IR image information and visible image details information. Our experiments demonstrate that compared to ‘FusionGAN’ and other existing approaches, our fusion results can highlight salient information in the images such as potential targets more clearly. It is important for target detection and other computer vision applications. Through the quantitative comparisons also indicate that our method not only gain better visual effects, but also retain more details existing from the source images.
In future, we will optimize the structure and the loss functions of our framework so that the fused results have more texture details and target radiation information.
Footnotes
Acknowledgment
This work was supported by the National Natural Science Foundation of China under Grant 61572392 and by the National and Local Funds for New Networks and Measurement and Control Laboratories under Grant GSYSJ2017001.