
Abstract
Discovering structural, functional and evolutionary information in biological sequences have been considered as a core research area in Bioinformatics. Multiple Sequence Alignment (MSA) tries to align all sequences in a given query set to provide us ease in annotation of new sequences. Traditional methods to find the optimal alignment are computationally expensive in real time. This research presents an enhanced version of Bird Swarm Algorithm (BSA), based on bio inspired optimization. Enhanced Bird Swarm Align Algorithm (EBSAA) is proposed for multiple sequence alignment problem to determine the optimal alignment among different sequences. Twenty-one different datasets have been used in order to compare performance of EBSAA with Genetic Algorithm (GA) and Particle Swarm Align Algorithm (PSAA). The proposed technique results in better alignment as compared to GA and PSAA in most of the cases.
Keywords
Introduction
In Bioinformatics, the sequence alignment [1] is a method of ordering the sequences of protein, DNA and RNA to find similar regions of corresponding chemical bases in order to discover structural, functional and evolutionary relationships between the sequences. The resulting alignment of sequences can be used in constructing phylogenetic trees, to find out the protein families based on the similarities of sequences to predict the new sequences and their behavior of secondary and tertiary structure from which the homology of old sequences with new ones can be seen [2, 3]. Multiple Sequence Alignment (MSA) is a method of aligning more than two sequences to find out best alignment throughout the whole search space. It is demonstrated as NP-hard problem [4]. The conventional methods (i.e., dynamic programming, neighbor joining method) failed in finding the aligned sequences which provide the exact solution demonstrating best fitness among all the solutions of search space. The cause of failure is the computational cost. This research is based on bio inspired technique i.e., Bird Swarm Algorithm, proposed by Xian-Bing Meng, X.Z. Gao, Lihua Lu, Yu Liu and Hengzhen Zhang, [5]. An enhanced version EBSAA is proposed to address the MSA problem and its comparison with evolutionary based Genetic Algorithm GA [6] and swarm based Particle Swarm Algorithm [7]. The main purpose of using EBSAA is to address the limitations of previous work. There is no parameter in GA or PSAA that can control the exploration or exploitation behavior of the population explicitly in MSA. These algorithms try to reach global optimum without exploring enough search space. Due to the nature of MSA problem, it requires more parameters that can explicitly increase or decrease the exploration or exploitation behavior. There are skew and redundant sequences with different length and similarity ratio which need some explicit randomness which is incorporated by EBSAA. It allows us to contribute diversity in the overall flow of algorithm. The major contribution of this research are: An enhanced version EBSAA is proposed to address the MSA problem and is compared with the evolutionary based Genetic Algorithm GA [6] and swarm based Particle Swarm Algorithm. [7] The main purpose of using EBSAA is to address the limitations of previous work. There is no parameter in GA or PSAA that can control the exploration or exploitation behavior of the population explicitly in MSA. These algorithms try to reach global optimum without exploring enough search space. Due to the nature of MSA problem, it requires more parameters that can explicitly increase or decrease the exploration or exploitation behavior. There are skew and redundant sequences with different length and similarity ratio which need some explicit randomness which is incorporated by EBSAA. It allows us to contribute diversity in the overall flow of algorithm.
The rest of the paper is organized as follow. First, a comprehensive background and related work is presented in section II. Then, the GA, PSA and BSA are familiarized in section III. A new version of BSA, Enhanced Bird Swarm Align Algorithm (EBSAA) for MSA with formalized behavior of bird swarm is presented in section IV. Next section V presents experimental results in terms of graphs, charts and tables of different datasets. Conclusions are devised in section VI.
Background
Bioinformatics includes the study of different aspects of biology, computer science and mathematics which focused on different techniques of storing, organizing, retrieving and analyzing the biological data. [8] Bioinformatics deals with building software tools and frameworks that can deal with the data and get biological information from it. Aligning multiple sequences is one of the most important areas in bioinformatics and widely used medical research.
Multiple sequence alignment problem
Deoxyribonucleic acid (DNA), molecules and protein consist of biological sequences based on different chemical basis with different representations. DNA can be viewed as sequence of nucleotides, represented by four English alphabets
A continuous effort is needed in order to find the biological accuracy of these sequences that result in maximum sequences alignment. Later on, these are used to discover the evolutionary relations among different species, semi-independent realizations of an evolutionary process, predicting new sequence behaviors and to establish functional similarities in proteins. One sequence is transformed into another sequence by using gaps. There is a need to insert, delete or to move the gaps in sequences to find the maximum symbol matching among sequences. Gap insertion is more convenient in order to maximize similarity measure of sequences. For this purpose, a mathematical function called scoring function is used to find the scores based on similarities and dissimilarities of sequences. There are different schemes to assign penalties of gaps, matches and mismatches. Each scheme is based on a different matrix that assigns different score to every pair of symbol (based on mutation probability). Since, the process of finding an optimal solution that represents the maximum similarity matches among sequences incorporating less penalty and more scoring value is termed as Multiple Sequence Alignment MSA problem.
Substitution matrix scheme
The most widely used substitution matrix schemes are PAM (Percent Accepted Mutation) and BLOSUM (Block Amino Acid Substitution Matrix) [9]. PAM is based on punctual mutation constructed by Dayhoff in 1978 as shown in Fig. 1. PAM1 is a matrix that is constructed, based on 1% or less resembling sequences. There are three types of values i.e., positive, negative and zero value in PAM matrix. Positive value shows the mutation probability while negative value indicates the mutations which are not feasible. Zero means a perfectly random mutation. Since, the probabilities among different symbols to mutate others are different and hence the scoring of these probabilities are higher than others which have lower probability to mutate.

The PAM250 matrix. It is the mostly used PAM matrix and represents the mutation probabilities of sequences with 20% of equivalence.
In this research, scores used for protein tests are based on the BLOSUM method, obtained by aligned sequences of BLOCKS database as shown in Fig. 2. This method has been proposed by Steven Henikoff y Jorja and G. Henikoff in 1992 [10], and they derived substitution matrices from 2000 blocks of aligned sequence segments characterizing about 500 groups of proteins.

The BLOSUM62 matrix.
BLOSUM has different versions as BLOSUM45, BLOSUM62 and BLOSUM80 which indicate same percentages of sequences. BLOSUM45 indicates 45% of sequences identity, and similarly 62% for BLOSUM62 and 80% for BLOSUM80 respectively. To calculate mutation probability, these similar sequences are grouped and constructed with the probability expected from random number. A BLOSUM matrix with 62% sequence identity is used which is neither very high i.e., 80% nor very low i.e., 45% sequence similarity.
The sequences obtained from proteins and DNAs are not aligned and have different number of chemical bases that are represented by English alphabets. When these alphabets are combined, they result in different lengths of sequences. Therefore, there is a need to insert gaps in the sequences. These gaps are then shuffled in the sequence either one by one or together in the blocks to align the same residues. The goal is to find the maximum number of symbols aligned among all the sequences. In two sequences alignment problem, optimal alignment sequence is quite simple. An exact solution can easily found using dynamic programming paradigm. The problem arises when there are more than two sequences as time taken by dynamic programming grows exponentially in this case. In case of two alignments, there are many algorithms that can efficiently solve the two sequence alignment problem with minimum usage of memory and computation cost. Aligning multiple sequences is computationally complex problem as it has exponential number of combinations in order to find optimal solution [11].
Residues in the sequences must preserve their positions and they do not change their locations in the sequence. For example, a sequence
The progressive approach uses two most similar sequences to construct the optimal alignment and then progressively approach towards best solution by adding rest of the sequences one by one in the solution. There are possibilities to get trapped into local optima because of the absence of sequence rank that determines which sequence should be most appropriate to add in solution. CLUSTAL W [12], where W stands for weight is the most common tool that has been used and is based on progressive approach. It is a three step process including pairwise alignment construction, building guide tree and progress the alignment, guided by the tree.
Scoring function based approaches help to find optimal solution by ranking using highest rank priority. These techniques helped to resolve local optima problem but are computationally expensive approaches. Some existing sequence alignment methods and techniques with their pros and cons are highlighted in Table 1.
Pros and cons of some existing techniques used for solving multiple sequence alignment problem
Pros and cons of some existing techniques used for solving multiple sequence alignment problem
Beside above-mentioned techniques, some methods are in combined/hybrid form and gives better results. For instance, Hidden Markov model based alignment techniques are also used which use progressive approach that combines both consistency-based and probabilistic modeling techniques. Due to this combination, the results of this approach improved as compared to other consistent methods. Similarly, MSAprob method produces sequences that are based on pairwise posterior probability matrix which is constructed using pair-HMM [32] and partition function and calculates the matrix using Backward and Forward algorithms. Pruning techniques are also used to reduce the search space by simply prune the least fit solutions. Some divide and conquer algorithms [33] divide the sequences using optimal cut, solve the subproblems by aligning the sequences separately and then join these small parts to produce the final Multiple Aligned Sequences MSA [34]. Carrillo-Lipman bound [35] technique is a familiar way to determine the constraints of resultant optimal multiple alignment.
Evolutionary computation revolutionized the field of computer science by providing efficient and near-optimal solutions for large scale, complex, exponential and multi-dimensional problems. It starts with a random solution of problem in search space which usually encoded in form of string called chromosomes. Each chromosome has its objective function also known as fitness function which is used to evaluate the fitness according to the required criteria. A population is a collection of chromosomes. The chromosomes which are more fit are chosen for next iteration and inserted in population. Low fitness chromosomes are removed from the population in each iteration. Crossover and Mutation are used as genetic operators to explore and exploit the search space. Parent selection method is used to select the new parents in next population formation. This process iteratively continued until termination criteria is reached. The Genetic Algorithm (GA) is based on population size, crossover, mutation rate and elitism. Elitism determines how many chromosomes from the current population are eligible to take part in next population. There are a lot of GA versions which are used to solve MSA problem including SAGA [36], GLOCSA [37], GLOCSA-GGA, VDGA [38], GAPAM [39], RBT-GA [40], MSA-GA [41] and many more.
Nature inspired swarm-based algorithms have also been used excessively in order to solve MSA problem. Most famous algorithm from this family is Particle Swarm Optimization PSO algorithm which is based on the social behavior of the bird flocks or fish schools. Every particle in the swarm try to optimize its own position as well as the position in the whole swarm based on their speed.
A swarm intelligence based particle swarm align algorithm (PSAA) for MSA has been used in several different ways [42–45] in order to find optimal solution. Ant colony optimization ACO [46], Fish Swarm Algorithm FSO [47] and several more algorithms are used to solve MSA problem [48–50].
In this article, a new version of Bird Swarm Algorithm (BSA) i.e., Enhanced Bird Swarm Align Algorithm (EBSAA), is proposed to solve the MSA problem. Before going into the details of EBSAA, a brief introduction of BSA is presented.
Bird Swarm Algorithm BSA
A generic outline of BSA [5] algorithm is shown in Table 2. Bird Swarm Algorithm (BSA) is proposed by Xian-Bing Meng et al in 2015 and is inspired by the natural behavior of birds. Some rules are observed in the swarm of birds on which the behavior of whole swarm depends. Each bird can have two types of behaviors in swarm, either it can forage or keep vigilance behavior. Both of these are stochastic behaviors in nature.
Bird swarm algorithm
Bird swarm algorithm
Each bird can prompt its best previous experience and the swarm’s best experience about food during foraging. Social information is shared among whole swarm. This behavior is same as in Particle Swarm Algorithm in which each bird maintains its previous position and try to move towards the global best of swarm to achieve maximum fitness. In vigilance situation, each bird tries to move towards the center of swarm as it is the safest place in the whole swarm. This behavior can be effected by the interference induced by the competition among swarm. More likely, birds with higher reserves (high fitness value) should have higher chance to move towards the center of swarm while those with low fitness values should have lower chance to move towards the center. Birds can move from one place to another after some interval which indicates the switch of search space after several iterations. While flying, birds may behave like producing or scrounging. The birds with highest reserves should become producers while lower reserves should become scroungers. The birds with mixed value between high and low will randomly select between producers or scroungers. Producers will always search for food while scroungers will randomly follow the producer or search the food. When termination criteria is met and solution does not improve further after several iterations, the best bird will become the solution as final output.
Enhanced Bird Swarm Align Algorithm (EBSAA) is proposed to solve multiple sequence alignment problem. It is an optimization problem where fitness value is considered as score. The main objective of EBSAA is to maximize the scoring function to find the optimal value of the alignment. In the proposed algorithm, a bird represents a sequence alignment.
There are three types of behavior of birds. Birds will forage based on their experience, and update their best value with tendency to move towards global best. Birds may show vigilance behavior and try to move towards the center of the swarm. Birds that have high reserves will get higher chances to move towards center and vice versa. Birds may be producers or scroungers. Producers move towards optimization while scroungers either follow producers or forage. EBSAA does not contain scrounger behavior, instead it just changes the position and initiate foraging in new search space position. The pseudo code of EBSAA is represented in Table 3.
Bird swarm algorithm
Bird swarm algorithm
The algorithm terminates when reaching at maximum number of iterations or after achieving the required score that cannot be further improved after several iterations.
Population is a set of birds that are spread over the whole search space. These birds will try to score best while foraging based on their previous experience and the experience of gbest. Birds can exhibit vigilant behavior and in this case they try to move towards the center of the swarm and find safest positions where their survival chances are comparatively high. The chance of moving towards the center of the swarm is based on score. If a score of a bird is better, it indicates higher experience, and results in the higher chance of that bird to move in the center of swarm. Similarly, birds behave as producers based on their high experience (score value) in case of switching the land by flight and by changing the search space.
Implementation details are discussed below to elaborate the steps (initialization, data representation, scoring function calculation etc.) of EBSAA.
A bird swarm consists of number of birds {0 < i< N} and each bird has some experience ‘e’ {0 < e< max} where max is the maximum experience a bird can achieve. A bird ‘i’ with experience e is e i = max is nominated as the leader (gbest) due to maximum experience. The experience of each bird changes and there is a need to store these experiences to track the best experience {best (ei)} for each bird in the search space (local best). In the proposed algorithm, a single bird represents a sequence alignment with ‘n’ sequences in it. This alignment is represented as set of vectors ‘V’ where set V is represented as V={v1 U v2 ... U v n }. Each vector represents location of gaps with size ‘s’ and maximum allowed gaps in a single sequence are not greater than ‘s’. The ‘s’ can be different for each sequence. Therefore, a set of n sequences to be aligned corresponds to an n-dimensional search space. According to the problem, it is not necessary to store whole alignment with alphabets because there is no need to use extra memory for it. Only the position of gaps to be inserted are stored as bird with ‘n’ vectors and ‘s’ gaps in them. In this way, a bird represented by set of vectors that represents the locations where the gaps are added. An example can be viewed in this representation: Suppose we have following bird alignment:
The whole population will initialize with this alignment and the gaps that are added randomly in this bird makes each generated bird different from each other due to different randomly generated alignments. Note that, first sequence has length 7, second has length 5 and third one has length 6. Now each sequence will have different number of gaps to get a same length alignment. If we add 2 gaps in second sequence and one gap in third sequence, then all sequence will have same length 7. To add some diversity, we need to add more gaps in the alignment because it will create exploration and more chances to get optimal alignment. If number of gaps is very large, it will take lot of computation to align the sequences that results in more time. The best approach is to take medium number of gaps so that exploration and exploitation both can be achieved easily. In our example, we set the length of each sequence in the alignment to 9 which indicates two gaps in sequence one, four gaps in sequence two and three gaps in sequence three. To get the position of gaps, generate random number each time between 1 and the length (9 in this case) which tells us the position at where the gaps will be inserted.
For two birds, randomly generated gap positions are shown and bird one represents the leader:
These birds indicate that there is a gap after 2nd and 5th location in the first sequence of first bird of given alignment. The second sequence contains gaps at 2nd, 3rd, 5th and 6th position while third sequence has gaps at 1st, 4th and 5th location as shown below:
Initialization of Bird population
The user defines size of the population i.e., number of birds that we should have in order to initialize the swarm. Moreover, length of an alignment that has a minimum value given by the length of the largest sequence, and a maximum length is given for an instance, as twice the length of the largest sequence.
The solutions are initialized randomly by inserting the gaps in input sequences randomly. A percentage gap parameter with 15% gap penalty is used that determines percentage of gaps that is required to be inserted to pad all the sequences in the same length. If the gap penalty becomes very high, the processing time and fitness of the solution will disturb. A very large percentage of gap penalty results in unnecessary large size of search space. If the gap penalty is very small, the necessary gaps are omitted and results in the disturbance of exploration. This may result in exploitation of search space. This gap percentage is added to the sequence that is the longest in length. These randomly inserted gaps transform all the alignments in equal length. The generated swarm contains birds equal to the given population size.
In initialization phase, each bird in the population is provided with the survival chance that is represented by its fitness. If the fitness value of initially generated bird is high, its chance of being survived are higher. In case of very low fitness, a certain threshold for a bird is maintained in the form of some probability of being selected. Moreover, a best bird (bird with highest fitness) is identified from the beginning which essentially move in the next generation to make sure that the score of the population will not drop in the new generation.
Scoring function
The score of a bird represents its fitness and generated by calculating the fitness of all combinations of sequences. For example, in Fig. 3, if sequence is S={s1, s2, s3}, then the global alignment score is sum of the score of s1, s2 plus s2, s3 plus s1, s3 as shown in Fig. 4. In case of protein, the combination of alphabets obtained by BLOSUM62 are used to identify the fitness while in case of DNA, appropriate scores are set as match (AA)=1, mismatch (AG)=-1, gap at either position with alphabet (-A or A-)=-2. If both are gaps, it will be zero.
Distance measure
In EBSAA, there is a need to measure the distance while bird is foraging or vigilance in order to move towards center. To maximize the experience of each bird in the swarm, its distance is calculated with the global best. The distance is measured as the proportion of gaps that does not match in sequences. 100% mismatch indicates the maximum distance between a bird individual and its leader global best which interprets that the foraging bird has zero experience of food search. Distance measure can be formulated as:
Distance = matchedgaps/totalgaps (I)
Moreover, two gaps will be matched when they are at same corresponding positions in the individual birds. Otherwise, it will be considered as mismatch. For example, consider the birds of Fig. 6.

An alignment with 3 sequences.

Random locations of gaps form a bird. Bird one represents the leader bird.

Two individuals after random gap insertion.

Gaps at identical positions are bold.
In this example, the highlighted digits at corresponding position shows that they match, which means that the birds are close to each other. If all the places match to each other, it means that the birds are identical and their distance is zero. How far these birds are from the global best can be calculated by equation (I). There are total of 18 gaps as shown in Fig. 5 in this example i.e., 9 in each bird.
The matches are highlighted i.e., 5 + 5 = 10. As per formula, out of total 18 gaps, 10 of them are matched to each other. The distance that is calculated by mismatches gives us d = 18 - 10 / 18 = 0.44. A bird with distance of 0.44 from global best indicates that it has tendency to move towards global best and currently away by 0.44 units. The important thing to note is the value of 4 that is present in both sequences but not considered as distance because it does not lie in the same position of same vector (sequence).
In this behavior, each bird wants to move towards the center of the swarm. Therefore, an average score of the swarm is calculated. The bird with score equals to the average score of swarm or nearest to it, is considered as a leader. For example, if there are three birds and bird a = 2, bird b = 6 and bird c = 9, then the average value is 5.66. The distance of each bird from 5.66 is 3.66, 0.44 and 3.44 respectively which results in bird ‘b’ is selected as a centered point and now the distance of every other particle is calculated with ‘b’. Although, it does not have highest score but it is more centralized in the bird swarm. Each particle will move towards it to make it more secure from outside. This behavior performs more exploitation in search space in order to find more average solutions.
The optimal solution with highest score is not selected in vigilance behavior because the highest score may exploit the population that results in the same behavior as in PSAA. In contrast, the lowest score disturbs the fitness of the bird in swarm. The most reliable and safest place for a bird in the swarm is not the edge (highest or lowest) value. It is the center that is more secure from the outside. The average value of the vigilance behavior is therefore used for maintaining a balance between exploration and exploitation.
Flight behavior and producers
A parameter is used in order to set the frequency (FQ) of swarm. This indicates the flight behavior of the swarm. If flight rate is high, bird swarm will stay less at same position and switch its positions from one place to another. This flight behavior helps to explore more search space and reduces the chance of trapping in local minima. When move to the next place, the birds start foraging food again based on their previous experience. Switching the search space is formulated as the addition of some random value multiply by original current position of bird swarm in original experience of bird in order to explore more search space. Then, normalize the values in order to make it between 0 and 1 which is the range of bird swarm. The birds that have experience, start foraging in order to gain more experience. The flight behavior can come several times usually after 3 or 5 iterations which indicates its importance in order to explore more solutions and gap combinations to get more exploration.
Operators
In traditional bird swarm algorithm, each bird can either move towards (g-best), or to the center or to switch the search space. In first case, it moves towards the (g-best) and does not explore the search space to get more exploration. In this case, it can miss the solution which may have best fitness value but cannot explore due to less exploration capacity. In traditional Particle Swarm Align Algorithm PSAA, a particle moves towards the global best only.
In EBSAA, moving in the center, makes search space congested and attracts each bird in the center. This results in some exploitation of solutions because they started converging towards the center of swarm. To handle this exploitation, producer behavior is added which shifts the swarm to other places in search space. After number of iterations, search space is explored but results in another problem i.e., there are lesser chances for newly generated solutions to explore the whole search space due to the nature of the solutions. The generated solutions improve themselves in a small number of iterations and even they explore their best possible combination. It demands to change the solution by shuffling the gaps. To overcome this problem, a similar operator of crossover from Genetic Algorithm (GA) is used. The EBSAA uses one-point crossover in which a random point is selected for cross over and two new children are generated. One-point crossover helps to mix the best part of different alignments. Due to the different sizes of alignments, the insertion of gaps in the sequence is more comfortable and efficient by using single point crossover as shown in Fig. 7. Due to the diversity of the problem, the gaps are inserted at start, in middle and at the end of the sequences. Furthermore, splitting of alignments creates new gaps. In case of using any other crossover operator, the management of gaps becomes very tedious and chances of getting well aligned children becomes very low. In that scenario, there is a need of using crossover again and again until it gets new alignments with better fitness. During this process, creation of new gaps needs to maintain the alignments of the sequences. To overcome this problem, a single point crossover is used that selects a random cut point several times to ensure that the fitness of generated children becomes probably high.
A segment form leader is replaced with the segment of particle. This replacement is achieved by removing from the particle, the gaps that are in the segment, and then adding the gaps from the segment of the leader.
For example, if crossover point in above example is 6, it means that the new particles as shown in Fig. 8 will be generated as:
There are equal chances of either increasing or decreasing the length of sequences. For example, the fifth position of leader particle has no chemical base which indicates that if this whole position will be deleted, it will have no impact on the sequence. So it will be deleted and new resultant sequences as shown in Fig. 9 are given as:
Since the distance between the bird one and bird two is 0.44 and the length of each bird individual now becomes 8. So the crossover point will be in between 1 and 0.44*8 = 3. This clearly indicates that due to high value of score, now the need is to explore more solutions for other combinations. So it is crossover of the major part of bird (greater length of bird individual) with minor (lesser part of best bird individual) of (gbest). Same is the case when crossover will happen with the average part. If the crossover point is too small, the algorithm will start to explore more solutions in work space.
Finally, if the distance between (gbest) and the bird will be greater than 0.5, the large part of (gbest) will be used in crossover. Same is the case with average value. The producers will switch the work space by adding some random value in the current place. In the result of crossover, after several iterations, there are chances for the algorithm to trap in local minima and to tackle this EBSAA uses gap insertion, gap deletion, gap column deletion and gap shuffling in order to inject diversity in the solution. If the sequence length increases from the original one, insert gaps at the end of the sequence to make all sequences align. Otherwise, delete some gaps to align the solution.
Experiment results
The proposed algorithm EBSAA is implemented in order to test its performance on twenty-one different datasets with one test dataset.
Datasets
The datasets consist of different protein and DNA alignments that are discussed in the detail in Table 5 are represented in encoded form. From the total of 21 datasets, five of them consist of DNA sequences including Mickey Mouse (test sequence), MYH16 [51], beta globin [52], HIV [53] and BRCA1 [54] sequences. Rest of them consists of protein sequences including samples from BaliBase [55] benchmark, GAG and PAL sets of HIV/SIV (Viral CDS) [56], PDGH (Platelet-Derived Growth Harmone) sequences and SKEW (test) sequences and all of these have different length and similarity percentage [57].
Parameter settings for GA, PSAA and EBSAA
Parameter settings for GA, PSAA and EBSAA
Results of 21 different datasets. Each value is the average of 10 runs
All the datasets of protein are publicly available at [55] which have properties that are bit complex for computation of MSA and Phylogenetic Tree and intended to benchmark the accuracy and performance for new MSA techniques. The sequences taken from [55] datasets are grouped into normal equidistant (BaliBase11001), highly divergent (BaliBase30020), related subsets, internal insertions (BaliBase50001) and terminal extension scenarios to meet the criteria of real-world scenario.
GA, PSAA and EBSAA are compared on same datasets. The parameter settings for the three algorithms are given in Table 4. The foraging probability and the foraging behavior are used by EBSAA only. These values are obtained after excessive experimentation.
Experimental details
All the datasets are run on GA, PSAA and EBSAA as detailed in Table 4. There are five DNA sequences and 16 protein sequence. In DNA sequence only 4 based (A, T, C, G) are used while in protein sequence, 21 amino acid bases are used. Number of sequences for each dataset are in range of 4-10. Less than that results in maximum fitness value even on static algorithms. Some of the datasets are tested to check the performance on the skewed sequences. Due to diversity of the results, average of 10 runs has been considered. Above four algorithms are compared, in order to test the performances to results. Experimental findings show that in some of the cases the results of all these algorithms are equal. In some case, EBSAA with optimized parameters shows better results. The machine used in this experiment is core i7 with 2.6 GHz clock speed, 8GB DDR3 RAM and 64 bit windows 8.1 operating system.
Discussion and analysis
For small population size with small number of unchanged rounds, PSAA and EBSAA could not explore the search space well and hence the performance obtained could not result in optimal fitness value as in shown in Fig. 10. In Fig. 11, the population size increases to a particular extant, but the algorithm terminates very soon and the results are bit improved due the diversity addition by increasing population size. When number of rounds are increases, the probability of exploration increases as shown in Fig. 12 but the significant improvements can be seen in Fig. 13 where the population size increased by 4 times. In this case, EBSAA experienced more exploration and tried to visit a bigger area of search space. The high value of foraging probability controlled the over-exploration and provided exploitation in that case.

One-point crossover at 6th location.

Generated children from crossover.

Child one after deletion of column gap.
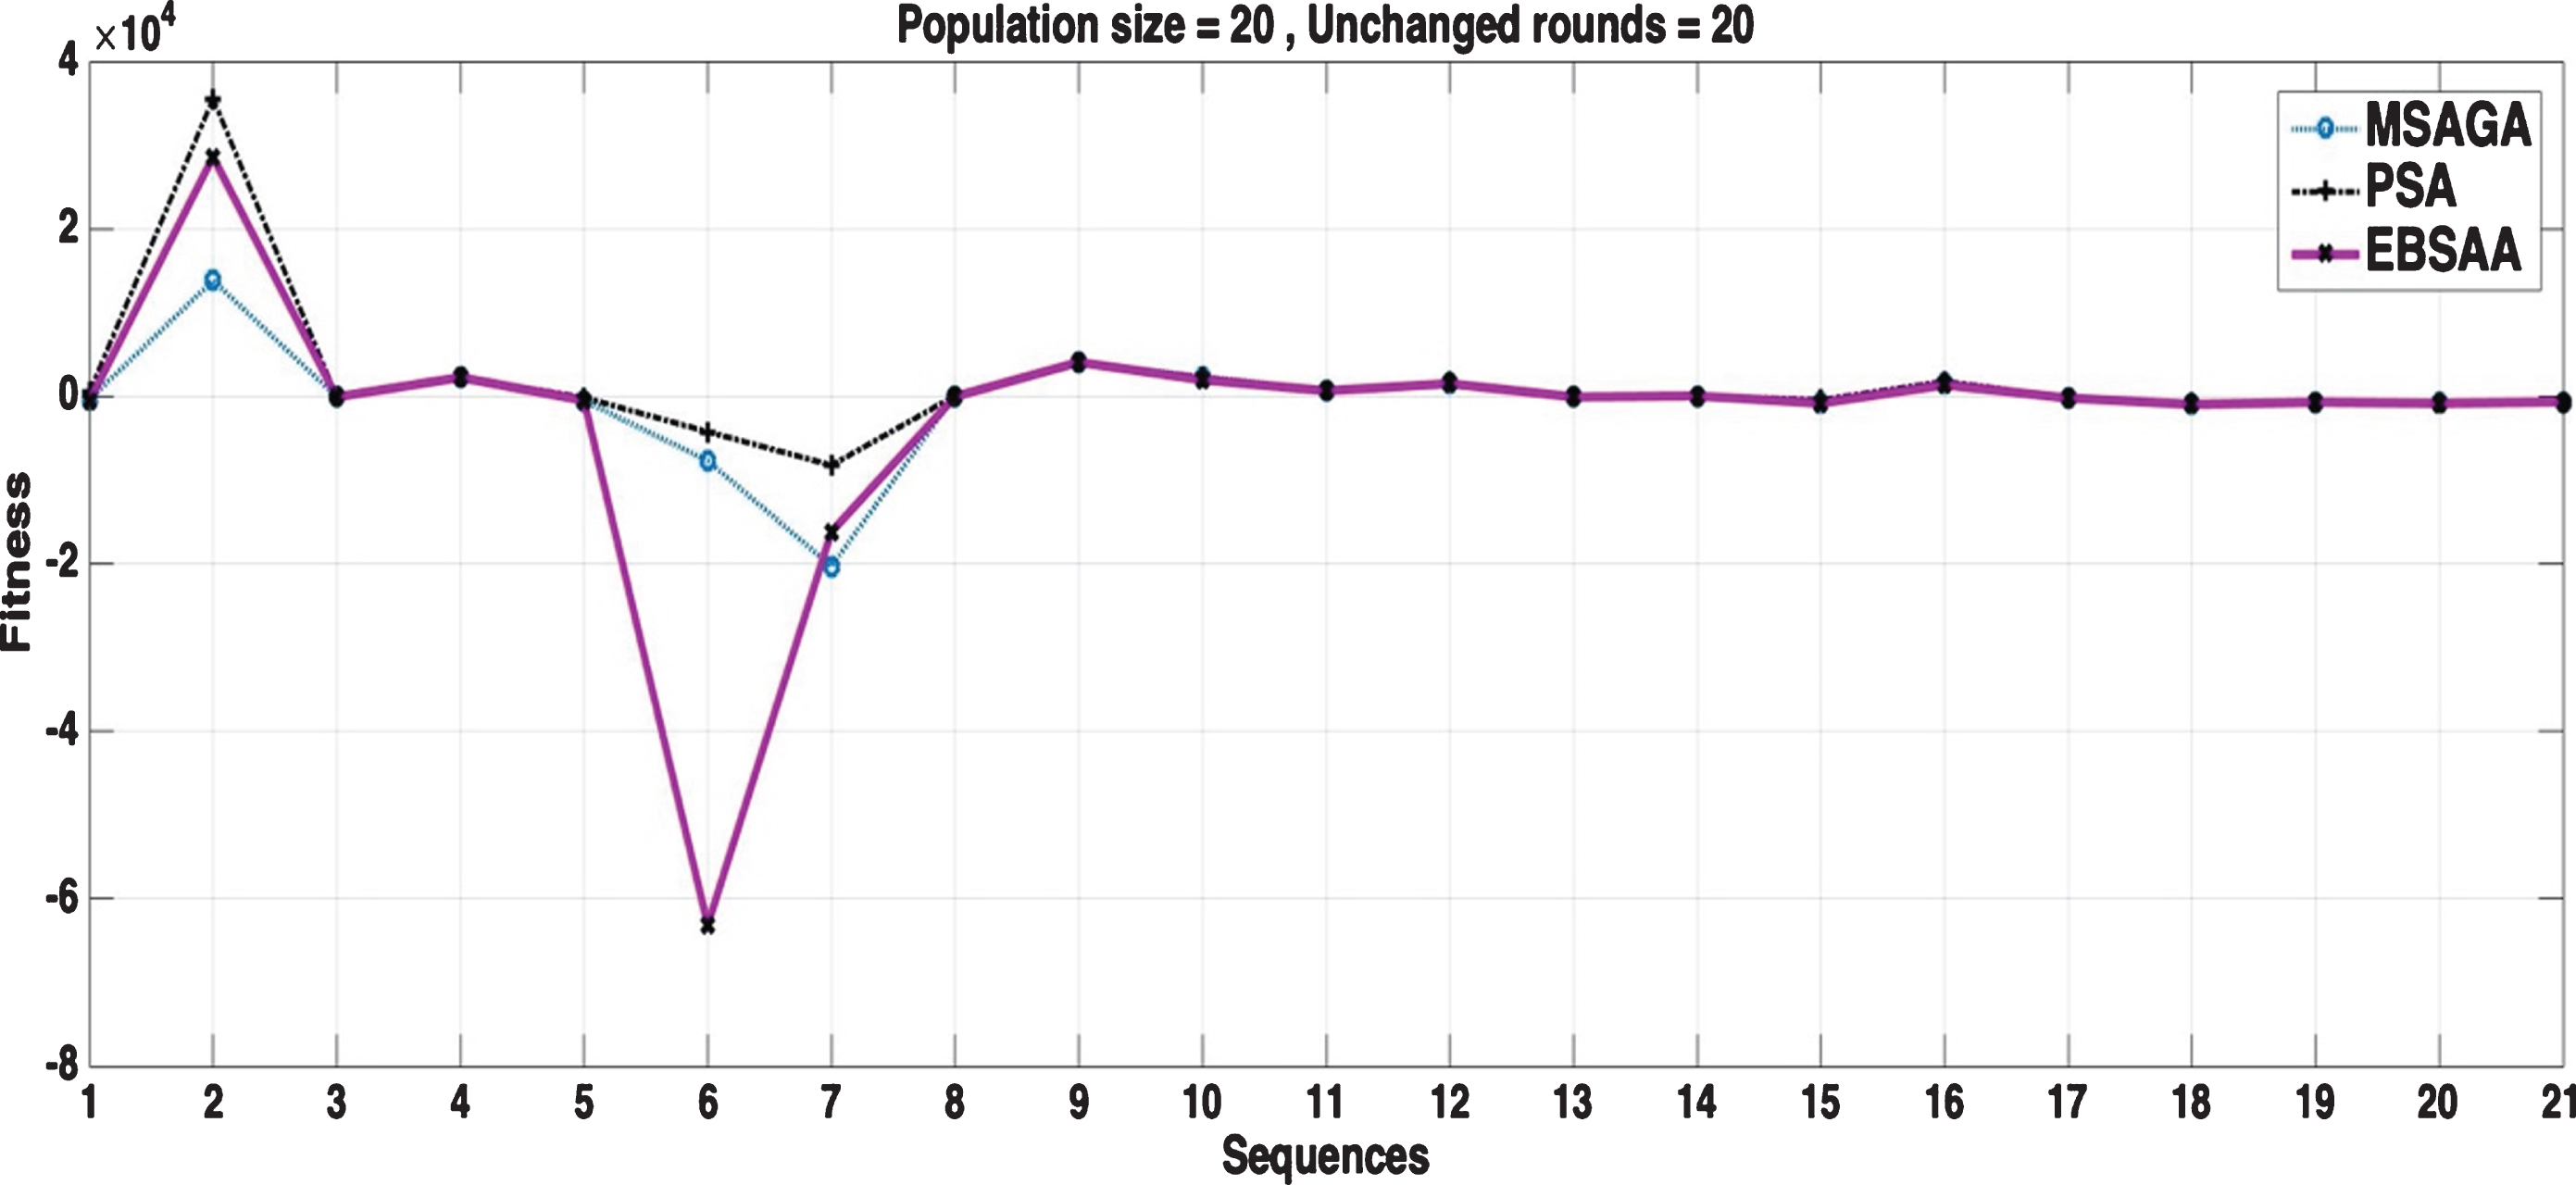
Fitness value of the algorithms for datasets with pop size = 20 and stop after 20 unchanged rounds.

Fitness value of the algorithms for datasets with pop size = 100 and stop after 20 unchanged rounds.

Fitness value of the algorithms for datasets with pop size = 100 and stop after 50 unchanged rounds.

Fitness value of the algorithms for datasets with pop size = 400 and stop after 50 unchanged rounds.
After experimenting medium population size (250 in Fig. 14) with 100 unchanged rounds, the exploration behavior reflected back and the performance of EBSAA disturbs. In this case, PSAA exploits and reach to the maximum very soon. After increasing unchanged round to 1000 and 10000 (in Figs. 15 and 16), EBSAA explores the more search space and start performing better than GA and PSAA.

Fitness value of the algorithms for datasets with pop size = 250 and stop after 100 unchanged rounds.

Fitness value of the algorithms for datasets with pop size = 250 and stop after 1000 unchanged rounds.

Fitness value of the algorithms for datasets with pop size = 250 and stop after 10000 unchanged rounds.
For small length of sequences, MSAGA, PSAA and EBSAA produce almost same solution due to smaller search space. When unchanged rounds are very large, all three algorithms successfully explore the best solution. For medium length DNA and protein sequences, the improvement in EBSAA is far significant than PSAA and MSAGA. The external factors i.e., foraging probability and flight behavior of a bird in EBSAA have played a significant role and provide more exploration. For lesser number of unchanged rounds, the exploration expands in the search space and a less fit bird is obtained as a final solution. When unchanged rounds are increased, the chance of getting more fit solutions increase and better solutions are achieved.
The datasets with large length exhibit significant changes when population size and unchanged rounds are increased. Amino Acid Test 1 & 2 sequences improved the results with more exploration. EBSAA explored and improved fitness values when number of unchanged rounds become very large and results in more fit solutions. Same is the case with DNA HIV and BRCA1 sequences in which the sequences are very long. For 10000 unchanged rounds, a significant change can be observed in the fitness score due to more exploration. DNA beta globin sequences showed significant changes in score when population size and unchanged rounds are increased.
In this study, a swarm intelligence based Enhanced Bird Swarm Align Algorithm (EBSAA) is presented for MSA problem. Genetic algorithm (GA) and Particle Swarm Align Algorithm (PSAA) are compared in terms of their performance on different datasets. Average of 10 runs is used due to diversity of results. For small dataset problems, GA performs better than PSA and EBSAA. For medium size datasets, performance of PSAA competes with EBSAA but EBSAA gives overall better average output. In most of the cases, the maximum value is achieved by EBSAA. Finally, when number of iterations are limitless, the performance of EBSAA outperforms GA and PSAA based approaches.