
Abstract
Housing affordability is an important issue and can be measured by an increasing number of indicators. Different urban settings may lead to different housing affordability criteria. This study incorporates the third-generation prospect theory and improved VIKOR method to construct a novel, comprehensive evaluation model for assessing housing affordability. The housing price to income and rent to income ratios were chosen as evaluation indicators, and the yearly median value of each indicator was taken as a dynamic reference point. The housing affordability indicators’ realistic prospect value matrix for large- and medium-sized Chinese cities were obtained for the study period’s duration. The comprehensive housing affordability prospect values were ranked using the improved VIKOR with entropy weight method. The novel proposed approach’s rationality and effectiveness were examined by comparing the original and prospect values, performing sensitivity analysis on the prospect value parameters, contrasting the ordinary and improved VIKOR methods, and comparing the proposed approach with the TOPSIS method. The results demonstrate that the proposed method can consider the decision maker’s psychological factors, endow housing affordability evaluation criteria with dynamic characteristics, overcome the problem of order reversal, and ensure the optimal compromise solution. Therefore, the proposed approach is suitable for housing affordability evaluation.
Keywords
Introduction
Urban economic development and the operation of the labor market are affected by housing affordability. People usually choose where they work and live based on whether the housing is affordable. However, according to the housing policy report of the Third United Nations Conference on Housing and Sustainable Urban Development, the unaffordable housing crisis, which includes high rent burdens, has become a major issue in developed and developing countries [1, 2]. A chronic shortage of affordable housing dampens the competitiveness and growth of a metropolitan area. It also contributes to the relatively poor housing quality or longer, more costly commutes borne by people in those areas [3]. Households that struggle with housing payments are more likely to suffer from adverse outcomes in health, education, and employment [4]. The Global Financial Crisis brought renewed attention to the increasing unaffordability of housing in many countries [5]. The COVID-19 pandemic heightened the focus on housing affordability because of its close relationship with public health [6].
While housing affordability has been an important issue for local governments and the public [7], accurately measuring it is exceedingly difficult and controversial [8]. Housing affordability has broad connotations and is influenced by a myriad of factors [9, 10]. Early measurement of housing affordability was grounded in the cost of living, the new urban affordability measures increasingly need to be multidimensional. The US Department of Housing and Urban Development (HUD) takes housing and ‘transportation’ costs into the Location Affordability Index. OECD states that subjective well-being can bring additional information not captured by standard objective housing affordability measures [11]. However, each indicator can only measure one aspect of housing affordability, and different indicators will lead to incompatible composite measures of housing affordability. Furthermore, housing affordability is very regional. This means that different countries, regions, and cities have different criteria for determining the boundary values of their housing affordability factors [12]. For example, it may be inappropriate to use an internationally accepted criterion of price to income ratio (PIR), to measure housing affordability in China.
To this end, the study proposes a new multiple-criteria decision-making (MCDM) approach to evaluate housing affordability. This novel approach integrates VIKOR with entropy weight and prospect theory. The third-generation prospect theory is incorporated into the calculation of housing affordability prospect values instead of the original prospect theory. The resulting, integrated prospect value considers the psychological factors regarding housing affordability from the viewpoint of the decision maker. Additionally, multiple reference points endow the housing affordability evaluation criteria in different periods and regions with dynamic characteristics. The entropy weighting method solves the problem inherent to subjective or equal weights and overcomes the problem of order reversal caused by changing the evaluation dataset. The VIKOR method’s rankings ensure that the optimal compromise solution is chosen for the housing affordability evaluation, making it easier for decision makers to resolve conflicts between housing affordability indicators.
To substantiate the significance of the novel methodology, a comparison of it and related methods was conducted using actual data and indicators. The evaluation results demonstrate the advantages of the proposed method. The most significant advantage is that the proposed method produces results that are more likely to reflect reality. The results can provide a reference for policy formulation and management practices and assist the developer and consumer choices.
The rest of this paper is organized as follows. Section 2 provides a review of some background information and related works. The housing affordability evaluation problem is defined as an MCDM problem in Section 3. The section also introduces the third-generation prospect theory and improved entropy-weighted VIKOR method (i.e., improved VIKOR), which are used in the evaluation model. In Section 4, the evaluation results of 35 large- and medium-sized cities obtained by the novel proposed approach are discussed via sensitivity and comparative analyses. Section 5 discusses the conclusions and future prospective research work.
Literature review
First, housing affordability evaluation are re-viewed. Next, the MCDM and VIKTOR methods are briefly discussed, the improved VIKOR method is explained. Finally, the prospect theory is discussed.
Housing affordability evaluation
Because of the diversity of indicators, some scholars have begun to use Multiple Criteria Decision Making (MCDM) to evaluate the housing affordability. Mulliner think that measurement of affordability should consider social and environmental issues, such as housing quality, location, and access to ser-vices and facilities [13]. Mulliner et al. [14] not only assess the affordability of different housing locations, but also contrast the resulting rankings of six different MCDM approaches in Liverpool, England. Said et al. assessed sustainable housing affordability of six areas in Sabah, a state of Malaysia, based on COPRAS method [15]. Haidar & Bahammam, developed a theoretical model for affordability and sustainability of housing [16].
Their work demonstrated that MCDM can effectively analyze the housing affordability problem. However, there exist many noncomprehensive, potentially conflicting housing affordability indicators that are relevant to a particular region. It may be necessary to reach compromises among all the housing affordability indicators. The priority criteria for ranking the housing affordability also need to be determine by a comprehensive approach [17].
MCDM and VIKOR
MCDM can also be effectively used by decision makers to select the best solution given multiple criteria. Some methods (e.g., AHP [18], ELECTRE [19], PROMETHEE [20], BWM [21], and DEMATEL [22]) are based on quantitative measurements and use a few attributes to compare alternatives. Other methods (e.g., TOPSIS [23], VIKOR [24], MABAC [25], and MARCOS [26]) are representative outranking methods based on a reference point or goal. Researchers normally choose which MCDM method to use based on the purpose of the study and the actual problem [27].
VIKOR is one of the best compromise methods for ranking alternatives and can solve conflicting and incommensurable problems. Instead of comparing the criteria and alternatives, it measures and evaluates each alternative independently. Therefore, the assessment can be based on raw data. Most importantly, VIKOR can balance between total and individual satisfaction via a maximum “group utility” for the “majority” and a minimum “individual regret” for the “opponent” [28]. Solutions given by TOPSIS consider the relationships between the alternatives and the positive and negative ideal points, regardless of their relative importance. This is similar to MABAC and MARCOS.
Another vital issue to consider is rank reversal. Adding or deleting alternatives may cause the rankings produced by the VIKOR method to reverse [29]. This rank reversal phenomenon was first detected in the context of AHP [30] and occurred in other MCDM methods (i.e., TOPSIS, PROMETHEE, and ELECTRE) as well [31–35].
The entropy weighting method can improve the traditional VIKOR method. It is an objective weighting method, is mainly used to calculate the relative weights between the decision criteria based on the data obtained [36]. It takes the valid information contained in the known data into account and can resolve the rank reversal problem [29].
By extending VIKOR for fuzzy environments, Opricovic [37] allowed for some decision making with incomplete, uncertain information. Subsequently, some scholars refined it for additional fuzzy environments (e.g., hesitant fuzzy sets, interval type-2 fuzzy sets, and Pythagorean fuzzy environment [38–41]).
Despite several enhancements, the improved VIKOR approach does not address the problem that the previous, comprehensive evaluation of housing affordability had only one judgment criterion. Since housing affordability in different regions and periods should vary, in theory [42], the feelings and expectations of policymakers and individuals about the affordability of housing in a given region may change over time. Therefore, they can make different decisions when faced with different scenarios of housing affordability losses or gains.
Prospect theory
To assess the influence of subjective factors on decision-making behavior, many scholars are, at present, turning to prospect theory. Prospect theory considers the psychological behavior of decision makers and is also often combined with other evaluation methods to construct new evaluation models. These models are then applied in various fields.
Wang et al. proposed a new group emergency decision making (GEDM) method for emergency decision making [43]. Ding and Liu [44] proposed an MCDM method based on prospect theory and VIKOR to solve emergency decision-making problems with 2-dimensional, uncertain linguistic information. Fu et al. [45] proposed a new risk prioritization method based on cumulative prospect theory and the second type of intuitionistic fuzzy VIKOR method to study railway train failure risk. Liu et al. [46] integrated fuzzy linguistic set, best-worst methods, prospect theory, and VIKOR to help new energy vehicle manufacturers select innovative suppliers. Phochanikorn and Tan [47] selected an appropriate green supplier for a particular company based on prospect theory and MCDM modeling. Environmental decision-making is another area where prospect theory has been applied [48, 49]. Based on the prospect theory of loss aversion effect, Lin et al. [50] established a dynamic price recommendation method for housing purchase by applying the fuzzy-MCDM technique.
Prospect theory has also evolved. Li and Yuan [51] tackled the fuzziness and uncertainty of decision information. They took the dynamic alternatives as the reference point and proposed a three-parameter interval grey linguistic variable decision-making method based on the projection model and prospect theory. Li and Chen [52] proposed a method to determine the prospect value based on multiple reference points.
Both the original prospect theory and the cumulative prospect theory assume that the reference points are fixed, so the influence of the reference points is not considered when calculating the probability weight. Schmidt et al. [53] proposed the third-generation prospect theory in 2008. It retains the prediction function used in the previous two generations of prospect theory and expands upon those versions. When the decision weights are designated for order dependence, uncertain reference points may be obtained. The dynamic reference point weights for each indicator are defined by the reference-dependent subjective expected utility theory method. They believed that a reference point weight should consider the corresponding probability and sized order of all results for event relative to the reference point.
Housing affordability evaluation model
There are multiple indicators on housing affordability, and these indicators can conflict with each other. Given the advantages of the VIKOR approach and prospect theory regarding housing affordability, it was logical to combine the third-generation prospect theory and improved VIKOR method to form a novel, comprehensive MCDM model, which can better evaluate housing affordability.
In this section, a comprehensive evaluation model is developed to analyze housing affordability in different cities. The model’s housing affordability prioritization can be treated as an MCDM problem, and the housing affordability indicator can be regarded as a decision criterion. The VIKOR accounts for the conflicts among housing affordability indicators. The entropy weighting method avoids the overweighting of expert-preferred indicators, common in subjective or equal weightings schemes, and overcomes the problem of ranking order reversal due to changes to the evaluation datasets. The integrated prospect value of this model considers the decision maker’s psychology when accessing housing affordability, and multiple reference points endow the housing affordability evaluation criteria with dynamic characteristics for different periods and regions.
Specifically, the value function and cumulative decision weights for each indicator based on the original values of the housing affordability indicators, dynamic reference points, and preference parameters for each city for different periods are determined. The integrated prospect matrix of each indicator over time for each city is obtained. Subsequently, to avoid order inversion, the integrated prospect matrix is normalized to calculate entropy weights. Then, group utility values, individual regret values, and compromise degrees are calculated according to the steps of the VIKOR method. The ranking results are obtained from the evaluation results. The general steps of this evaluation model are illustrated in Fig. 1.
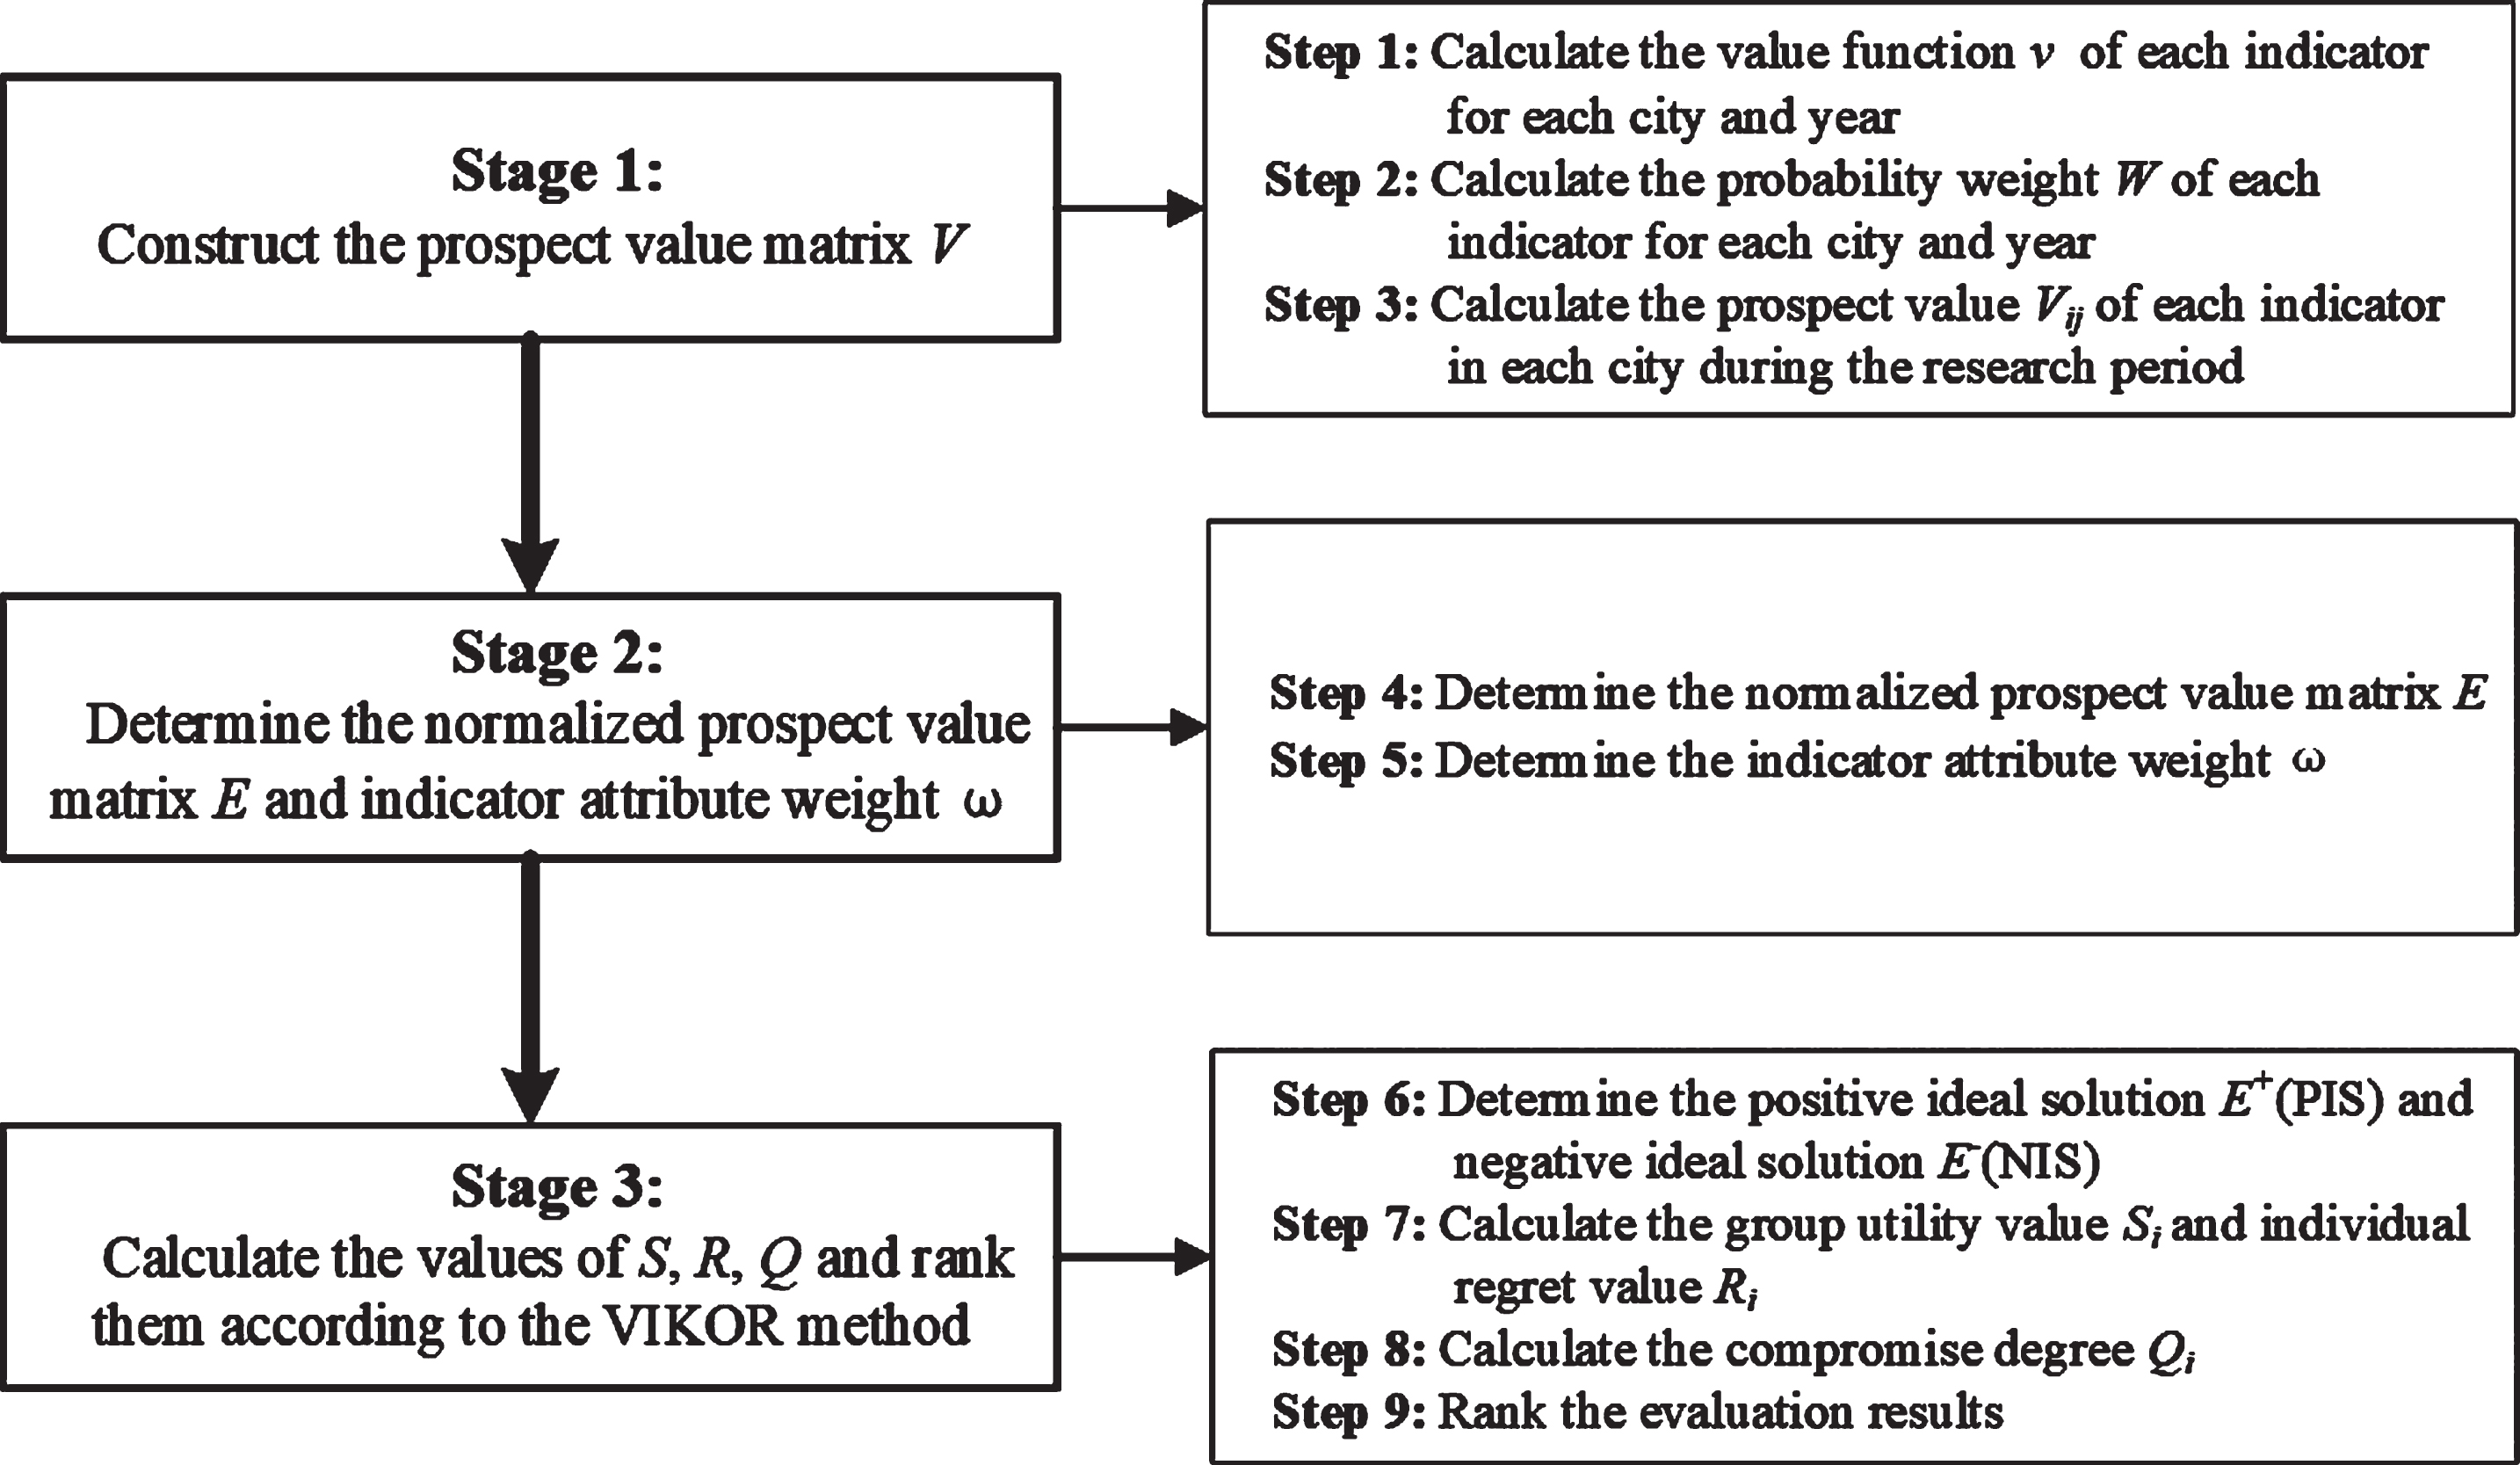
Evaluation flowchart.
For a housing affordability evaluation problem, it can be assumed that there exists a set of evaluated cities, A ={ a1, a2, a3, …, a m }, with m alternatives, where i = 1, 2, 3, …, m, and a i denotes the evaluated city. Let C ={ c1, c2, c3, …, c n } be the housing affordability indicators. There are n attributes such that j = 1, 2, 3, …, n, and c j represents the indicator attribute. The attribute value matrix of each city is X = [x ij ] m×n, where x ij represents the attribute value of evaluated city a i for indicator attribute c j . To assess the housing affordability of each indicator over a period of time, let S = (s t |t = 1, 2, 3, … q) represent the corresponding state of each city indicator x ij over t years.
Let V = [V
ij
] be the prospective value matrix of the housing affordability indicator, where V
ij
represents the corresponding prospect value of the evaluated city, a
i
, in the state S of indicator attribute c
j
. Let ω ={ ω1, ω2, ω3, …, ω
n
} be the corresponding attribute weight of the affordability indicator, where ω
j
satisfies 0 ≤ ω
j
≤ 1 and
Calculation steps
The various steps of the algorithm are as follows:
Stage 1: Construct the prospect value matrix V.
Step 1: For each indicator for each city and each year, calculate its value function v.
The value functions of each indicator in each year are described in Equation (1):
Step 2: Calculate the probability weight, W, W of each indicator for each city and year.
In accordance with the third-generation prospect theory, the median value of the annual housing affordability indicator is selected as the reference point h. Then comparing f and h under state s t , if f ≥ h, then a weak gain state exists. Let m+ denote the number of weakly acquired states. Instead, if f < h, then a strong loss state exists, and the number of strong loss states is m- = q - m+. Then the subscripts are reassigned. For all subjects t, d, if t > d and v (f (s t ) , h (s t )) ≥ v (f (s d ) , h (s d )), then the states with weak gains are indexed m+, …, 1, and the states with strict losses are indexed -1, …, - m-.
The weight function expression in the third-generation prospect theory is Equation (2):
In the formula, p
t
represents the probability corresponding to state s
t
for the housing affordability indicator in year t. And ∑p
t
= 1. Here, it is assumed that the annual housing affordability indicator has an equal influence on the comprehensive prospect value of each city. That is, the probability p
t
equals
Step 3: Calculate the prospect value, V ij , of each indicator in each city during the research period.
Suppose F represents the set of states, s t , with housing affordability indicator values f ≥ h, the reference point for the housing affordability indicator in the evaluated city, and G represents the set of states, s d , with housing affordability indicator values f < h.
Then, the prospect value for each indicator in each city is Equation (3):
Therefore, according to the third-generation prospect theory, the prospect value of each indicator for each city can be used to obtain the prospect value matrix V = [V ij ].
Stage 2: Determine the normalized prospect value matrix E and indicator attribute weight ω.
Step 4: Determine the normalized prospect value matrix E.
To eliminate the effects of different dimensions on the evaluation indicators, it is necessary to normalize the obtained original prospect value matrix. Since the selected indicators are cost-based, the standardized treatment and normalization formulas for the prospect value matrix, V ij , are as Equation (4) and (5):
To eliminate the effects of different dimensions on the evaluation indicators, it is necessary to normalize the obtained original prospect value matrix. Since the selected indicators are cost-based, the standardized treatment and normalization formulas for the prospect value matrix, V
ij
, are as in Equations (4) and (5):
Step 5: Determine the indicator attribute weight, ω.
To reduce the objective influence of the indicator attribute weights, the weight ω of indicator attribute c j is given according to the “entropy weighting method”. Doing so ensures that the weights can be adjusted on time as data is added, deleted, or substituted. The entropy weighting method is based on a decision matrix with alternatives and criteria. The steps of the entropy method are available in the literature [55, 56].
Stage 3: Calculate the values of S, R, Q and rank them according to the VIKOR method.
Step 6: Determine the positive ideal solution, E+ (PIS), and negative ideal solution, E- (NIS), for all indicators, as illustrated in Equations (6) and (7).
Step 7: Calculate the group utility value, S i , and individual regret value, R i .
Here, both the positive and negative ideal solutions are used as references to calculate the two values.
The positive ideal solution is taken as a reference, as illustrated in Equations (8) and (9).
The negative ideal solution is taken as a reference, as seen in Equations (10) and (11).
The group utility value and individual regret value of the scheme are Equations (12) and (13):
Step 8: Calculate the compromise degree, Q i .
To consider both group utility maximization and individual regret minimization, the decision making mechanism coefficient is set as u = 0.5. The compromise degree Q i is given by Equation (14).
Step 9: Rank the evaluation results.
According to S
i
, R
i
and Q
i
, the evaluation results are sorted in descending order. The higher the values, the higher the ranking, and the better the result. A larger Q
i
value also results in better evaluation results. When the following two conditions are met, the evaluation results can be sorted according to the Q
i
value. Advantages: Acceptable decision reliability conditions: The decision results sorted by Q should be consistent with those sorted by S or R. That is, according to the decision results based on Q value ranking, the corresponding S or R value rankings should be relatively similar.
To test the rationality and effectiveness of the proposed approach for housing affordability evaluation, a realistic case study that includes evaluation indicators, data sources, implementation, and results was carried out. The evaluation results and discussion are presented in this section.
Evaluation indicators
In current housing affordability research in different countries, price to income ratio (PIR) and rent to income ratio (RIR) are commonly used indicators in policy decisions and academic studies [57–59]. PIR, c1, focuses on measuring the ability of a household to purchase housing. RIR, c2, is mainly used to evaluate renting affordability for tenants. These indicators include both the purchase and rental aspects and vary as residential incomes and housing prices change in different locations and times. Therefore, these two major indicators were chosen as decision criteria for this study.
PIR is represented by the current market value of housing units and annual household incomes and RIR by the current market rents for housing units and monthly tenant incomes. Based on data availability, these two indicators are usually calculated, as shown in Table 1.
Indicator descriptions
Indicator descriptions
This study evaluated 35 large- and medium-sized cities. These cities are all provincial capitals or economically developed cities throughout China. All have large dynamic populations and high and continuously growing market demand for housing. They also have different economic development levels, growth, and resource availability. Therefore, the regional differences in housing affordability are significant. In short, the extensive data set can reflect the overall housing affordability situation in China. In this scenario, housing affordability in various regions around the country can provide an important reference for government policy making and regulation.
Calculating the PIR and RIR values in the evaluated cities required the original data (e.g., household income, housing data, and household size). The household income data is usually represented by per capita disposable income derived from the WIND Economic Database. The housing data included the average housing price per unit floor area, average rent per unit housing floor area, and per capita housing floor area. The per capita housing floor area data were obtained from the CEIC database and statistical yearbook for each city. Other necessary data were obtained from the WIND database. The household size data is usually represented by the average population per household, derived from statistical yearbooks.
China’s housing market began to develop in 2000 and has undergone tremendous changes since. It gradually stabilized in 2017 because of stringent housing policy. Therefore, this paper discusses the comprehensive housing affordability in different cities over those eight years, 2010-2017.
Descriptive statistics
The number of observations during the study period in the cities under study was 280. The differences between the maximum and minimum values of average housing price and rent per unit floor area were relatively large and fluctuated considerably.
The per capita disposable income and per capita housing floor area also increased over time. The average population per household changed slightly and was not significant. The gap between the housing PIR and RIR values was large. The standard deviation of the PIR was much larger than that for the RIR, indicating that the PIR’s dispersion degree is greater than that of the RIR, as seen in Table 2.
Statistics of the variables used in the study
Statistics of the variables used in the study
For brevity, only the median PIR and RIR values used as reference points (i.e., h (s t )) are shown in Table 3. Clearly, the reference points of the housing affordability indicators vary over the eight years.
Reference points, h (s
t
)
Reference points, h (s t )
Following the third-generation prospect theory of Equation (1), the value function v of the PIR and RIR of the city a i during the t years is calculated. That is coupled with Equation (2) to get the prospect value function of the PIR and RIR of the city a i during the t years. Finally, using Equation (3), the comprehensive prospect value of PIR (Vi1) and RIR (Vi2) of the city a i is obtained. The detailed procedure involved extensive calculation, so Table 4 only shows the results.
Prospect value, V ij
The housing affordability prospect matrix is normalized by Equations (4) and (5). The results are depicted in Fig. 2.

Normalized prospect values of PIR (Ei1) and normalized prospect values of RIR (Ei2).
According to the entropy weight method in the literature of step 5 [55, 56], the entropy weights of these two indicators are ω = (0.729, 0.271).
The magnitude of the weight, ω1 of the housing PIR is far greater than ω2 of the housing RIR, which is consistent with most academic research and government decisions.
Next, Equations (6) and (7) were used to find the PIS and NIS for each indicator. The group utility value (S i ) and individual regret value (R i ) of each city were calculated according to Equations (8)–(13). Finally, Equation (14) was used to calculate the compromise degree, Q i , and cities were sorted based on their S i , R i and Q i values. Table 5 shows the specific results.
Evaluation results
Evaluation results
The evaluation results of the housing affordability indicators were analyzed based on the group utility value (S i ), individual regret value (R i ), and compromise degree (Q i ). The undeveloped, northwestern cities top the list, with Yinchuan and Hohhot claiming the top spots. Other cities with high rankings include Changsha in the central, Qingdao in the eastern, and Xi’an in the western region. At the bottom of the list are the developed eastern coastal cities (e.g., Beijing, Shanghai, and Shenzhen). Other cities with low rankings are Fuzhou, Haikou, and Xiamen, also in the eastern region. The evaluation results suggest that megacities have more unaffordable housing than medium-sized cities in the Midwest.
Comparing the original with prospect values
First, the original value of the housing affordability indicator and the average weight were combined to get a simple evaluation result. That value was then compared with the result of prospect value V ij with the average weight, as shown in Table 6.
Rank results between original value and prospect value V
ij
Rank results between original value and prospect value V ij
Table 6 shows that the rankings based on the original value and prospect value in some cities vary. This can indicate that the housing affordability evaluation results were affected by the psychological factors affecting the decision maker.
To deduce what factor had the most significant impact on the prospect value, a sensitivity analysis was conducted on the risk coefficients (α+ and α-), the loss aversion coefficient (λ) of housing affordability indicator, and the risk attitude coefficients (δ and γ) of housing affordability gain and loss. The range of variation of the considered parameters was 15% and 30% higher and lower for each value. For example, α+ = α- = 0.88, λ = 2.25, γ = 0.61 and δ = 0.69. The results are shown in Fig. 3. The horizontal axis represents the cities and the vertical axis the ranking changes.

Ranking fluctuation diagram.
As shown in Fig. 3, the overall ranking does not fluctuate prominently. An outlier was the ranking for Taiyuan, which a change of up to 4 values. Shenyang, Xi’an, and Urumqi all saw ranking changes up to 3 values. Jinan, Qingdao, Haikou, Wuhan, Changsha, Harbin, Chongqing, and Lanzhou all had ranking changes of 2. The other cities’ rankings only changed by 1 or less. The risk coefficient and risk attitude in the value function do not really influence the results, and the values calculated from the realistic data were relatively stable. More importantly, the study’s findings suggest that the attitude of the decision makers can impact the values of the prospect theory parameters and, therefore, the evaluation results.
To verify that the improved VIKOR method with entropy weight can avoid the rank inversion phenomenon, Beijing, Shanghai, Chengdu, and Harbin were removed from the data set at random. Then, the data was processed with the ordinary and improved VIKOR methods to check whether the order inversion phenomenon occurred.
When using the improved VIKOR method, the ranking results are the same as the rankings from the original scheme. Therefore, no order inversion occurred. However, when using the standard VIKOR method, the ranking results of some cities changed. Notably, the improved VIKOR method had the following ranking: Qingdao > Xi’an, Ningbo > Zhengzhou. In contrast, the ordinary scheme had the rankings: Xi’an > Qingdao, Zhengzhou > Ningbo. Therefore, it can be concluded that the improved VIKOR method with entropy weight can overcome the inversion order issue encountered in the standard VIKOR method. Thus, the proposed approach is more stable and practical, as depicted in Figs. 4 and 5.
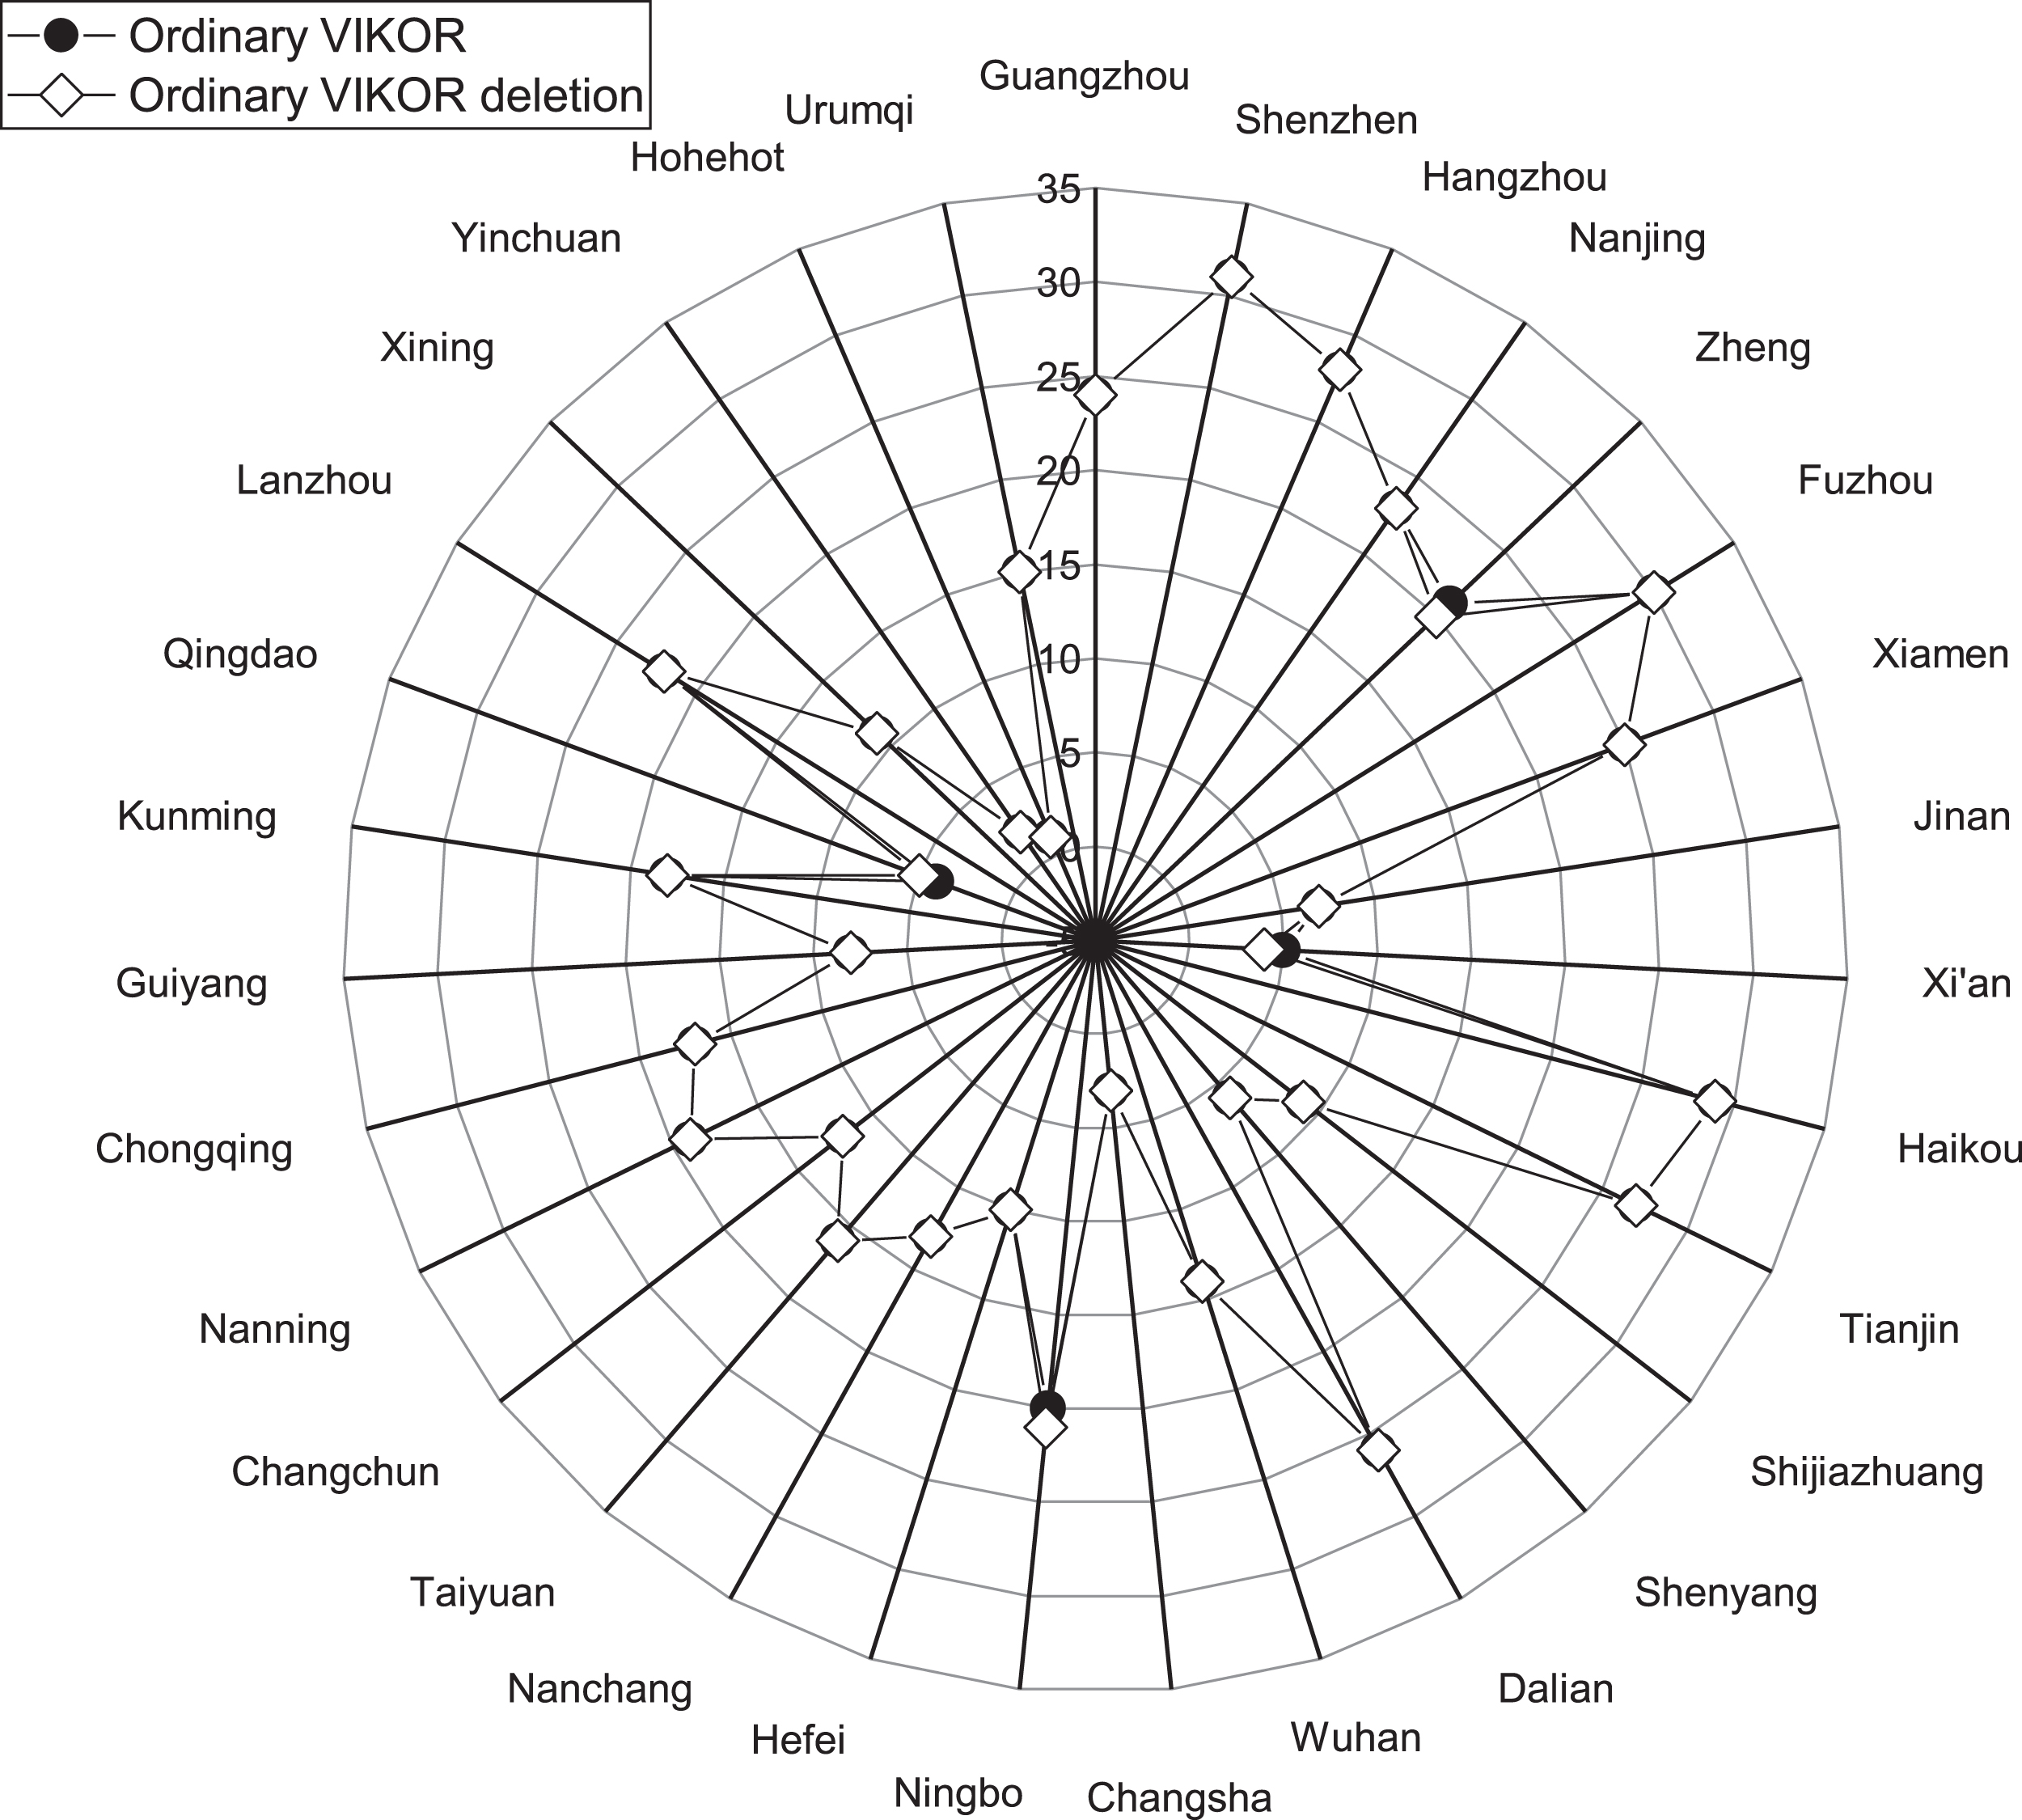
Ordinary VIKOR deletion scheme.
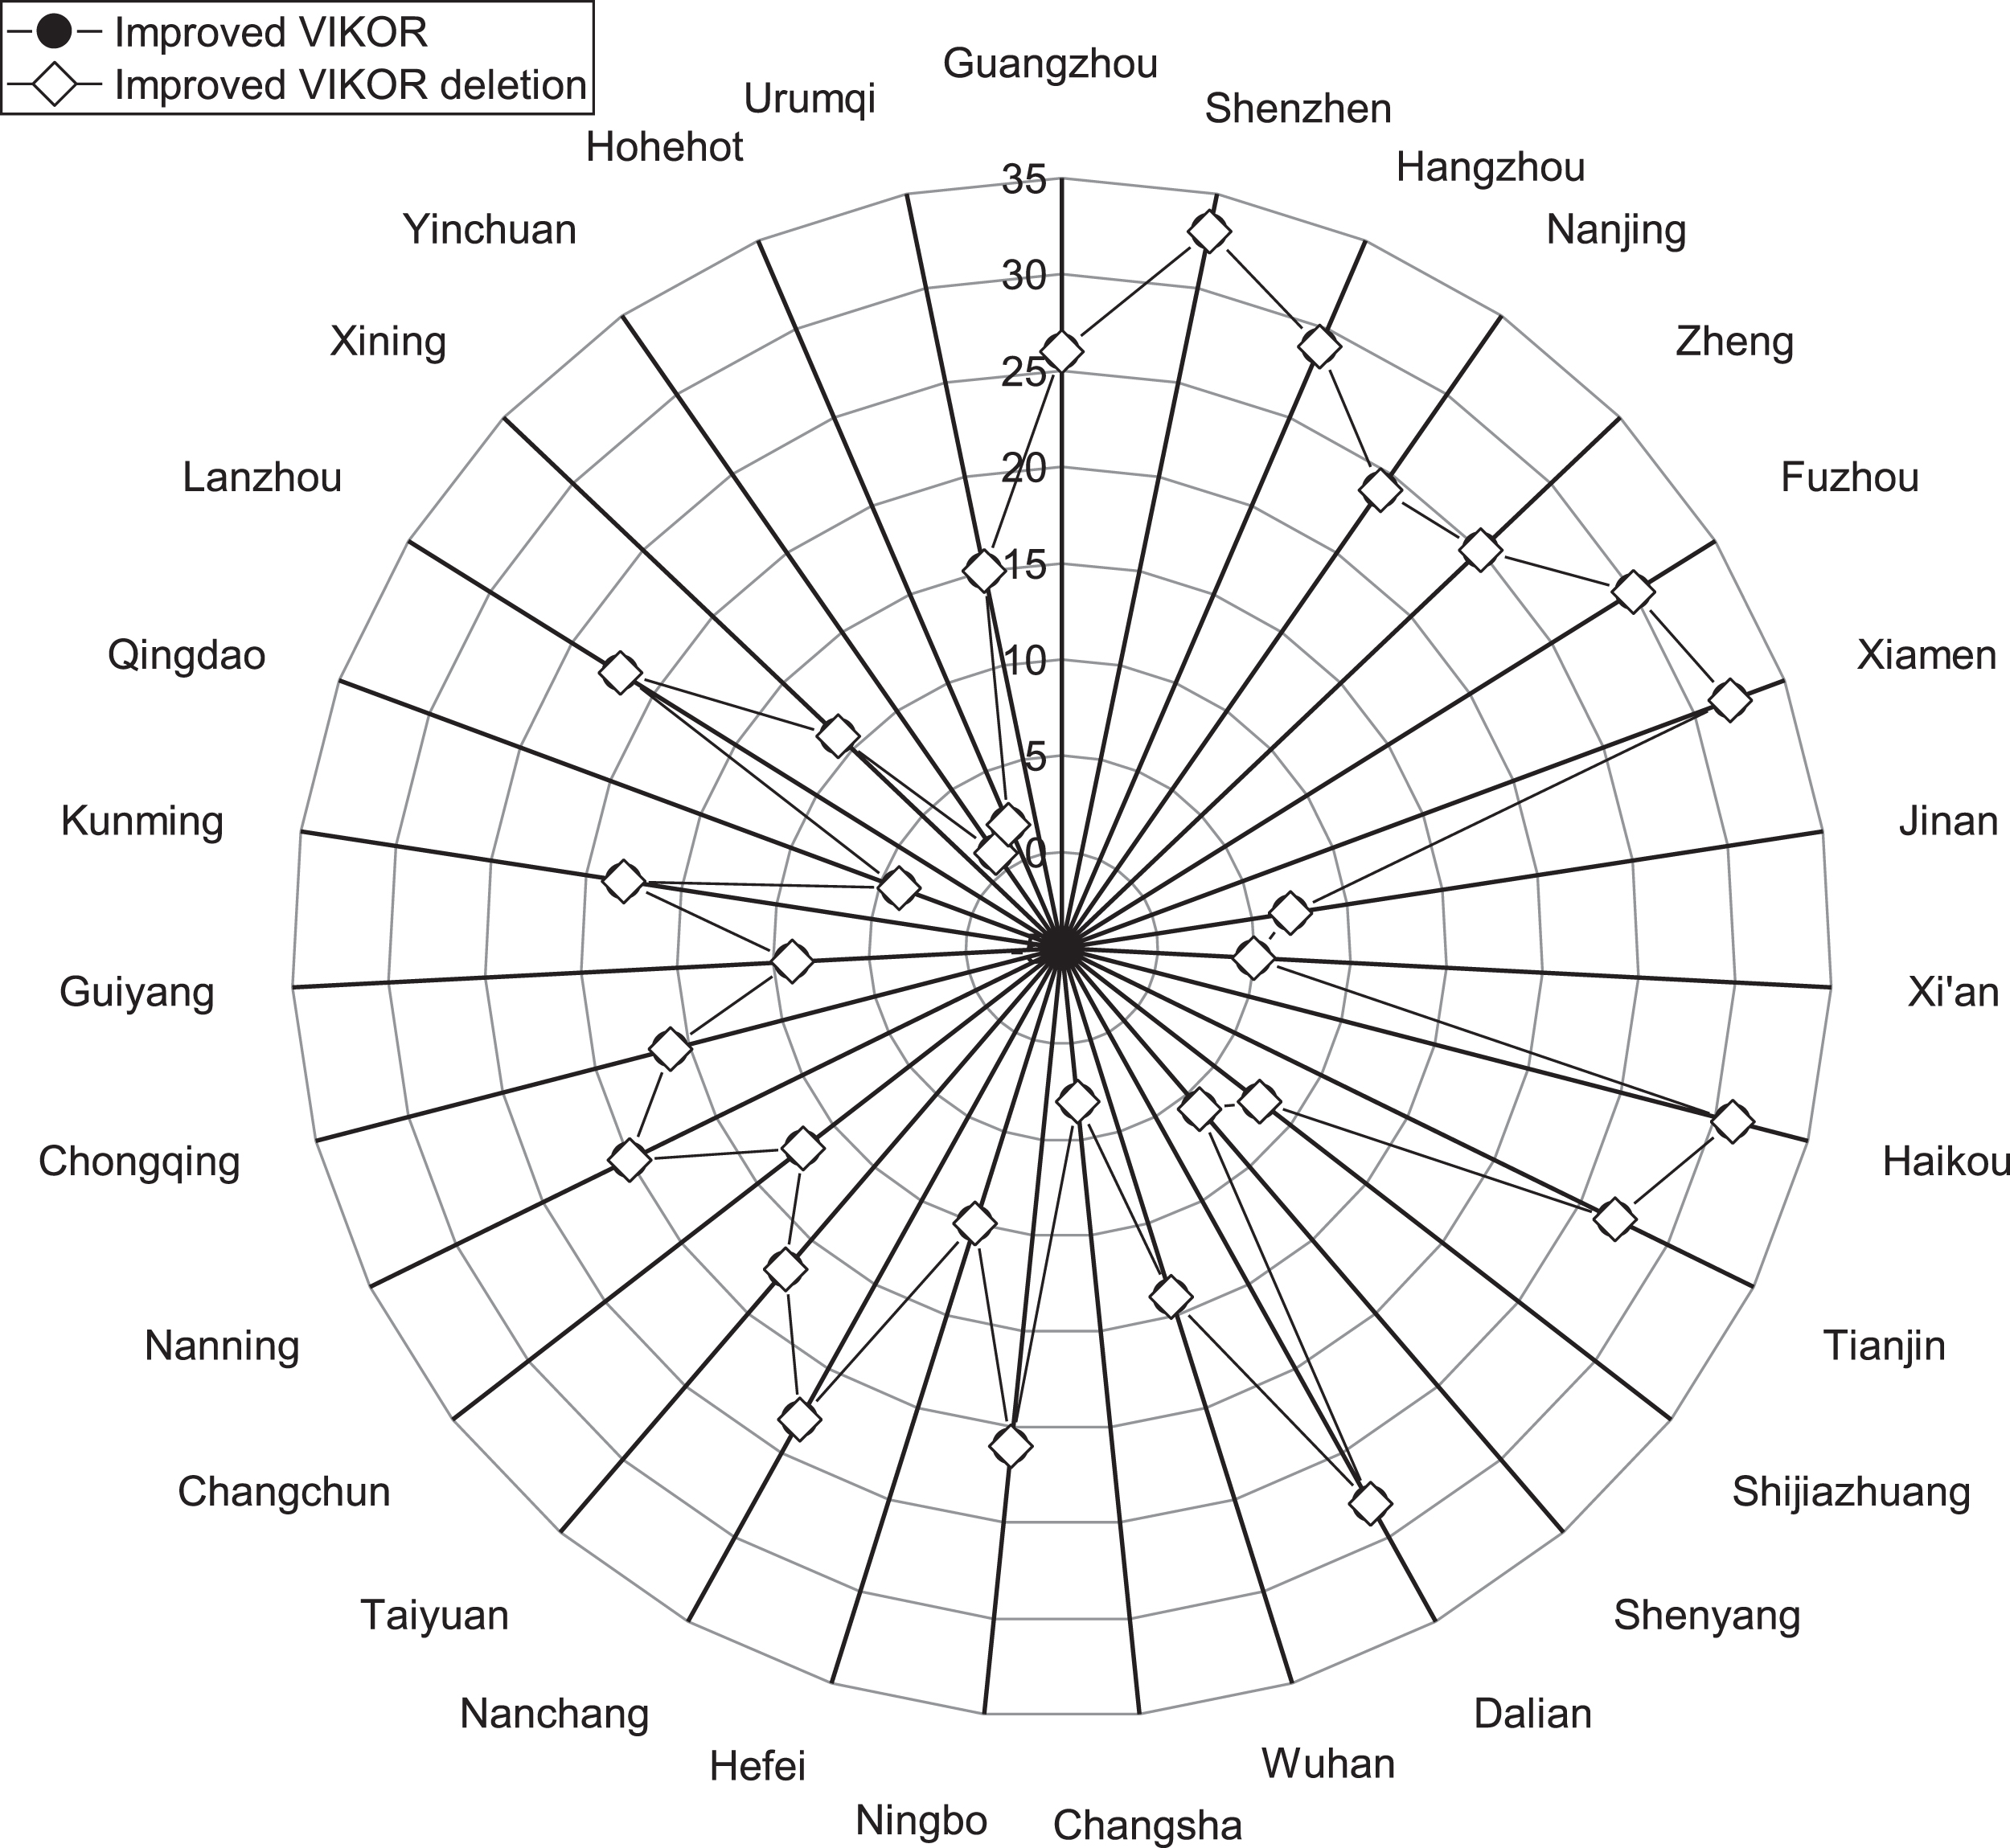
Improved VIKOR deletion scheme.
To prove the applicability and superiority of the novel, proposed approach, the results of the proposed approach were compared with those obtained by the TOPSIS method.
The TOPSIS method was chosen for comparison because it is commonly used for comparison in MCDM studies. Both methods, TOPSIS and the proposed method, are largely similar [60]; both use the normalized prospect value matrix and entropy weights. However, they differ in their aggregation functions and normalization methods. They also use different ranking methods. Therefore, the ranking results can reflect the differences between various schemes.
In Fig. 6, the cities are the abscissa, and the evaluation values are the ordinate. TOPSIS’s values were all remarkably close, while the proposed VIKOR method’s values were higher and varied more. Both methods produced values that were more in agreement for the cities with lower affordability rankings. The VIKOR results were greater for the high affordability ranking values. This is probably because the VIKOR method takes the group utility and individual regret into account, while the TOPSIS method does not consider the importance of relative distance.
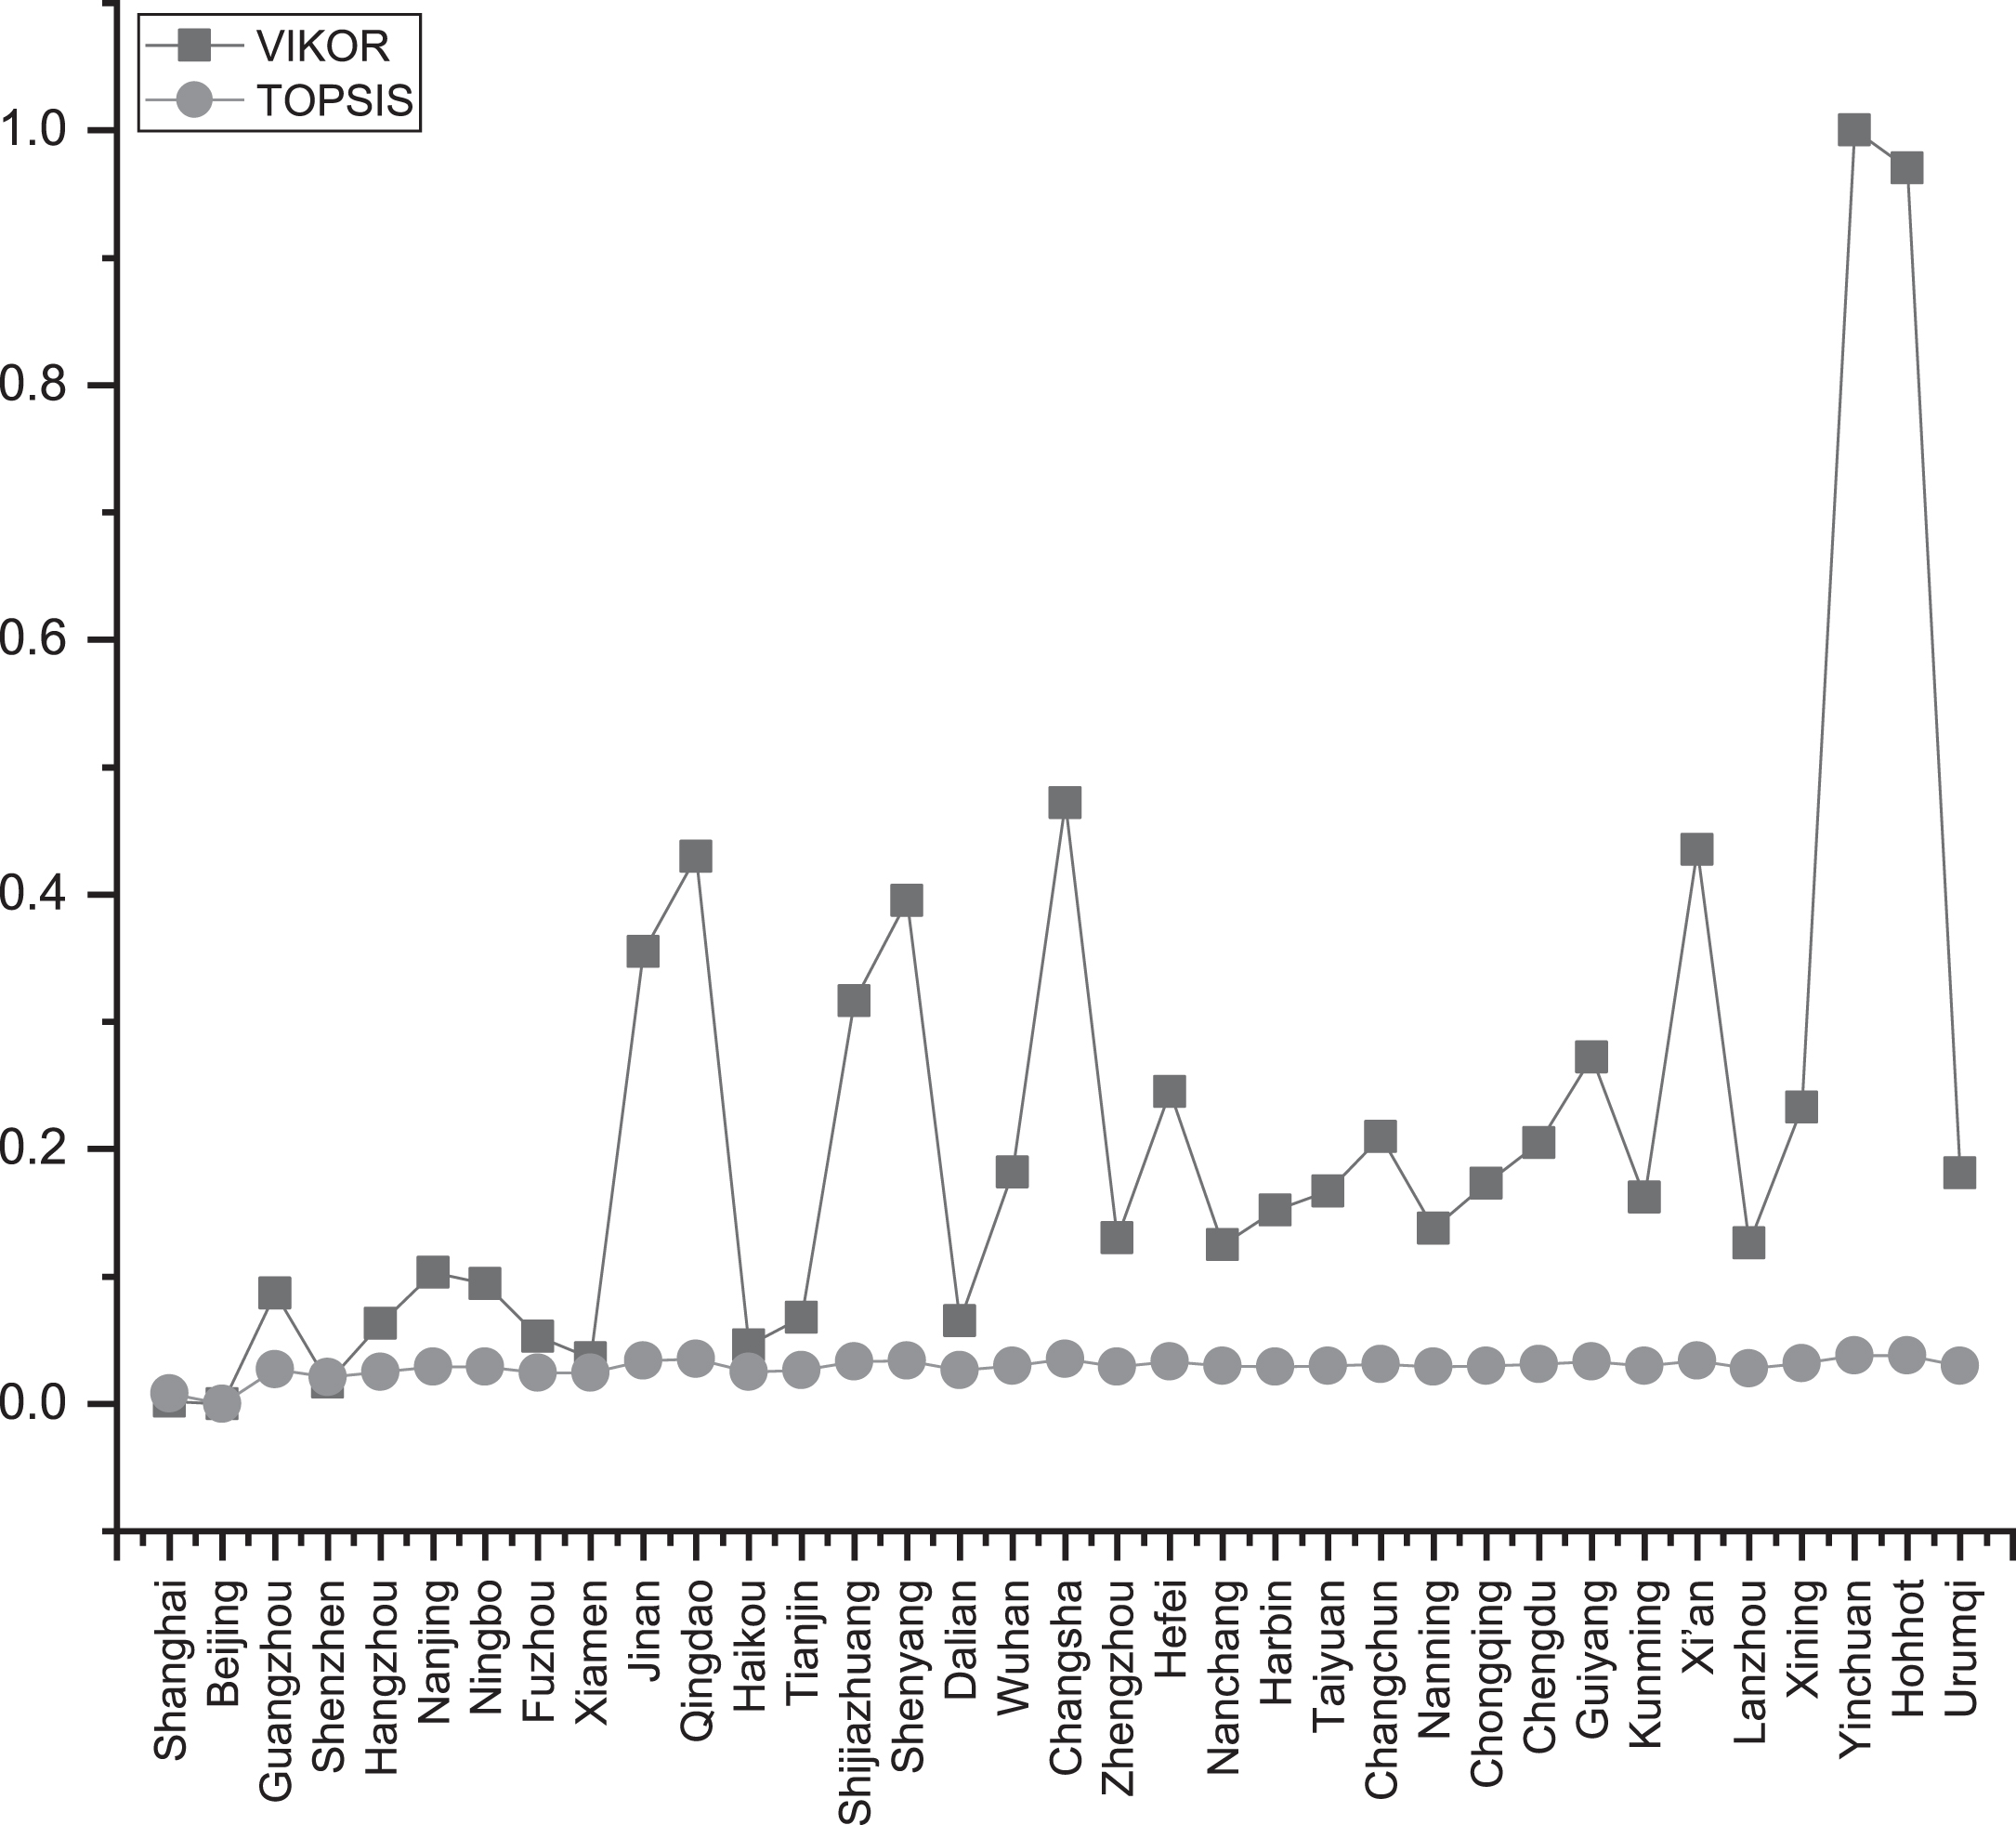
Comparison of VIKOR and TOPSIS.
According to Table 7, the proposed VIKOR method has some rankings like Zhengzhou >Lanzhou >Nanchang >Ningbo, and Xi’an >Qingdao >Shenyang. The rankings from TOPSIS include Nanchang >Ningbo >Zhengzhou >Lanzhou, and Qingdao >Shenyang >Xi’an. Comparing the rankings of both methods to actual values, the proposed method’s results were more consistent with reality in terms of the housing affordability issue.
Ranking by VIKOR and TOPSIS
This study uses the third-generation prospect theory and the improved VIKOR method with entropy weight to account for the psychological behaviors of decision makers and dynamic changes in indicator reference points, as well as a compromise between indicators and the order reversal problem. Using those components, a novel evaluation model of housing affordability was constructed. The model’s results show that the eastern coastal cities, led by Beijing, Shanghai, and Shenzhen, have low housing affordability, while other eastern cities (e.g., Xiamen, Haikou, and Fuzhou) also have unaffordable housing price. The cities with the best housing affordability are Yinchuan and Hohhot in the western region, followed by Changsha in the central, Xi’an in the western region, and Qingdao in the central region.
Further exploration of the rationality and effectiveness of the novel proposed method is possible by looking at the housing affordability evaluation results of those cities. Sensitivity analysis of how the parameters of prospect theory changed showed that the attitude of the decision maker has a certain influence on the housing affordability evaluation. Comparing the ordinary and improved VIKOR method revealed that the standard method encountered rank reversal when adding or deleting data. In contrast, the improved VIKOR method with entropy weight is not consistent before and after data addition or removal. Finally, by comparing with the TOPSIS method, the proposed method’s conformity to the purpose of housing affordability evaluation and its proximity to the selected city contexts is demonstrated.
Therefore, the proposed approach can evaluate the PIR and RIR situation while integrating those indicators with the prospect theory. It can consider the changes in the housing affordability criterion, allowing it also to evaluate housing affordability in a time. Local governments can use the evaluation results to develop different response mechanisms and measures (e.g., stabilizing housing prices, regulating the rental market, and increasing resident income). Residents, developers, and investors can also use the results to choose residences and make related housing decisions. This approach proposed in this paper can handle similar MCDM problems requiring decision-makers to make choices with the help of ideal reference points that may vary with their preferences or decision environment.
However, this study has some limitations that can be addressed by future research efforts. First, more housing affordability indicators can be considered for inclusion (e.g., satisfaction with housing, living condition, and government policies and strategies). Second, the qualitative or quantitative indicators can be represented with fuzzy methods, such as the hesitant fuzzy linguistic method and the intuitive fuzzy method. Third, according to the research purpose, a comparison of the different segments of the research period can be conducted with segmented analysis. For example, the analysis can look at changes before and after the implementation of a particular housing policy. Fourth, the ranking method of VIKOR can be adjusted to better suit actual decision making goals. Fifth, the theoretical parameters of the prospect value α+, α-, λ, γ and δ in this study were chosen based on previous prospect theory literature. Subsequent investigation can be carried out to determine the corresponding parameters of the indicator prospect value, according to the decision making’s purpose and different decision makers’ attitude. Sixth, Due to the differences in the cultural and knowledge backgrounds of housing affordability decision makers, multi-attribute group decision making approach (MAGDM) can also be very helpful in solving this type of problem. MAGDM with multi-granular hesitant fuzzy linguistic term sets (HFLTSs) has been used considers the weight vectors of decision makers and attributes in the proposed consensus model [61, 62]. In the future, individual consensus measures and the group consensus measure [63] can help experts, policymakers, consumers and developers to reach consensus in housing affordability evaluating problems.