
Abstract
The paper presents a novel method for processing uncertain data of Phasor measurement unit (PMU) modules first time in the literature using Fuzzy Reasoning Petri net (FPN). It addresses several key issues such as exploitation of Petri net representation from operating state of PMU to its failure state whereas Fuzzy logic is used to deal with the uncertain data of PMU modules. Sprouting tree, an information flow path, of PMU failure is drawn due to various components and estimation accuracy can be enhanced by integration of more truthiness input data. Fault tree diagram, Fuzzy Petri net model (FPN), production rule sets for PMU are developed and finally degree of truthiness of proposition is computed from sprouting tree. Fuzzy logic reasoning is used for routing the sprouting tree whereas Petri net is employed for dynamics of states due to failure of modules of PMU. The fusion of two technologies is made for the dynamic response, processing and reasoning to sprouting tree information flow from operating state to unavailability of PMU. The research work is useful to pinpoint the weakness in design of modules of PMU and to assess its reliability.
Introduction
Sprouting tree of phase measurement unit (PMU) is the failure information flow path of its modules dynamically. It induces the production of failure state due to change in surrounding environmental conditions. The functional attributes of PMU modules feature represent the survival of PMU from failure. The dynamic structure of sprouting tree is similar to Petri net (PN). The uncertainty involved in the propagation of information path represented by sprouting tree can be best dealt with Fuzzy logic reasoning. The study presented in this paper using sprouting algorithm gives insight to the design and system engineering about the flow of failure of PMU components.
Phasor measurement unit (PMU) is one of the intelligent synchronous devices to monitor the power system in wide area. The failure rate of PMU’s modules is not well defined by the manufacturers. There is uncertainty involved in the failure rate of seven modules of PMU. Further, there is dynamics in processing of information due to variation of environmental conditions. Thus, uncertainty in PMU failure rate in dynamic state can be evaluated best by Fuzzy reasoning Petri net (FPN), since sprouting tree drawn using FPN gives the information path from operating state to unavailability mode of PMU. The objectives of this paper are: Development of fault tree diagram of PMU. Design and development of Fuzzy production rules, and reachability set. Development of reasoning path from normal operating state to unavailability mode of PMU using Fuzzy Petri net, called sprouting tree. Degree of truthiness of proposition is computed by drawing sprouting tree. Finally validate the reliability results obtained from sprouting tree with Markov method.
The study is useful in improving the design of PMU and identify its failure propagation pathways. In order to know the status and significance of the subject a brief literature review is presented in next section.
Literature review
The concept of Petri net was introduced by Carl Adam Petri in 1962 in his doctoral Dissertation [1]. His work was extended by T Murata [2] and further defined the properties, analysis and applications of Petri net. It has been employed to PMU [3] for power system study but it lacks to cover the dynamics and uncertainty of the PMU design. The fusion of Petri net and fuzzy logic can provide insight to the design engineer for the internal improvement of PMU design at the component level. Shyi-Ming Chen et al. [4] in this work have presented the fuzzy relation between two propositions. The relation has exploited to evaluate the degree of truth and drawn the sprouting diagram for knowledge reasoning representation, however, the study does not compare analysis with traditional techniques. M.A Jafari et al. [5] have studied the automatic recovery of controller using adaptive Petri net. The authors have tried to develop a Petri net based shop controller with modular structure. Here, they have explored Adaptive Petri net with five tuple. Meimei Gao et al. [6] have applied the fuzzy reasoning Petri nets to diagnosis the turbine fault. Stephen J.H. et al. [7] have dealt with the Petri net based mechanism for verification of rule-base system. The concept of incidences matrix is used for transformation into Petri nets. The main emphasis is on developing Petri nets based mechanism for detecting the errors in Rule based systems. The study has been developed on Java environment but lacked in covering the concept of uncertainty reasoning. Reggie David Rajuh et al. [8] have presented a short survey on modeling and simulation of discrete events and also Petri net simulator is described. Table 1 presents some recent publications related to ‘Fuzzy Petri net’ technology.
Summary of some significant researchers work
Summary of some significant researchers work
Based on functionality, Phasor Measurement Unit (PMU) has seven modules, as shown in Fig. 1 viz. module of Voltage and current transducers (Hall Effect transducers) (H1), module of Anti-Aliasing Filter (H2), module of analog to digital (ADC) (H3), module of Phasor microprocessor (DSP/micro-controller/FPGA) (H4), module of GPS –Receiver plus oscillator (GPS) (H5) and modules of MODEM (H6), and power supply (PS) (H7), respectively. Each module is defined with its failure rate and repair rate to assess the risk or unavailability of integrated Phasor Measurement Unit.
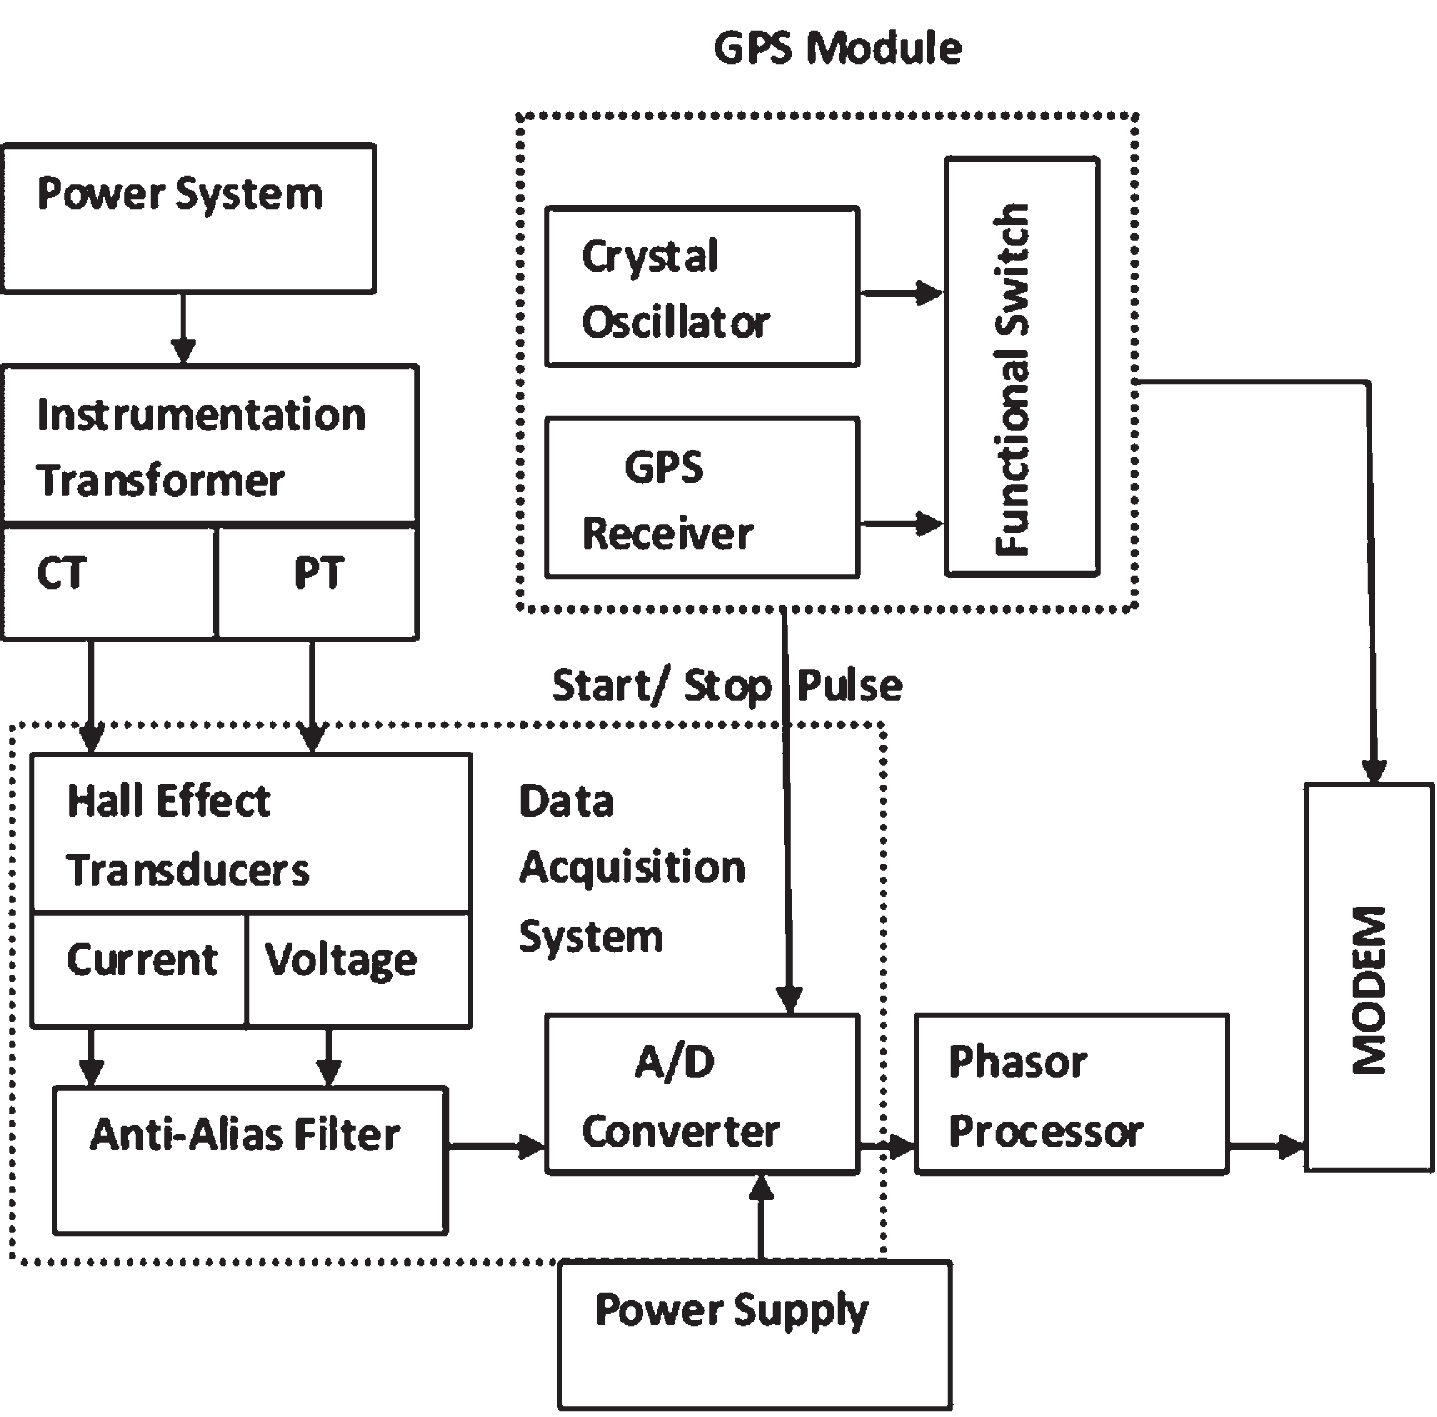
Seven modules of Phasor measurement unit.
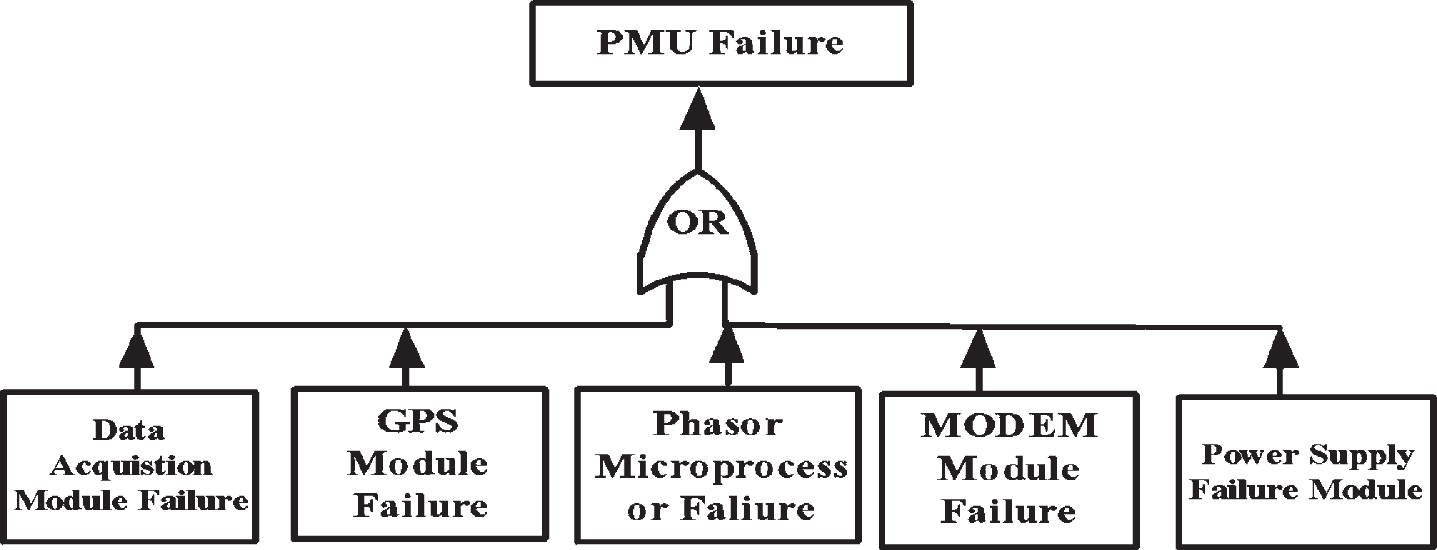
Modules H (1 -3) is called Data Acquisition system (DAS) module. Here, we have assumed that if one of the transducer or filter fails, the PMU doesn’t fail, only the performance of particular signal deteriorates. Whereas when ADC or both transducer and filter fails then PMU will fail. Similarly GPS system fails if both GPS receiver and oscillator fail or functional switch fails to operate on GPS failure or time error increases beyond the tolerance limit. Thus, the PMU can be considered as a constituent of 5-series modules and can be represented by logic failure as shown in Fig. 2. Its fault tree model [16] can be mapped using AND / OR gates as shown in Fig. 3. A fault tree is the logical relationship between functional interconnections and components of the system. The major objective of fault tree diagram is to represent system conditions symbolically with AND, OR and priority gates, which may cause the system to fail. It pin points the systems weakness in visible form.
Logic failure representation of PMU.

Fault Tree Diagram for PMU.
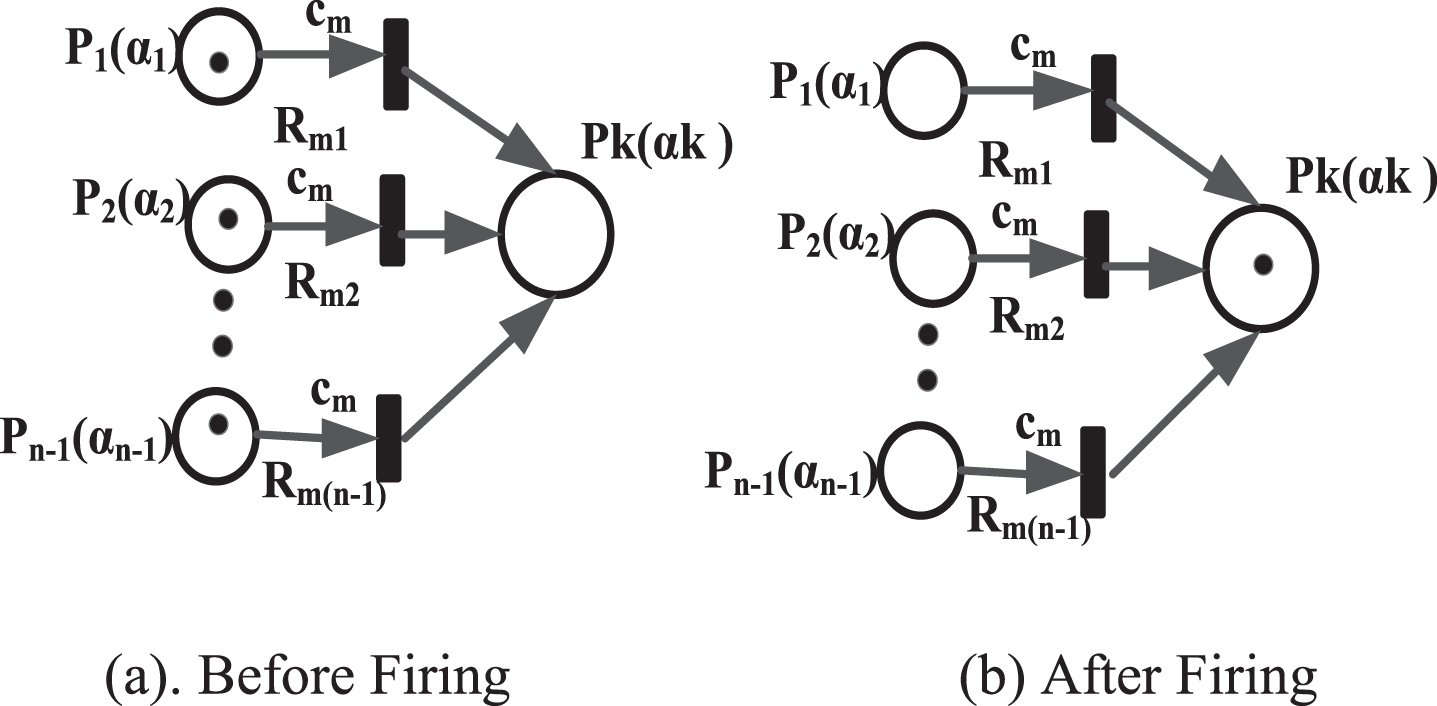
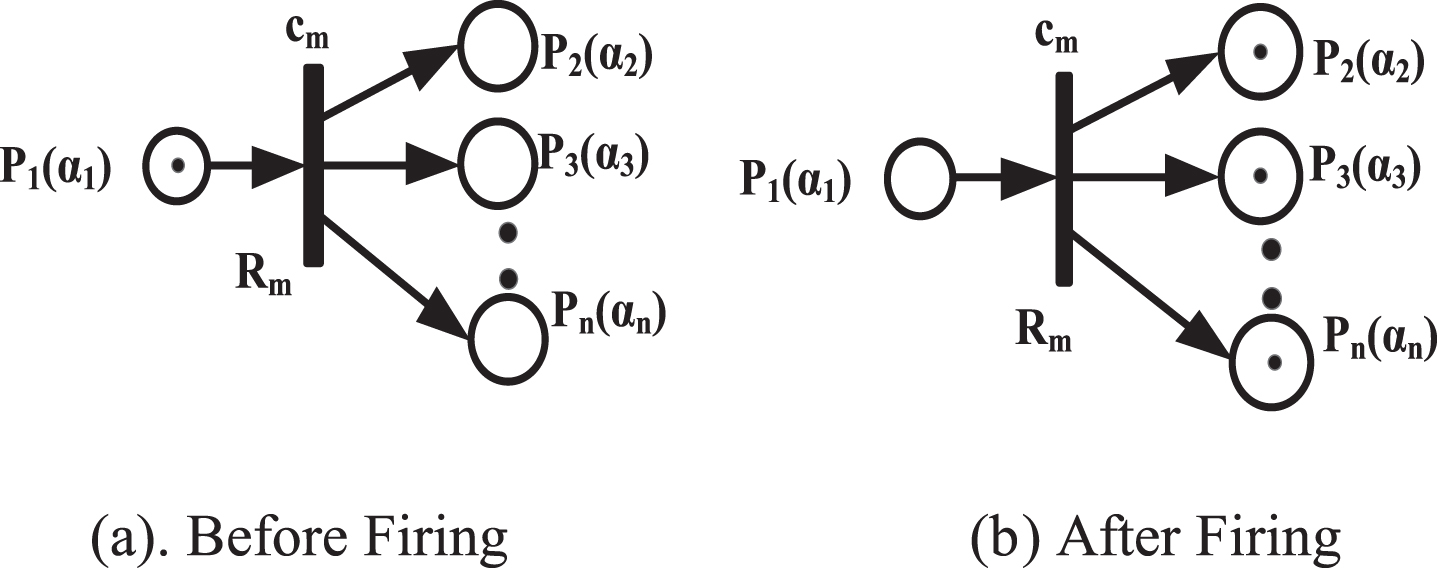
A Petri net is a network comprising of place, transition, arc and token [17]. Its architecture is basically a graphical representation of discrete events in dynamic distributed system. It is characterized by static and dynamic attributes. The static attributes includes places, transitions and arrows whereas dynamic attribute is defined by marking and constitutes of tokens. The dynamics of marking evolves firing of transitions. The places corresponding to discrete states are represented by circles. Transitions, called gates in fault tree, are represented by bars. AND gate is represented by a single transition (rectangle bar) as shown in Fig. 4(a), whereas OR gate, represented by transitions (bar) equal to the number of inputs, is shown in Fig. 4(b) [18]. Thus, the fault tree model of PMU (Fig. 3) can be converted into Petri net model, shown in Fig. 5 (using the transformations shown in the Fig. 4).

Transformation of AND/OR Logic gates to Petri net.

Petri net diagram transformed from fault tree diagram of PMU.
Reachability is one of the important mathematical properties of Petri net (PN). It checks the progress of sequences of events from starting state to potential reachability state, observing individual nodes. Reachability analysis offers the benefit that one does not have to analyze the whole system and extend some assurance for concurrency in distributed system. The reachability graph can be constructed in an iterative fashion, starting with the initial marking and then adding, step by step, for all reachable markings. Let Q be a transition system with the transition relation ‘T’. Then, Q0 ⟶ Q1 for (Q0, Q1) ∈ T; (i.e. there is a transition from Q0 to Q1). A state is reachable in n steps from a state Q0 if there exists a sequence of states Q1, ... . Qn such that Qn = Q and Q0 ⟶ Q1 ⟶... ⟶ Qn≥0 steps. The information obtained from reachability computation also covers the transient behavior of the system [19].
The idea of fuzzy set was introduced by Prof Zadeh (1965) [20]. Fuzzy logic is a soft computing technology which can take into account the uncertainty in data of PMU modules to predict its performance. Zadeh (1994) had submitted that precision, certainty, and rigor are prime requirement in hard computing whereas fuzzy logic does not demand high level of imprecision and certainty. The uncertain and imprecise dataset can generate multiple answers using Fuzzy sets. The dataset is processed using Fuzzy If-then rule such as: If a is P then b is Q, where P and Q are linguistic variable derived by Fuzzy sets on universes of discourse A and B, respectively [21]. Normally “a is P” called antecedent or interpretation while “b is Q” is called consequence or conclusion. An important aspect of using fuzzy logic in present study is that fuzzy logic rules act in parallel. This enables it to fuse with Petri net easily and carry out processing, reasoning, and decision making for imprecision and uncertain dataset. The uncertain dataset is mapped to Fuzzy dataset by assuming the any Fuzzy functions (triangular membership functions) as shown in Fig. 6.
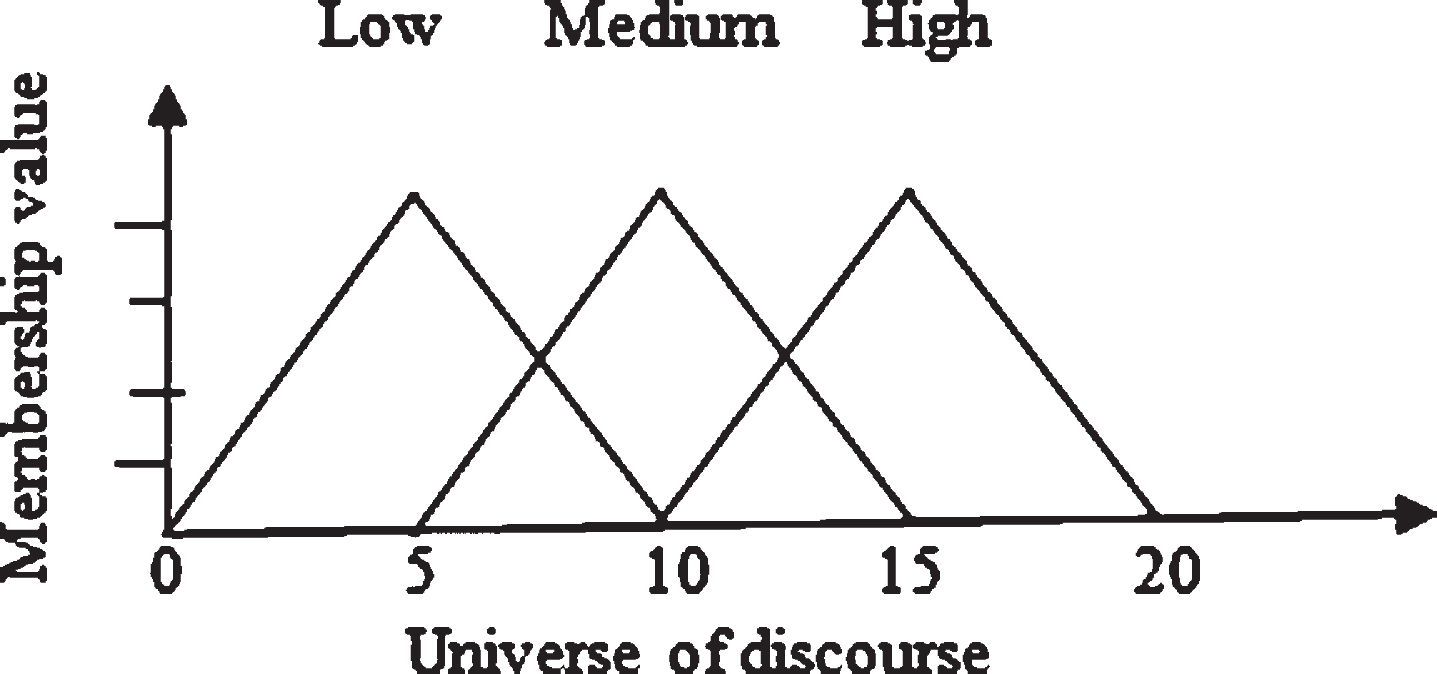
Fuzzy triangular functions.
In 1988 Looney introduced a new class of rule based on decision making network, called Fuzzy Petri net (FPN) [22]. Generalized Fuzzy Petri net for reasoning in decision support system was presented by Z. Suraj [23] and solved a numerical example to shows its implementation process. Fuzzy Petri net model of dynamic system which takes into account the uncertainty in data set can be best dealt with conditional rules (IF-Then). Transitions represent the rules and firing of transition is controlled by truthiness of rules. Each conditional rule is assigned the Fuzzy membership value, called certainty factor which has a range of [0, 1]. The rule’s strength is indicated by the numerical value of certainty factor. The directed arc from place to transition shows the transformation of mark from place to transition or transition to place. Fuzzy Petri net, in general, is defined by the data structure of multiple constituents: place (P), transition (T), input matrix (I), output matrix (O), finite set of proposition (ϑ) {d1, d2 . . such that P ∩ T ∩ ϑ = ∅ and |P| = |ϑ|}, an association function that map from transition tocertainty factor, (γ), an association function (δ) that map from place to truth degree [0,1], and θ-an association function that map from place to proposition (d1,d2.., in [0,1]), (P ⟶ ϑ). Thus, Fuzzy Petri net (FPN) can be written as:
Where,
In the process of transformation, transition is represented by each rule with its corresponding membership value. Input place shows the antecedent whereas output transition represents response in accordance to the degree of truthiness. In FPN, the output takes the same truthiness value as that of input truthiness value once the transition is fired. In reasoning Fuzzy Petri net, a token is not an object, it is the truth degree of event or objective between zero and one. Therefore, a place cannot have more than one token. Since there is no physical object, there is no concept like resource. Different rules may share a single proposition. The Fuzzy value of truth degree propagates according to the logic rules. The truthiness degree at a place will not disappear with propagation of proposition. This is the major difference between Petri net model and Fuzzy Petri net model. A transition fires, if all its inputs have a true degree equal to or more than threshold value. Figure 7 shows the structure of Fuzzy Petri net Inference system.

Fuzzy Petri net structure for PMU.
Fuzzy production rule is the inference mechanism for the transformation of input/s to output/s, once the transition fires.
Firing of transition occurs if input value [0, 1] is more than threshold value. Reachability characterization of fuzzy Petri-net enables the input data set to next node / place. Rules are the expression of knowledge in fuzzy logic. Based on the input / output and transition structure in FPN model, If –Then rule/s are applied. The following rules are used for developing the Sprouting tree network topology [24]. Table 2 list the various production rules used in sprouting tree. Figures 8–11 represent the rules diagrammatically.
Fuzzy production rules
Fuzzy production rules

Fuzzy production rule (P1, P2).

Fuzzy join rule (P1, P2 AND P3).
Fuzzy attribution rule (P1OR P2Pk).
Fuzzy fork rule (P1P2 AND P3).
In fuzzy logic theory, the possibility of event is defined as degree of truthiness, whereas in the Fault Tree Model of PMU it will be out of service if degree of truthiness is high. The truth degrees determine the Fuzzy possibility of events. A higher value indicates the event will be out of service more easily. The fault propagates downward during further iterations.
Information flow path in sprouting tree follows logic rules. The production of successive node path depends upon the conditions and threshold value. FPN is a logic rule based dynamic network [25]. It provides an ideal solution to design and develop the sprouting tree algorithm. The sprouting tree presents the fuzzy reasoning algorithm and Petri net topology. Each node in sprouting tree is denoted by 3- tuple: (pk, α pk, IRS(k)), where pk ε p and IRS (pk) is the immediate reachability set (IRS) of pk. The following steps are used to develop the sprouting tree algorithm using Fuzzy Reasoning Petri net:
Draw the Fault tree diagram of physical system using AND / and OR gates. Apply transformation rules to convert Fault tree into marked fuzzy Petri net model (FPN) using rules from Section VII. Derive the fuzzy production rules, Immediate Reachable set (IRS) and Reachable set (RS). Draw sprouting tree from FPN using following characterization. Only one transition is fired at a time i.e. only one token at one place. (The degree of output = confidence value of input place * certainty factor of transition). Multiple places arced to one transition, (AND gate), minimum value of (P2(α2), P3(α2), ... .,Pn - 1(α2); where (α2 =α3 =αn - 1 = confidence value of input place*certainty factor of transition) If multiple places arced to multiple transition (OR gate) maximum value shall be chosen. From sprouting tree the degrees of truth of propositions is found out using the (4)
Certainty factor (Cm) and threshold value (β) shows the reliability and stability of each successive node. Larger the certainty factor, the link between successive node and root node is stronger. If the degree of reliability α(pi) of place pi is more than the threshold value (β), the transition is fired i.e. the token is moved from pi node to pj node, whereα (pj) =α (pi)*Cm if α(pj)< β, pi does not pass the token to pj node. Since the route is not stable or reliable for a short time. The root node has to give up this route and try to find another stable route. Now, let Q be the set of success nodes. Then
The degree of truth of proposition, z is given by eqn. (4).
Flow diagram is a formalised graphic representation of logic sequences, for quick and easy development of the software algorithm. The function of flow diagram is to provide a common language or references point for project implementation and computation [26]. Figure 12 presents the flow chart for development of sprouting tree. Initially the root node (Qs) which is also known as starting node is considered. Also the degree of truthiness of proposition (z) is used as input value. The purpose of the computation is to get a success node which shall be terminating in nature. Immediate reachable set (IRS) helps to decide the nature of node as terminating or non-terminating. The truth degree determines the Fuzzy possibility of the events.
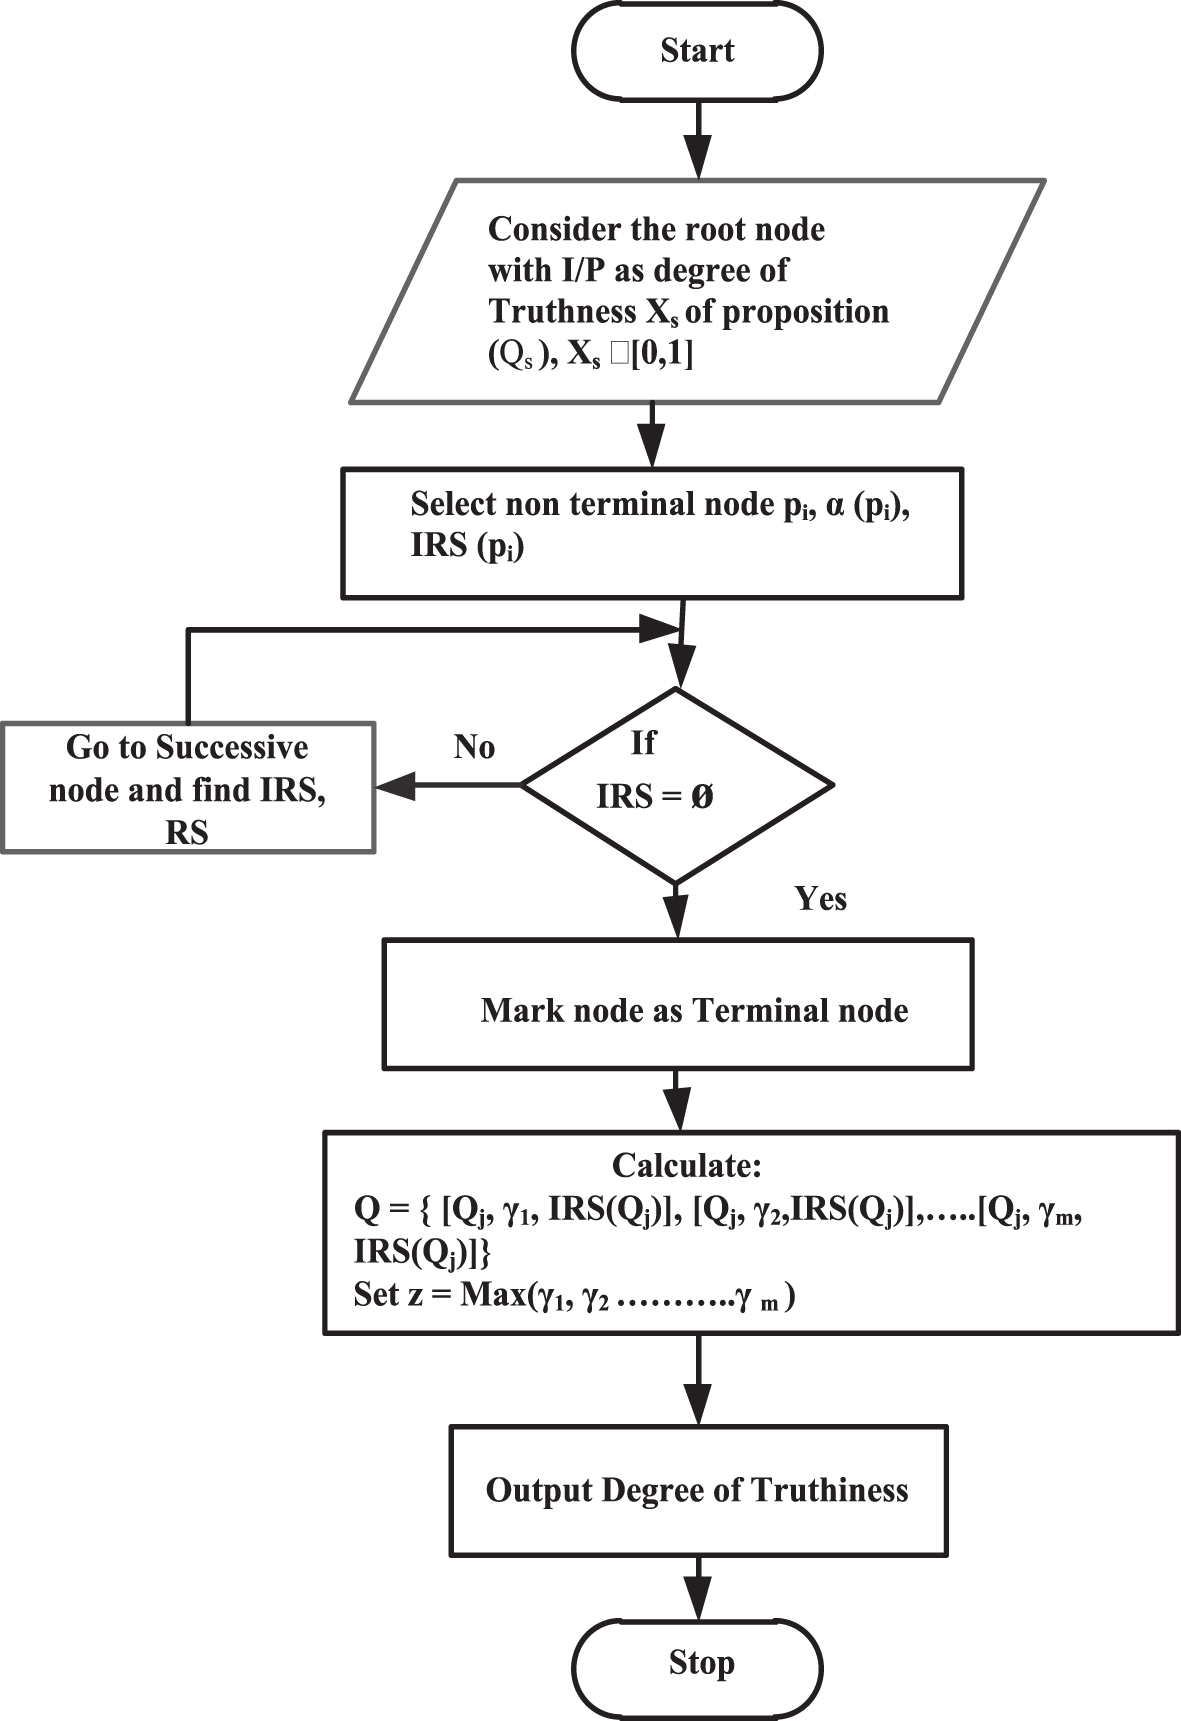
Flow chart for sprouting tree.
In order to show the utility of the algorithm developed (Section VIII) and Flow chart (Section XI), a PMU is considered whose failure rate is known (Appendix-I). It list the failure rate of all modules (H1 - 7) of PMU in main (λA) and standby mode (λB). In the present study we have assumed the certainty factor (Cm in between [0, 1]) as the availability of each module of PMU, computed from the failure rate [27]. This meets the requirement of Fuzzy Petri net attribute as well. The Fault tree of PMU, shown in Fig. 3 is transformed to its marked Fuzzy Petri net diagram shown in Fig. 13. Let d1, d2, d3 ... ... ... ... .,d22 are propositions. Thus, following Fuzzy production rules are derived, using Section-VII logics
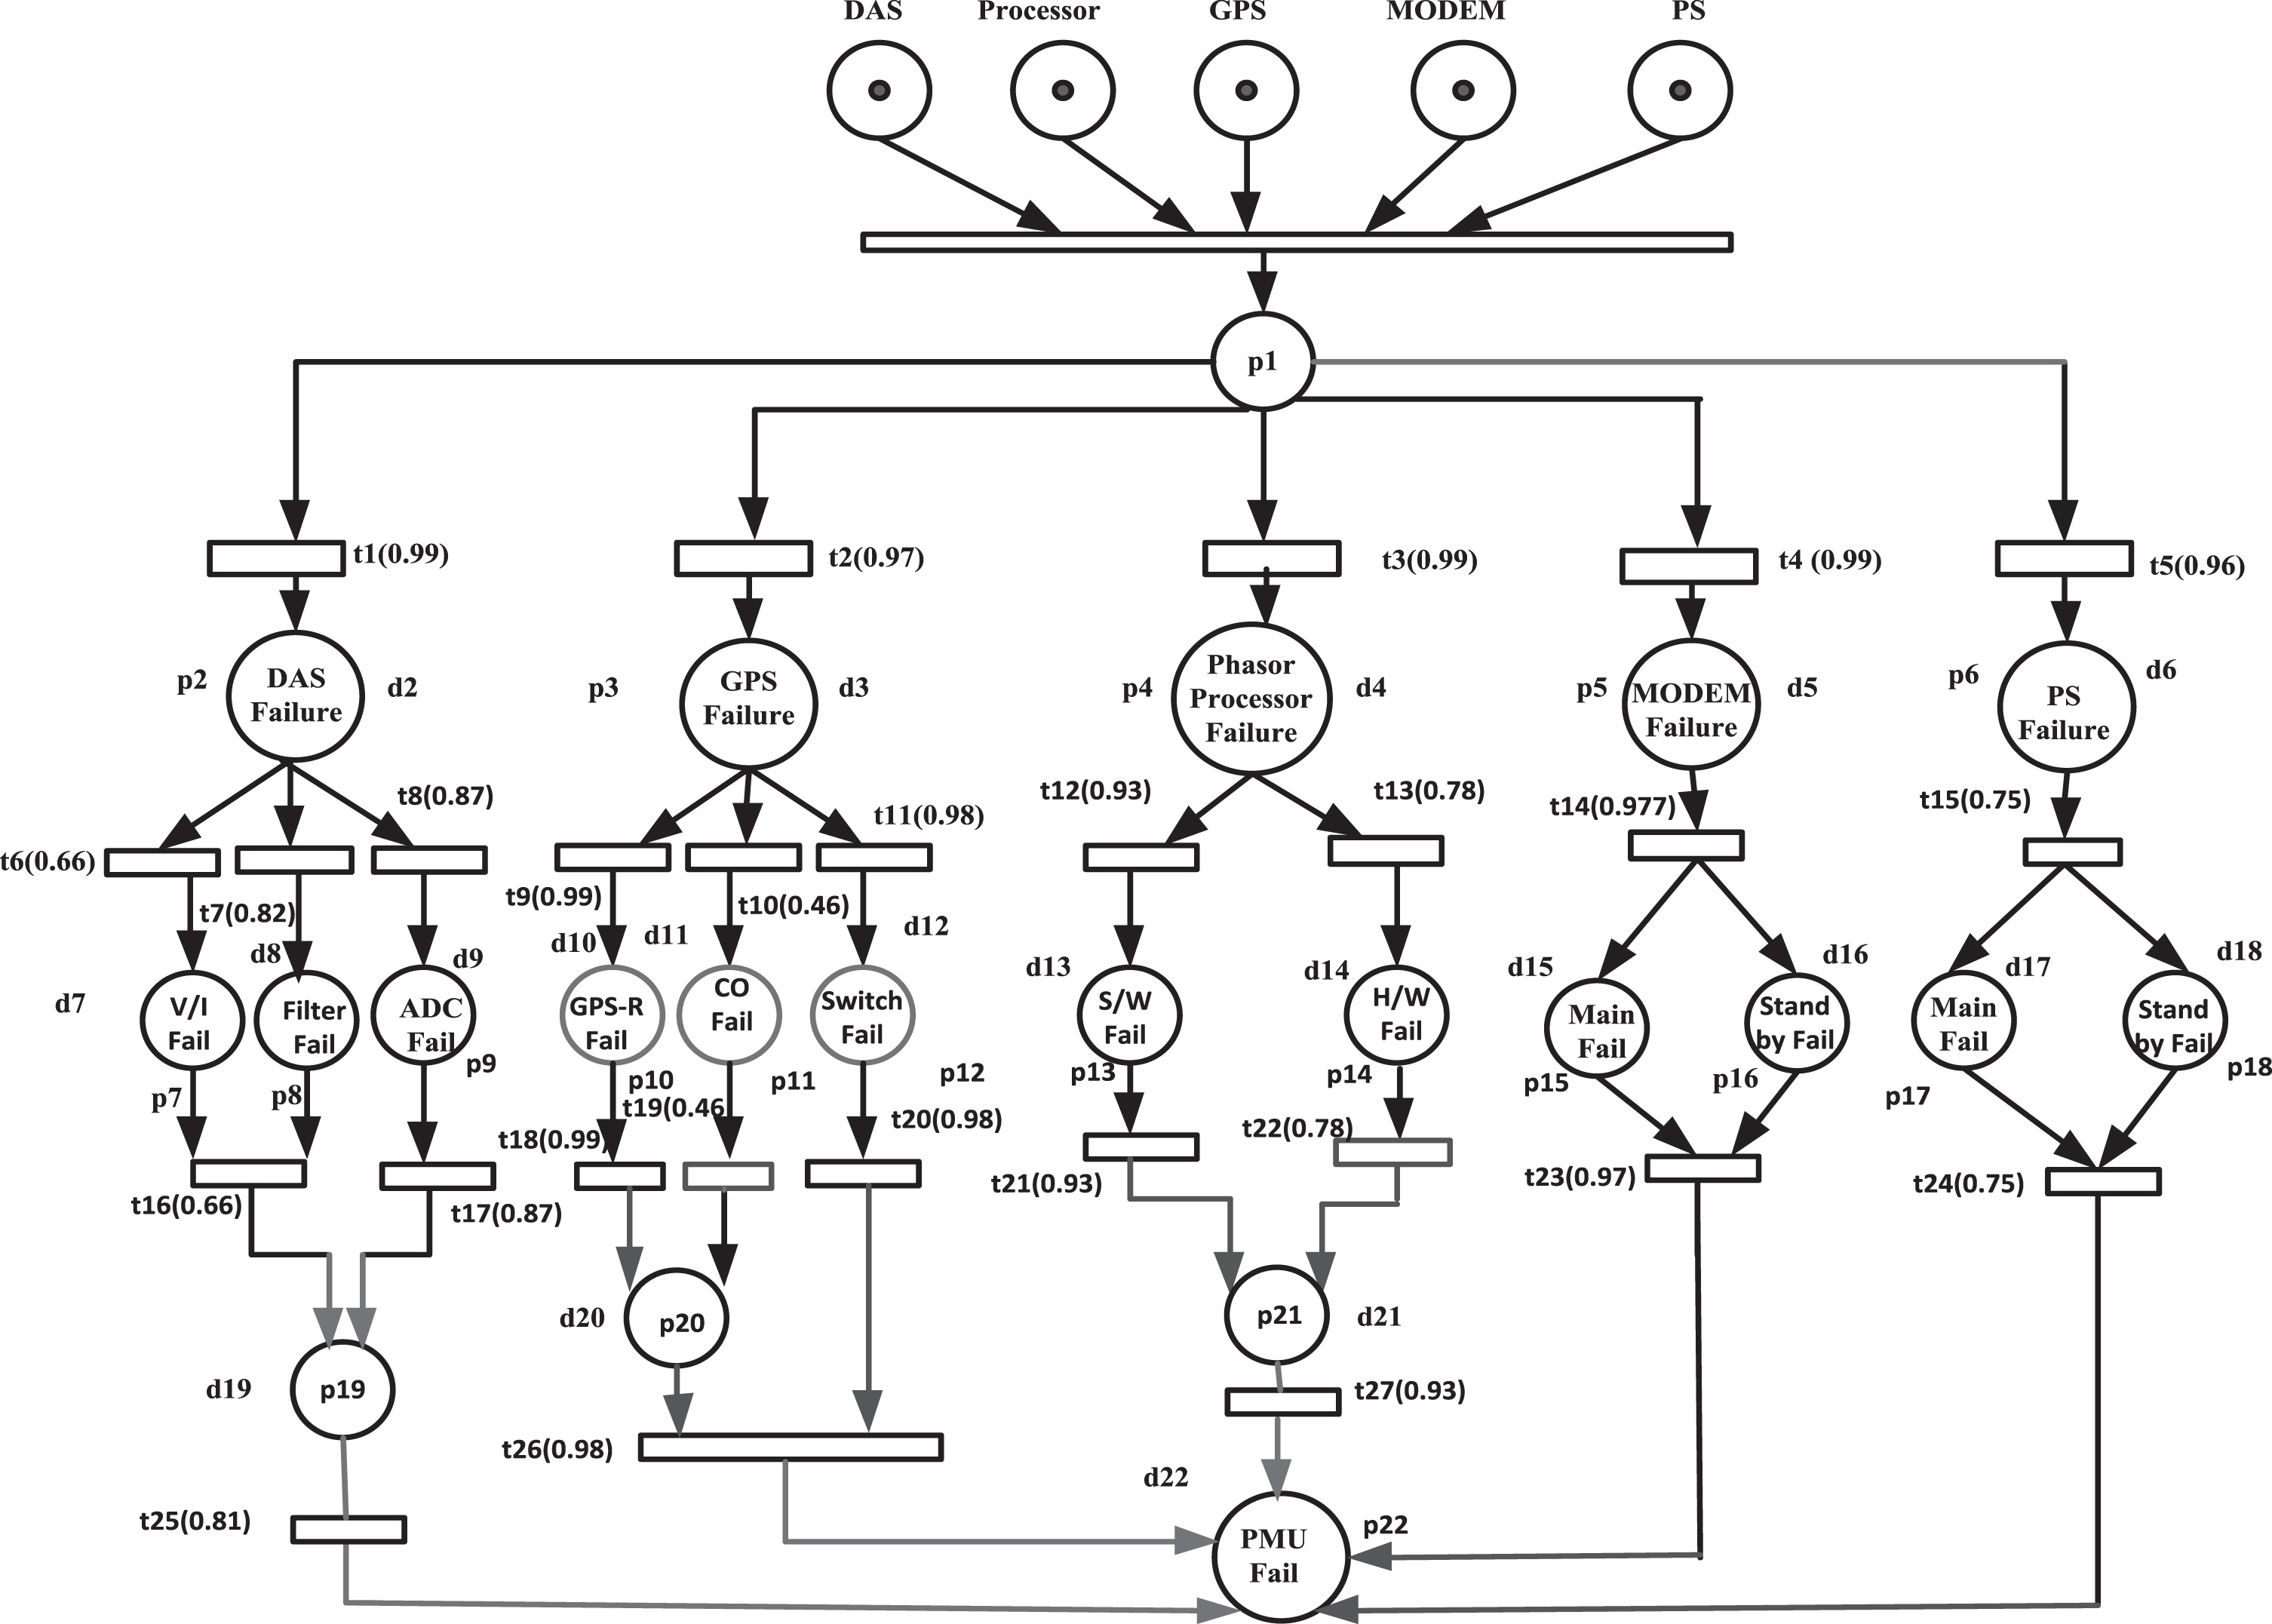
Marked fuzzy Petri Net of PMU.
Fuzzy Production Rules: IF d1 Then d2 (Cm = 0.99) IF d1 Then d3 (Cm = 0.97) IF d1 Then d4 (Cm = 0.99) IF d1 Then d5 (Cm = 0.99) IF d1 Then d6 (Cm = 0.96) IF d2 Then d7 (Cm = 0.66) IF d2 Then d8 (Cm = 0.82) IF d2 Then d9 (Cm = 0.87) IF d7 and d8 OR d9Then d19 (Cm = 0.87) IF d19 Then d22 (Cm = 0.81) IF d3 Then d10 (Cm = 0.99) IF d3 Then d11 (Cm = 0.98) IF d3 Then d12 (Cm = 0.98) IF d4 Then d13 (Cm = 0.93) IF d4 Then d14 (Cm = 0.78) IF d5 Then d15 and d16 (Cm = 0.97) IF d6 Then d17 and d18 (Cm = 0.75) IF d10 OR d11 and d12 Then d20 (Cm = 0.98) IF d13 OR d14 Then d21 (Cm = 0.93) IF d21 Then d22 (Cm = 0.93) IF d15 and d16 Then d22 (Cm = 0.97) IF d17 and d18 OR d9 Then d22 (Cm = 0.75)
The immediate Reachability set (IRS) and the successive Reachability set (RS) nodes for all places are evaluated based on the starting place (node). Table 3 presents the nodes involved in IRS and RS during progression of PMU failure information.
Immediate reachability set (IRS) and the successive reachability set (RS)
Based on the starting place p1whichis assumed with degree of truthiness as 0.85(given by knowledge base of expert). Here the threshold value β=0.25 (assumed). The IRS of starting place p1 is p2, p3, p4, p5 and p6. The successive node is explored which is non-terminating. The value of γ i (pi) is evaluated using fuzzy production rules. For p2 place, γ2 = 0.85×0.99 = 0.8415 is computed and similarly value of γ3 = 0.82, γ4 =0.84, γ5 =0.84, γ6 =0.81 are computed for p3, p4, p5 and p6. Place p20 is the terminating node Thus, terminating nodes, Q and the degree of truth of proposition, z are found out using eqn. (5) and (6) as below.
Thus, the degree of truth of proposition is 0.81 for PMU module. This also gives the reliability of PMU.
Using Tables 2 and 3, the sprouting tree is drawn as shown in Fig. 14.

Sprouting tree of PMU.
In order to verify the results of reliability obtained using sprouting algorithm, the reliability of PMU is also computed with Markov model using eqn. (8) [28]. Yang Wang et al. have computed the reliability of phasor measurement unit using hierarchical Markov modeling [29]:
Table 4 below shows the various reliability indices of PMU. It may be noted that reliability obtained from sprouting tree is 0.81 whereas using Markov model is found out to be 0.85388. It is observed that the availability of PMU by sprouting tree method and Markov model is nearly the same. However, the sprouting tree provides the information path from operating state to unavailability mode of PMU. This helps the designer to improve the design of PMU by pin pointing the sub-module weakness. The reliability of PMU increases if the repair rates of the PMU module are also considered, since the failure rate of system decreases.
Reliability indices of PMU using Markov model
The Fuzzy reasoning associated Petri net presents a graphical and mathematical method for risk modeling and reasoning. The possible failure causes are shown by places and firing of transitions by rules. Fuzzy logic algorithm processes the assessment of rules. The case study of PMUs sprouting tree using Fuzzy Petri net method is able to transform expert knowledge into rule base and has been able to trace the different modules failure rate modes. The hierarchal structure has made the calculations flexible by dividing the net into various sub nets. The input place is the second hierarchy indicating the symptoms of sub-module failures, which cannot be eliminated directly, but can be observed. Consider the diagnosis rules (p1 ⟶ p2 ⟶ p9 ... ... .. ⟶ p22), the failure of ADC (p9) causes Data Acquisition failure, resulting in PMU failure. The GPS receiver (p10) failure doesn’t cause failure of PMU. It enables the switch to standby mode. The failure of both GPS receiver, Functional switch or crystal oscillator (CO) causes PMU failure.
The failure of any one of the constituent (software or Hardware) in Phasor processor causes failure of PMU. MODEM causes failure to PMU, if both Main (P15) and standby (P16) modules fail. Similarly, failure of both main (P17) and standby (P18) of power supply cause failure of PMU.
Conclusion
The study presented in this paper gives insight to the design and system engineer about the flow of failure mode of PMU modules. It assesses the risk of non-availability of PMU at any time which is based on the failure rate of its components. The dynamics of failure is considered as an event in the Petri net and its uncertainty is dealt with Fuzzy logic reasoning. Sprouting tree, a logical structural path, is developed using fusion of Fuzzy reasoning and Petri net technology. The study is important for system designer of PMU and in smart grid implementation. The overall benefits of the methodology include: Visual tool in communicating and supporting decisions based on the analysis and to determine the adequacy of PMU design. Ability to model and deal with highly complex system. Ability to involve multiple experts. Improve handling of uncertainties and possibilities.
Footnotes
Appendix –I: Failure rate of PMU modules A –Main component;B –Standby component
| Parameters of Transducer (H1) | Value | Parameter of Anti-Alias Filter (H2) | Value | Parameters of ADC (H3) | Value |
| λ H1A | 0.4155 | λ H2A | 0.1923 | λ H3A | 0.1383 |
| λ H1B | 0.4155 | λ H2B | 0.1923 | λ H3B | 0.1383 |
| Parameters of | Value | Parameters of | Value | Parameters of | Value |
| Phasor Processor (H5) | MODEM (H6) | Power Supply(H7) | |||
| λ HW | 0.2368 | λ H6A | 0.228 | λ H7A | 0.2751 |
| λ SW | 0.0657 | λ H6B | 0.228 | λ H7B | 0.2751 |
| Parameter of | Value | Parameter of | Value | Parameter of | Value |
| Crystal Oscillator (H4) | GPS-Receiver (H4) | Functional Switch (H4) | |||
| λ CO | 0.0188 | λ GP-R | 0.7727 | qs (unsuccessful probability) | 0.0075 |
| λT (Transition Rate) | 273.75 |