
Abstract
As an advanced machine vision task, traffic sign recognition is of great significance to the safe driving of autonomous vehicles. Haze has seriously affected the performance of traffic sign recognition. This paper proposes a dehazing network, including multi-scale residual blocks, which significantly affects the recognition of traffic signs in hazy weather. First, we introduce the idea of residual learning, design the end-to-end multi-scale feature information fusion method. Secondly, the study used subjective visual effects and objective evaluation metrics such as Visibility Index (VI) and Realness Index (RI) based on the characteristics of the real-world environment to compare various traditional dehazing and deep learning dehazing method with good performance. Finally, this paper combines image dehazing and traffic sign recognition, using the algorithm of this paper to dehaze the traffic sign images under real-world hazy weather. The experiments show that the algorithm in this paper can improve the performance of traffic sign recognition in hazy weather and fulfil the requirements of real-time image processing. It also proves the effectiveness of the reformulated atmospheric scattering model for the dehazing of traffic sign images.
Keywords
Introduction
The rapid development of the world economy has brought environmental pollution and other problems. Mainly the hazy weather has caused a considerable impact on people’s lives. Many suspended particles in the hazy absorb and scatter light, resulting in reduced contrast, color distortion, and low recognizability of the images obtained by the camera, which brings significant challenges to traffic sign recognition. Autonomous vehicles receive road condition information through the camera. On the one hand, due to the characteristics of traffic signs, the traffic signs are often different from the surrounding environment in color; on the other hand, the outdoor image scene obtained by the camera has a wide range. There are too many sky areas, which are very different from indoor images. However, although there is much research on image dehazing, they synthesize hazy images indoors for testing. There are few unique methods for subsequent advanced vision tasks (such as target detection). Therefore, it is of great significance to design a dehazing method suitable for traffic sign recognition in hazy weather.
Traditional image dehazing methods are based on image enhancement and image restoration. The image enhancement method enhances image contrast, visibility, grey distribution, and other methods to improve the image’s visual effect. Among them, the dehazing algorithm based on the Retinex theory has been used in recent years. There are sound effects in image detail enhancement, color preservation, and recognition enhancement [1–4]. Jobson et al. [5, 6]improved the window scale and successively proposed image enhancement algorithms based on single-scale Retinex (SSR) and Multi-Scale Retinex (MSR) to help improve the dehazing effect. Yu et al. [7] studied an image enhancement algorithm based on a physical lighting model. The experimental results show that the algorithm increases the richness of the visible edges of the image and maintains the consistency and naturalness of the colors. The method of image restoration is to establish an image degradation model by considering interference factors such as hazy, noise, and air medium, and inversely deduce a clear image based on the model [8]. For example, Jason et al. [9] used the polarization information of light scattering and combined image processing technology to obtain clear images after dehazing. Liang et al. [10]considered that infrared radiation has a better ability to penetrate the hazy and proposed a polarization dehazing method based on visible light and infrared image fusion to improve the visibility of hazy images. He et al. [11] proposed the image dehazing method based on the Dark Channel Prior (DCP) theory. This method needs to process the transmittance through soft matting, but the dehazing efficiency is not high due to excessive calculation. However, due to the simplicity of the DCP principle and algorithm, many scholars improved the image dehazing algorithm based on the DCP. For example, Jackson et al. [12] combined DCP and Rayleigh scattering theory to improve the transmittance and atmospheric light estimation. Experiments have proved that the method has an excellent dehazing effect and has a certain degree of optimization in calculation speed. Sarkar et al. [13] applied DCP and guided filters to the empirical wavelet domain of hazy images for dehazing, the output of the algorithm. The overall visual quality of the image is high. Lu et al. [14], based on the principle of DCP, combined with the CPU architecture features and instruction types of the embedded processor DSP, to ensure the hazy penetration effect of thick hazy images, and increase the processing speed by 50 times; Yang et al. [15] also improved computational efficiency through the DCP. Zhu et al. [16] proposed a Color Attenuation Prior (CAP), which creates a linear model to model the depth of the hazy image scene, uses a supervised learning method to train parameters and an atmospheric model to dehaze. Berman et al. [17] proposed a new Non-Local Dehazing (NLD), which is based on the color of the hazy-free image to form tight clusters in the RGB space, and each color cluster in the clear image becomes the RGB space. The distance map and clear image can be restored at the same time through the algorithm.
With the development of artificial intelligence, deep learning has gradually become a key technology in image dehazing. Many scholars have improved the effect of image dehazing based on deep learning methods [18–22]. There is still room for improvement in many classic methods, such as Li et al. [23] proposed an AOD-Net dehazing model based on Convolutional Neural Network (CNN). The model does not need to estimate atmospheric light and transmittance separately but is implemented by the light-weight and high-efficiency CNN to realize end-to-end dehazing, and experiments have proved that the AOD-Net dehazing model has superior performance. Qian et al. [24] designed the FAOD-Net model based on AOD-Net, using separable depth convolution instead of standard convolution. This model can avoid the error estimation caused by the hazy image transmittance and atmospheric light value. Reduce network model training parameters and running time. Cai et al. [25] also designed an end-to-end training model DahazeNet based on the CNN architecture to estimate the transmittance of hazy images. They proposed a new type of non-linear activation called Bilateral Linear Unit (BReLU) Function to replace the commonly used ReLU or Sigmoid. Experiments show that DehazeNet dehazing is efficient and easy to use, and the dehazing effect is better than existing methods. Rick and Tim et al. [26, 27] can solve the linear inverse problem in image dehazing by learning the nearest neighbour operator in the iterative optimization algorithm. Yang et al. [28] designed an improved near-end DehazeNet based on this, combining the traditional dehazing method based on a priori theory and the advantages of deep learning and incorporating the prior knowledge related to hazy into the deep network. Experiments show that the method has reached the most advanced performance in dehazing a single image. In terms of deep learning, Ren et al. [29] proposed a Multi-Scale Convolutional Neural Network (MSCNN) for single image dehazing through training to learn the mapping between hazy images and their transmittance, and passed estimating the atmospheric transmittance to restore clear images, and experiments show that the method is effective in restoring synthetic and real hazy images.
Image dehazing belongs to low-level vision tasks and is usually considered a preprocessing step required to complete high-level vision tasks. At present, a small number of researchers combined with follow-up high-level vision tasks for research. For example, Wiesemann [30] studied the influence of hazy weather on traffic sign detection algorithms under different road conditions, using Koschmieder’s hazy model to semi-automatically generate depth maps for Simulate and analyze the hazy weather, thereby establishing a real traffic sign recognition environment. Yan et al. [31] proposed an effective method for the recognition of traffic speed limit signs in the hazy
This method uses HOG and SVM classifiers to extract features, detects marked areas, and has both processing time and robustness. The improvement is more in line with practical applications. It was inspired by the residual network, Cao et al. [32] designed a dehazing algorithm suitable for railway monitoring images and proved through experiments that the detection accuracy of the image after dehazing had been improved. Because of the current research status, few studies on the connection of images with high-level vision tasks after dehazing, and it is impossible to truly and effectively test the follow-up performance [23].
Therefore, this paper proposes an end-to-end dehazing network using reformulated atmospheric scattering model, including multi-scale residual blocks, which specifically considers the weight of atmospheric light value and transmittance, establishes an adaptive depth model whose parameters change with the input hazy image, and reconstructs the atmosphere. Thereby, the reconstruction error between the output dehazing image and the real clear image can be minimized, the contrast of the dehazing image can be improved, and the edge characteristics of traffic signs can be maintained, and the recognition accuracy of traffic signs under hazy weather can be enhanced.
Related work
This paper uses deep learning methods to recognize traffic signs in hazy weather, aiming to improve the accuracy of traffic sign recognition, thereby improving the safety of autonomous driving. The specific steps can be divided into two stages. Firstly, the traffic sign images in hazy weather are dehazed, and secondly, we identify the traffic sign on images after dehazing. The overall scheme studied in this paper is shown in Fig. 1.

The overall scheme of dehazing of traffic sign images.
In terms of image dehazing, this paper is based on the more end-to-end physical model proposed by Li et al. [23], combined with the high-level visual task of subsequent traffic sign recognition, designed a light-weight neural network by introducing the idea of the residual network that can effectively improve the contrast of the dehazing image and maintain the edge characteristics of the image. We are aiming to obtain a dehazing image that is more conducive to traffic sign recognition.
Atmospheric scattering model theory is a classic description of the generation of hazy images [33, 34], and the specific expression is shown in Eq. (1)
Where I (x) is the input hazy image, J (x) is the clear image, A is the global atmospheric light value, t (x) is the transmittance, and the value range is 0 1.
Due to the use of prior knowledge to estimate the global atmospheric light value A and transmittance t (x), and then through the process of Eq. (2) to restore a clear image, direct end-to-end dehazing cannot be achieved, which will cause errors to accumulate or even increase. To merge the atmospheric light values A and transmittance t (x) into K (x), we established the following Eqs. (3) and (4):
The size of the convolution kernel will affect the model calculation ability and the feature extraction. Multi-scale convolution can improve the robustness of capturing image depth information. Ren et al. [29] connected the coarse-scale network with the intermediate layer of the fine-scale network, and merged filters of different sizes to extract multi-scale features. The DenseNet proposed by Huang et al. [35] realized the fusion of low-level features and high-level features. It also significantly reduces the number of parameters. The most basic structure in DenseNet is Dense Block. Its function is to merge the channels of the feature map through the connection layer so that the feature maps of different levels are merged. The connection method is shown in Fig. 2. Each x represents a hierarchical feature map.

Schematic diagram of a Dense Block connection.
This paper uses multiple convolution kernels with sizes of 1×1, 3×3, 5×5, and 7×7 to directly extract features from traffic sign hazy images. The calculation Eq. (5) is as follows:
The residual in mathematical statistics refers to the difference between the actual observed value and the fitted value. In a correct regression model, the residual is the predicted value of the error. For a neural network, as the number of network layers increases, the training difficulty increases, and the effect on the training set will become worse, this is called a degradation problem, and the residual network can be used to optimize this problem. He et al. [36] proposed a deep residual network to solve the problem of performance degradation as the network depth increases. Since then, the residual network has been applied to various fields of image processing and has achieved remarkable results [37–39]. Veit et al. [40] regarded the residual network as an integrated model assembled by a series of path sets. They proved that the path after the residual network was expanded has a certain degree of independence and redundancy. Based on this point of view, this paper conducts residual learning in the convolutional layer, retains the feature information of the previous layer, and uses jump layer connection to merge different levels of features. This can increase the diversity of features, optimize gradient descent, and speed up model training.
This paper introduces the idea of residual learning in the convolutional layer to form residual modules. The structure of each residual module is shown in Fig. 3, x represents the input, and F(x) represents that the residual module passes through the first layer linearly. The output after the change and activation is called the residual term. F(x)+x represents the output before the activation function of the second convolutional layer.
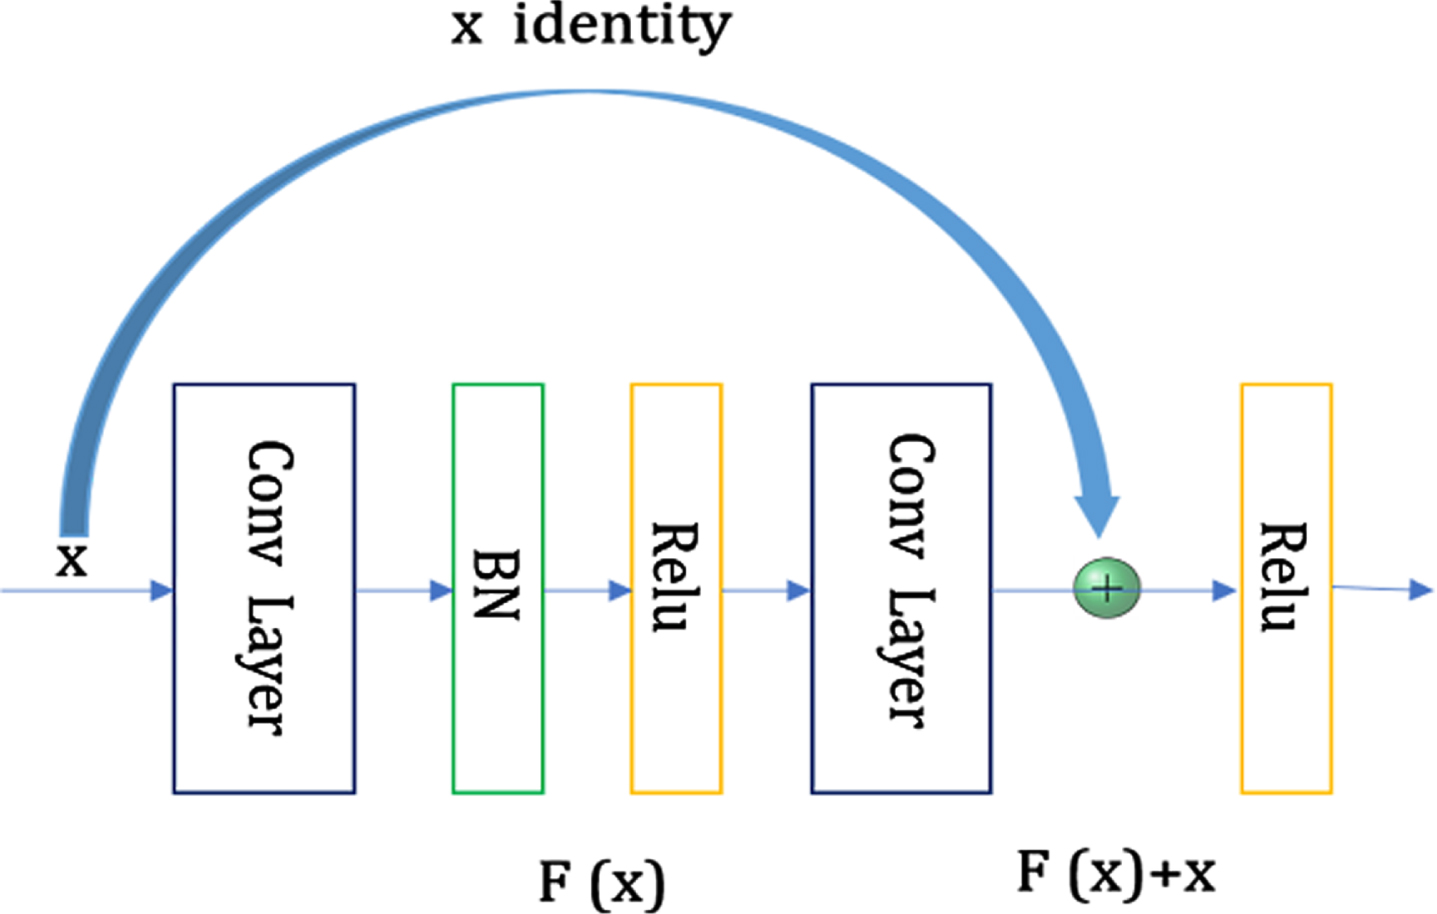
The residual module structure of this paper.
The BN layer in the residual module is used to normalize the input data so that the processed data can be more fully learned by the next layer of the neural network, which solves the gradient dispersion problem to a certain extent.
Network design
The AOD-Net proposed by Li et al. [23] consists of two modules, one is the K (x) estimation module, and the other is the clear image generation module. The input hazy image I (x) is estimated K (x) and then used K (x) as the input adaptive parameter to restore the clear image J (x). In this section, by introducing the idea of residual learning, a new K (x) estimation module is designed for traffic sign recognition after dehazing, called Res-K(x). In the Res-K(x) estimation module, 7 convolutional layers are used, conv1 conv7 respectively, and convolution kernels of different sizes are used to extract image features; 3 connection layers, concat1 concat3, use to concatenate the output features of the middle convolutional layer; the total includes three residual modules, res-block1 res-block3, and the specific structure is shown in Fig. 4.
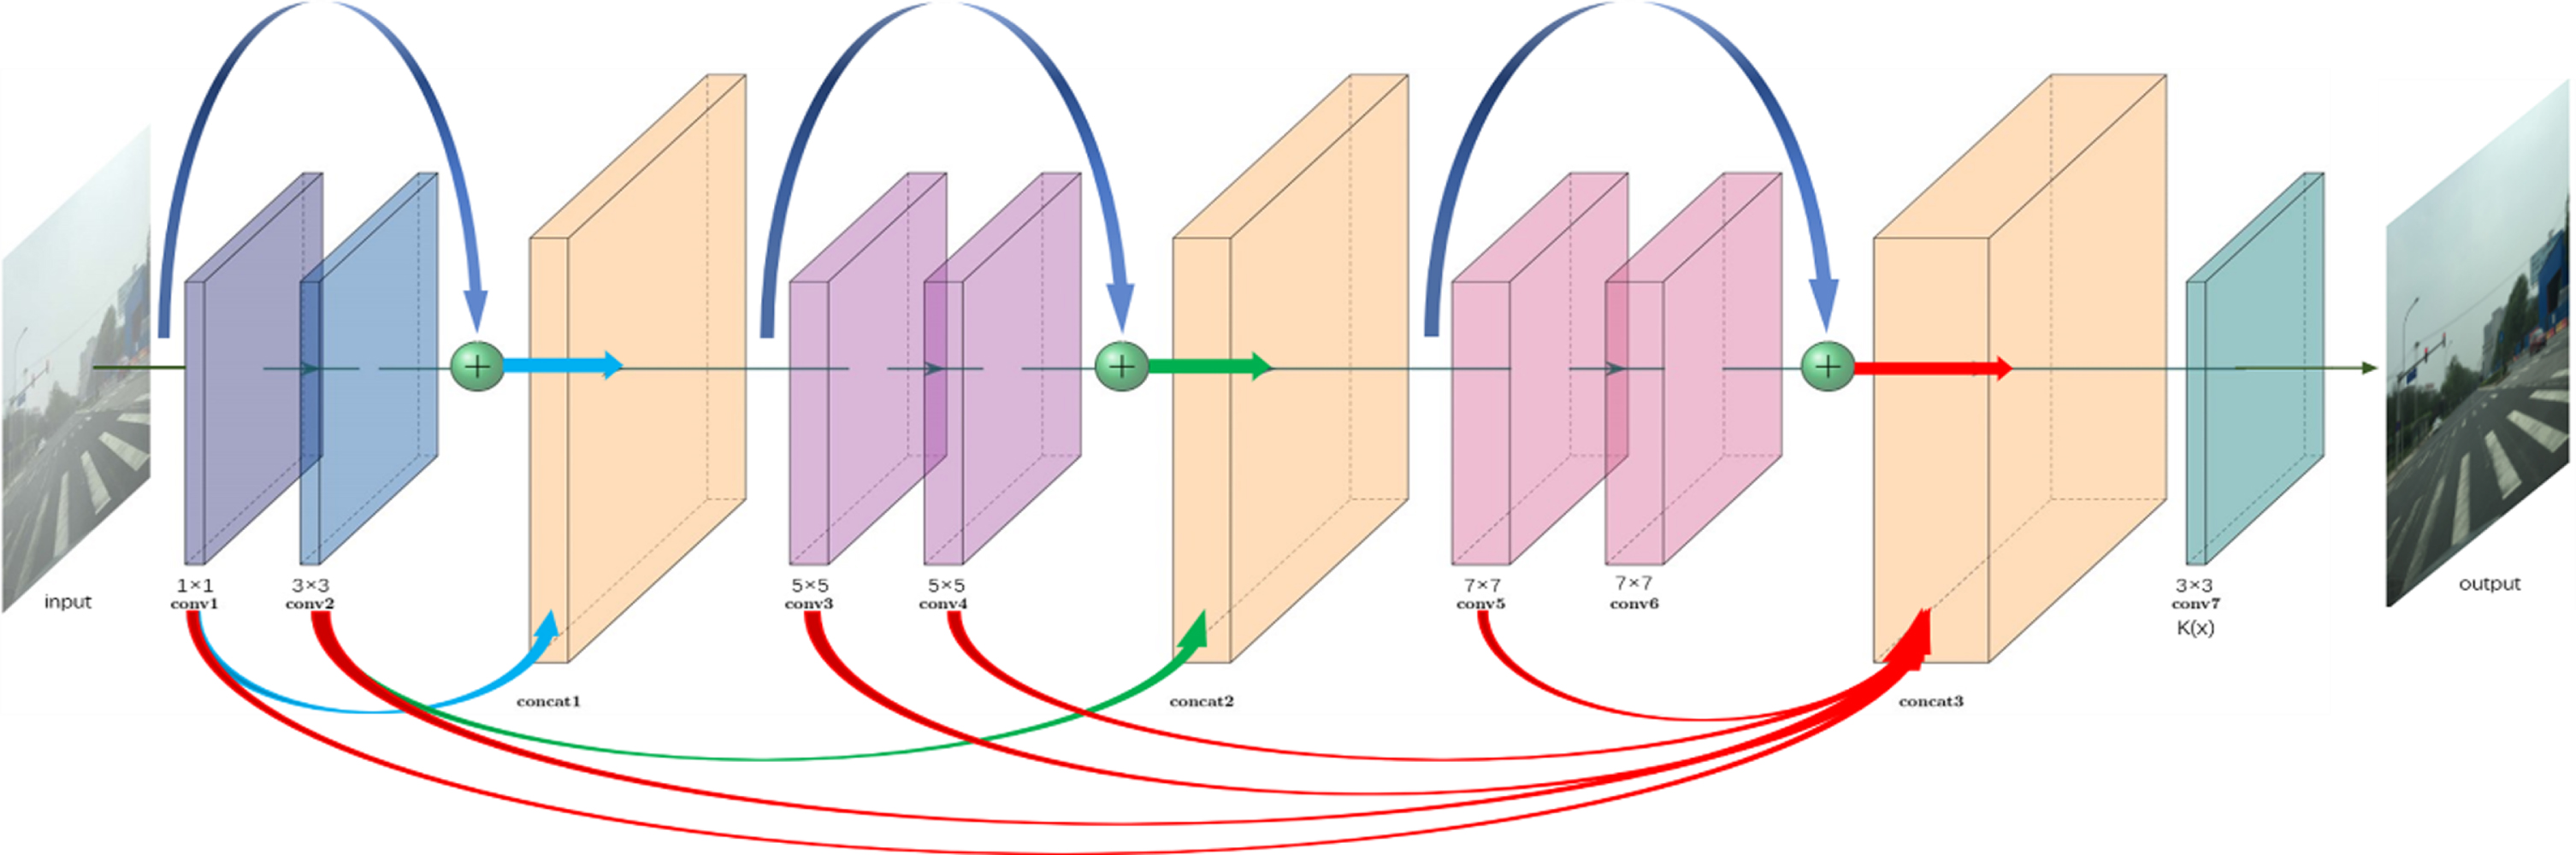
Res-K(x) estimation module structure.
In the Res-K(x) estimation module, the “concat1” layer connects the output of the “conv1” layer, and the “res-block1” in series and the “concat2” layer connects the output of the “conv2” layer, and the “res-block2” layer, “Concat3” layer connects the output features from “conv1”, “conv2”, “conv3”, “conv4”, “conv5” and “res-block3”. In summary, the Res-K(x) estimation module uses multi-scale convolution to extract features, uses the concat layer to realize the smooth conversion of low-level features to high-level features, and compensates for the information loss in the convolution process through the residual module. Besides, each convolutional layer in the “res-block1” and “conv7” layer uses only three filters, each convolutional layer in “res-block2” uses six filters, and each convolutional layer in “res-block3” uses nine filters. Our proposed network still has a light-weight neural network structure.
This paper needs to collect large amounts of data to train the designed network. In the real environment, it is affected by many factors. It is difficult for us to obtain many different levels of hazy images and their corresponding clear images, and the hazy images containing traffic signs are more challenging to obtain. First of all, the background environment of the training set should be positioned outdoors, and then, more specifically, it should be positioned on the outdoor highway. Therefore, we choose the outdoor trainset OTS of RESIDE-beta [41]. So far, this dataset contains 4477 real outdoor images of real-time weather. To adapt to the haze concentration under different weather, the corresponding scattering rate of each image β= (0.04, 0.06, 0.08, 0.1, 0.12, 0.14, 0.16, 0.2) total 7 categories, atmospheric light value A= (0.8, 0.85, 0.9, 0.95, 1) total 5 categories, a total of 156695 synthetic hazy images, and then from among them, 2377 clear images with the background environment as traffic road place were selected, and a total of 83195 synthetic hazy images were selected. The number of samples used for training was 79035, and the number of samples used for verification was 4160. According to the method proposed in [26], we use pre-trained projection operators to preprocess the dataset to solve linear inverse problems such as noise and improve image quality.
This paper uses the model designed by Pytorch 1.5.1 + cu101 training. We initialize the weights with Gaussian random variables with a mean value of 0 and a variance of 2/n, select ReLU neurons as the activation function, set the momentum parameter to 0.9, and set the weight attenuation parameter to 0.0001, the learning rate is set to 0.0001, and the specific parameters are shown in Table 1.
Training parameters
Training parameters
Figure 5 compares the change of the loss function of this model and AOD-Net with the number of iterations. To facilitate comparison and observation, we fit the data and use dark colors to represent the fitted curve. It can be seen from Fig. 5 that our model converges faster. This is because we are based on the Adam optimization algorithm, inspired by the ReZero proposed by Thomas [42], we initialize any layer in the network as an identity map, and add an additional learning parameter to each layer so that the network has faster convergence speed.
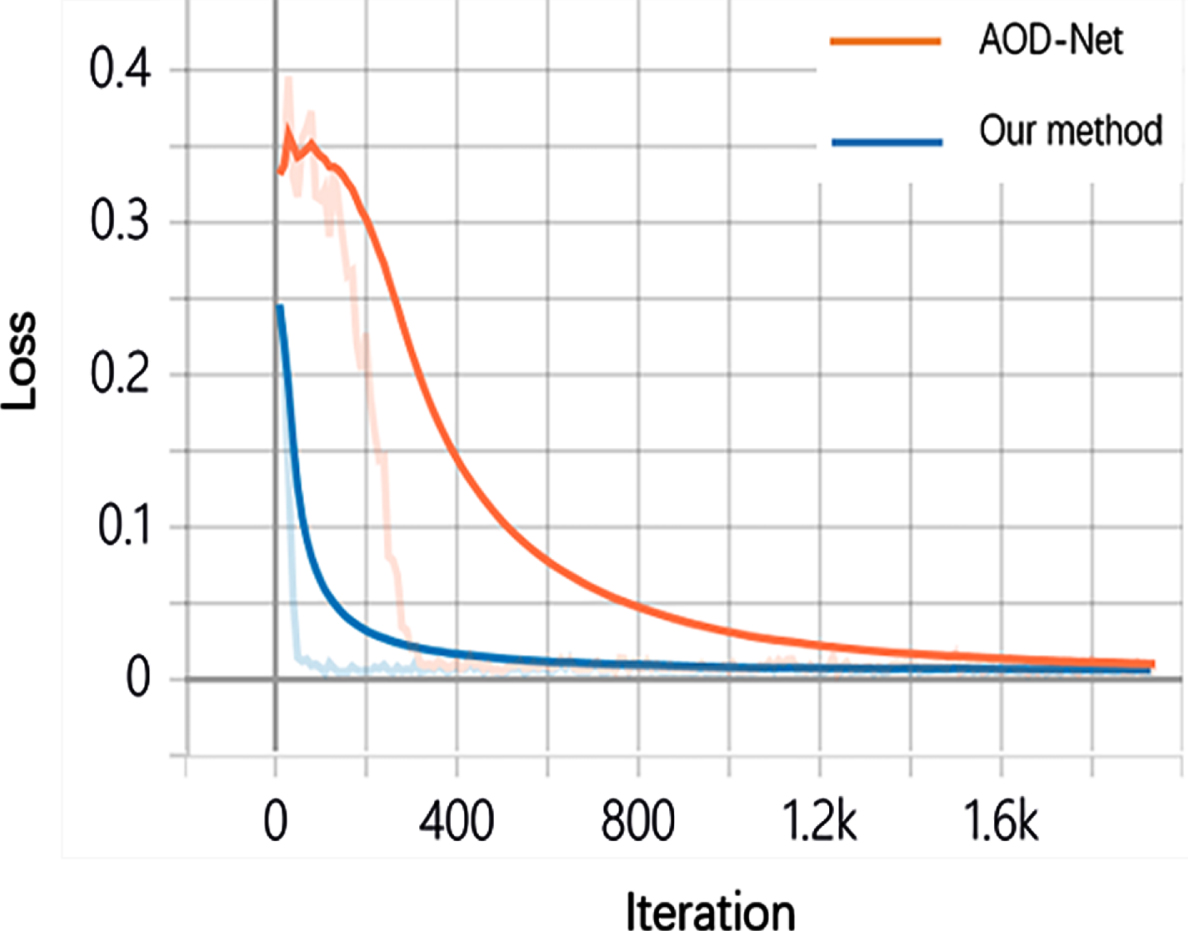
Our method is compared with the loss function curve of AOD-Net.
This section proves that our method has advantages in terms of visual effects and evaluation metrics. The images of the real-world dataset were dehazed, and the evaluation metrics (MSE, SSIM, PSNR, VI and RI) are analyzed and compared with the 8 kinds of existing methods.
Subjective visual effect
The high-level visual task studied in this paper is traffic sign recognition. Whether the traffic signs are clear or not is a subjective judgment. Therefore, we can first compare the visual effects of traffic sign images before and after dehazing to make a preliminary evaluation of the proposed method. In the real-world hazy image, the effect of using our method to dehaze is shown in Fig. 6. The yellow box marks the location of the traffic signs.

Subjective visual effects of traffic signs after dehazing using our method.
It can be seen from the figure that after dehazing by the algorithm in this paper, the traffic signs in the image are clearer than before dehazing, the edge and contour information of the traffic signs are highlighted. We can easily capture the traffic signs through the human eye. However, the reliability of this subjective judgment is low, and it needs to be further detected by the YOLOv5 method.
Because it is difficult to evaluate the effect of image dehazing by personal subjective judgment, researchers mostly choose to use Structural Similarity (SSIM) and Peak Signal-to-Noise Ratio (PSNR) [42] to analyze the experimental results quantitatively. However, these evaluation metrics are usually used for indoor images with depth of field, there is a certain gap between real-world hazy images and indoor images, and a dehazing method that fits indoor images well might not necessarily fit real-world images well. Because it is difficult to use a standard to measure the dehazing effect, Zhao et al. [43] proposed to evaluate the dehazing method from two aspects of visibility and authenticity, and established two FR-IQA standards VI and RI, and a large number of experiments have proved the superiority of VI and RI over other evaluation metrics, especially suitable for real-world images. Therefore, this section selects MSE, PSNR, SSIM, VI and RI as objective evaluation metrics to evaluate the dehazing method we proposed.
We compared the datasets provided by the literature [43–46]. Most of the datasets are artificially synthesized. The synthetic hazy images are different from the real-world hazy images. Therefore, we choose the BeDDE provided in the literature [43] as the dataset to calculate the dehazing effect evaluation metrics MSE, PSNR, SSIM, VI and RI. The BeDDE dataset collects all real-hazy images that fulfil the experimental requirements of this paper. Among them, three levels of hazy images of light hazy, medium hazy, and thick hazy are selected to dehaze, respectively, as shown in Fig. 7. From Fig. 7, it can be seen that the distance between the buildings and other scenes in the medium hazy figure (b) is close, will lead to a subjective judgment that the hazy level is lower than the picture (a), which more fully illustrates the importance of objective metrics to evaluate the dehazing effect. We choose 8 dehazing methods with superior performance to compare with our method, namely CAP [16], DCP [13], NLD [17], Dehaze-Net [25], MSCNN [29], FFA-Net [47], GCA-Net [48] and AOD-Net [23]. The first three are traditional dehazing methods, and the last five are deep learning dehazing methods. The dehazing results are shown in Figs. 8, and 10 respectively, and the specific parameter values of MSE, PSNR, SSIM, VI and RI are shown in Tables 2, 4. The red in the table indicates the three with the best evaluation metrics, and the blue indicates the three with the worst evaluation metrics.
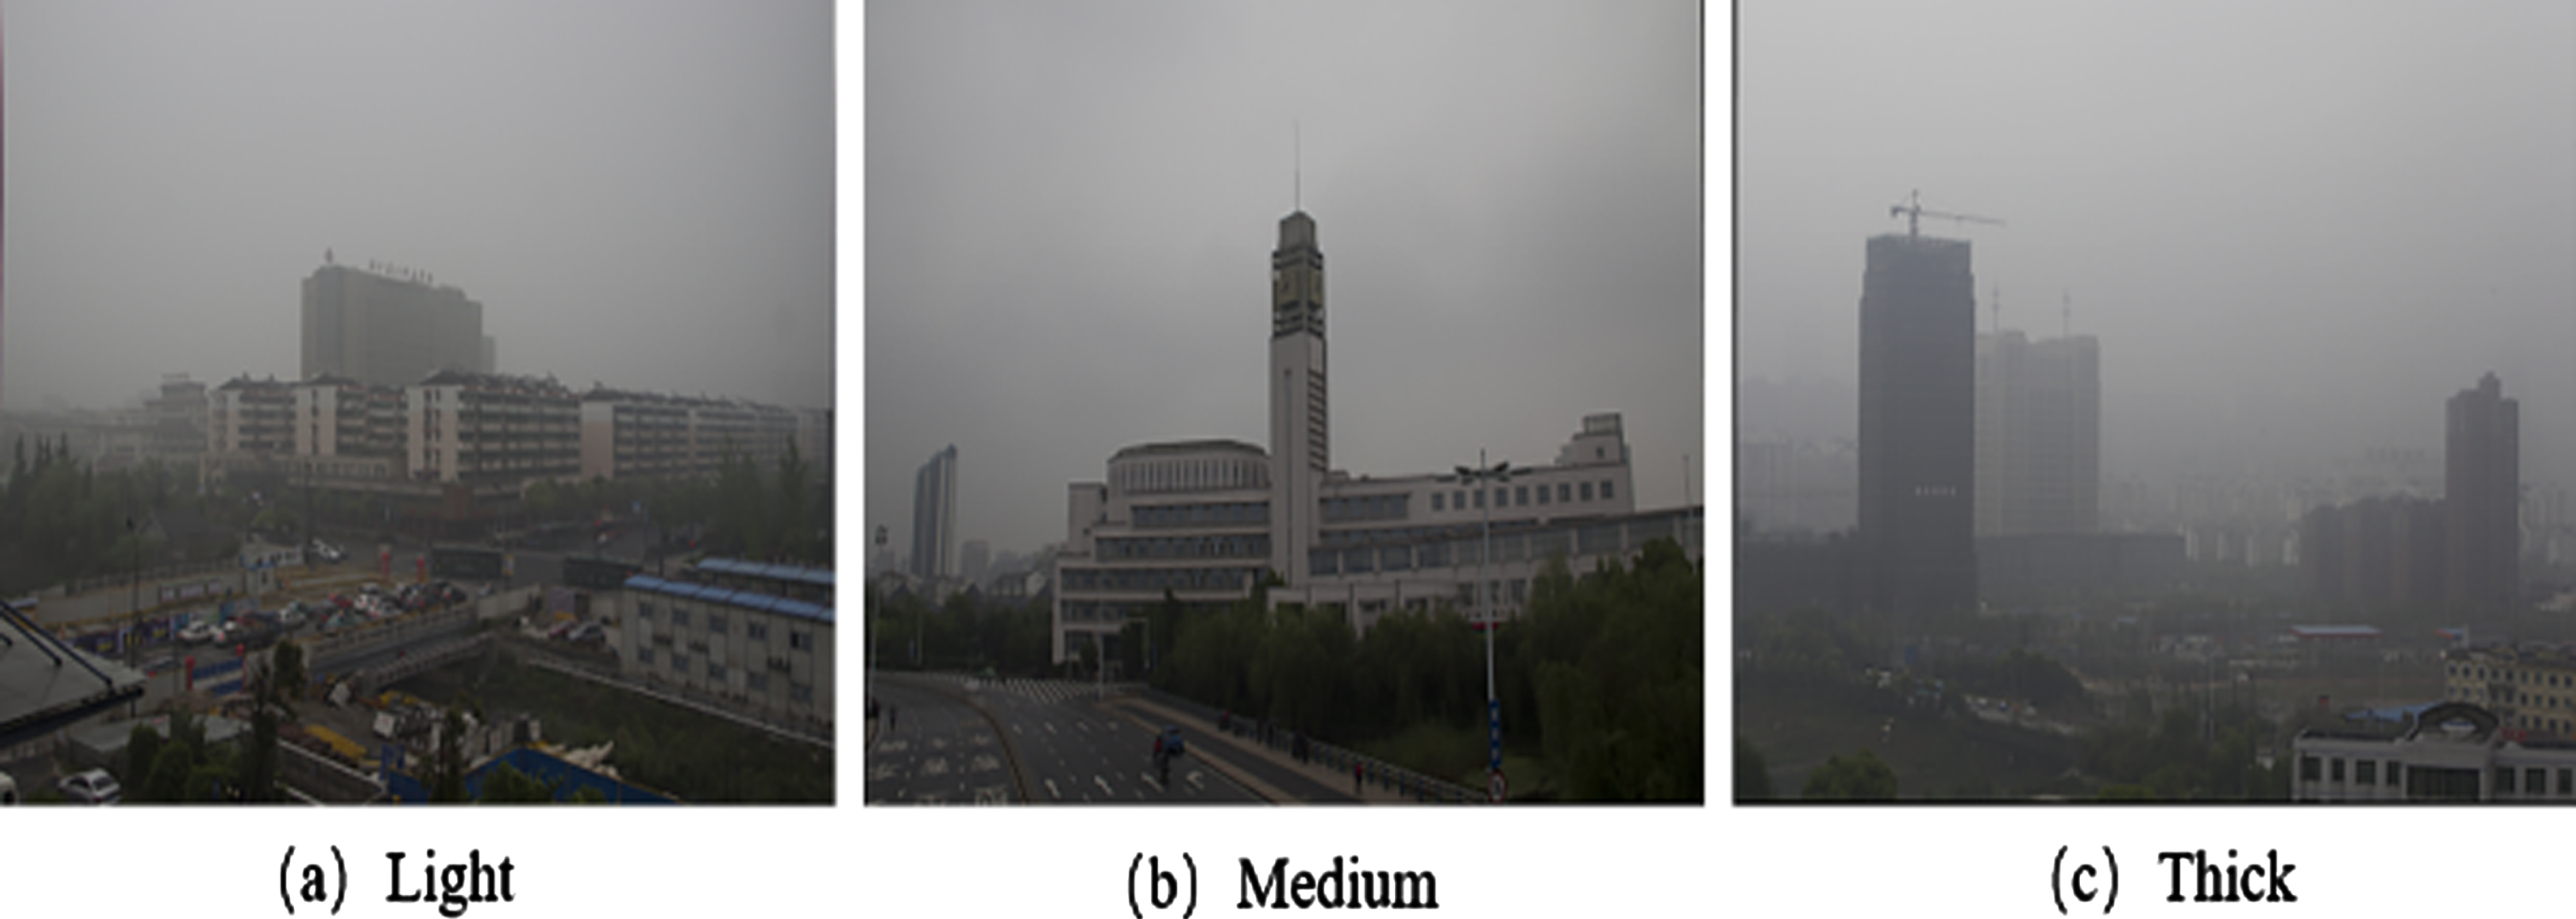
Light hazy, medium hazy and thick hazy effect display in the BeDDE dataset.

Results of 8 different dehazing methods in light hazy scenes.

Results of 8 different dehazing methods in medium hazy scenes.

Results of 8 different dehazing methods in thick hazy scenes.
MSE, PSNR, SSIM, VI and RI values of dehazing images in light hazy scenes
MSE, PSNR, SSIM, VI and RI values of dehazing images in medium hazy scenes
MSE, PSNR, SSIM, VI and RI values of dehazing images in thick hazy scenes
The above experimental results verify the effectiveness and superiority of our method in terms of subjective visual effects and objective evaluation metrics of MSE, PSNR, SSIM, VI and RI. Traffic sign recognition in hazy weather is an essential part of advanced driver assistance systems and autonomous driving systems, especially in autonomous driving scenarios requiring verification of operational efficiency. We test the various dehazing algorithms mentioned above on a real-world hazy dataset with an image size of 512×512, ignoring the time of model loading, and the average running time of each algorithm is shown in Table 5. As can be seen from the table, the overall running time of the dehazing algorithm based on deep learning is faster than that of the traditional dehazing algorithm. In contrast, the running time of the dehazing algorithm on the Matlab platform is slower than that on the Pytorch platform. The algorithm in this paper has an extremely fast running speed. The operating efficiency is second only to AOD-Net, which can fulfil the needs of real-time detection.
The average running time of each dehazing algorithm in the real-world hazy dataset
The average running time of each dehazing algorithm in the real-world hazy dataset
At present, there are few types of research on linking image dehazing with high-level vision tasks. However, in the hazy weather, the contrast of the images obtained by the camera is reduced, the color is distorted, and the recognizability is low, which seriously affects the recognition of traffic signs. The dehazing model proposed in this paper can effectively remove the haze in traffic sign images, improve traffic sign recognition accuracy, and verify the superiority of this model.
We use YOLOv5 as the traffic sign recognition algorithm in this paper, because this algorithm is a classic target detection algorithm with fast detection speed and high accuracy. Researchers well know it, so it is suitable for detecting this effect algorithm. In this paper, the CCTSDB [49] was used to train the model and choose 600 pieces based on Koschmieder to add haze as the synthetic hazy testing dataset for this experiment. However, the traffic sign recognition was oriented to the application scenarios of automatic driving, and there was a difference between the synthetic haze and the real world. But there is no public dataset of hazy traffic signs at present, so we collected 100 images of hazy traffic signs in the real world as a testing dataset. Compared with 8 kinds of state-of-the-art dehazing methods, the traffic sign recognition effect after dehazing on synthetic testing datasets and real-world testing datasets, using Recall, Precision and mAP as evaluation indicators.
Figure 11 shows the synthetic hazy images and real-world hazy images used in the test. (a) is the synthetic image of light hazy, medium hazy and thick hazy in the same scene; (b) is the three hazy images of different scenes in the real world, and three images with significant differences are selected as far as possible. Figure 12 shows the recognition results of the synthetic hazy testing dataset, and the specific evaluation metrics values are shown in Table 6. Figure 13(A), (B), (C) respectively show the recognition results of the three graphs in Fig. 11(b), and the specific evaluation metrics values are shown in Table 7.

The synthetic hazy images and real-world hazy images used in the test.

The recognition results of the synthetic hazy testing dataset.
Evaluation metrics of traffic sign recognition results of synthetic hazy testing dataset

The recognition results of the real-world hazy testing dataset.
Evaluation metrics of traffic sign recognition results of real-world hazy testing dataset
In Tables 6 7, the red in the table indicates the three with the best evaluation metrics, and the blue shows the three with the worst evaluation metrics. We compared and analyzed the objective evaluation metrics in Tables 2 4 with the traffic sign recognition results in Tables 6 7. From Tables 2 4, it can be seen that the MSE, SSIM and PSNR values of CAP and NLD are lower in the real-world BEDDE dataset, while the MSE, SSIM and PSNR values of FFA-Net and our method are higher. However, as shown in Table 6, in the traffic sign recognition results on the synthetic hazy dataset, CAP and NLD have better recognition effect than FFA-Net and our Method. But looking at the data in Table 7, the traffic sign recognition results of CAP and NLD are poor in the real-world dataset, which indicates that the synthetic hazy image is different from the real-world image, and evaluation metrics such as MSE, SSIM and PSNR cannot be relied on alone. Therefore, we calculated the values of VI and RI. In summary, the dehazing method with high VI value has a better result in traffic sign recognition in the synthetic hazy dataset, while the method with high RI value has a better result in the real-world hazy dataset.
Since the dehazing method in this paper is oriented to the real-world hazy scene of autonomous driving, the traffic sign recognition results in Table 7 are mainly analyzed. The recognition ability of traffic signs dehazing with traditional methods such as CAP, DCP and NLD is relatively low. From Fig. 15, we can observe that DCP, DCP and NLD suffer from severe color distortions and artifacts in the sky scene because of their underlying prior assumptions, this leads to reduced recognition of traffic signs. In contrast, FFA-Net and GCA-Net recover images with excessive brightness, FFA-Net gets higher values of PSNR and SSIM in the BEDDE, but the dehazing images still have obvious color distortion, and the processing power of GCA-Net at high-frequency detail information performance such as textures, edges and the blue sky is always unsatisfactory. The results from AOD-Net are dim and left with several hazy residuals. AOD-Net cannot remove the hazy completely and tends to output low-brightness images because of AOD-Net is a light-weight CNN and may not be able to extract more valid information. The methods of Dehaze-Net and MSCNN rely on the CNN model to estimate atmospheric light and transmission maps for dehazing, but there are hazy residuals, and the reason is inaccurate transmission map leads to more hazy residuals in dehazing results.
In our method, multi-scale convolution is used to extract features, and the residual module is used to compensate for information loss in the convolution process. Experimental results show that our method can maintain the edge features of traffic signs, solve the color distortion and improve the contrast of the image. Moreover, the single image of the light-weight network designed in this paper only takes 54 ms to dehaze. It can meet real-time requirements. Therefore, compared with other methods, our dehaze method is more suitable for the image preprocessing of traffic sign recognition task in hazy weather to improve the safety of the driving assistance system and autonomous driving system.
In this paper, by introducing the idea of residual learning, a dehazing network containing multi-scale residual modules is proposed. The multi-scale convolution is used to extract features, and the information loss in the convolution process is compensated by the residual module. A special end-to-end multi-scale feature information fusion method is constructed. Experiments proved that our method could better maintain the edge characteristics of traffic signs after dehazing, solve color distortion, and improve the image’s contrast. Also, it is combined with the real-world application scene of traffic sign recognition. MSE, PSNR, SSIM, VI and RI were used as objective evaluation metrics to conduct the experiment on the BEDDE of real-world hazy images, and to compare it with 8 State-of-the-art dehazing methods, so as to verify the effectiveness of our method. More importantly, we dehaze the traffic sign images based on the synthetic hazy testing dataset and real-world hazy testing dataset, apply YOLOv5 as the detection tool, select Recall, Precision, and mAP as evaluation metrics compare with the recognition effect of 8 state-of-the-art dehazing methods. Because of the characteristics of high real-time requirements for traffic sign recognition, while testing the recognition performance of traffic signs in hazy weather, it is compared with the running time of the existing dehazing method, which proves the superiority of our method.
Discussion
We proposed a light-weight dehazing network with multi-scale residual blocks, which can improve traffic sign recognition in real-world hazy weather. To demonstrate the superiority of our method, we compared and analyzed the MSE, SSIM and PSNR of 8 kinds of state-of-the-art dehazing methods and our method. But these evaluation metrics are designed to evaluate general image distortions such as noise and blur, and however, regarding dehazing evaluation, their effectiveness was not verified. Therefore, VI and RI were also used in this paper to evaluate the dehazing images. Meanwhile, our dehazing method is specifically used for traffic sign recognition, so we believe that the most direct evaluation metric is the result of traffic sign recognition.
We first test on the synthetic hazy traffic sign datasets. We found that the effect of the traditional dehazing method was better than deep learning dehazing method in traffic sign recognition. However, this is completely different from the MSE, PSNR, SSIM, VI and RI values calculated in the BEDDE dataset, and evaluation metrics show that deep learning methods are better than traditional dehazing methods. We speculate that the principles of synthetic hazy and traditional dehazing methods are similar, which results in the traditional dehazing methods performing well on the synthetic hazy traffic sign dataset. There is no real-world hazy traffic sign public dataset at present. Therefore, we collected 100 real-world traffic signs hazy images as a testing dataset, and the comparative experiment of traffic sign recognition is carried out again. The results prove that our method is superior to the other 8 kinds of state-of-the-art dehazing methods in the recognition results of real-world traffic sign hazy images. But it still needs further to improve the dehazing ability of the thick hazy images and improve the accuracy of traffic sign recognition if it is to be truly applied in the autonomous driving scene.
Footnotes
Acknowledgments
Our deepest gratitude goes to the anonymous thoughtful suggestions that have helped improve this paper substantially.